
Why is This Agency on the Watch List?
First announced in the Comptroller’s Preliminary Budget Presentation, the Agency Watch List spotlights City agencies – the Department of Correction (DOC), Department of Education (DOE), and homeless services – that raise the most budgetary concerns due to rapidly increased spending and insufficient measurable results.
Despite extraordinary increases in spending for homelessness prevention and permanent housing, New York City’s homeless population in shelter has remained stubbornly high, resulting in rising costs for shelter as well as the City’s use of less than ideal models such as commercial hotels to meet the legal mandate to provide shelter. New York City’s homeless services expenditures cross five agencies that share responsibilities for supporting, sheltering and permanently housing every eligible person or family that seeks assistance, including the Department of Homeless Services (DHS) as well as the Departments of Social Services, Youth and Community Development, Health and Mental Hygiene, and Veterans Services. Accordingly, Comptroller Stringer has included multi-agency spending on homeless services on his Agency Watch List for FY 2019.
Recent Developments
- Following termination of the City’s Advantage program in 2010, the City lacked a program to help individuals and families leaving shelter to pay for housing placements until the creation of the LINC program in 2014. The City has since created several programs intended to assist particular subsets of the shelter population find and pay for permanent housing.
- With the continued rise of the homeless population in shelter, the Administration undertook a 90-day review of homeless services, culminating in the announcement in February 2017 of several new steps under the rubric of “Turning the Tide.” Actions included providing additional funding for anti-eviction legal services; plans to open 90 new community-based shelters and reduce reliance on so-called cluster sites and commercial hotels; improving shelter conditions; supporting the transition from shelter to permanent housing; and addressing street homelessness.
- The Office of the Comptroller has published several audits of the shelter system, covering topics including shelter conditions, provision of childcare in shelter, and school attendance by children in shelter.
Budget and Spending
- Between FY 2014 and the current fiscal year, spending on homelessness has increased by 149 percent, rising to $2.9 billion.
- Shelter costs have nearly doubled to over $1.9 billion since FY 2014. The City has added $466 million in spending for shelter in 2018 since the budget was adopted last June.
- Spending on programs to prevent homelessness or to provide successful permanent exits from shelter has risen from $105 million in FY 14 to over $700 million in FY 2018, and now constitute nearly a quarter of total homelessness spending.
| ($ in millions) | FY 2014 | FY 2015 | FY 2016 | FY 2017 | FY 2018* | FY 2019* |
| Adult Shelter Operations | $326.4 | $356.2 | $456.4 | $509.5 | $685.2 | $644.9 |
| Family Shelter Operations | 504.5 | 577.0 | 652.8 | 807.3 | 1,134.2 | 1,126.1 |
| Domestic Violence, Youth & Emergency Shelters | 87.8 | 94.6 | 101.9 | 122.7 | 134.1 | 153.0 |
| Rental Assistance | 22.9 | 38.7 | 96.8 | 188.7 | 286.8 | 369.1 |
| Prevention, Diversion, Anti-Eviction & Aftercare | 82.3 | 206.7 | 323.5 | 399.7 | 420.1 | 346.9 |
| Homeless Administration & Support | 151.4 | 160.2 | 203.4 | 267.6 | 267.6 | 265.9 |
| Total Citywide Homeless Spending | $1,175.3 | $1,433.4 | $1,834.7 | $2,295.4 | $2,928.0 | $2,905.0 |
SOURCE: Office of the Comptroller; Financial Management System. NOTE: *Budgeted as of FY 2019 Executive Budget.
Shelter Population Trends
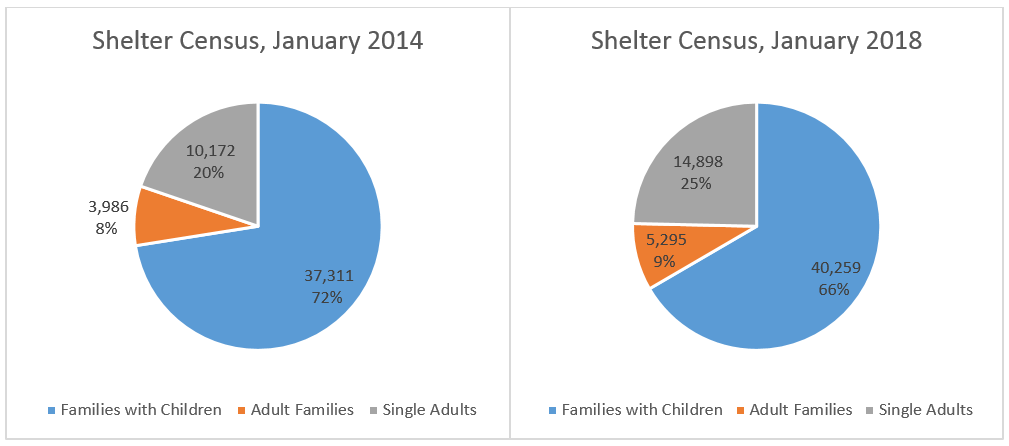
- New York City’s shelter population has increased by 17.5 percent based on a point to point comparison from January 1, 2014 to April 24, 2018. The City’s shelter population reached a record high of 61,075 individuals on February 7, 2018.
- Based on the average shelter census from January 2014 to January 2018, the number of single adults in shelter has risen by 47 percent, individuals in adult families by 33 percent, and individuals in families with children by 8 percent.
- Among the determinants of daily shelter population is the average length of stay in shelter.
- The number of families with children in shelter for one year or longer increased by 9 percent from June 2014 to February 2018.
- The average length of stay for adult families peaked at 571 days in December 2015 and has trended downward since.
SOURCE: Office of the Comptroller; NYC Open Data.
Indicators to Watch
- Average daily shelter population, by household type (Daily DHS Shelter Census; http://www1.nyc.gov/assets/dhs/downloads/pdf/dailyreport.pdf).
- Average length of stay in shelter, by household type (MMR)
Shelter Entrants and Applications
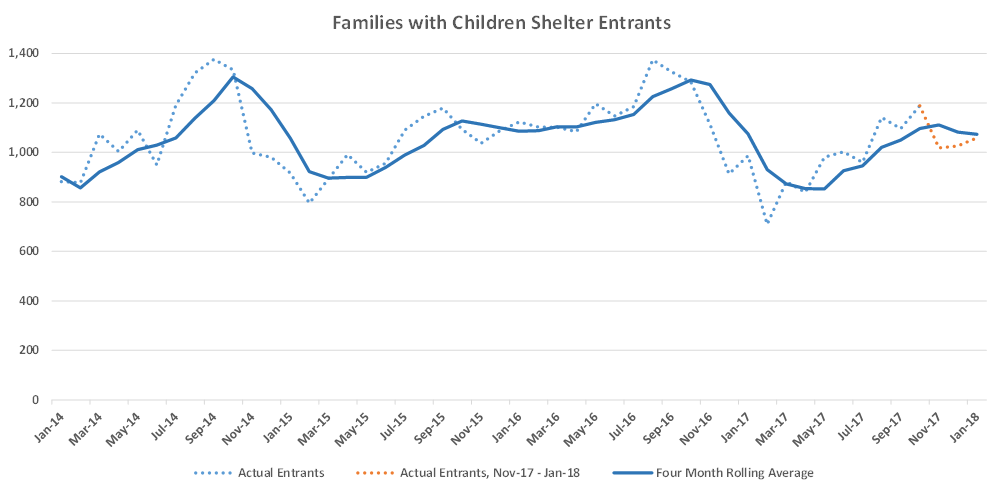
- Among the most important indicators of the City’s homelessness outlook are the number of individuals and households that apply for shelter and enter the shelter system.
- Shelter entrances among families with children and adult (childless) families is slightly below recent trend.
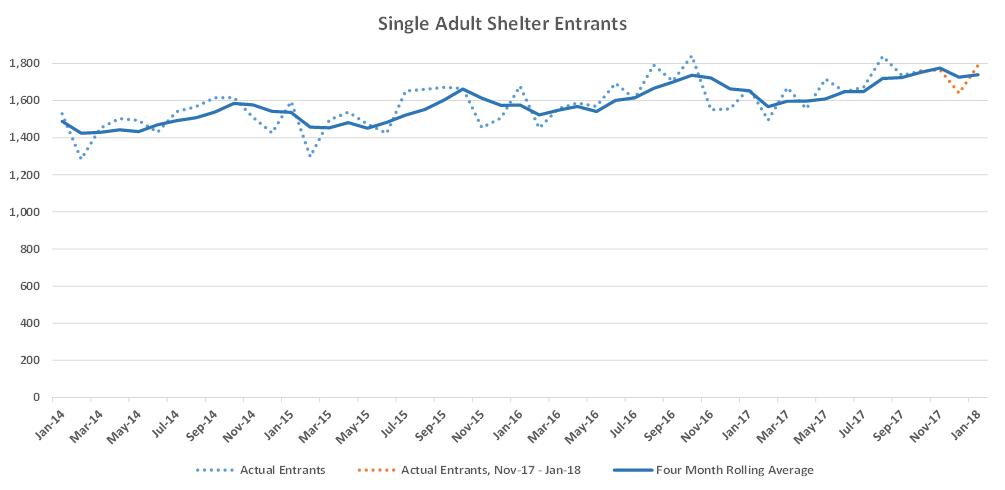
- The trend for single adults, however, continues to climb.
SOURCE: Office of the Comptroller; DHS STAT Reports.

SOURCE: Office of the Comptroller; DHS STAT Reports.
SOURCE: Office of the Comptroller; DHS STAT Reports.
Indicators to Watch
- Applications for shelter by household type; quarterly (not publicly reported)
- Reasons for seeking shelter, by household type; quarterly (not publicly reported)
- Disposition of applications; quarterly (not publicly reported)
- Diversions from shelter at PATH Center; quarterly (MMR and Daily DHS Shelter Census)
Use of Cluster Sites and Commercial Hotels
- The City announced in February 2017 that it would eliminate the use of cluster sites by the end of 2021, and commercial hotel facilities by the end of 2023.
- The City recently entered into $369 million in annual contracts with Children’s Community Services Inc. to shelter homeless New Yorkers in commercial hotel rooms over the next three years. In total, the City is anticipating nearly $1.1 billion in expenditures for commercial hotel rooms alone.
- On average the City spent in excess of $1.1 million per month for hotel rooms that were not used during the six month period ending Dec. 31, 2017.
Indicators to Watch
- Number of cluster sites in use and population housed; monthly (not publicly reported)
- Commercial hotel use, utilization rates and expenditures; monthly (not publicly reported).
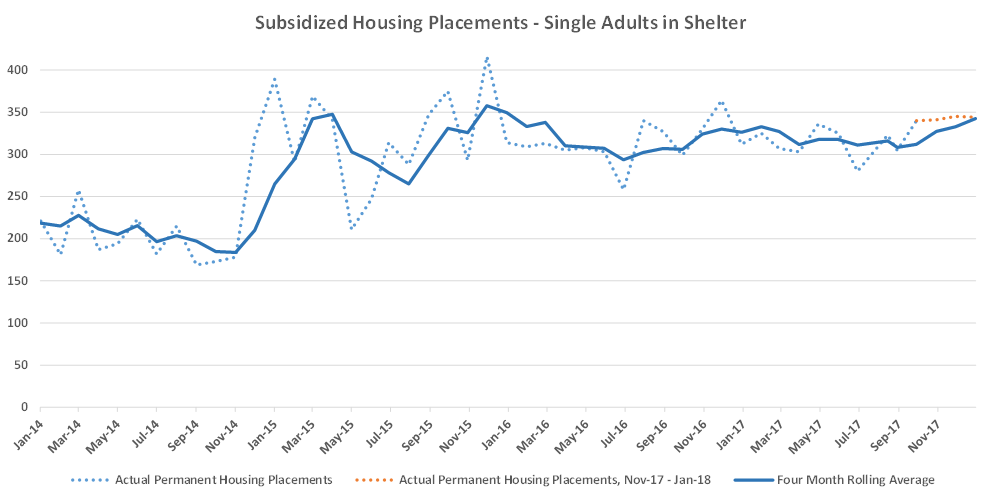
Subsidized Housing Placements
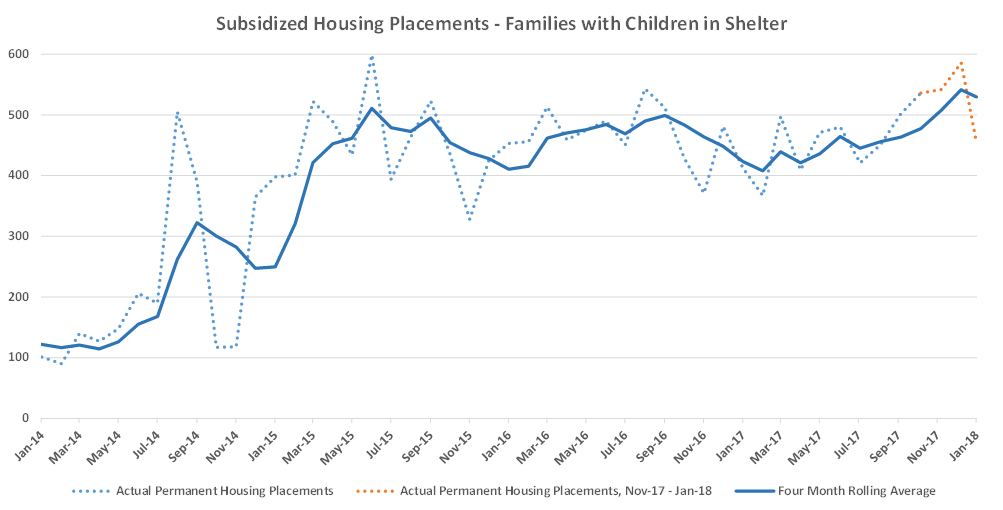
- Spending for subsidized rental placements through several new or expanded initiatives has grown from just $22.9 million in FY 2014, to nearly $287 million in FY 2018 and a budgeted $369.1 million in FY 2019.
- Despite rising spending, the number of monthly subsidized housing placements for all household types has leveled off since mid-2015.
- The rate of returns to shelter has generally declined for all family types.
| Rental Assistance Spending ($$ thousands) | FY 2014 | FY 2015 | FY 2016 | FY 2017 | FY 2018* | FY 2019* |
| LINC / FEPS / HOME | $0 | $16,256 | $73,947 | $142,430 | $149,493 | $127,944 |
| LINC for NYCHA Tenants | – | – | – | 9,000 | 18,360 | 28,091 |
| Supportive Housing | – | – | – | 12,500 | 91,928 | 166,706 |
| Rental Assistance and Housing Placement (DHS) | 22,861 | 22,448 | 22,807 | 24,722 | 26,989 | 20,114 |
| OCFS Cap Savings | N/A | N/A | N/A | N/A | – | 26,289 |
| TOTAL | $22,859 | $38,704 | $96,754 | $188,651 | $286,769 | $369,144 |
SOURCE: Office of the Comptroller; DHS STAT Reports.

SOURCE: Office of the Comptroller; DHS STAT Reports.
SOURCE: Office of the Comptroller; DHS STAT Reports.

SOURCE: Office of the Comptroller; DHS STAT Reports.
Indicators to Watch
- Subsidized housing placements by type of subsidy; monthly (not publicly reported)
- Number of households currently receiving subsidy by type of subsidy; quarterly (not publicly reported)
- Unsubsidized shelter exits by reason; quarterly (not publicly reported)
- Utilization rate of subsidized placements; quarterly (not publicly reported)
- Expiration rate of subsidized placements; annual (not publicly reported)
- Shelter return rates by type of exit; annual (MMR)
Prevention, Diversion and Outreach
- The number of requests for emergency rent assistance rose 42% between FY 2014 and FY 2016, and remains high.
- The City has increased its anti-eviction legal services funding to provide representation to every eligible Housing Court eviction case.
- The City has also increased its efforts to assist the street homeless population, doubling the number of HOME-STAT staff in 2016.
| FY 2014 | FY 2015 | FY 2016 | FY 2017 | FY 2018* | |
| Diversions at PATH | N/A | N/A | N/A | N/A | 12.30% |
| Adults receiving preventive services not entering shelter | N/A | 93.50% | 90.60% | 92.60% | 95.50% |
| Adult families receiving preventive services not entering shelter | N/A | 91.50% | 90.70% | 94.00% | 96.60% |
| Families with children receiving preventive services not entering shelter | N/A | 94.50% | 94.10% | 94.20% | 94.00% |
| Request for emergency assistance at Rent Assistance Unit | 57,912 | 65,138 | 82,306 | 79,624 | 25,051 |
| Rent Assistance Unit emergency assistance requests approved | 66.50% | 74.20% | 67.60% | 66.70% | 71.20% |
| Housing Court anti-eviction legal service cases | N/A | 8,900 | 11,837 | 16,702 | 6,477 |
| HOME-STAT clients assisted with housing placements | N/A | N/A | N/A | 2,146 | 909 |
SOURCE: Mayor’s Management Report. NOTE: *As of 10/31/2017.
Indicators to Watch
- Number and rate of PATH diversions; monthly (partially reported in MMR).
- Preventive services provided, by household type and type of assistance; monthly (partially reported in MMR).
- Anti-eviction legal service cases and dispositions; monthly (partially reported in MMR)
- Street outreach assistance provided, by type of assistance, including shelter placements; monthly (partially reported in MMR).