
A crucial aspect of managing the five NYC public pension systems is the formulation of strategic asset allocations for each portfolio. This involves advising the pension systems as they establish target allocations for each asset class as a percentage of each systems’ total assets under management (AUM). Remarkably, independent research underscores that strategic asset allocation determines the vast majority of return variability over time.[1] As the delegated investment advisor to the five NYC public pension systems, the Office of the NYC Comptroller’s Bureau of Asset Management collaborates extensively with the systems’ boards and their individual investment consultants to set these strategic asset allocations.
Prudent investors, including public pension systems, periodically reassess their strategic asset allocations. Historically, the five NYC public pension systems conducted such reviews every three to five years, with the last review implemented in early 2020.
With the next strategic asset allocation review coming due, 2023 presented a uniquely opportune moment due to two significant drivers — 1) updates to state legislation governing public pension systems in New York and 2) recent market and economic dynamics. The legislation, enacted in late 2022, updates the “basket clause” contained in New York Retirement and Social Security Law to increase public pension systems’ maximum allowed allocation to certain asset classes (including infrastructure, real estate, private equity, opportunistic fixed income, hedge funds, and some foreign equities) from 25% to 35% of pension assets. Under the new law, the systems face a less constrained opportunity set with broader flexibility for the strategic asset allocation.
At the same time, unique market and economic dynamics heightened the necessity of a strategic asset allocation review. The COVID-19 pandemic, a once-in-100-year event, led to severe strain on global supply lines and caused a subsequent rapid rise in inflation. In response, the US Federal Reserve increased interest rates at a historic pace, creating unprecedented challenges in the fixed income market and beyond. Chart FN1 shows the year over year percentage change in the Consumer Price Index (CPI) spiking at over 9% in June 2022, and the Federal Reserve’s policy interest rate. These events produced a historically uncommon combination of a strong economy, low unemployment, and high inflation.
Chart FN1. Inflation and the Fed Fund Rate
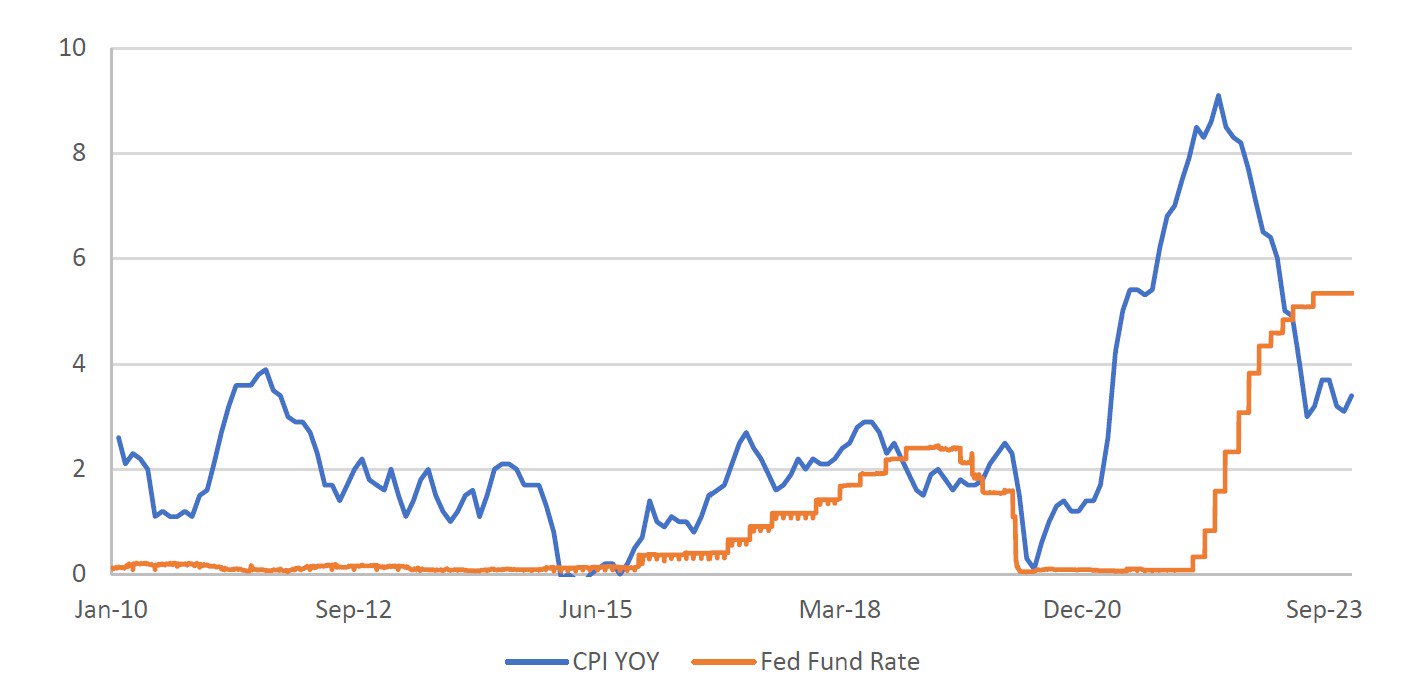
Source: Bloomberg
Taking these factors into account, our office initiated a year-long engagement process with the systems’ consultants and trustees to establish new strategic asset allocations. To begin the strategic asset allocation process, our office formulated long-term investment themes based on an internal analysis of trends in inflation and GDP growth expectations, considering long-term drivers of performance such as the climate transition, decarbonization, deglobalization, technological improvements, increasing geopolitical risks, and demographic changes.
Simultaneously, the general investment consultants for the five systems prepared long-term capital market assumptions, with the specialty investment consultants contributing assumptions for private market asset classes – an enhancement from prior strategic asset allocation reviews. Our office analyzed returns, volatility, and correlation assumptions, identifying areas of dispersion within or across consultant outputs. Our office engaged each consultant on an individual basis, sharpening assumptions in alignment with our long-term thematic views.
Once the long-term capital market assumptions were finalized, our office collaborated with consultants and trustees to determine the universe of asset classes to be included in each optimization, taking into account the unique risk-return preferences of each system. The current inflation environment provided an opportunity to observe inflation protection assets in a real-world market environment. The observed behavior of Treasury Inflation-Protected Securities (TIPS), combined with a forward-looking analysis, led us to conclude that TIPS will not provide value as short- or long-term inflation protection for the portfolio. Conversely, we recommended the addition of cash as an asset class for all systems, formally acknowledging the small allocation to cash inevitably present in the portfolios to meet benefit payments and portfolio liquidity needs.
With the universe of asset classes defined, our team worked with the consultants to run mean-variance optimizations with varying risk-return parameters. Proposals were then presented to the five pension systems’ boards for consideration and approval.
In the new strategic asset allocations, several systems increased allocations to alternative assets, and all systems removed TIPS and added an allocation to cash. These adjustments position the systems in alignment with, or slightly below the national public pension average of 34% allocated to alternative asset classes, according to Public Plans Data.[2] In addition, some systems had a material change in allocation to core fixed income and some to high yield, which was previously restricted by the basket clause contained in New York Retirement and Social Security Law. The increase in allocations to these asset classes was funded primarily from public equities. Chart FN2 summarizes the old and new allocations for the five systems. A more detailed breakdown of the changes is provided in the appendix.
Chart FN2. Old and New Strategic Asset Allocations (SAAs)
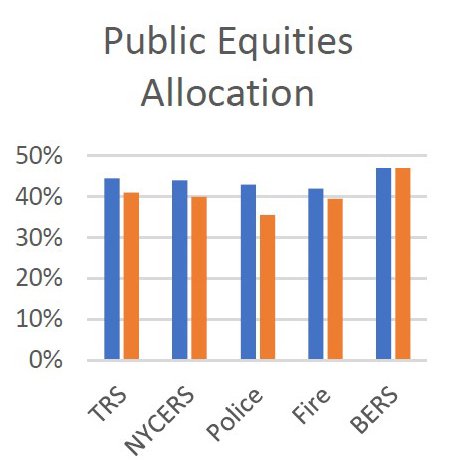


Source: Office of the NYC Comptroller
We believe the new approved strategic asset allocations enhance the systems’ probability of achieving the 7% actuarial rate of return in the long run, while ensuring continued access to sufficient liquidity in public equities and public fixed income. While the new strategic asset allocations are designed to take advantage of the flexibility afforded by the legislative change, the allocations to basket assets are expected to remain below 30%, well below the 35% limit. Chart FN3 shows the basket utilization for the five systems.
Chart FN3. Basket Utilization Percentages
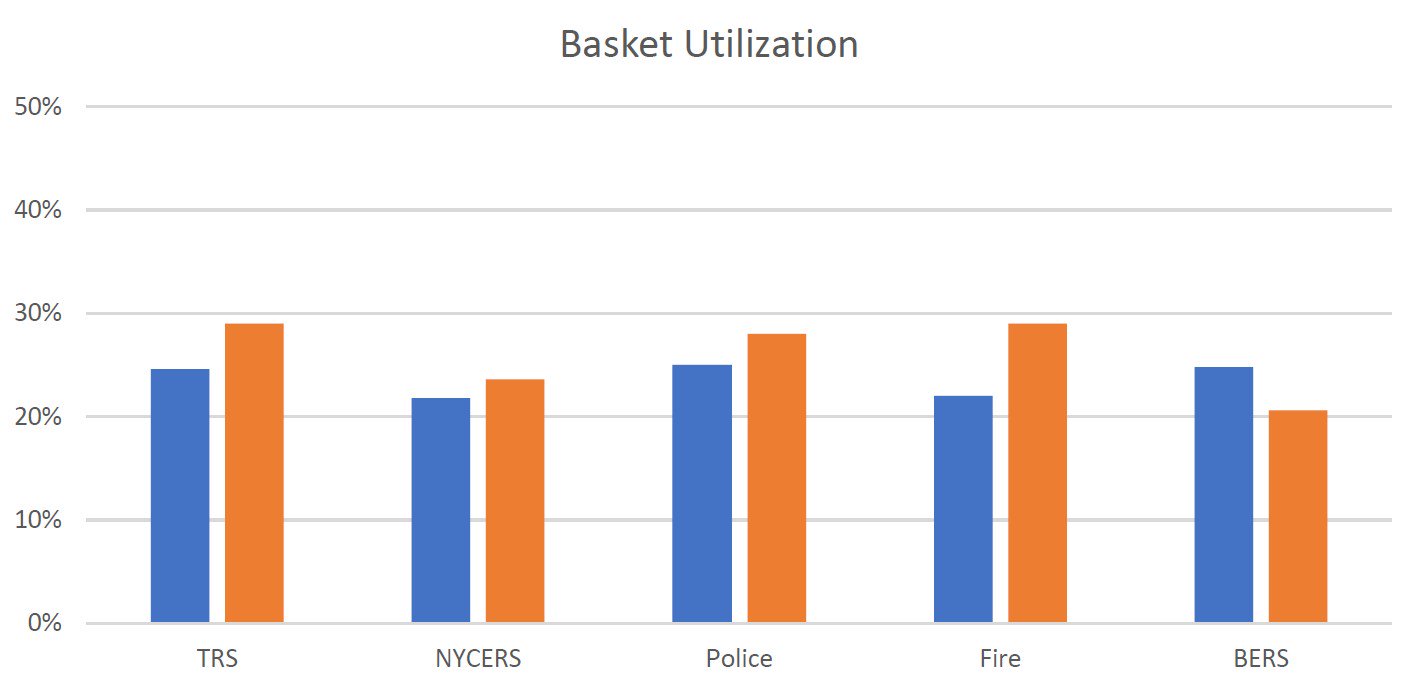
Source: Office of the NYC Comptroller
The combined size of the five NYC public pension systems offers a unique competitive advantage in both helping to secure improved economics and accessing top managers. The change in the basket clause legislation, and subsequent increase in allocations to alternative assets, affords the systems the ability to invest more in the assets that seek to benefit most from these competitive advantages. The new allocations reflect a prioritization of long-term value-for-money over a short-term reduction in absolute fees. Our office diligently negotiates down both management fees and carried interest, and seeks to secure fee reimbursements as well as no-fee-no-carry co-investments into private asset classes.
With new strategic asset allocations approved by all five systems, the work of deployment begins with the development of implementation plans in private equity, real estate, alternative credit, and infrastructure in collaboration with the consultants. The five public pension systems are long-term investors and as such, the systems will deploy a disciplined investment process to reach new asset allocation targets while ensuring vintage year diversification and targeting investments to top managers. It will take roughly three to five years to prudently deploy capital in private markets and reach the new allocation targets. With these new allocations in place, we expect that the systems will be well-positioned to achieve strong performance in the long run.
Appendix 1. Detailed Changes in Asset Allocations
| TRS – Rocaton | NYCERS – Callan | Police – Wilshire | Fire – NEPC | BERS – Segal Marco | |||||||||||||
|---|---|---|---|---|---|---|---|---|---|---|---|---|---|---|---|---|---|
| Old | New | Diff | Old | New | Diff | Old | New | Diff | Old | New | Diff | Old | New | Diff | |||
| Public Equity | U.S. Equity | 25.0% | 24.0% | -1.0% | 27.0% | 23.5% | -3.5% | 30.0% | 26.0% | -4.0% | 27.0% | 24.5% | -2.5% | 31.0% | 34.0% | +3.0% | |
| Dev. World ex-US | 10.0% | 12.1% | +2.1% | 12.0% | 11.6% | (*) | -0.4% | 8.0% | 6.5% | -1.5% | 9.0% | 9.0% | +0.0% | 10.0% | 9.0% | -1.0% | |
| Emerging Markets | 9.5% | 4.9% | -4.6% | 5.0% | 4.9% | (*) | -0.1% | 5.0% | 3.0% | -2.0% | 6.0% | 6.0% | +0.0% | 6.0% | 4.0% | -2.0% | |
| Total Public Equity | 44.5% | 41.0% | -3.5% | 44.0% | 40.0% | -4.0% | 43.0% | 35.5% | -7.5% | 42.0% | 39.5% | -2.5% | 47.0% | 47.0% | +0.0% | ||
| Public Fixed Income | Core FI | 25.0% | 24.5% | -0.5% | 22.5% | 23.5% | +1.0% | 16.0% | 20.0% | +4.0% | 21.0% | 19.0% | -2.0% | 16.0% | 21.5% | +5.5% | |
| High Yield | 4.5% | 5.0% | +0.5% | 3.0% | 5.0% | +2.0% | 7.0% | 9.0% | +2.0% | 6.0% | 7.0% | +1.0% | 8.0% | 6.0% | -2.0% | ||
| TIPS | 3.0% | – | -3.0% | 3.0% | – | -3.0% | 3.0% | – | -3.0% | 4.0% | – | -4.0% | 3.0% | – | -3.0% | ||
| Convertibles | – | – | – | 2.0% | 2.0% | +0.0% | 2.0% | – | -2.0% | 0.0% | – | +0.0% | – | – | – | ||
| Total Public Fixed Income | 32.5% | 29.5% | -3.0% | 30.5% | 30.5% | +0.0% | 28.0% | 29.0% | +1.0% | 31.0% | 26.0% | -5.0% | 27.0% | 27.5% | +0.5% | ||
| Public Other | Cash | – | 0.5% | +0.5% | – | 0.5% | +0.5% | – | 0.5% | +0.5% | – | 0.5% | +0.5% | – | 0.5% | +0.5% | |
| Total Public Other | 0.0% | 0.5% | +0.5% | 0.0% | 0.5% | +0.5% | 0.0% | 0.5% | +0.5% | 0.0% | 0.5% | 0.5% | 0.0% | 0.5% | +0.5% | ||
| Alt. Assets | Private Equity | 7.0% | 10.0% | +3.0% | 8.0% | 10.0% | +2.0% | 8.0% | 10.0% | +2.0% | 8.0% | 12.0% | +4.0% | 9.0% | 8.0% | -1.0% | |
| Private Real Estate | 7.0% | 8.0% | +1.0% | 7.5% | 8.0% | +0.5% | 7.0% | 7.0% | +0.0% | 7.0% | 7.0% | +0.0% | 8.0% | 8.0% | +0.0% | ||
| Private Infrastructure | 4.0% | 5.0% | +1.0% | 4.0% | 4.5% | +0.5% | 3.0% | 4.0% | +1.0% | 3.0% | 5.0% | +2.0% | 4.0% | 4.0% | +0.0% | ||
| Private Credit | 5.0% | 6.0% | +1.0% | 6.0% | 6.5% | +0.5% | 5.0% | 7.0% | +2.0% | 4.0% | 6.0% | +2.0% | 5.0% | 5.0% | +0.0% | ||
| Hedge Funds | 0.0% | 0.0% | +0.0% | 0.0% | 0.0% | +0.0% | 6.0% | 7.0% | +1.0% | 5.0% | 4.0% | -1.0% | 0.0% | 0.0% | +0.0% | ||
| Total Alt. Assets | 23.0% | 29.0% | +6.0% | 25.5% | 29.0% | +3.5% | 29.0% | 35.0% | +6.0% | 27.0% | 34.0% | +7.0% | 26.0% | 25.0% | -1.0% | ||
Source: Office of the NYC Comptroller
Disclaimers: Information presented is current as of the date of this posting only. Past performance does not guarantee the future performance of any manager or strategy. The performance results and historical information provided herein may have been adversely or favorably impacted by events and economic conditions that will not prevail in the future. Therefore, these results are not indicative of the future performance of any strategy, index, fund, manager or group of managers.
[1] Ibbotson, Roger G. and Kaplan, Paul D., Does Asset Allocation Policy Explain 40, 90, 100 Percent Of Performance?.
[2] https://publicplansdata.org/quick-facts/national/#investments