
Letter from Comptroller Levine

Dear New Yorkers,
New York City’s procurement system is one of the most powerful tools we have to build an economy that works for everyone. Each year, the City enters into roughly $40 billion in contracts to purchase the goods and services that New Yorkers rely on to live healthy, safe, and stable lives. The majority of these contracts come to my office for registration—giving the Comptroller a unique responsibility to ensure that public dollars are spent fairly, efficiently, and equitably.
That responsibility is deeply personal to me. I began my career as a bilingual math and science teacher in the South Bronx, where I saw firsthand how economic exclusion and lack of opportunity shaped daily life for families and small businesses. Those experiences led me to found the Neighborhood Trust Federal Credit Union, which has since provided more than $100 million in loans to families and entrepreneurs across Northern Manhattan and the South Bronx. I have long believed that when we invest in local businesses—especially those that have faced generations of exclusion from opportunity—we strengthen entire communities.
This year’s Annual Report on M/WBE Procurement, the first issued pursuant to Local Law 77, underscores how far we still have to go. Despite decades of commitment, M/WBEs account for only 5 percent of total Citywide procurement value.
This Report highlights both the scale of the challenge and the opportunities for progress. In FY25, the Office of Emergency Management and the Department of Buildings registered nearly 80 percent of goal-covered contract value to M/WBEs, showing what is possible with focused implementation. Yet citywide performance remains far lower—just 8 percent—making clear the urgency of stronger accountability and the replication of effective practices across agencies.
We also must confront the procedural barriers that continue to shut M/WBEs out. Contracting timelines remain too long, requirements too burdensome, and payments too delayed. In FY25, 65 percent of M/WBE contracts were registered after their start date—leading to retroactive payments and unnecessary uncertainty. M/WBEs must be paid on time, and my administration will work closely with City agencies to leverage technology, shorten contracting timelines, and eliminate avoidable delays.
Prior iterations of this Annual Report offered dozens of recommendations to address inequity and low M/WBE utilization. While there have been some improvements, much work remains to remove bureaucratic barriers and strengthen procurement tools. 2026 marks the beginning of a new mayoral administration and a new comptroller administration—and a new opportunity to recommit to the important work that must be done to support M/WBEs and small businesses. To that end, we are pleased to hear that the City continues to convene M/WBE leaders and advocates to address these issues.
My office is committed to partnering with agencies, vendors, and advocates to advance reforms and ensure that City contracting reflects the full diversity, talent, and promise of New York City. Public dollars should build shared prosperity—and M/WBEs must be central to that future.
Sincerely,

New York City Comptroller Mark D. Levine
Executive Summary
This Annual Report (“Report”) presents nuanced and layered data analyses to measure the effectiveness of the minority- and women-owned business enterprise (“M/WBE”) program and examine inequities across the City’s procurement portfolio. In addition, this Report identifies important areas of focus for improvements needed to create stronger and more effective procurement tools and systems.[1] In 2025, the City Council acknowledged the value of this Annual Report by passing Local Law 77 (“LL 77”) which requires this Office to publish annually, beginning with this year’s Report.[2] Our Office thanks the City Council for recognizing this Report as an essential tool for transparency and advocacy.
Dashboard – NYC’s M/WBE Program
This dashboard tracks key performance indicators and provides a snapshot of how well the City is meeting its goal to increase the share of contracts awarded to M/WBEs. Each indicator below shows a key performance measure.
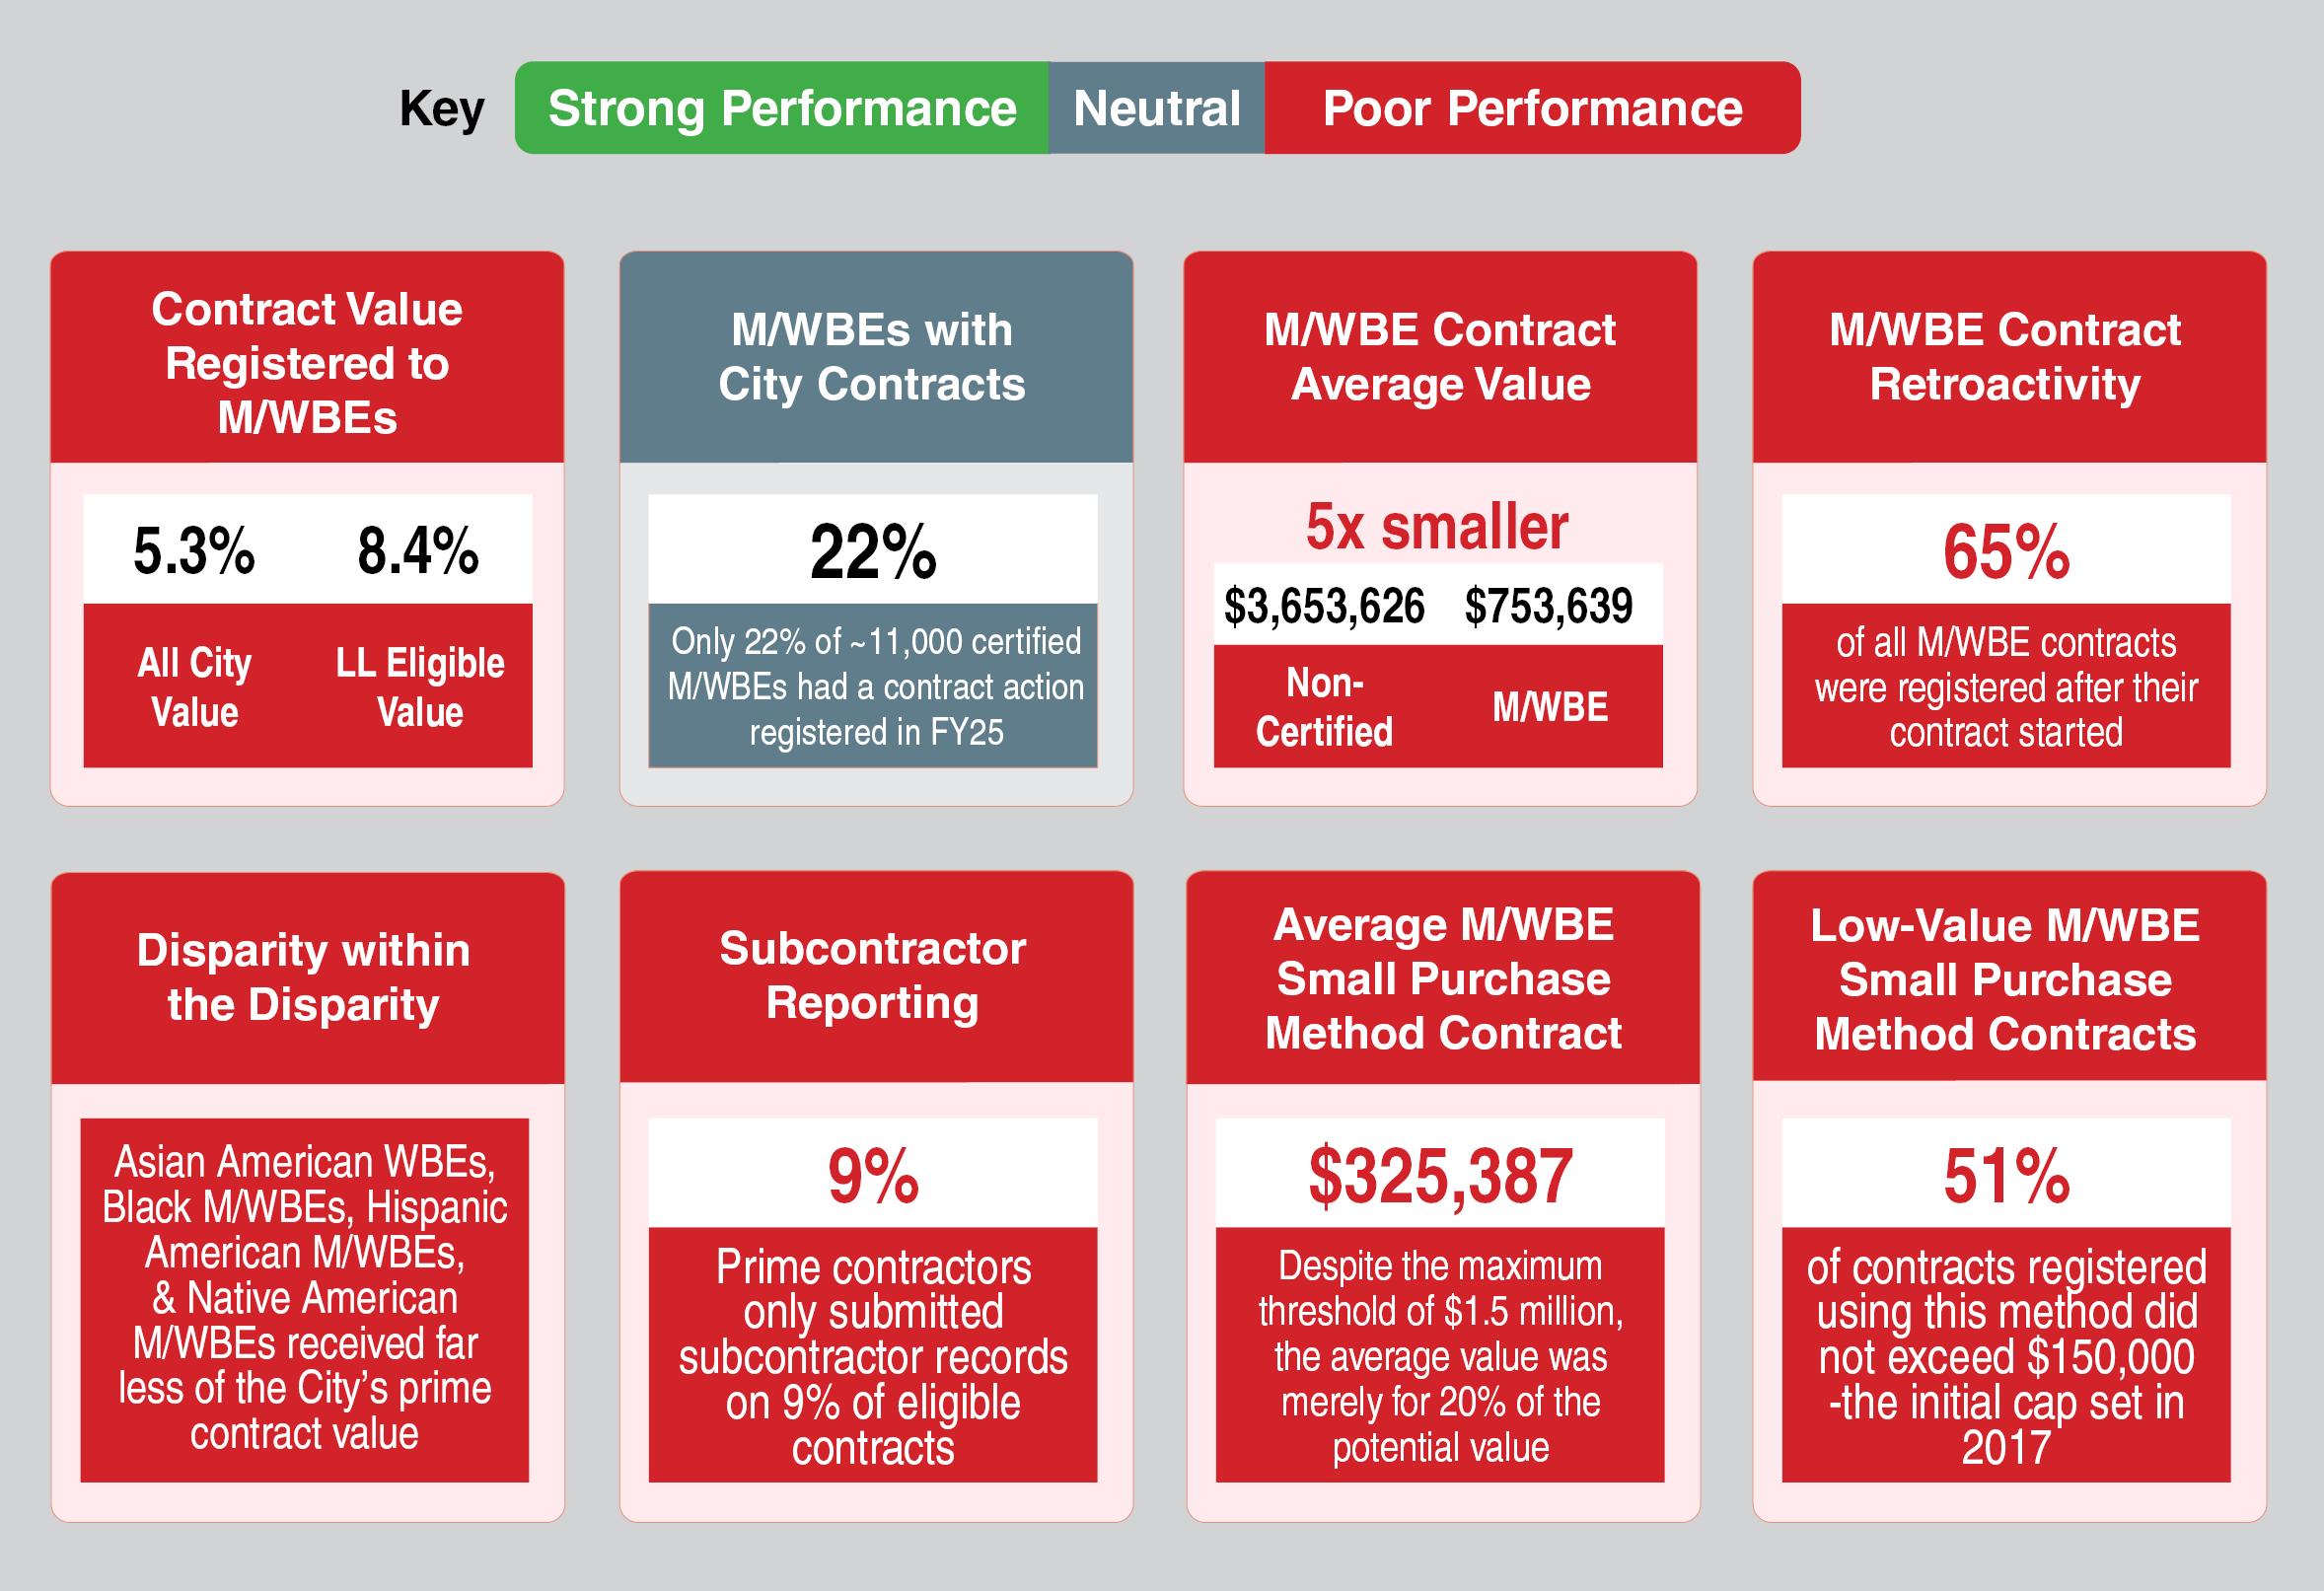
Key Findings for FY25
- M/WBEs only account for 5% of Citywide procurement value. Only 8% of the value of contracts subject to M/WBE participation goals were registered to M/WBEs. The City registered contracts and purchase orders valued at $46 billion, and just $2.4 billion was associated with M/WBE contracts. Of this $46 billion in contracts, $17.5 billion of contracts were subject to M/WBE participation goals – just $1.5 billion of that contract value was registered to M/WBEs.
- Only 22% of City-certified M/WBEs entered into a new contract or purchase order with the City. At the end of the fiscal year, there were 11,382 certified M/WBEs. Just 2,478 entered into a new contract or PO in FY25.
- The average value of a M/WBE contract was five times less valuable than the average contract of a non-certified firm. For contracts subject to M/WBE participation goals, the average value of a contract registered to a non-certified firm was over $3.6 million, but the average M/WBE contract was just under $754,000.
- 65% of all M/WBE contracts were registered after the contract start date. 35% of all M/WBE contracts were registered more than a month after the contract start date.
- A disparity within the disparity persists – businesses owned by women of color and Black and Hispanic American men win far less in contract value. Asian American women-owned businesses (“WBEs”), Black M/WBEs, Hispanic American M/WBEs and Native American M/WBEs each won far less of the City’s prime contract value subject to M/WBE participation goals. It may be worth noting that M/WBEs of all gender and ethnic categories more frequently do business with the City as subcontractors. However, as discussed below, our Office does not have access to this data due to the lack of adequate subcontractor reporting. Therefore, it is likely that the share of the City’s contract value that is ultimately spent with M/WBEs is higher.
- Prime vendors only reported subcontracts for 9% of Citywide contracts, though we know there were many more subcontracts unreported. City systems only show subcontract records for 1,107 of the nearly 12,000 prime contracts subject to M/WBE participation goals. As a result, inadequate subcontractor reporting does not reflect what may be higher shares of M/WBE participation.
- Agencies may use the M/WBE Small Purchase Method for contracts up to $1.5 million, but, on average, are registering contracts for only $325,387. Over half of the contracts registered using this method did not exceed $150,000.
Recommended Priorities
Reform is necessary to level the playing field for businesses owned by people of color and women. As is, agency practitioners and prospective vendors alike struggle to navigate the City’s procurement systems and technology. Policies and procedures are over-complicated and are often implemented differently across dozens of agencies and departments. Change will be difficult to achieve in an ecosystem this large, but it is possible. There are tangible steps the City can take today to build a more equitable, agile, and modern procurement system now and in the future.
Prior iterations of this Annual Report offered dozens of policy recommendations to address the problems that contribute to inequity and low M/WBE utilization. The Adams Administration achieved some improvements in advancing these policy reforms. However, work remains to strengthen procurement tools and remove bureaucratic hurdles. 2026 marks the beginning of a new mayoral administration and a new comptroller administration—and a new opportunity to recommit to the important work that must be done to support M/WBEs and small businesses. New mayoral leadership should prioritize work to implement these recommendations as quickly as possible to increase equity across the City’s procurement portfolio.
- Reduce burdensome requirements to make it easier for M/WBEs to compete for contracts. While there were 202,586 prime contract and purchase order (“PO”) opportunities in FY25 citywide, only 2,478 unique M/WBEs ended up with a registered prime contract, subcontract or a PO. M/WBEs report challenges at all steps of the City’s procurement process, from becoming certified, to finding opportunities, to meeting the minimum requirements to make their bids and proposals competitive. The City must reduce unnecessary barriers that block M/WBEs from accessing these valuable opportunities by streamlining certification processes, creating one repository of current and planned procurement opportunities, and standardizing commodity codes and other resources that connect M/WBEs to agencies.
- Strategically expand the pool of M/WBEs by targeting certification of businesses that offer the goods and services commonly procured by City agencies. 78% of certified M/WBEs failed to win new contracts with the City in FY25. SBS should direct more focused attention to better understand why the vast majority of certified M/WBEs did not win any new business with the City, despite $45 billion in opportunity. The City should also publish a list of the goods and services each agency typically purchases, as well as report on the goods and services offered by the current pool of certified M/WBEs. This would help identify gaps where SBS can focus certification efforts and also reveal places where the City has oversaturated the SBS Online Directory of Certified Businesses (“SBS Directory”) with M/WBEs that provide goods and services that the City does not typically purchase. This type of public reporting would also help M/WBEs better understand the needs of the City to determine if certification is right for them and, if so, which agencies to solicit opportunities from.
- Shorten contracting timelines and eliminate retroactive registration and payments. 65% of M/WBE contracts were registered after their start date in FY25. These burdensome delays create higher barriers-to-entry for M/WBEs who want to do business with the City and undermine public faith in the fairness of the City’s procurement processes. Late contract registration and payment delays force M/WBEs to either advance funds out of limited working capital, seek to borrow in order to start projects, or delay work entirely. The new administration must prioritize reforms that address the root causes of retroactivity. Leadership should streamline requirements at all stages and establish reasonable timeframes for each step of the procurement process. These must come with realistic accountability mechanisms to hold agencies responsible for adhering to those timeframes.
- Capture better subcontractor data in PASSPort to ensure M/WBEs get their fair share. M/WBEs perform a significant amount of work on the subcontractor level, but City tools and systems fail to capture the necessary data required for proper oversight to ensure that they receive the subcontracts that prime vendors commit to. In FY24, the City made important progress by incorporating the subcontracting process into PASSPort, the City’s end-to-end procurement system. This consolidated work that was previously managed across multiple systems of record and enabled agencies to capture multi-tier subcontracts (subcontractors of subcontractors). However, there are still significant shortcomings in the subcontractor data that is captured in PASSPort and many subcontractors are still missing from City records, making it difficult to monitor compliance. The new administration should establish stronger oversight mechanisms to ensure that prime contractors are accurately reporting all subcontractor data in PASSPort. PASSPort should also be enhanced to allow prime vendors and subcontractors to identify and pursue subcontracting opportunities.
- Proactively recertify M/WBEs before their certifications lapse. M/WBEs are subjected to time-consuming procedures and laborious processes to become certified by the Department of Small Business Services (“SBS”) and, once obtained, that certification is only valid for five At the five-year mark, their certification lapses and M/WBEs are required to go through another lengthy recertification process if they would like to remain City-certified. A burden is placed on M/WBEs to diligently monitor their certification status – if their status lapses, they may miss out on valuable opportunities. Agencies may become out of compliance with M/WBE program requirements when an awarded vendor’s M/WBE certification lapses during the term of an active contract. Furthermore, agencies sometimes rely solely on their historical familiarity with a vendor as a M/WBE (at one point in time), instead of checking the status of City certification in the SBS Directory. In doing so, the agency may improperly solicit this vendor for M/WBE opportunities in the future. SBS should more effectively manage and track the certification expiration dates of M/WBEs and conduct proactive outreach to ensure that lapse of certification does not occur unless appropriate. SBS should also work closely with contracting agencies to monitor certification status of M/WBE contractors and ensure there are no lapses, especially during the term of an active contract.
Agency Highlights
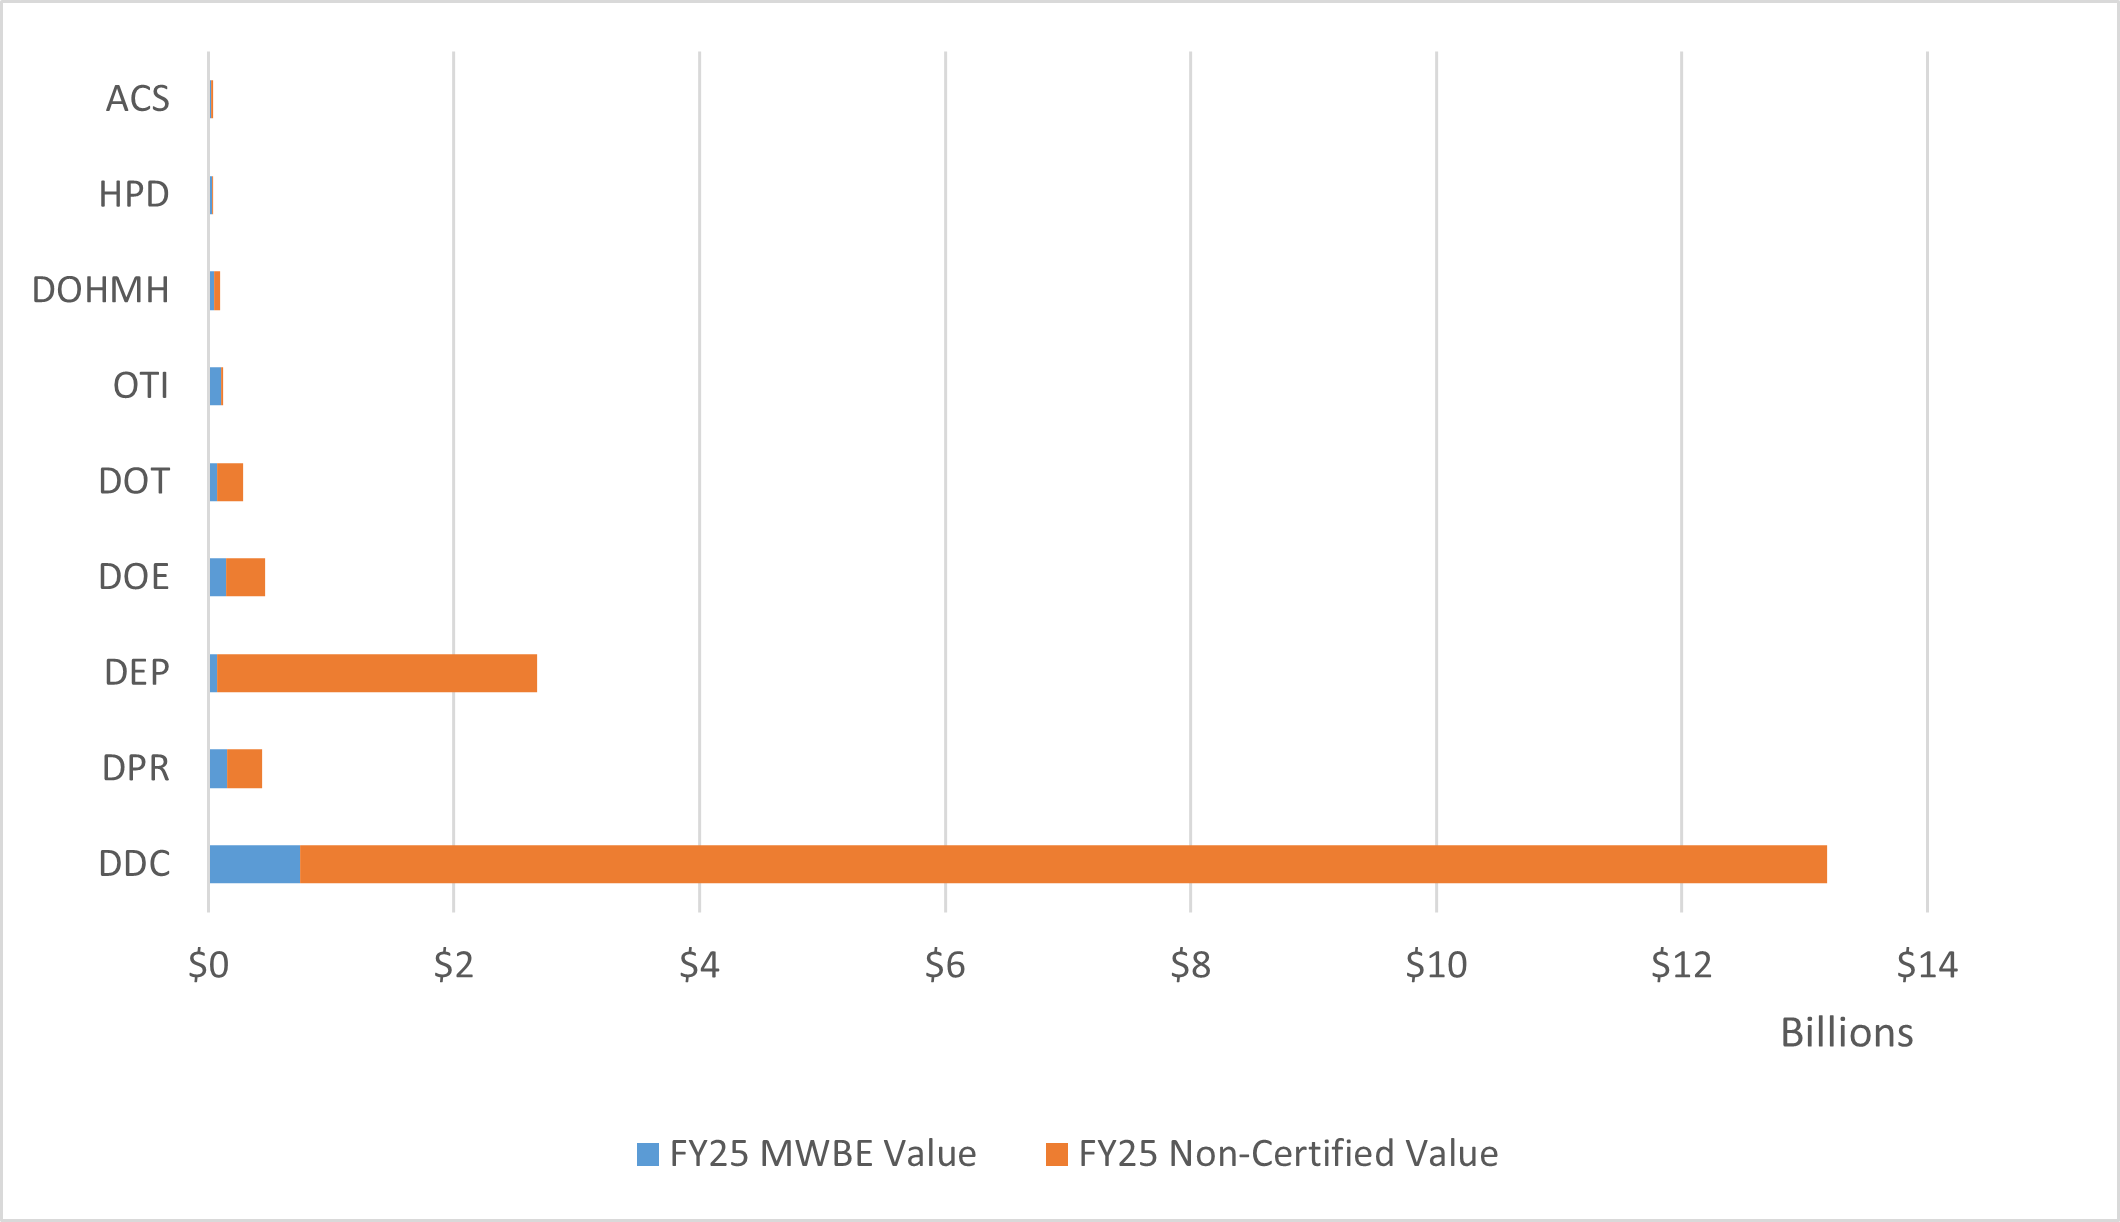
This Report also provides a snapshot of each agency’s work with M/WBEs. It examines the relative performance of agencies in doing business subject to M/WBE participation goals as compared to their peer agencies with similarly sized portfolios.[3] It is important for every agency, regardless of its size, to maximize M/WBE utilization whenever possible. However, it is noteworthy to review the size of each agency’s procurement portfolio and the share of which is subject to M/WBE participation goals. Charts 1-4 below show the relative share of registered contracts subject to M/WBE participation goals across agencies with similarly sized procurement portfolios. Additional information about each agency and the methodology for establishing cohorts can be found in the “M/WBE Utilization by Agency” section of this Report.
Nine agencies make up the “Large Cohort,” which includes those agencies whose FY22-25 contract registrations included over $100 million in contracts subject to M/WBE participation goals. Among the Large Cohort, the Department of Design and Construction (“DDC”) has the largest relative share of registered contract value subject to M/WBE participation goals in FY25 ($12.4 billion). Though DDC represents the agency with the largest value registered to M/WBEs ($743.2 million), this value is a relatively small share of its LL 174-eligible portfolio (5.64%). By contrast, the Office of Technology and Innovation (“OTI”) registered more than 88% of the value of its contracts subject to M/WBE participation goals to M/WBEs in FY25, but this high value totaled much less than DDC ($105.5 million).
Chart 1: Large Cohort: FY25 Share of Contract and PO Value Subject to LL 174 Participation Goals, by Agency
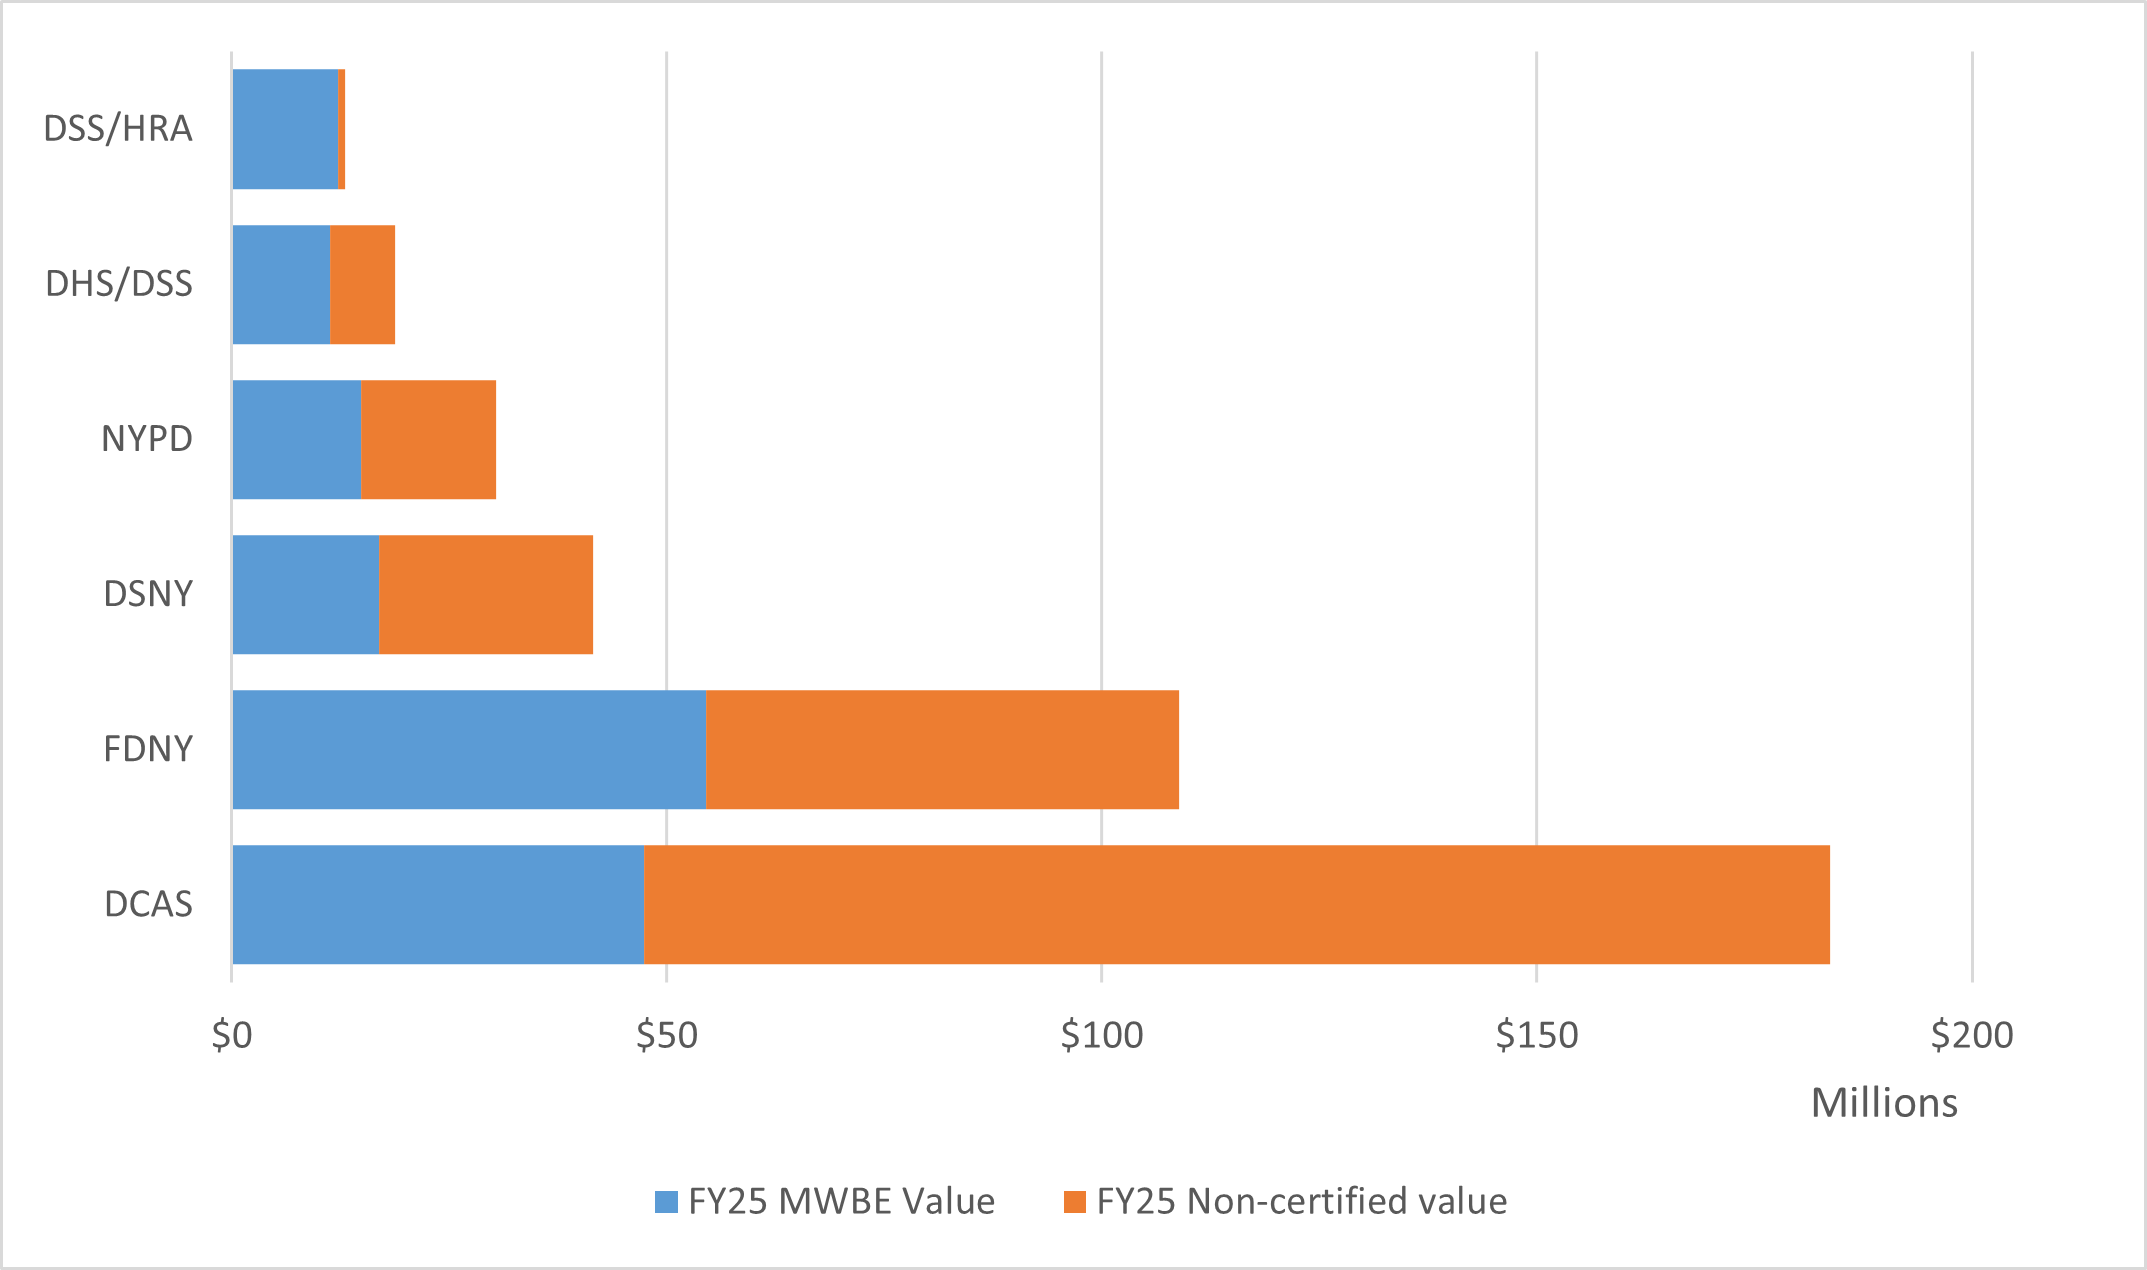
Six agencies make up the “Moderate Cohort,” which includes those agencies whose FY22-25 contract registrations included between $50 million and $100 million in contracts subject to M/WBE participation goals. All agencies in the Moderate Cohort registered over half of contracts subject to LL174 to M/WBEs in FY25. The New York City Fire Department (“FDNY”) registered the largest total value to M/WBEs among this cohort ($54.5 million), representing about half of its total eligible value. The Human Resources Administration (“DSS/HRA”) registered the largest relative share of its eligible contract value to M/WBEs (94%).
Chart 2: Moderate Cohort: FY25 Share of Contract and PO Value Subject to LL 174 Participation Goals, by Agency
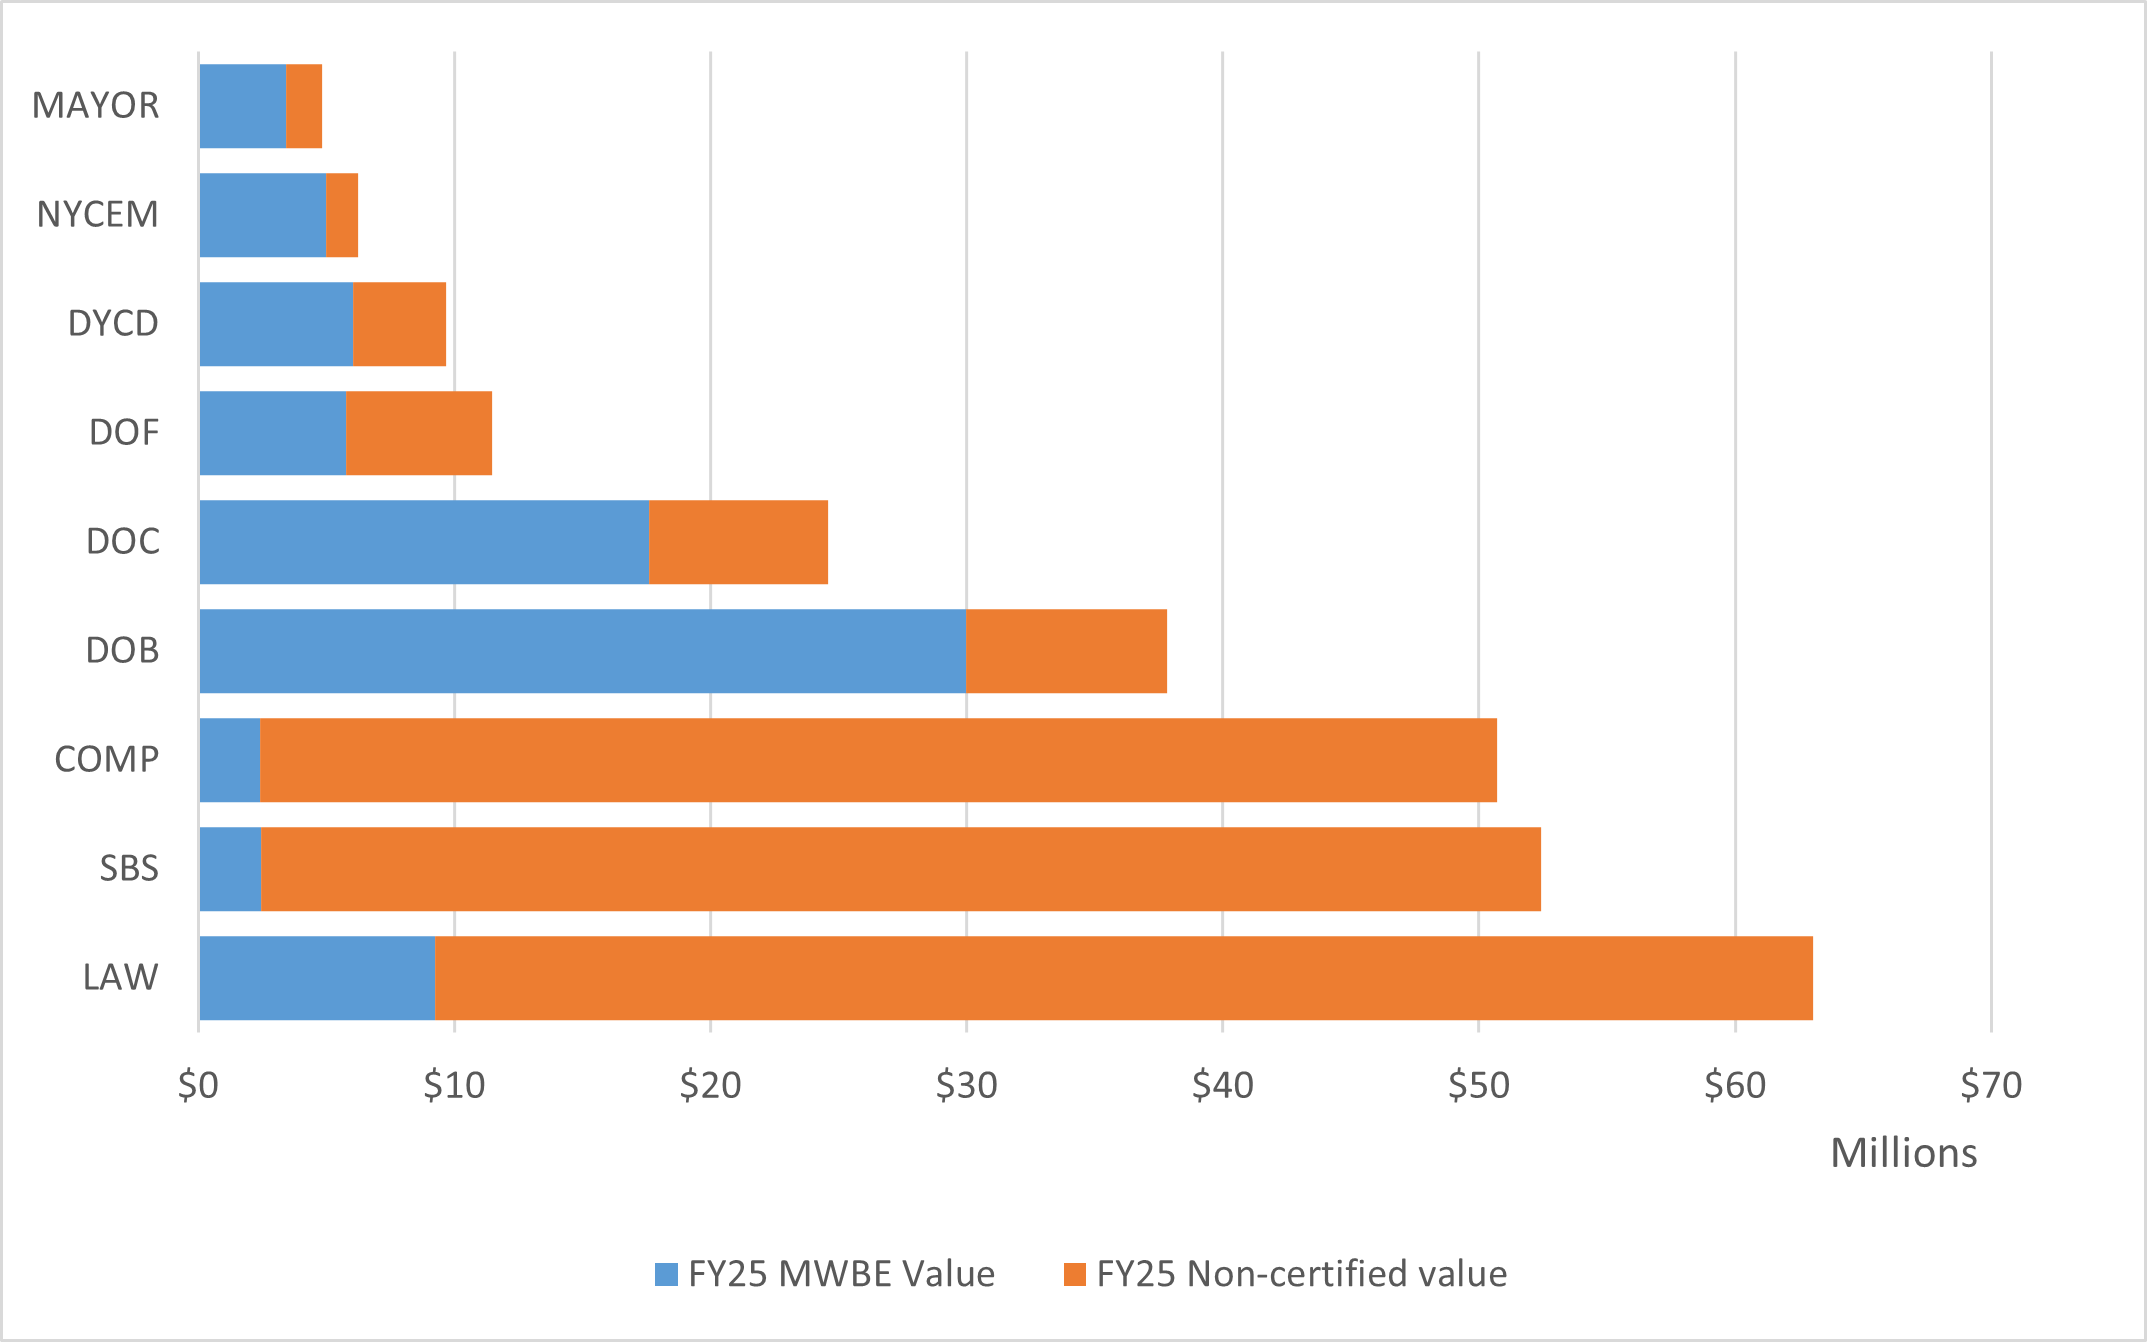
Nine agencies make up the “Small Cohort,” which includes those agencies whose FY22-25 contract registrations included between $10 million and $50 million in contracts subject to M/WBE participation goals. Among the Small Cohort, the Department of Small Business Services (“SBS”) registered the smallest share of contract value subject to M/WBE participation goals (just under 5%) to M/WBEs in FY25. By contrast, the Office of Emergency Management (“NYCEM”) and the Department of Buildings (“DOB”) both registered nearly 80% its contract value subject to M/WBE participation goals to M/WBEs in FY25.
Chart 3: Small Cohort: FY25 Share of Contract and PO Value Subject to LL 174 Participation Goals, by Agency
Fifteen agencies make up the “Micro Cohort,” which includes those agencies whose FY22-25 contract registrations included less than $10 million in contracts subject to M/WBE participation goals. Among the Micro Cohort, the Department of Investigation (“DOI”) registered the smallest share of contract value subject to M/WBE participation goals to M/WBEs (5%). By contrast, the Department of Cultural Affairs (“DCLA”) registered 90% of its contract value subject to M/WBE participation goals to M/WBEs in FY25.
Chart 4: Micro Cohort: FY25 Share of Contract and PO Value Subject to LL 174 Participation Goals, by Agency
Approach
This Report provides a comprehensive review of the Fiscal Year 2025 (“FY25”) data of prime contracts registered by New York City agencies with this Office, including the metrics mandated by LL 77, as well as additional analyses to examine if and when M/WBEs receive contracts, analyzing by procurement method, dollar value, and industry. Reviewing these indicators shines light on the procedural roadblocks that perpetuate inequities in how the City contracts with M/WBEs.
Data
All data for this report was extracted from the City’s Financial Management System (“FMS”) and Procurement and Sourcing Solutions Portal (“PASSPort”) during the summer and autumn of 2025.[4] This Report largely measures M/WBE utilization in alignment with the requirements codified in Local Law 174 (“LL 174”) and Section 6-129 of the New York City Administrative Code (“Administrative Code”). The requirements are applicable only for eligible contracts, which are defined in the “M/WBE Program Overview” section of this Report. Therefore, this dataset is limited to the City’s utilization of City-certified vendors and does not report on the utilization of vendors certified by the State as M/WBEs or as Disadvantaged Business Enterprises (“DBE”).[5] Additionally, this Report excludes data related to registered Renewals, given that, by definition, these are re-registrations of existing contacts that have been reported on in prior years and are not reflective of new efforts to contract for these goods or services.
Compliance with the requirements of the M/WBE Program can be achieved at both prime and subcontracting levels.[6] As noted in prior reports, the City’s subcontractor utilization data is limited, even after management functions were transferred from the Payee Information Portal (“PIP”) to PASSPort in September 2024. Therefore, unless otherwise stated, this Report primarily focuses on analyzing prime contract data.
City procurement systems are limited and do not include the necessary data to confirm if a contract is funded by State or Federal funds. Due to these limitations, LL 174-eligible data in this Report includes some contracts that may actually be excluded from LL 174.
Unless specified, this Report does not include data related to contracts issued by some non-mayoral entities (including at the time of this report the Department of Education, the Economic Development Corporation, NYC Health + Hospitals, and the New York City Housing Authority).[7] In an effort to share information on the use of City dollars more generally, in some circumstances data is included for contracting agencies and procurement actions not covered by LL 174. The report will specify whether analyses pertain to contracts subject to LL 174 participation goals or more generally to other specified data sets. A full list of excluded considerations is included in Appendix C of this Report.
M/WBE Program Background
The City’s M/WBE program was developed to expand opportunities for minority and women entrepreneurs to access government contracts and grow their businesses. It is currently governed by Section 6-129 of the Administrative Code, which codifies Local Laws 174 and 176 enacted by the City Council in 2019. This Report often focuses on procurements “subject to LL 174 participation goals”, for which city agencies have a legally mandated responsibility to meet specified M/WBE participation goals. These goals can be met by awarding a prime contract to a M/WBE, or by requiring a non-certified prime vendor to subcontract a specified percent of the contract value to M/WBEs. When used effectively, participation goals ensure maximum M/WBE utilization even in circumstances where the chosen procurement method does not result in a contract award to a M/WBE prime.
M/WBE Certification
The Department of Small Business Services (“SBS”) is responsible for certifying that vendors meet the criteria to be designated as a New York City M/WBE (“City-certified”).[8] Businesses owned by people of color and women are required to be City-certified by SBS in order to be eligible to qualify for procurement opportunities exclusively targeted to M/WBEs such as those via the M/WBE Small Purchase method.[9] Similarly, agencies may only avail themselves of M/WBE-targeted tools and receive credit towards participation goals when contracting with City-certified M/WBEs. As discussed throughout this report, Certification is a significant first step that M/WBEs take towards their City contracting journey.[10]
Businesses that want to certify as M/WBEs with other municipalities to either further expand their contracting portfolio or to be eligible for non-City funding opportunities are also required to also be independently certified as a M/WBE with those entities. Given that certification reciprocity does not exist among local public contracting entities, including New York State, Port Authority of New York and New Jersey, and the New York City School Construction Authority, vendors experience the burdens of these time-consuming and mostly duplicative processes many times over. As a member of the Capital Process Reform Task Force, this Office supported the proposal for State Legislation that established certification reciprocity between New York City and New York State. Although the legislation passed in both the State House and Assembly during the 2023-2024 legislative session, the legislation was ultimately vetoed by the Governor in December 2023.[11] As of the date of this Report, there has been no additional efforts to advance this initiative. This Office remains in support of certification reciprocity and looks forward to its successful passage during the upcoming legislative session.
Procurements Subject to LL 174 Participation Goals
Agencies are required to meet M/WBE participation goals for all eligible procurements in the following industries[12]:
- Professional services: the provision of various kinds of expert advice and consulting, including legal services, medical services, and information technology and construction-related consulting services
- Standard services: services other than professional services and human services such as custodial services, security guard services, stenography services and office machine repair
- Construction services: dealing in the planning, design, or construction of real property or other public improvements
- Goods (valued up to $1 million): all personal property, including but not limited to equipment, materials, printing, and insurance, excluding land or a permanent interest in land
These goals include specific contracting participation goals for each individual M/WBE category: “Black Americans, Asian Americans, Hispanic Americans, Native Americans, Women, and Emerging”. LL 174 also permits agencies to set an “unspecified goal,” which a vendor may meet by using an M/WBE regardless of certification category.[13]
Specified Exclusions
In some specified circumstances, agencies are not required to establish M/WBE participation goals for contracts. As a result of these exclusions, just 40% of total City procurement value for FY25 was subject to M/WBE participation goals.[14]
Chart 5: FY25 Value of Contracts and POs Subject to M/WBE Participation Goals, Citywide
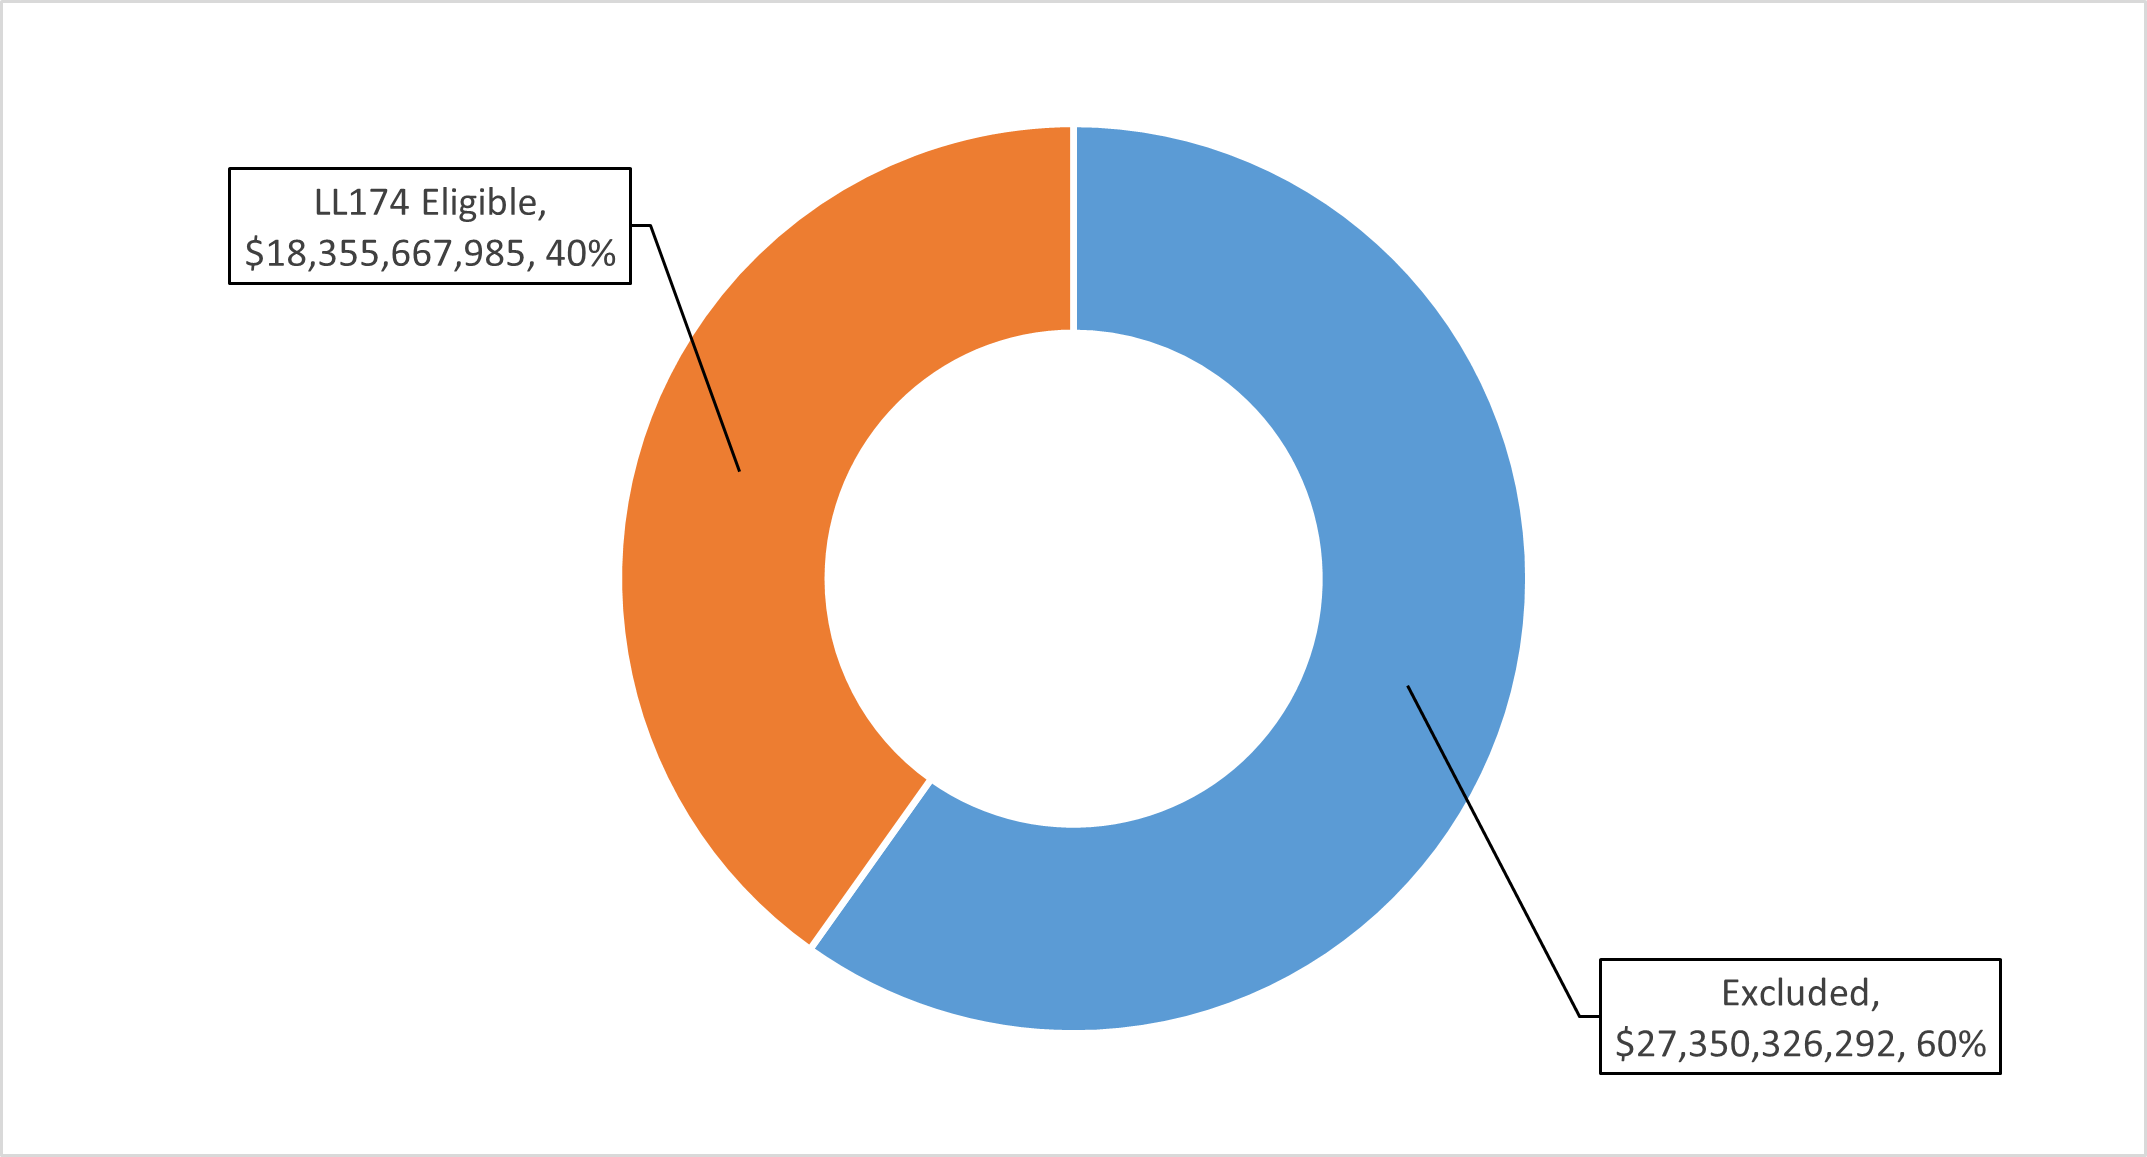
Notably, human services contracts are exempted from the M/WBE program. In FY25, the City registered $15.7 billion in human services contracts, which represent nearly 40% of the total contract value for the fiscal year. Many of these contracts include substantial subcontracting to for-profit firms—the City could benefit from requiring that these subcontracts be subject to M/WBE participation goals. Prior versions of this Report detailed the impact of excluding nearly half of the City’s procurement portfolio from M/WBE participation goals and offered recommendations to increase utilization in this critical sector.
Key Indicators: M/WBEs Don’t Get Their Fair Share
This Annual Report presents data on City procurements that is essential to evaluating efforts to achieve measurable progress in increasing M/WBE utilization. This Report measures the current state of utilization by analyzing trends and progress across five key areas of the City’s contracting portfolio:
- The share of contract registration value that was registered to M/WBEs[15]
- The average value of contracts registered to M/WBEs, in comparison to the average value of contracts registered to non-certified firms
- A disaggregated analysis of key indicators to understand the disparate impacts across racial and gender categories
- The number of unique M/WBEs that do business with the City
- The retroactivity of contract registration for M/WBEs
Taken together, these areas of analysis can demonstrate a more comprehensive understanding of the current state of the City’s utilization of M/WBEs. This Report’s analyses demonstrate that the City and its agencies are still falling short of goals to contract with diverse businesses.
M/WBEs only won 5% of the value of City contracts
In FY25, the City registered 202,586 new prime contracts and POs valued at $45,705,994,277. This includes many contracts that are not subject to LL 174 participation goals as outlined in the “M/WBE Program Overview” section of this Report, including human services contracts (which account for approximately 40% of the registered contract value Citywide). Across all City contracts and POs, 50,827 were registered to M/WBEs, representing 25.09% of the volume and 5.34% of the value. This relative share of registered contracts remains generally stagnant with the share from prior fiscal years.
Table 1: Volume of All Registered New Contracts and POs Citywide, FY23-25
| FY23 | FY24 | FY25 | ||||
|---|---|---|---|---|---|---|
| Certification Type | # of Contracts | % Share of Contracts | # of Contracts | % Share of Contracts | # of Contracts | % Share of Contracts |
| M/WBE | 29,153 | 19.81% | 37,890 | 23.80% | 50,827 | 25.09% |
| Non-Certified | 118,043 | 80.19% | 121,281 | 76.20% | 151,759 | 74.91% |
| Grand Total | 147,196 | 100.00% | 159,171 | 100.00% | 202,586 | 100.00% |
Table 2: Value of All Registered New Contracts and POs Citywide, FY23-25
| FY23 | FY24 | FY25 | ||||
|---|---|---|---|---|---|---|
| Certification Type | Total Registered Value | % Share of Value | Total Registered Value | % Share of Value | Total Registered Value | % Share of Value |
| M/WBE | $1,974,794,910 | 4.93% | $2,109,917,404 | 6.09% | $2,439,201,518 | 5.34% |
| Non-Certified | $38,044,842,466 | 95.07% | $32,250,332,612 | 93.91% | $43,266,792,759 | 94.66% |
| Grand Total | $40,019,637,377 | 100.00% | $34,630,250,017 | 100.00% | $45,705,994,277 | 100.00% |
The numbers are somewhat better for new contract registrations and POs subject to LL 174 participation goals. Per Tables 3 and 4, M/WBEs accounted for 64.67% of new contracts and POs subject to LL 174 participation goals, and 8.43% of the associated value. The 8.43% share reflects a decrease from 16.9% in FY24.[16]
This small share is especially disappointing, given the actual diversity and demographics of the City. According to the U.S. Census, in 2022, New York City was 31.9% non-Hispanic white, 28.9% Hispanic or Latino, 23.4% Black, 14.3% Asian or Pacific Islander, 0.5% Native American, and 7.1% two or more races. 52% of New Yorkers identify as female, and 48% male.[17]
Chart 6: FY25 Value of Contracts and POs Subject to LL 174 Participation Goals
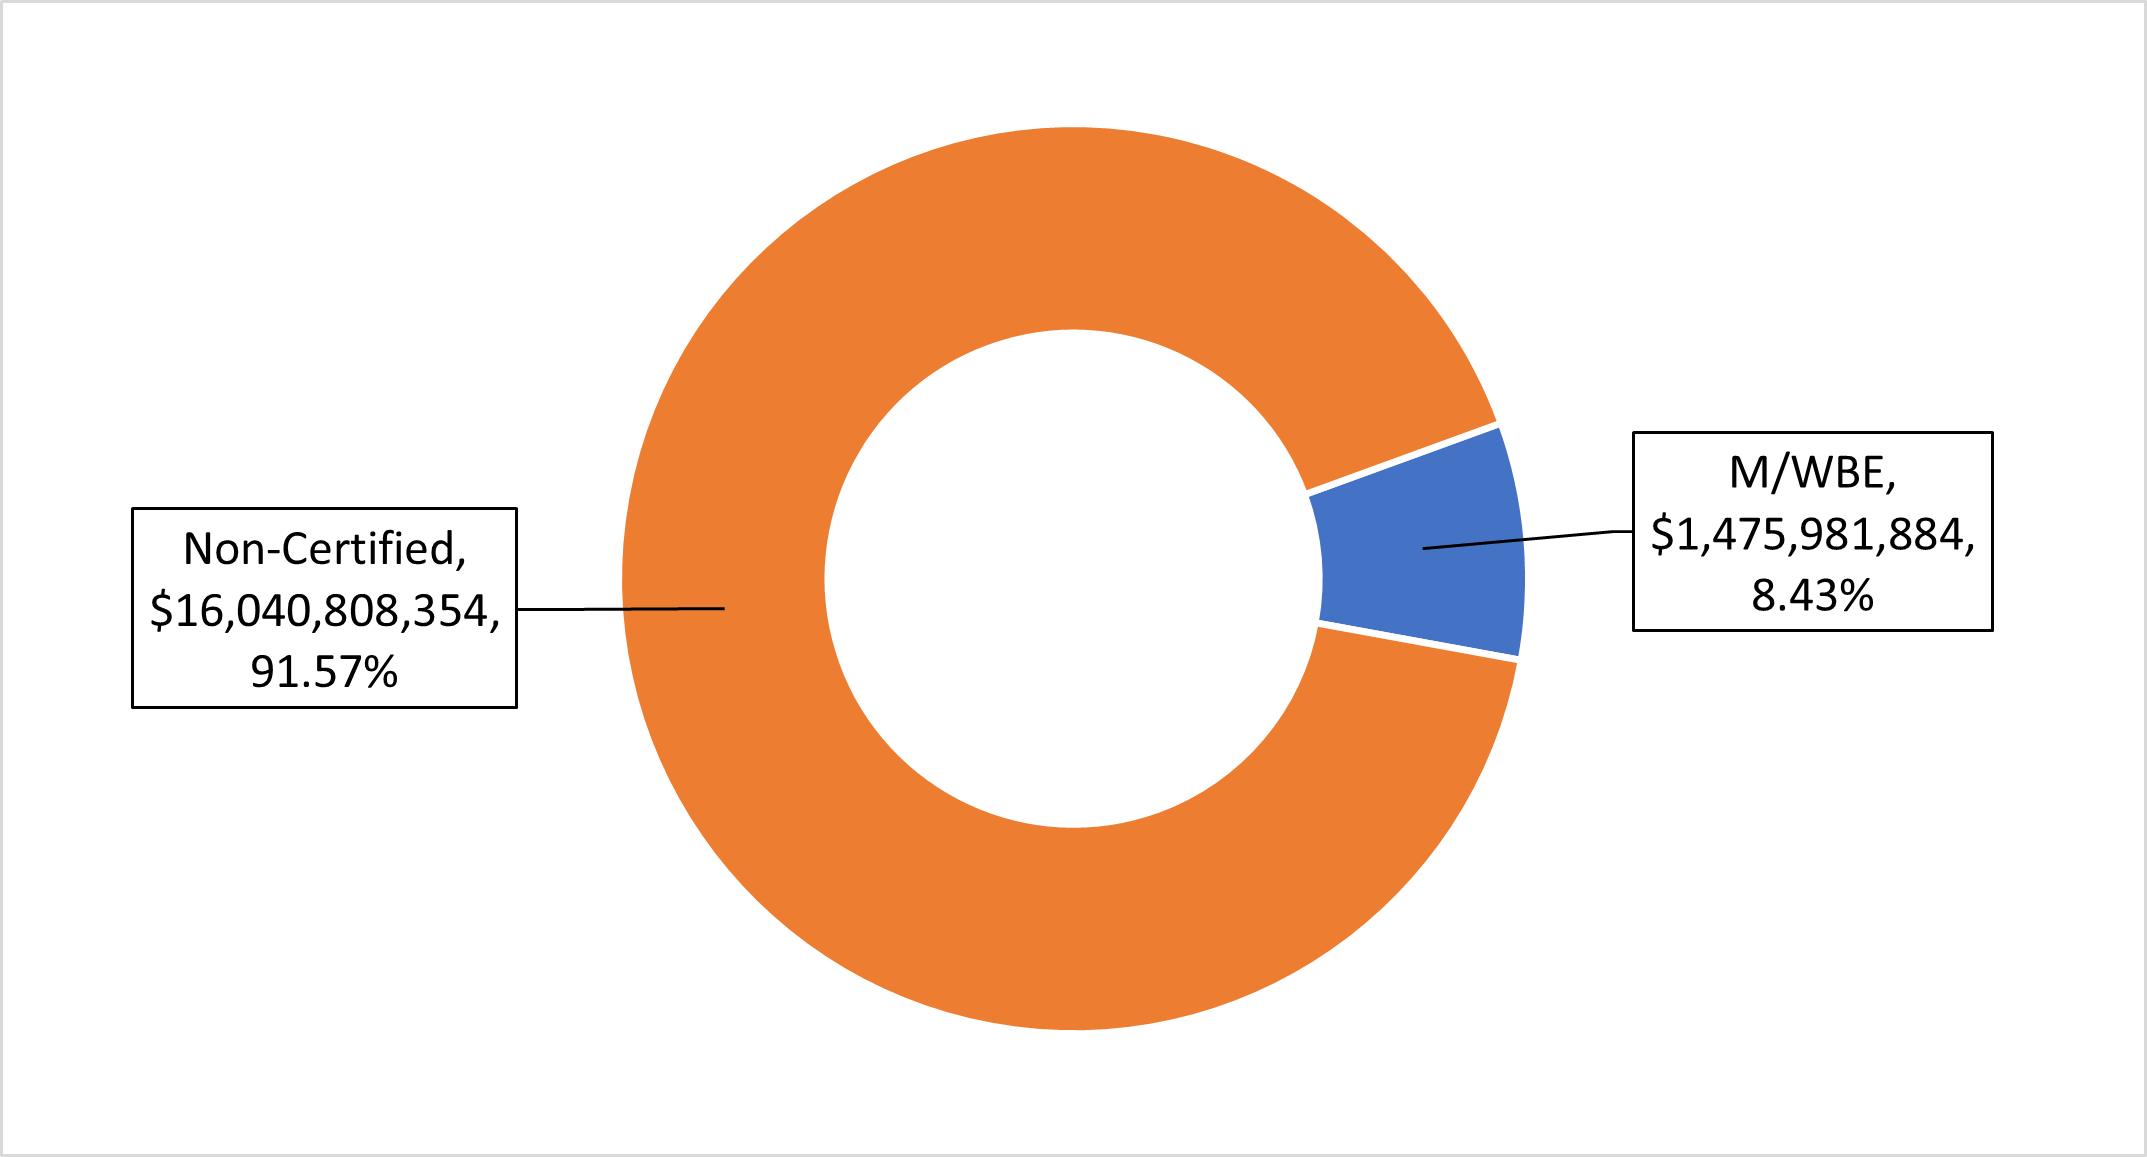
Table 3: Volume of Contracts and POs Subject to LL 174 Participation Goals, FY23-25
| FY23 | FY24 | FY25 | ||||
|---|---|---|---|---|---|---|
| Certification Type | # of Contracts | % Share of Contracts | # of Contracts | % Share of Contracts | # of Contracts | % Share of Contracts |
| M/WBEs | 16,530 | 59.80% | 19,338 | 64.17% | 20,539 | 64.67% |
| Non-Certified | 11,111 | 40.20% | 10,799 | 35.83% | 11,222 | 35.33% |
| Grand Total | 27,641 | 100.00% | 30,137 | 100.00% | 31,761 | 100.00% |
Table 4: Value of Prime Contracts and POs Subject to LL 174 Participation Goals, FY23-25[18]
| FY23 | FY24 | FY25 | ||||
|---|---|---|---|---|---|---|
| Certification Type | Total Registered Value | % Share of Value | Total Registered Value | % Share of Value | Total Registered Value | % Share of Value |
| M/WBEs | $904,366,194 | 9.54% | $885,373,167 | 16.90% | $1,475,981,884 | 8.43% |
| Non-Certified | $8,574,837,345 | 90.46% | $4,353,241,357 | 83.10% | $16,040,808,354 | 91.57% |
| Grand Total | $9,479,203,539 | 100.00% | $5,238,614,524 | 100.00% | $17,516,790,238 | 100.00% |
For a number of reasons, including the pervasive underreporting of subcontract data this Report’s primary focus is on the utilization of M/WBEs within prime contracting. Mayoral agencies approved subcontract records against just 194 of the 3,328 (5.83%) of LL 174-eligible prime contracts registered in FY25 at the time the data for this report was pulled from PASSPort.[19] The 694 M/WBE subcontract records associated with these prime contracts that were entered into PASSPort accounted for $394,217,087 million (32.8%) of the $1.2 billion in recorded subcontract value, significantly exceeding the ratio among prime contracts. It is important to note that subcontract values are not additive to the value of prime contract registrations given that they reflect a subset of the reported prime values. As such, this Report does not combine prime and subcontract utilization figures.
Table 5: FY25 Volume and Value of Subcontracts in PASSPort Subject to LL 174 Participation Goals
| Certification Type | # of Subcontracts | % Share of Subcontracts | Total Subcontract Value | % Share of Subcontract Value |
|---|---|---|---|---|
| M/WBE | 694 | 61.58% | $394,217,087 | 32.81% |
| Non-Certified | 433 | 38.42% | $807,423,888 | 67.19% |
| Grand Total | 1,127 | 100.00% | $1,201,640,975 | 100.00% |
This Report includes a special focus on subcontractor data in the section “The City Can’t Measure Missing Subcontract Data.” Among the 36 rated agencies in this Report (Mayoral agencies, the Office of the Comptroller, and the Department of Education (“DOE”)), 21 had zero approved subcontract records in PASSPort associated with LL 174-eligible prime contracts registered since FY22. DDC was the holder of the largest number of LL 174-eligible contracts among this group. Without comprehensive subcontract records in PASSPort, there is still insufficient detail for oversight agencies to measure that agencies and vendors are both compliant with and progressing towards achieving required M/WBE participation goals.
Spend
In addition to analyzing contract registration data, this Report also summarizes data relating to the City’s actual payments to vendors. This includes all payments made to both prime and sub vendors in FY25 (regardless of the year the contract was registered in).
To determine what spending was subject to LL 174 performance goals, individual transactions were mapped to their corresponding contract or purchase order. LL 174 exclusions were then applied based on the characteristics of the contracts or POs associated with vendor payments.
The City spent a total of $5.57 billion in FY25 (prime contracts registered in FY25 and prior fiscal years subject to LL 174 participation goals), 14.17% of which ($789.3 million) was spent with M/WBE primes.
Table 6: Prime Spend Subject to LL 174 Participation Goals, FY23-25
| FY23 | FY24 | FY25 | ||||
|---|---|---|---|---|---|---|
| Certification Type | Total Registered Value | % Share of Value | Total Registered Value | % Share of Value | Total Registered Value | % Share of Value |
| M/WBE | $535,426,657 | 11.58% | $583,647,446 | 12.11% | $789,306,051 | 14.17% |
| Non-Certified | $4,087,560,365 | 88.42% | $4,234,948,190 | 87.89% | $4,779,585,050 | 85.83% |
| Grand Total | $4,622,987,022 | 100.00% | $4,818,595,636 | 100.00% | $5,568,891,101 | 100.00% |
By Industry
M/WBE utilization varies depending on the industry. The construction services and standard services industries see some of the lowest relative shares of registration and spending values to M/WBEs. Only 10.11% of the value of construction services and 23.59% of the value of standard services prime contract registrations subject to LL 174 participation goals were registered to M/WBEs. Similarly, only 9.52% of prime construction services spending and 8.09% of prime standard services spending was with M/WBEs. Additional analyses of M/WBE utilization at the industry level can be found in the “M/WBE Utilization by Industry” section of this Report.
Table 7: FY25 Value of M/WBE Contracts and POs Subject to LL 174 Participation Goals, by Industry
| M/WBE | Non-Certified | |||
|---|---|---|---|---|
| Industry | Total Value | % Share of Value | Total Value | % Share of Value |
| Construction[20] | $435,084,107 | 10.11% | $3,867,132,869 | 89.89% |
| Goods <$1 million | $117,643,981 | 68.12% | $55,055,280 | 31.88% |
| Professional Services | $772,748,956 | 45.28% | $933,699,800 | 54.72% |
| Standard Services | $126,876,828 | 23.59% | $410,954,140 | 76.41% |
| Grand Total | $1,475,981,884 | 21.72% | $5,319,845,538 | 78.28% |
The average contract size will vary across these industries, therefore prime vendor spend analyses yield different results.
Table 8: FY25 Prime Vendor Spend Subject to LL 174 Participation Goals, by Industry
| M/WBE | Non-Certified | |||
|---|---|---|---|---|
| Industry | Total Value | % Share of Value | Total Value | % Share of Value |
| Construction | $276,052,751 | 9.52% | $2,624,249,668 | 90.48% |
| Goods <$1 million | $97,009,108 | 49.29% | $99,802,082 | 50.71% |
| Professional Services | $315,228,769 | 25.78% | $907,519,801 | 74.22% |
| Standard Services | $101,015,423 | 8.09% | $1,148,013,499 | 91.91% |
| Grand Total | $789,306,051 | 14.17% | $4,779,585,050 | 85.83% |
It is important to note that these trends look different for subcontracted spending across industries. In FY25, M/WBEs receive higher shares of subcontracted spending than Non-Certified firms in professional services and standard services.
Table 9: FY25 Subcontractor Spend Subject to LL 174 Participation Goals, by Industry
| M/WBE | Non-Certified | |||
|---|---|---|---|---|
| Industry | Total Value | % Share of Value | Total Value | % Share of Value |
| Construction | $89,714,026 | 49.62% | $91,087,841 | 50.38% |
| Goods <$1 million | $0 | N/A | $0 | N/A |
| Professional Services | $31,244,408 | 66.46% | $15,769,318 | 33.54% |
| Standard Services | $21,760,837 | 78.22% | $6,058,991 | 21.78% |
| Grand Total | $142,719,271 | 55.83% | $112,916,150 | 44.17% |
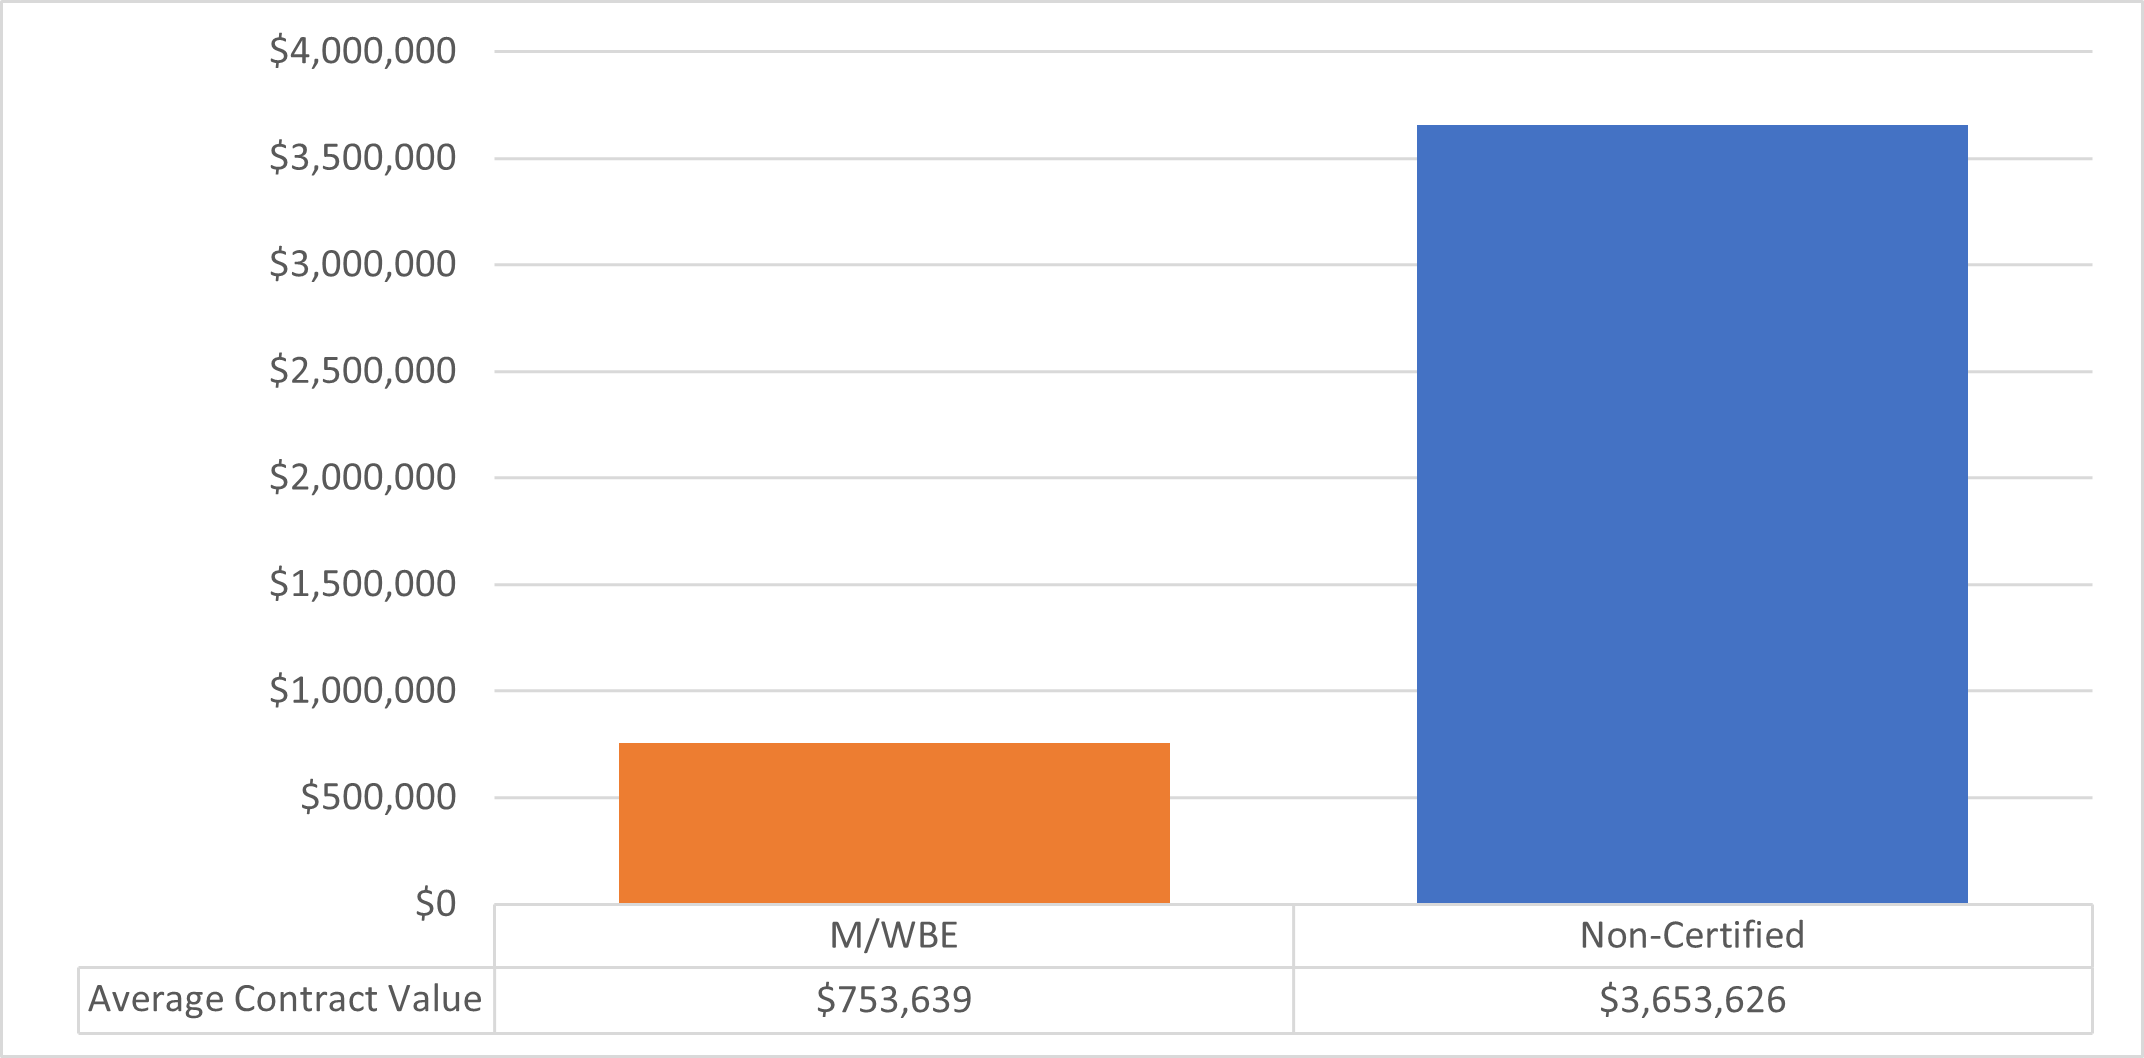
M/WBEs win contracts that are worth a small fraction of the value of contracts won by non-certified firms
In FY25, M/WBEs accounted for 64.67% of the volume of new contract registrations and POs subject to LL 174 participation goals. However, these contracts only account for 8.43% of the respective value.[21]
Year-over-year analyses show a key factor contributing to the City’s underutilization of M/WBEs: among FY25 registrations subject to LL 174 participation goals, the average dollar value of a prime contract registered to a M/WBE ($753,639). Though this average value shows a 50% increase from FY24, this figure is still only approximately 20% of the average dollar value of a prime contract registered to a Non-Certified firm ($3.65 million).
Furthermore, much of the increase in M/WBE average value can be attributed to 8 Multiple Master Award (“MMA1”) contracts for on-call engineering services registered by DDC that were valued at $50 million each. MMA1s are registered with estimated values, which are often poor indicators of what the agency will actually spend with the awarded vendor. The FY24 Annual Report on M/WBE Procurement included a specialized focus on MMA1s which found that the City often underspends against MMA1s and may not ultimately utilize them at all.
Chart 7: FY25 Average Value of Contracts Subject to LL 174 Participation Goals[22]
Award Method Analyses
A tension exists in the City’s M/WBE procurement: Award methods with agency discretion – such as Micropurchase, Small Purchase, and the M/WBE Small Purchase method – are more likely to result in a prime contract with an M/WBE; however, these discretionary methods generally result in lower-dollar-value contracts. That said, even within more competitive methods – both Competitive Sealed Bid (“CSB”) and Competitive Sealed Proposal (“CSP”) – the average contract value for M/WBEs is far lower than for Non-Certified firms.
This analysis also underscores the need for more stringent goal-setting and subcontractor tracking and reporting. In FY25, 96.36% of Negotiated Acquisition contracts were registered to Non-Certified firms. While the basis for using the Negotiated Acquisition method is largely dictated by a limited availability of vendors which therefore makes it difficult to implement policy directives to encourage increased prime contracting, it highlights procurement opportunities where the City could achieve higher M/WBE utilization through subcontracting.
Additional information about each of these procurement methods can be found in Appendix A of this Report.
Table 10: FY25 Contracts by Award Method, Citywide[23]
| M/WBE | Non-Certified | |||
|---|---|---|---|---|
| Award Method Category | # of Contracts | % Share of Contracts | # of Contracts | % Share of Contracts |
| CSB | 112 | 24.83% | 339 | 75.17% |
| CSP | 65 | 11.28% | 511 | 88.72% |
| Accelerated Procurement | 11 | 18.97% | 47 | 81.03% |
| Demonstration Project | 0 | 0.00% | 4 | 100.00% |
| Innovative Procurement | 7 | 36.84% | 12 | 63.16% |
| Micropurchase | 47,847 | 24.95% | 143,900 | 75.05% |
| Negotiated Acquisition | 35 | 3.64% | 927 | 96.36% |
| Small Purchase Contracts – General | 1,411 | 35.91% | 2,518 | 64.09% |
| M/WBE Small Purchase method | 1,118 | 100.00% | 0[24] | 0% |
| Grand Total | 31,759 | 18.81% | 137,080 | 81.19% |
All of the major procurement methods result in far less than a third of the contracts going to M/WBEs. While M/WBEs fare better in some discretionary procurement methods that have specified maximum values, those do not yield meaningful spend given the low value of the thresholds. For example, M/WBEs account for 24.94% of micro-purchase contracts that have a threshold cap of $35,000 for construction and $20,000 for all other procurements.
Even within these lower-value methods, M/WBEs are registering contracts at average values far below the caps. During FY25, the M/WBE Small Purchase method was capped at a maximum value of $1,500,000, but the average value of a contract registered using this method was only $325,553. This Report includes a specialized focus on this method: “Examining the M/WBE Small Purchase Method”.
Table 11: FY25 Average Value of Contracts by Award Method, Citywide
| Award Method | M/WBE Average Contract Value |
Non-certified Average Contract Value |
|---|---|---|
| CSB | $4,543,885 | $15,171,715 |
| CSP | $9,676,233 | $14,512,668 |
| Accelerated Procurement | $574,382 | $2,678,614 |
| Demonstration Project | $0 | $732,813 |
| Innovative Procurement | $3,821,346 | $912,513,558 |
| Micropurchase | $3,558 | $2,546 |
| Negotiated Acquisition | $3,480,259 | $4,247,079 |
| Small Purchase Contracts – General | $29,824 | $28,752 |
| M/WBE Small Purchase method | $325,553 | 0 |
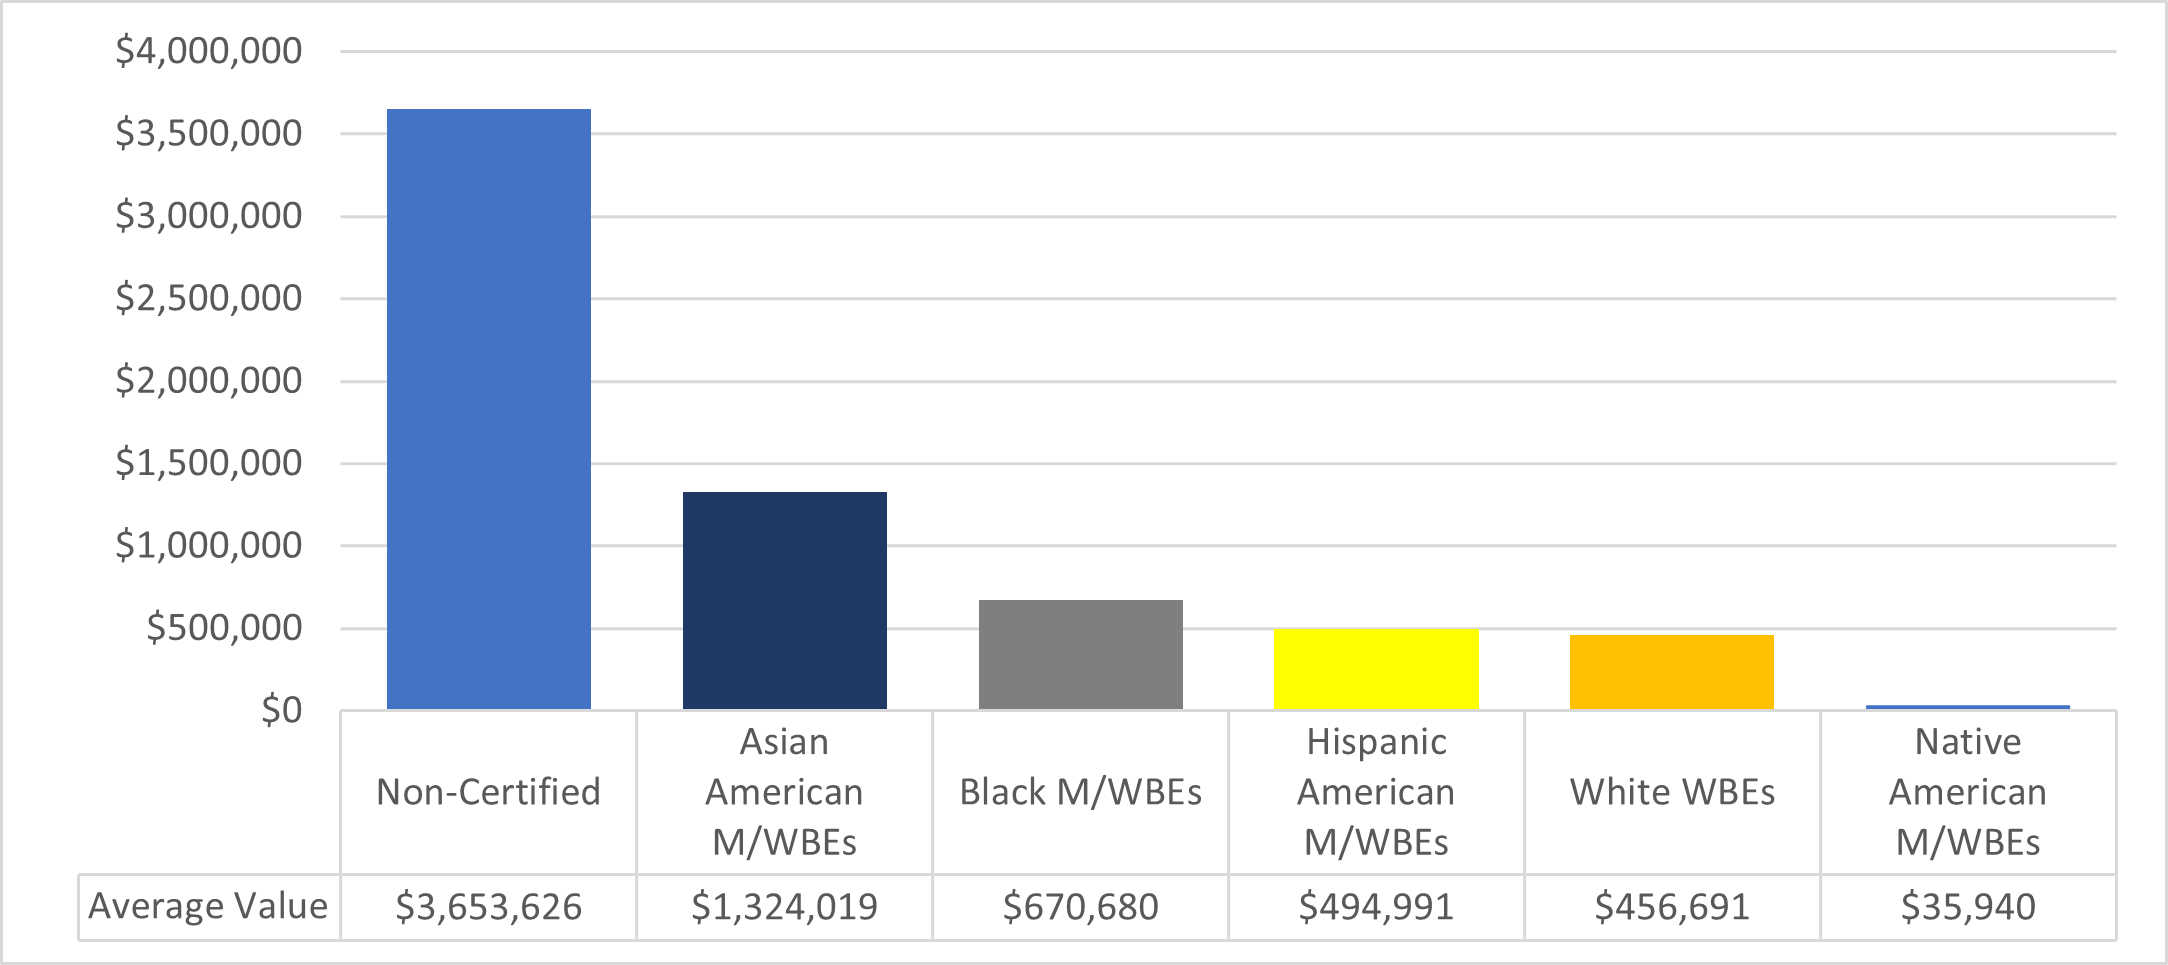
Disaggregated By Race
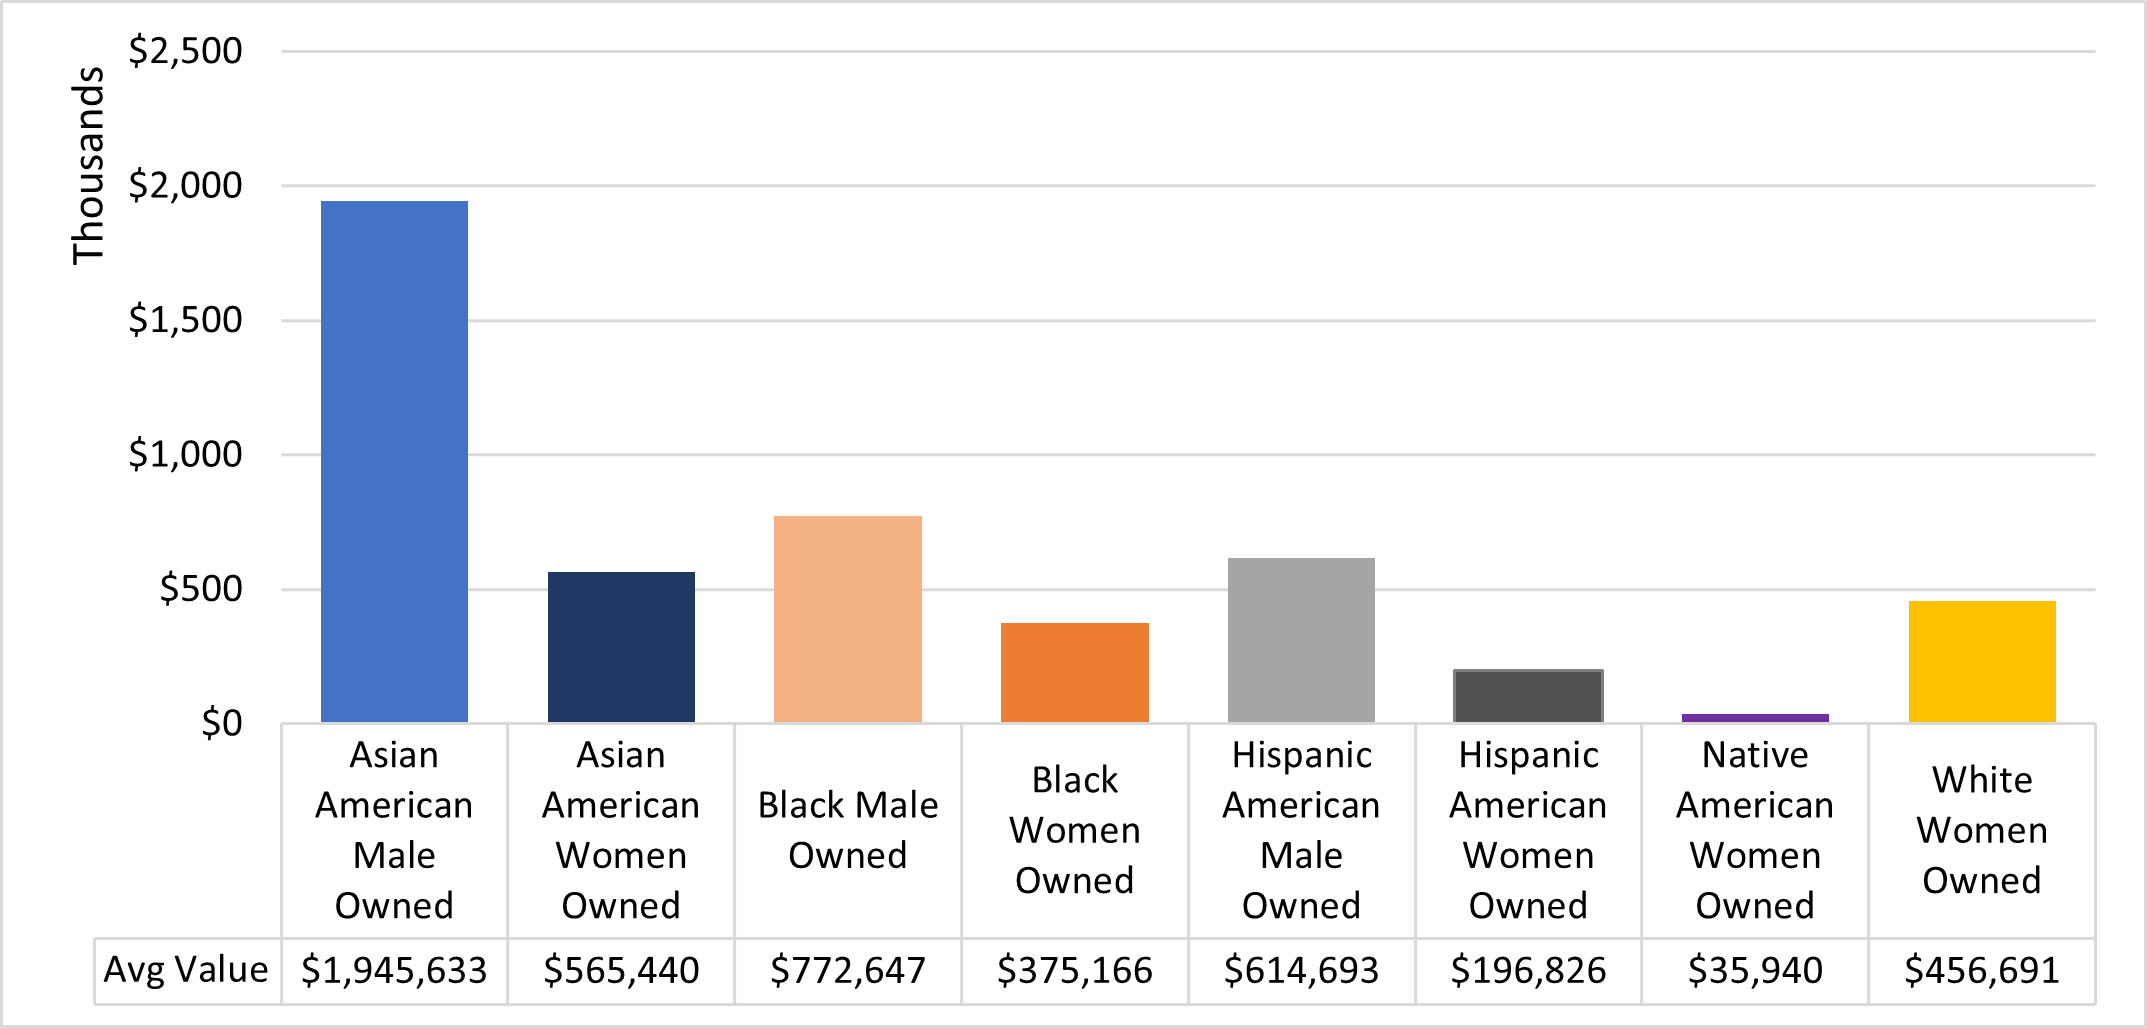
Certain underutilized M/WBE categories earn less lucrative contracts than others. Businesses owned by white women and Asian American males have much higher average values than those owned by Black people, Hispanic American people, and Native American people.
Chart 8: FY25 Average Value of Contracts Subject to LL 174 Participation Goals, by M/WBE Category[25]
The “Disparity within the Disparity”
The City underutilizes all M/WBEs across all racial and gender categories. Therefore, in order to meaningfully support all M/WBEs, the overall share of the City’s contracting portfolio going to M/WBEs must be increased. Otherwise, it will continue to assess mere pennies across M/WBEs.
When there is utilization within the M/WBE community, the data reveals that certain M/WBE categories are more successful at winning prime contracts than others. It may be worth noting that M/WBEs of all gender and ethnic categories more frequently do business with the City as subcontractors. However, our Office does not have access to this data due to the lack of adequate subcontractor reporting. Therefore, it is likely that the share of the City’s contract value that is ultimately spent with M/WBEs is higher.
Overall, the City’s utilization of MBEs owned by women is significantly less than the already-low utilization of MBEs owned by males. Within each racial category, male-certified firms consistently represent larger shares of the counts and value of registered contracts and POs. Male-owned MBEs account for over 8 times (15,645) the count of registered contracts and POs than women-owned MBEs (1,877). Only 13.75% of the value of contracts and POs subject to LL 174 that were registered to M/WBEs were registered to MBEs owned by women. There were nearly twelve times as many contracts and POs registered to Asian American male-owned MBEs than there were to Asian American women-owned MBEs.
Only 1.65% of the value of prime contracts and POs subject to LL 174 participation goals were registered to Black M/WBEs, and only 1.12% of the value were registered to Hispanic American M/WBEs.[26]
In a completely lone state, the City remains largely unsuccessful in contracting with businesses owned by Native Americans. The SBS Directory only includes 16 firms certified as Native American.[27] The City has registered just 1 contract to a women-owned Native American firm since FY21.
Table 12: FY25 Contracts and POs Subject to LL 174 Participation Goals, by M/WBE Category and Gender
| M/WBE Category | # of LL Contracts and POs | % Share of LL Contracts and POs | Total LL Contract and PO Value | % Share of LL Contract and PO Value | % Share of All M/WBE LL Value |
|---|---|---|---|---|---|
| Asian American male-owned MBEs |
13,357 | 42.05% | $579,803,429 | 3.31% | 39.28% |
| Asian American women-owned MBEs |
1,116 | 3.51% | $136,677,224 | 0.78% | 9.26% |
| Black male-owned MBEs | 1,045 | 3.29% | $247,317,442 | 1.41% | 16.76% |
| Black women-owned MBEs | 371 | 1.17% | $42,524,883 | 0.24% | 2.88% |
| Hispanic American male-owned MBEs |
1,230 | 3.87% | $173,462,832 | 0.99% | 11.75% |
| Hispanic American women-owned MBEs |
389 | 1.22% | $23,642,517 | 0.13% | 1.60% |
| Native American male-owned MBEs |
13 | 0.04% | $99,465 | 0.00% | 0.01% |
| Native American women-owned MBEs |
1 | 0.00% | $35,940 | 0.00% | 0.00% |
| White WBEs | 3,017 | 9.50% | $272,418,151 | 1.56% | 18.46% |
| M/WBE ALL (Excluding Non-Certified) | 20,539 | 64.67% | 1,475,981,884 | 8.43% | 100.00% |
| Non-Certified | 11,222 | 35.33% | $16,040,808,354 | 91.57% | N/A |
| Grand Total | 31,761 | 100.00% | $17,516,790,238 | 100.00% | N/A |
Chart 9: Value of Contracts and POs Subject to LL 174 Participation Goals, by M/WBE Category, FY23-25[28]
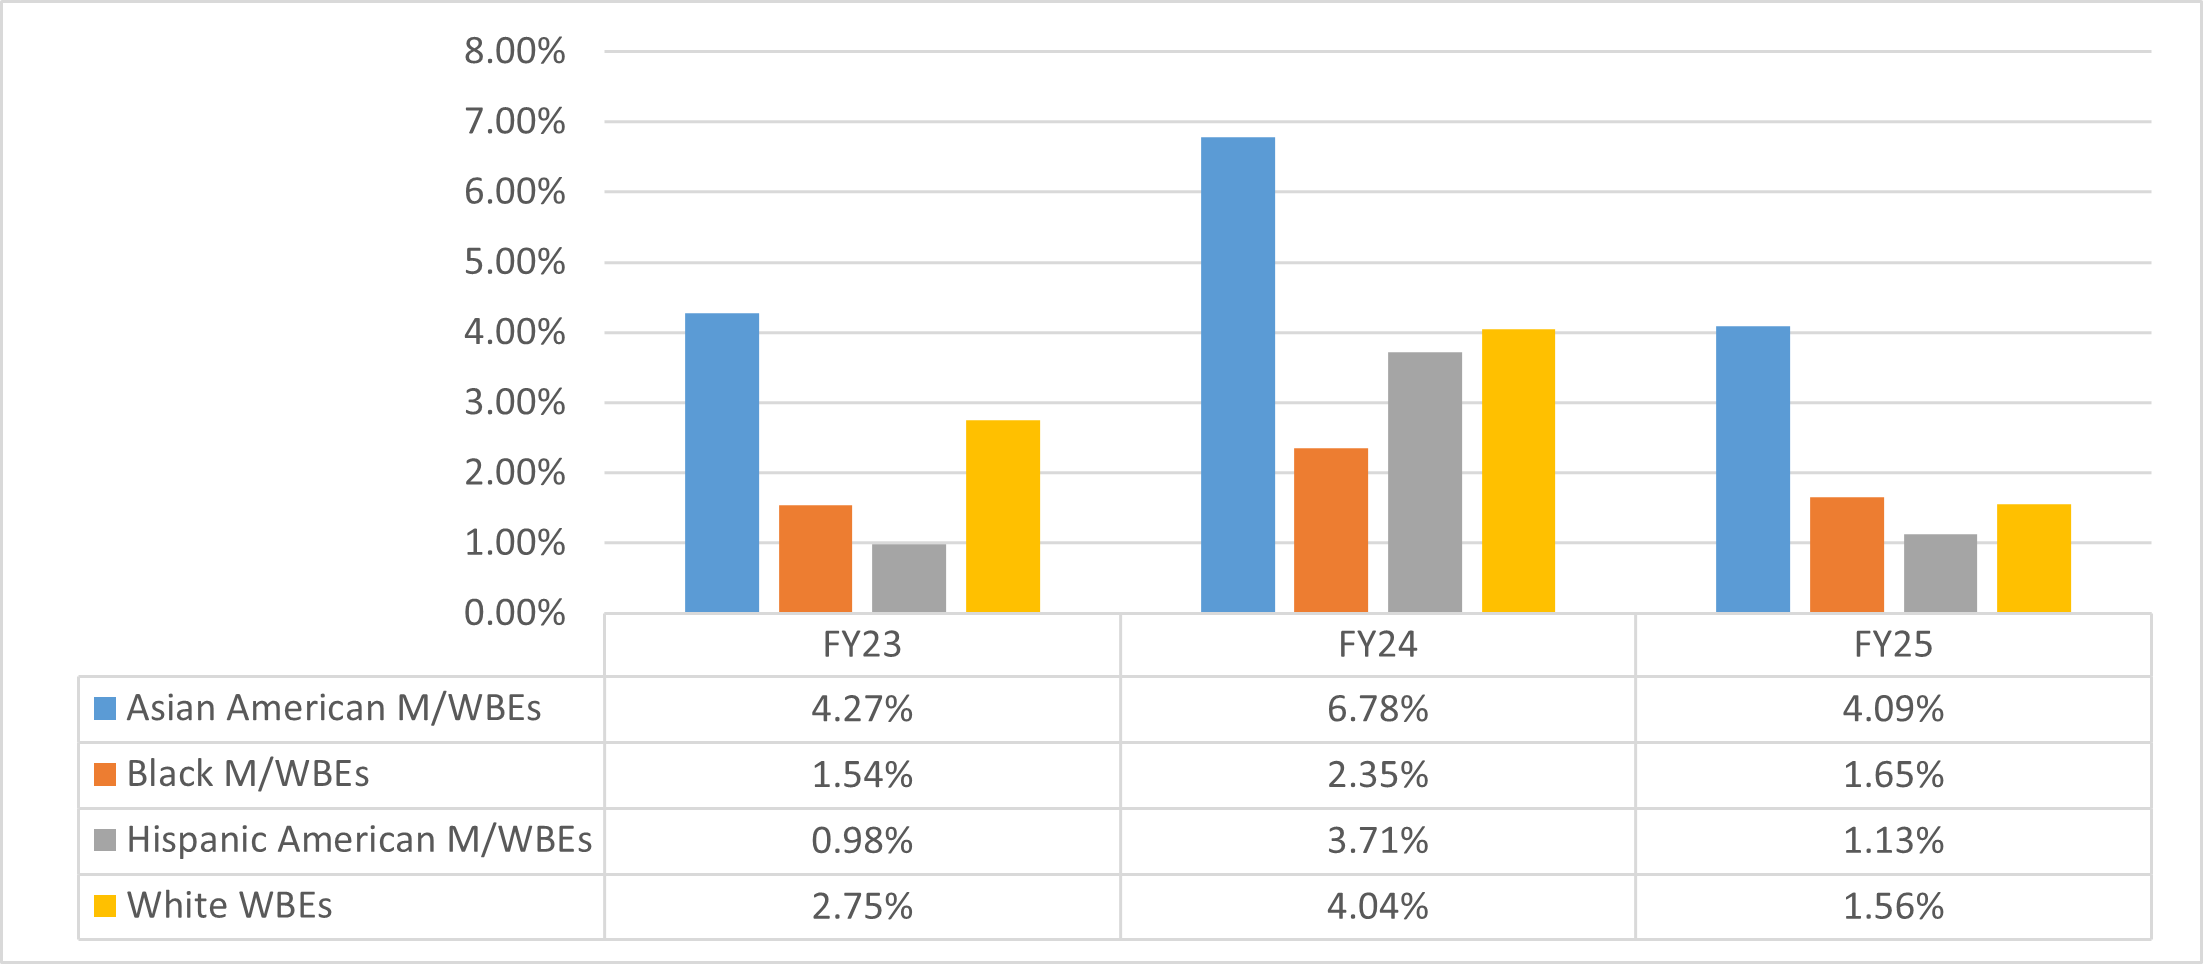
Table 13: FY25 M/WBE Contracts and POs Subject to LL 174 Participation Goals, as a Share of Total M/WBE Contracts, by M/WBE Category
| M/WBE Category | # of Contracts and POs | % of M/WBE Contracts and POs | Total Value | % Share of M/WBE value | % Share of All LL Value |
|---|---|---|---|---|---|
| Asian American M/WBEs | 14,473 | 70.47% | $716,480,654 | 48.54% | 4.09% |
| Black M/WBEs | 1,416 | 6.89% | $289,842,326 | 19.64% | 1.65% |
| Hispanic American M/WBEs | 1,619 | 7.88% | $197,105,349 | 13.35% | 1.13% |
| Native American M/WBEs | 14 | 0.07% | $135,405 | 0.01% | 0.00% |
| White WBEs | 3,017 | 14.69% | $272,418,151 | 18.46% | 1.56% |
| Grand Total | 20,539 | 100.00% | $1,475,981,884 | 100.00% | 8.43% |
These trends are true in analyzing both contract registrations and spend data – though, both Black M/WBEs and Hispanic American M/WBEs received an even smaller portion of prime spending in comparison to other M/WBE categories.
Table 14: FY25 Prime Spending Subject to LL 174 Participation Goals, by M/WBE Category
| M/WBE Category | Total Spend | % Share of Total LL 174 Spending | % Share of Total M/WBE Spending |
|---|---|---|---|
| Asian American M/WBE | $359,663,667 | 6.46% | 45.57% |
| Black M/WBEs | $107,942,872 | 1.94% | 13.68% |
| Hispanic American M/WBEs | $139,383,535 | 2.50% | 17.66% |
| Native American M/WBEs | $237,840 | 0.00% | 0.03% |
| White WBEs | $182,078,137 | 3.27% | 23.07% |
| Non-Certified | $4,779,585,050 | 85.83% | N/A |
| Grand Total | $5,568,891,101 | 100.00% | 100% |
Chart 10: FY25 Average Value of Contracts Subject to LL 174 Participation Goals, by Race and Gender
Most M/WBEs don’t benefit from City contracting
As of June 30, 2025, there were 11,382 City-certified M/WBEs in the SBS Directory. There was only a net increase of 614 certified firms from the beginning of the Mayor Adams administration.[29] This is a stark contrast to the certification efforts of the previous Mayor de Blasio administration, which expanded the number of total number of City-certified M/WBEs by 3,891 in a comparable four fiscal year period.[30] The City should be strategically expanding the pool of M/WBEs and should carefully review its outreach and engagement strategy to develop ambitious and realistic targets for certifying M/WBEs that offer the goods and services frequently procured by the City.
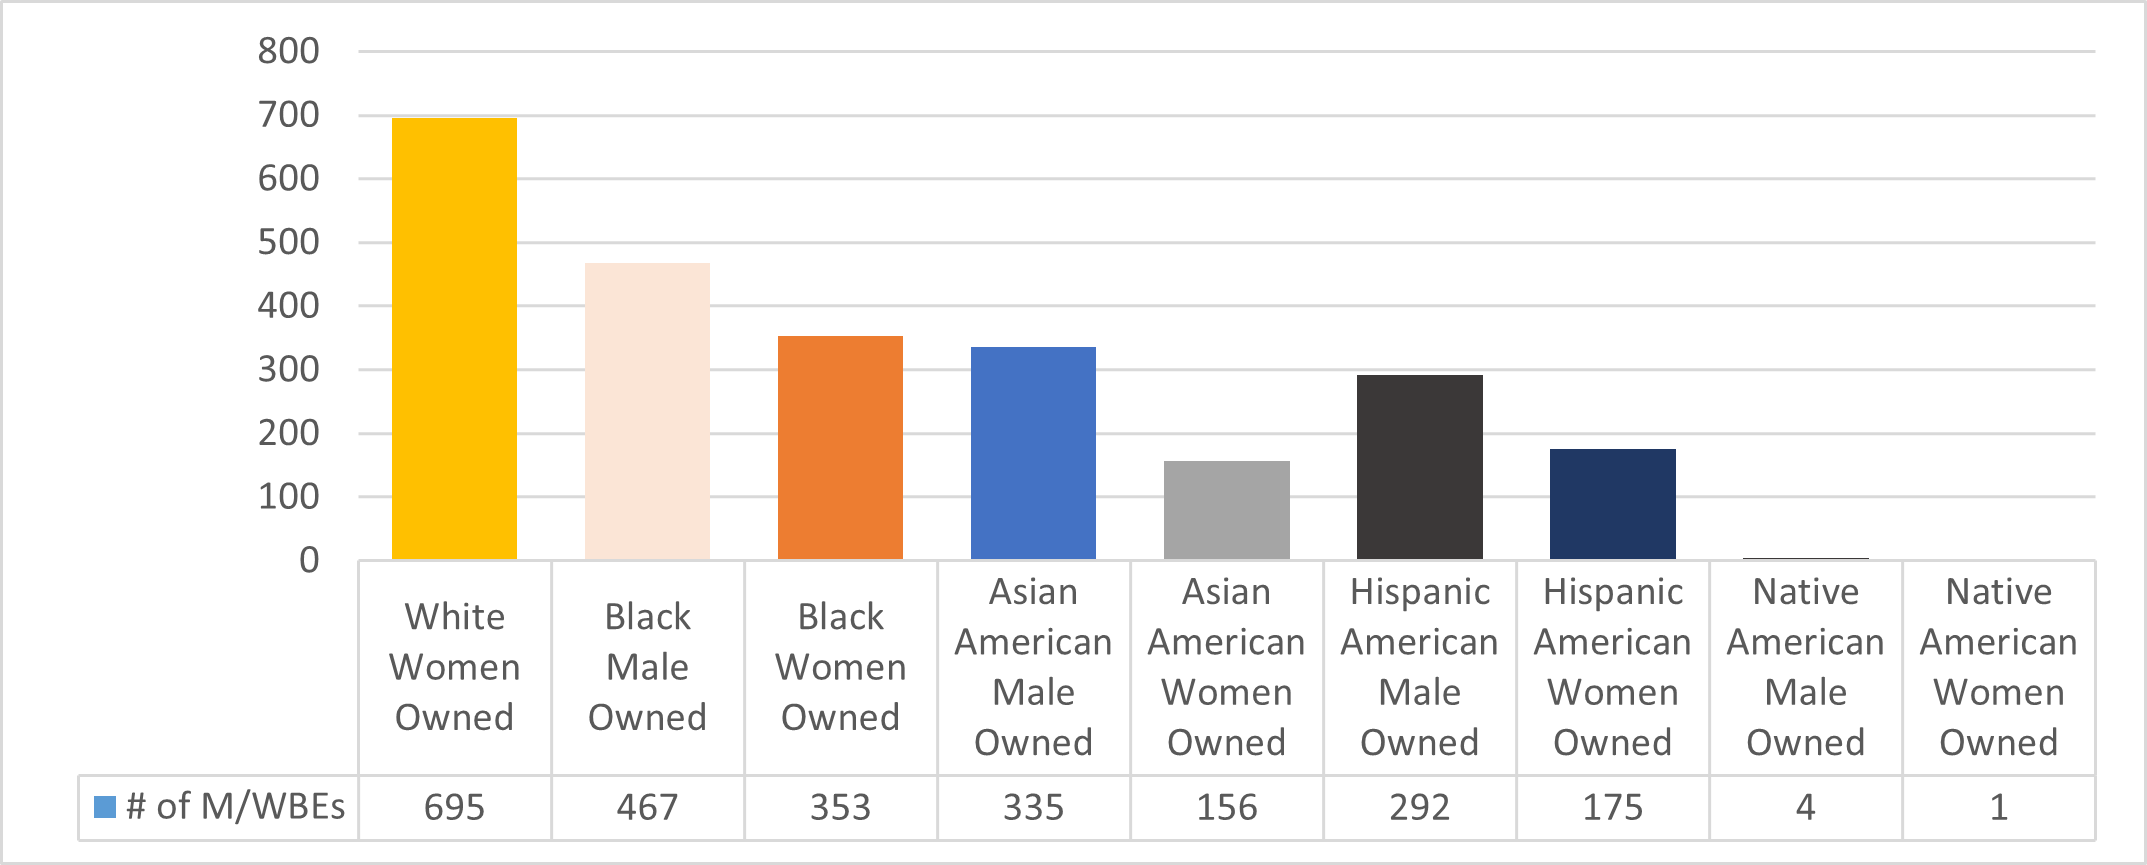
In FY25, 2,478 certified M/WBEs entered a new contract, subcontract, or PO with the City. This only represents 21.77% of all certified M/WBEs. White WBEs made up the largest share of M/WBEs with a new contract, subcontract, or PO in FY25.
Table 15: Unique M/WBEs with New Prime Contracts, POs, or Subcontracts, FY23-25
| M/WBE Category | FY23 | FY24 | FY25 |
|---|---|---|---|
| Asian American Male Owned | 348 | 332 | 335 |
| Asian American Women Owned | 152 | 144 | 156 |
| Black Male Owned | 430 | 455 | 467 |
| Black Women Owned | 311 | 323 | 353 |
| Hispanic American Male Owned | 322 | 317 | 292 |
| Hispanic American Women Owned | 164 | 159 | 175 |
| Native American Male Owned | 2 | 4 | 4 |
| Native American Women Owned | 0 | 0 | 1 |
| White Women Owned | 775 | 731 | 695 |
| All Male Owned (Not Reflected in “Total”) | 1,102 | 1,108 | 1,098 |
| All Women Owned (Not Reflected in “Total”) | 1,402 | 1,357 | 1,380 |
| Grand Total | 2,504 | 2,465 | 2,478 |
Chart 11: FY25 Unique M/WBEs with New Prime Contracts, POs, or Subcontracts
Nearly Two-Thirds of contracts awarded to M/WBEs are registered late
In FY25, about 65% of new contracts with M/WBEs were registered retroactively, meaning after the beginning of their contract term. This compares to a 72.64% rate for contracts citywide. These unnecessary delays force M/WBEs to either advance funds out of limited working capital, to seek to borrow in order to start the project, or to delay work. In some circumstances, it means M/WBEs are providing City services without any guarantee of pay. This is especially challenging given that average M/WBE contract sizes are smaller, and that many M/WBEs are small businesses that lack surplus working capital and may have a more challenging time borrowing from traditional lending institutions.
Table 16: FY25 New M/WBE Contract Registrations by Retroactive Category, Citywide
| Retroactive Category | # of Contracts | % Share of Contracts | Total Contract Value | % Share of Contract Value |
|---|---|---|---|---|
| On Time or Early | 865 | 35.04% | $893,371,169 | 39.78% |
| Late – Within 30 Days | 771 | 31.23% | $565,762,131 | 25.19% |
| Later – Between 31-180 Days | 644 | 26.08% | $453,428,326 | 20.19% |
| Very Late – Between 181-365 Days | 131 | 5.31% | $241,556,534 | 10.76% |
| Latest – More than 1-Year | 58 | 2.35% | $91,761,144 | 4.09% |
| Grand Total | 2,469 | 100.00% | $2,245,879,305 | 100.00% |
The M/WBE Small Purchase method is intended to be a faster and more nimble procurement tool; however, retroactivity rates are still consistently high for contracts registered using this method. This Office has delegated its authority to allow most agencies, with appropriate oversight measures, to self-register contracts procured pursuant to this method.[31] This self-registration delegation is conditioned upon existing compliance checks and additional reporting and analyses shared with this Office on a quarterly basis. This Office continues to monitor the effectiveness and use of this method to ensure that timely, appropriate, and transparent oversight remains in place to safeguard public spending and ensure accountability.
In doing so, M/WBEs that have been awarded contracts procured by agencies through this method do not wait up to 30 calendar days for their contract to be reviewed and registered by this Office which helps to reduce potential delays in payment. Yet, despite the time savings this delegation provides, agencies are still self-registering the vast majority of contracts after their start date. The City must examine the processes and procedures for the use of this method to better understand why the designed time-saving measures have not resulted in M/WBE contracts being registered on time.
Table 17: FY25 M/WBE Small Purchase Method Registrations by Retroactive Category, Citywide
| Retroactive Category | # of Contracts | % Share of Contracts | Total Contract Value | % Share of Contract Value |
|---|---|---|---|---|
| On Time or Early | 373 | 33.36% | $123,821,024 | 34.02% |
| Late – Within 30 Days | 330 | 29.52% | $97,478,508 | 26.78% |
| Later – Between 31-180 Days | 354 | 31.66% | $122,470,792 | 33.65% |
| Very Late – Between 181-365 Days | 53 | 4.74% | $18,241,616 | 5.01% |
| Latest – More than 1-Year | 8 | 0.72% | $1,955,948 | 0.54% |
| Grand Total | 1,118 | 100.00% | $363,967,889 | 100.00% |
Table 18: FY25 Volume of Retroactive M/WBE Contracts, by Award Method
| Award Method | # of Contracts | % of contracts registered late |
|---|---|---|
| M/WBE SP | 1,118 | 66.64% |
| CSB | 112 | 45.54% |
| CSP | 65 | 81.54% |
| Innovative | 7 | 71.43% |
| Negotiated Acquisition | 35 | 91.43% |
Examining the M/WBE Small Purchase Method
The M/WBE Small Purchase method allows agencies to solicit only M/WBEs for specified purchases up to $1.5 million. This threshold is significantly higher than those for other purchase methods with limited competition, like micro- and small purchases.[32] This Office has been closely monitoring the use of this method, as it makes up a notable share of contract registrations for M/WBEs (45.28% in FY25). In FY25 city agencies registered 1,118 contracts via the M/WBE Small Purchase method, valued at over $363 million.[33]
Table 19: Contracts Registered via M/WBE Small Purchase Method, Citywide, FY22-25
| Fiscal Year | # of M/WBE SP Registrations | M/WBE SP % Share of All M/WBE Registrations | Total Value of M/WBE SPs | AVG Contract Value of M/WBE SPs |
|---|---|---|---|---|
| FY22 | 904 | 47.48% | $120,386,966 | $133,171 |
| FY23 | 1,011 | 43.06% | $188,220,838 | $186,173 |
| FY24 | 1,113 | 46.36% | $272,918,549 | $245,210 |
| FY25 | 1,118 | 45.28% | $363,967,889 | $325,553 |
In FY25, city agencies used the M/WBE Small Purchase method more, and for a higher individual contract value, than in prior fiscal years. The average value of a contract registered using this method was $325,553.[34] However, FY25 registration data illustrates that many agencies focused their use of this method for procurements valued far below the maximum threshold. Nearly 65% of contracts registered using this method were valued below $250,000, just a sixth of the maximum value permitted by the Rule. Only 100 contracts registered using this method in FY25 were valued over $1 million. Over half (51%) of the contracts registered using this method did not exceed $150,000, the initial cap set back in 2017 and which is only $50,000 more than the cap for the Small Purchase method, which already has latitude for discretion to award to M/WBEs.
Chart 12: Average Value of Contracts Registered via M/WBE Small Purchase Method, Citywide, FY22-FY25
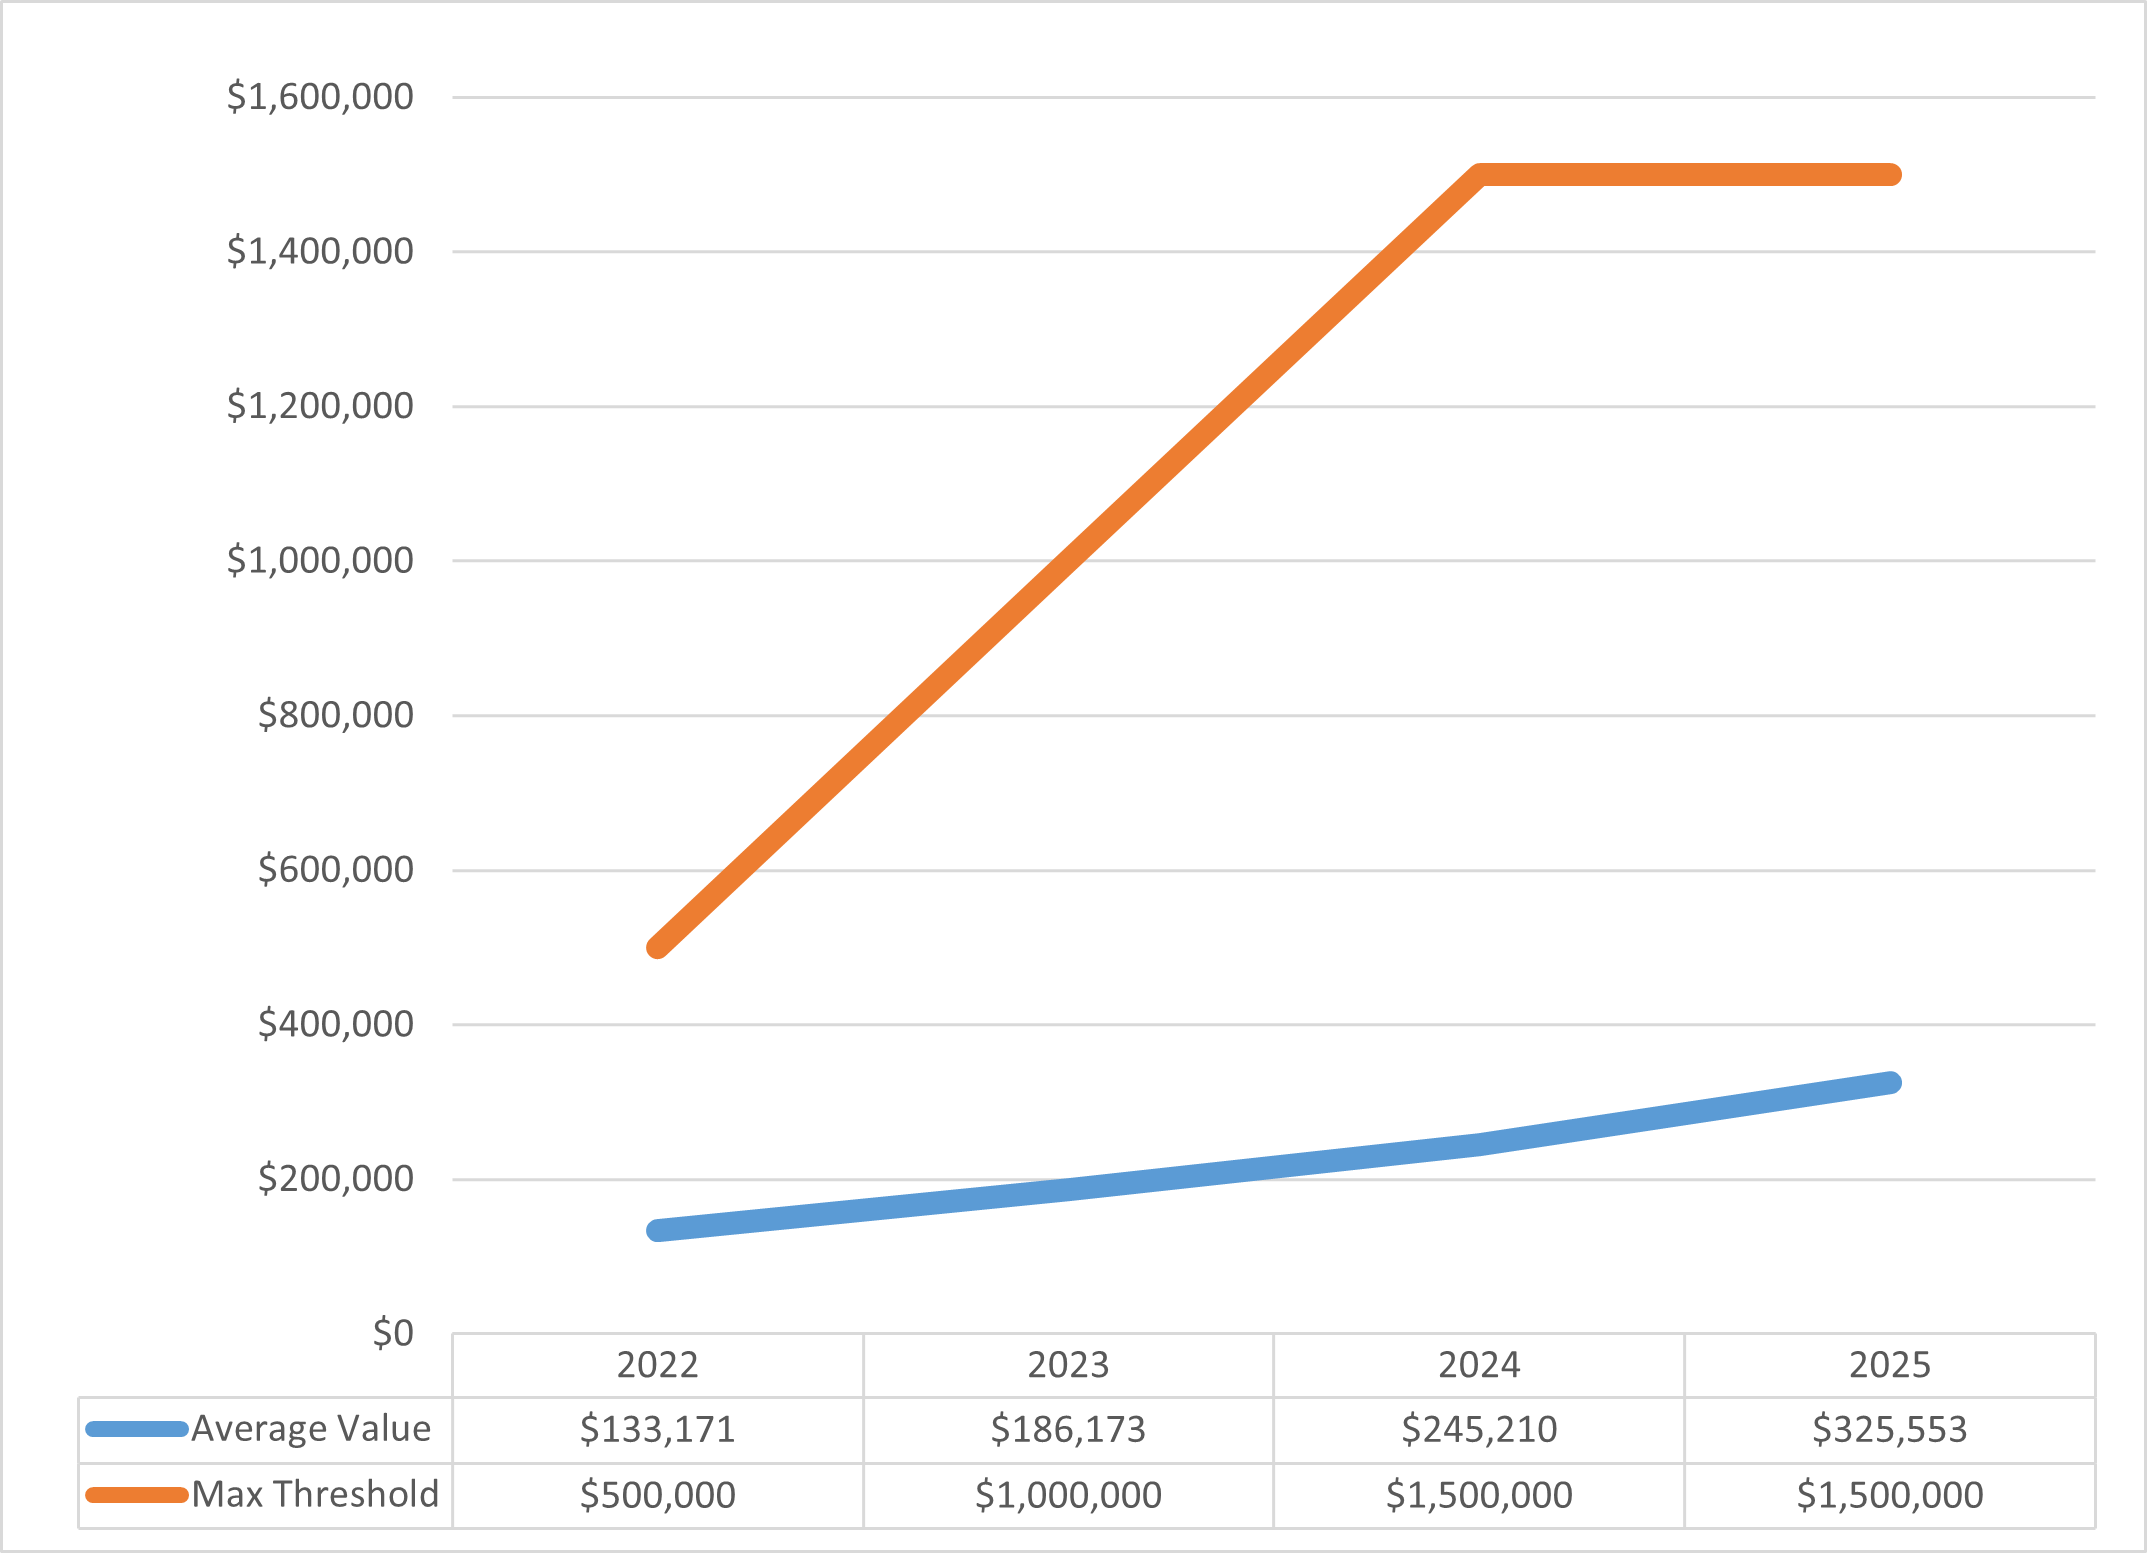
Chart 13: Volume of Contracts Registered via M/WBE Small Purchase Method, Citywide, FY22-FY25[35]
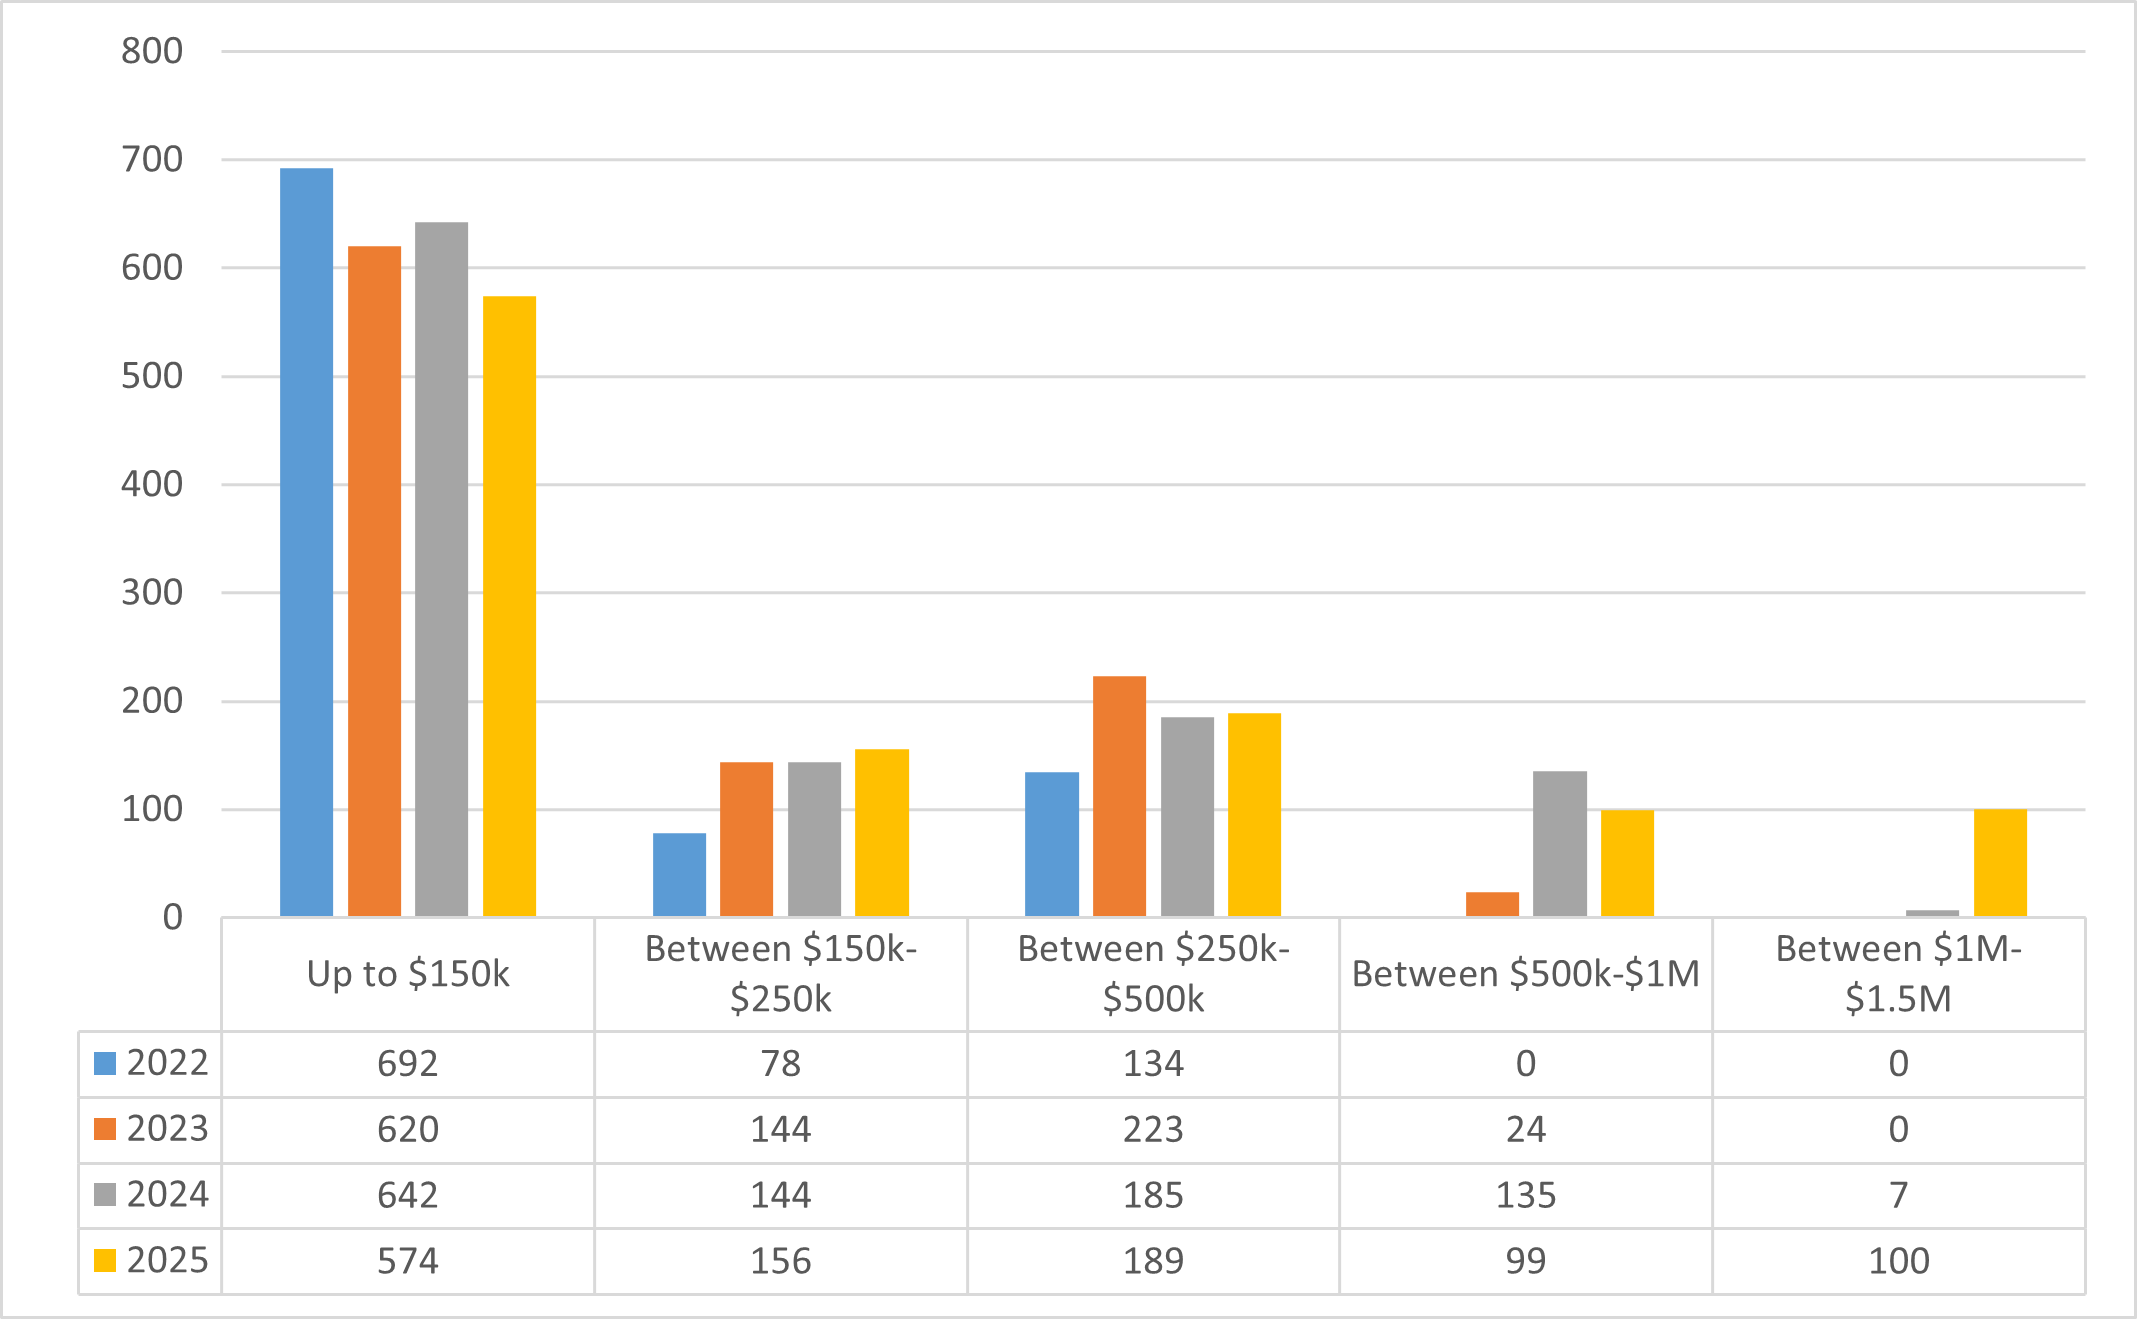
Table 20: FY25 Contracts Registered via M/WBE Small Purchase Method, Citywide, by M/WBE Category[36]
| Contract Value | Asian American | Black | Hispanic American | White WBE | Native American | Total | Percent |
|---|---|---|---|---|---|---|---|
| Up to $150K | 142 | 164 | 180 | 88 | 0 | 574 | 51.34% |
| Between $150K-$250K | 58 | 56 | 23 | 19 | 0 | 156 | 13.95% |
| Between $250K-$500K | 74 | 51 | 29 | 35 | 0 | 189 | 16.91% |
| Between $500K-$1M | 26 | 27 | 20 | 26 | 0 | 99 | 8.86% |
| Between $1M-$1.5M | 26 | 24 | 25 | 25 | 0 | 100 | 8.94% |
| Grand Total | 326 | 322 | 277 | 193 | 0 | 1,118 | 100.00% |
M/WBE Small Purchase method registrations are relatively evenly distributed across racial categories. Women-owned firms continued to fare worse than their male-owned counterparts across racial categories, excepting Asian American M/WBEs.
Table 21: FY25 Contracts Registered via the M/WBE Small Purchase Method, Citywide, by M/WBE Category
| M/WBE Category | # of M/WBE SP Contracts | M/WBE SP Share of Total M/WBE Category Registrations | Percent of All M/WBE SP Registrations | AVG M/WBE SP Value |
|---|---|---|---|---|
| Asian American male-owned MBEs | 120 | 3.33% | 10.73% | $367,037 |
| Asian American women-owned MBEs | 206 | 5.72% | 18.43% | $295,720 |
| Black male-owned MBEs | 247 | 6.86% | 22.09% | $286,885 |
| Black women-owned MBEs | 75 | 2.08% | 6.71% | $355,656 |
| Hispanic American male-owned MBEs | 215 | 5.97% | 19.23% | $253,776 |
| Hispanic American women-owned MBEs | 62 | 1.72% | 5.55% | $398,696 |
| Native American male-owned MBEs | 0 | 0.00% | 0.00% | $0 |
| White WBEs | 193 | 5.36% | 17.26% | $425,851 |
| Grand Total | 1,118 | N/A | 100.00% | $325,553 |
The City Can’t Measure Missing Subcontractor Data
Subcontracting is an essential vehicle for M/WBEs to do work with the City and many prime vendors are required to subcontract work to fulfill M/WBE participation goals. However, very little subcontract information is available to City oversight agencies and the public. Due to a historic overreliance on a paper-based approval process and lack of monitoring and enforcement by City agencies, vendors continue to underreport subcontract data in the City’s systems of record. Not only does this lack of transparency increase the risk of unfair practices in the subcontracting space, but it also prevents agencies from accurately assessing compliance with mandated subcontracting goals. It also makes it challenging to identify subcontracting areas and M/WBEs certification categories to better focus outreach efforts on future solicitations.
Since FY22, the City has registered LL 174 eligible contracts valued at nearly $33 billion that have 0 associated subcontract records. Though many of these contracts may not have had any work completed by subcontractors, it is very likely that a substantial portion of these contracts were ultimately paid to subcontractors for which the City has no centralized record. Without these records, the City has risked significant compliance issues and has lacked essential oversight to ensure that prime contractors have met their agreed-upon M/WBE goals.
The City must strengthen its procedures and oversight to ensure that prime contractors are recording subcontractor records in PASSPort. Public access to this information would help the City better safeguard public dollars from misuse, inform future subcontracting opportunities for interested M/WBEs, and improve the City’s ability to track its progress against M/WBE performance goals.
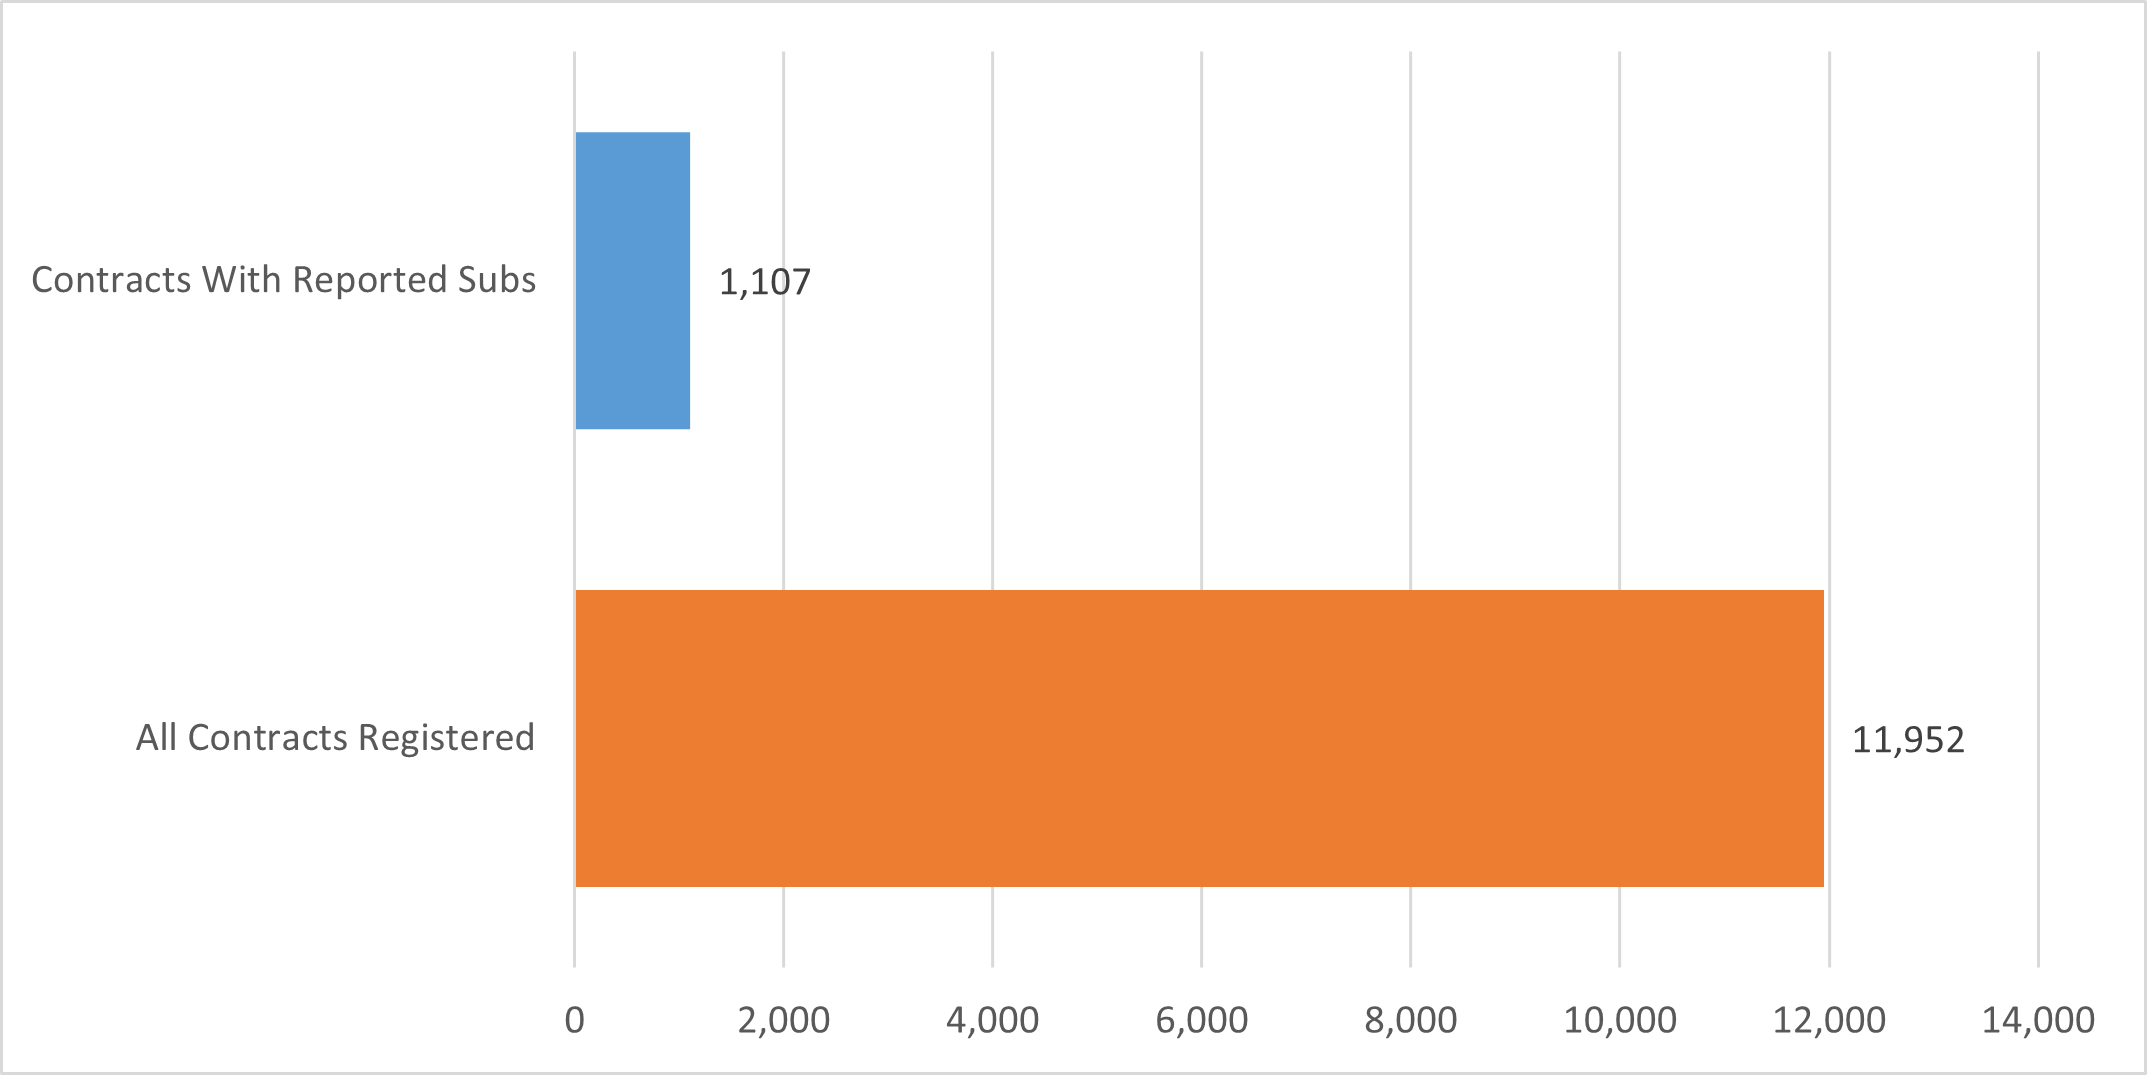
Chart 14 and Table 22 reflect approved subcontract records associated with LL 174 eligible prime contracts registered since FY22. While the number of subcontracts connected with a prime contract can vary, subcontracts were recorded for only about 9% of eligible City contracts.
Chart 14: Reported subcontracts for all Prime Contracts subject to LL 174 participation goals, FY22-FY25
The major construction agencies mostly fared better in ensuring that prime vendors are recording subcontractors, but only DDC approved subcontract records for over half of its eligible prime contracts. For most agencies with some subcontractor approval records, these records are only available for a small sliver of all prime contracts.
The DOE does not require that its vendors record subcontractor activity in the City’s system of record, which calls into question its oversight of mandated subcontractor approval procedures generally and certainly its ability to responsibly enforce, track and report on LL 174 participation goals. In FY25 DOE registered 7,368 prime contracts for which there are no available approved subcontract records, and therefore no opportunity for the City or public to ensure appropriate oversight.
Table 22: Approved Subcontracts Associated with LL 174 Eligible Prime Contracts, FY22-FY25[37]
| Agency | # of LL 174-Eligible Prime Contracts | # of Unique contracts with at least one sub | % Share of Contracts with Sub Records | Total # of Sub Records | Total # of Multi-Tier Subs |
|---|---|---|---|---|---|
| DDC | 552 | 302 | 54.71% | 3,096 | 74 |
| DEP | 729 | 234 | 32.10% | 1,968 | 90 |
| DPR | 2,421 | 362 | 14.95% | 2,573 | 17 |
| DSNY | 256 | 30 | 11.72% | 92 | 1 |
| DOT | 662 | 64 | 9.67% | 362 | 0 |
| HPD | 379 | 31 | 8.18% | 153 | 0 |
| DOF | 105 | 7 | 6.67% | 10 | 0 |
| DOB | 50 | 3 | 6.00% | 7 | 0 |
| DHS/DSS | 100 | 4 | 4.00% | 11 | 0 |
| ACS | 364 | 13 | 3.57% | 28 | 0 |
| FDNY | 286 | 9 | 3.15% | 32 | 0 |
| DCAS | 1,013 | 17 | 1.68% | 82 | 1 |
| NYPD | 863 | 14 | 1.62% | 53 | 0 |
| DYCD | 82 | 1 | 1.22% | 1 | 0 |
| DOHMH | 1,904 | 14 | 0.74% | 31 | 0 |
| DOC | 222 | 1 | 0.45% | 1 | 0 |
| OTI | 638 | 1 | 0.16% | 5 | 0 |
| BIC | 4 | 0 | 0.00% | 0 | 0 |
| CCHR | 8 | 0 | 0.00% | 0 | 0 |
| CCRB | 48 | 0 | 0.00% | 0 | 0 |
| COMP | 124 | 0 | 0.00% | 0 | 0 |
| DCLA | 29 | 0 | 0.00% | 0 | 0 |
| DCP | 37 | 0 | 0.00% | 0 | 0 |
| DCWP | 31 | 0 | 0.00% | 0 | 0 |
| DFTA | 84 | 0 | 0.00% | 0 | 0 |
| DOI | 55 | 0 | 0.00% | 0 | 0 |
| DOP | 34 | 0 | 0.00% | 0 | 0 |
| DORIS | 7 | 0 | 0.00% | 0 | 0 |
| DSS/HRA | 233 | 0 | 0.00% | 0 | 0 |
| DVS | 2 | 0 | 0.00% | 0 | 0 |
| LAW | 216 | 0 | 0.00% | 0 | 0 |
| LPC | 6 | 0 | 0.00% | 0 | 0 |
| MAYOR | 134 | 0 | 0.00% | 0 | 0 |
| NYCEM | 109 | 0 | 0.00% | 0 | 0 |
| OATH | 37 | 0 | 0.00% | 0 | 0 |
| OCJ | 4 | 0 | 0.00% | 0 | 0 |
| SBS | 94 | 0 | 0.00% | 0 | 0 |
| TLC | 30 | 0 | 0.00% | 0 | 0 |
| Grand Total | 11,952 | 1,107 | 9.26% | 8,505 | 183 |
Multi-tier subcontractors (subcontractors of subcontractors) do a great deal of work on behalf of the City, and their historical absence from the City’s systems of record has left a big gap in what information is available to oversight agencies and the Public. As of FY25, PASSPort finally enhanced its subcontract module to allow prime vendors and agencies to capture these multi-tier subcontracts. So far, there is still insufficient data available to effectively monitor happenings at this level. In FY25, only 183 second- or third-tier subcontractors were approved by just five agencies.
An example of a large contract with multi-tiered subcontracts is the $3 billion contract registered by DDC in FY23 for the design-build construction of the Brooklyn borough-based jail (“Brooklyn BBJ contract”). DDC established a 30% M/WBE utilization goal on the Brooklyn BBJ contract, for which the prime vendor will be expected to subcontract work totaling $900 million to M/WBE subcontractors. This contract is only 2 years into its 6-year term, but preliminary records show that M/WBEs only account for 8% of the value of approved subcontracts through FY25. It is essential that the City maintains proper oversight and monitors M/WBE utilization to ensure that prime contractors meet the M/WBE goals established at the time of contract registration.
Table 23: Approved Subcontracts Associated with the Brooklyn BBJ Contract by Certification Type, FY22-FY25[38]
| M/WBE Category | # of Subcontracts | % Share of Subcontracts | Total Subcontract Value | %Share of Subcontract Value |
| Asian American Male Owned | 2 | 2.82% | $4,117,809 | 0.34% |
| Asian American Women Owned | 2 | 2.82% | $3,145,010 | 0.26% |
| Black Male Owned | 9 | 12.68% | $11,903,599 | 0.98% |
| Black Women Owned | 2 | 2.82% | $105,000 | 0.01% |
| Hispanic American Male Owned | 9 | 12.68% | $19,254,443 | 1.59% |
| Hispanic American Women Owned | 2 | 2.82% | $4,910,300 | 0.41% |
| White Women Owned | 12 | 16.90% | $53,088,216 | 4.39% |
| M/WBE All | 38 | 53.52% | $96,524,377 | 7.99% |
| Non-Certified | 33 | 46.48% | $1,112,119,300 | 92.01% |
| Grand Total | 71 | 100.00% | $1,208,643,677 | 100.00% |
M/WBE Utilization by Agency
This Section includes individual analyses for mayoral City agencies and non-mayoral Elected Officials with contracts subject to LL 174 participation goals and spend. Though not subject to LL 174 participation goals, this Section also includes the same analyses for the DOE.
These analyses provide a detailed understanding of contract registration data, spend data and other procurement trends of each individual agency. It is important to note that each agency procures different goods and services, has different operating budgets, and different priorities – so a one-for-one comparison may not always be appropriate. The Annual Summary Contracts Report includes more helpful information about contracting across agencies.[39]
However, it can be helpful and informative to note patterns and trends across agencies, including the count and value of contracting opportunities across agencies in similar industries. Agencies are encouraged to review data pertaining to sister agencies that procure similar goods and services for best practices or to identify areas where they can share context or resources to improve their utilization. These analyses are intended to be reviewed in combination with the findings throughout the rest of the Report, including in the next Section by industry.
Ranked Measures:
This Section presents a comprehensive evaluation of city agencies’ engagement with M/WBEs over the past several fiscal years. These analyses examine how much LL 174-eligible business (as a function of value and volume) each agency did with M/WBEs relative to their peers with similar-sized LL 174 portfolios.
To do this, LL 174-eligible procurement data from the prior four fiscal years was first aggregated to classify agencies into value and volume cohorts. Subsequently, a statistical tool known as a Z-Score was applied to measure how much business each agency did with M/WBEs as compared to their cohort average.[40] Agencies with Z-Scores greater than zero did more business with M/WBEs than the average among agencies with similar sized contract portfolios. Agencies with Z-Scores below zero did less M/WBE business than the average among agencies with similar sized contract portfolios. Additional information and data regarding the process for calculating Z-scores can be found in Appendix D of this Report.
Cohorts
Value and volume cohorts were established by aggregating LL 174-eligible contract and PO data for each agency over a four-year period (FY22-25). The extended timeframe accommodates the fluctuations in each agency’s procurement cycle, accounting for both heavier and lighter years. The cohorts were established as follows:
Value Cohorts
- Large Value: total aggregated LL 174-eligible value over $100 million
- Moderate Value: total aggregated LL 174-eligible value between $50 million and $100 million
- Small Value: total aggregated LL 174-eligible value between $10 million and $50 million
- Micro Value: total aggregated LL 174-eligible value under $10 million
Volume Cohorts
- Large Volume: Over 10,000 contracts and POs
- Moderate Volume: Between 1,000 and 10,000 contracts and POs
- Small Volume: Between 100 and 1,000 contracts and POs
- Very Small Volume: Less than 100 contracts and POs
Z-Score Rankings, by Value Cohort
Tables 24-27 rank agencies from highest to lowest Z-score within each of the four value cohorts. For additional context, these tables also include the volume cohort assigned to each agency when calculating their Z-score.
Table 24: FY25 – Large Value Cohort, Ranked
| Agency | Volume Cohort | FY25 Z-Score |
|---|---|---|
| Department of Education (DOE) | Over 10,000 contracts and POs | 1.29 |
| Department of Design and Construction (DDC) | Between 100-1,000 contracts and POs | 1.12 |
| Department of Parks and Recreation (DPR) | Between 1,000-10,000 contracts and POs | 0.50 |
| Office of Technology and Innovation (OTI) | Between 1,000-10,000 contracts and POs | -0.02 |
| Department of Transportation (DOT) | Between 1,000-10,000 contracts and POs | -0.38 |
| Department of Housing Preservation and Development (HPD) | Over 10,000 contracts and POs | -0.39 |
| Department of Environmental Protection (DEP) | Between 1,000-10,000 contracts and POs | -0.40 |
| Department of Health and Mental Hygiene (DOHMH) | Between 1,000-10,000 contracts and POs | -0.67 |
| Administration for Children’s Services (ACS) | Between 100-1,000 contracts and POs | -1.05 |
Table 25: FY25 – Moderate Value Cohort, Ranked
| Agency | Volume Cohort | FY25 Z-Score |
|---|---|---|
| New York City Fire Department (FDNY) | Between 100-1,000 contracts and POs | 1.06 |
| Department of Citywide Administrative Services (DCAS) | Between 1,000-10,000 contracts and POs | 0.45 |
| New York Police Department (NYPD) | Between 1,000-10,000 contracts and POs | 0.34 |
| Department of Sanitation (DSNY) | Between 1,000-10,000 contracts and POs | -0.34 |
| Human Resources Administration (DSS/HRA) | Between 100-1,000 contracts and POs | -0.65 |
| Department of Homeless Services (DHS/DSS) | Between 100-1,000 contracts and POs | -0.85 |
Table 26: FY25 – Small Value Cohort, Ranked
| Agency | Volume Cohort | FY25 Z-Score |
|---|---|---|
| Department of Corrections (DOC) | Between 1,000-10,000 contracts and POs | 1.42 |
| Department of Buildings (DOB) | Between 100-1,000 contracts and POs | 1.39 |
| Department of Youth and Community Development (DYCD) | Between 100-1,000 contracts and POs | 0.12 |
| Law Department (LAW) | Between 100-1,000 contracts and POs | -0.04 |
| NYC Office of Emergency Management (NYCEM) | Between 100-1,000 contracts and POs | -0.42 |
| Comptroller (COMP) | Between 100-1,000 contracts and POs | -0.47 |
| Department of Finance (DOF) | Between 100-1,000 contracts and POs | -0.54 |
| Mayoralty (MAYOR) | Between 100-1,000 contracts and POs | -0.59 |
| Small Business Services (SBS) | Between 100-1,000 contracts and POs | -0.88 |
Table 27: FY25 – Micro Value Cohort, Ranked
| Agency | Volume Cohort | FY25 Z-Score |
|---|---|---|
| Department of Probation (DOP) | Between 100-1,000 contracts and POs | 2.13 |
| Department for the Aging (DFTA) | Between 100-1,000 contracts and POs | 0.88 |
| Department of Consumer and Worker Protection (DCWP) | Between 100-1,000 contracts and POs | 0.77 |
| Taxi & Limousine Commission (TLC) | Between 100-1,000 contracts and POs | 0.47 |
| Department of Investigations (DOI) | Between 100-1,000 contracts and POs | 0.47 |
| Department of Cultural Affairs (DCLA) | Less than 100 contracts and POs | 0.37 |
| Department of City Planning (DCP) | Between 100-1,000 contracts and POs | 0.27 |
| Office of Administrative Trials and Hearings (OATH) | Between 100-1,000 contracts and POs | -0.03 |
| City Commission of Human Rights (CCHR) | Between 100-1,000 contracts and POs | -0.31 |
| Office of Civil Justice (OCJ) | Less than 100 contracts and POs | -0.67 |
| Landmarks Preservation Commission (LPC) | Less than 100 contracts and POs | -0.76 |
| Civilian Complaint Review Board (CCRB) | Less than 100 contracts and POs | -0.80 |
| Department of Veterans’ Services (DVS) | Less than 100 contracts and POs | -0.85 |
| Department of Records and Information Systems (DORIS) | Less than 100 contracts and POs | -0.90 |
| Business Integrity Commission (BIC) | Less than 100 contracts and POs | -1.06 |
Rankings: Year Over Year Z-Score Changes, by Cohort
Tables 28-31 rank agencies based on the magnitude of change between their FY24 and FY25 Z-scores. Agencies with a positive year-over-year percent change did more business with M/WBEs, relative to their cohorts, in FY25 than they did in FY24. The opposite is true for agencies with a negative year-over-year percentage.
Table 28: Large Value Cohort – Year-over-Year Z-Score Changes
| Agency | Volume Cohort | FY24 Z-score |
FY25 Z-score |
Year over Year Change |
|---|---|---|---|---|
| Office of Technology and Innovation (OTI) | Between 100-1,000 contracts and POs | -0.80 | -0.02 | 0.78 |
| Department of Education (DOE) | Over 10,000 contracts and POs | 0.72 | 1.29 | 0.57 |
| Department of Design and Construction (DDC) | Between 1,000-10,000 contracts and POs | 0.56 | 1.12 | 0.56 |
| Department of Transportation (DOT) | Between 100-1,000 contracts and POs | -0.78 | -0.38 | 0.40 |
| Department of Health and Mental Hygiene (DOHMH) | Between 1,000-10,000 contracts and POs | -0.89 | -0.67 | 0.21 |
| Department of Parks and Recreation (DPR) | Between 1,000-10,000 contracts and POs | 0.89 | 0.50 | -0.39 |
| Department of Housing Preservation and Development (HPD) | Over 10,000 contracts and POs | 0.05 | -0.39 | -0.44 |
| Administration for Children’s Services (ACS) | Between 100-1,000 contracts and POs | -0.48 | -1.05 | -0.57 |
| Department of Environmental Protection (DEP) | Between 1,000-10,000 contracts and POs | 0.72 | -0.40 | -1.12 |
Table 29: Moderate Value Cohort Year-over-Year Z-Score Changes
| Agency | Volume Cohort | FY24 Z-score |
FY25 Z-score |
Year over Year Change |
| New York City Fire Department (FDNY) | Between 100-1,000 contracts and POs | -1.45 | 1.06 | 2.52 |
| Department of Citywide Administrative Services (DCAS) | Between 1,000-10,000 contracts and POs | 0.44 | 0.45 | 0.01 |
| New York Police Department (NYPD) | Between 1,000-10,000 contracts and POs | 0.98 | 0.34 | -0.64 |
| Department of Sanitation (DSNY) | Between 1,000-10,000 contracts and POs | 0.53 | -0.34 | -0.87 |
| Human Resources Administration (DSS/HRA) | Between 100-1,000 contracts and POs | 0.45 | -0.65 | -1.10 |
| Department of Homeless Services (DHS/DSS) | Between 100-1,000 contracts and POs | -0.94 | -0.85 | 0.08 |
Table 30: Small Value Cohort Year-over-Year Z-Score Changes
| Agency | Volume Cohort | FY24
Z-score |
FY25
Z-score |
Year over Year Change |
|---|---|---|---|---|
| Department of Buildings (DOB) | Between 100-1,000 contracts and POs | -0.83 | 1.39 | 2.22 |
| NYC Office of Emergency Management (NYCEM) | Between 100-1,000 contracts and POs | -0.79 | -0.42 | 0.37 |
| Department of Youth and Community Development (DYCD) | Between 100-1,000 contracts and POs | -0.17 | 0.12 | 0.30 |
| Small Business Services (SBS) | Between 100-1,000 contracts and POs | -1.07 | -0.88 | 0.19 |
| Law Department (LAW) | Between 100-1,000 contracts and POs | 0.15 | -0.04 | -0.19 |
| Department of Finance (DOF) | Between 1,000-10,000 contracts and POs | -0.33 | -0.54 | -0.21 |
| Comptroller (COMP) | Between 100-1,000 contracts and POs | 0.32 | -0.47 | -0.79 |
| Mayoralty (MAYOR) | Between 100-1,000 contracts and POs | 0.28 | -0.59 | -0.87 |
| Department of Corrections (DOC) | Between 100-1,000 contracts and POs | 2.43 | 1.42 | -1.01 |
Table 31: Micro Value Cohort Year-over-Year Z-Score Changes
| Agency | Volume Cohort | FY24 Z-score |
FY25 Z-score |
Year over Year Change |
|---|---|---|---|---|
| Department of Probation (DOP) | Between 100-1,000 contracts and POs | -0.04 | 2.13 | 2.17 |
| Department for the Aging (DFTA) | Between 100-1,000 contracts and POs | 0.27 | 0.88 | 0.61 |
| Commission on Human Rights (CCHR) | Between 100-1,000 contracts and POs | -0.58 | -0.31 | 0.27 |
| Office of Civil Justice (OCJ) | Between 100-1,000 contracts and POs | -0.85 | -0.67 | 0.18 |
| Office of Administrative Trials and Hearings (OATH) | Between 100-1,000 contracts and POs | -0.15 | -0.03 | 0.13 |
| Department of Cultural Affairs (DCLA) | Less than 100 contracts and POs | 0.28 | 0.37 | 0.10 |
| Business Integrity Commission (BIC) | Less than 100 contracts and POs | -0.97 | -1.06 | -0.09 |
| Department of Veterans’ Services (DVS) | Less than 100 contracts and POs | -0.74 | -0.85 | -0.11 |
| Landmarks Preservation Commission (LPC) | Less than 100 contracts and POs | -0.65 | -0.76 | -0.11 |
| Department of Investigations (DOI) | Between 100-1,000 contracts and POs | 0.61 | 0.47 | -0.14 |
| Department of Records and Information Systems (DORIS) | Between 100-1,000 contracts and POs | -0.70 | -0.90 | -0.20 |
| Department of Consumer and Worker Protection (DCWP) | Less than 100 contracts and POs | 1.02 | 0.77 | -0.25 |
| Civilian Complaint Review Board (CCRB) | Between 100-1,000 contracts and POs | -0.51 | -0.80 | -0.28 |
| Department of City Planning (DCP) | Between 100-1,000 contracts and POs | 0.58 | 0.27 | -0.31 |
| Taxi and Limousine Commission (TLC) | Between 100-1,000 contracts and POs | 2.43 | 0.47 | -1.96 |
Agency Rankings: Utilization of M/WBE Small Purchase Method by Volume
Tables 32 and 33 examine the agencies with the greatest and fewest numbers of registered M/WBE Small Purchase method contracts in FY25. Table 34 captures which agencies registered the most M/WBE Small Purchase method contracts in FY25, relative to their FY24 totals.
Table 32: FY25 Top Five Agencies by Volume of M/WBE Small Purchase Method Registrations
| Agency | Total Number of M/WBE SP Contracts |
|---|---|
| Office of Technology and Innovation (OTI) | 156 |
| Department of Transportation (DOT) | 93 |
| Department of Health and Mental Hygiene (DOHMH) | 75 |
| Department of Environmental Protection (DEP) | 73 |
| Department of Citywide Administrative Services (DCAS) | 68 |
Table 33: FY25 Bottom Five Agencies by Volume of M/WBE Small Purchase Method Registrations
| Agency | Total Number of M/WBE SP Contracts |
|---|---|
| Department of Investigations (DOI) | 1 |
| Department of Veterans’ Services (DVS) | 1 |
| Landmarks Preservation Commission (LPC) | 1 |
| Department of Records and Information Systems (DORIS) | 0 |
| Business Integrity Commission (BIC) | 0 |
Table 34: Five Most Improved Agencies by Volume of M/WBE Small Purchase Method Registrations, FY24-25
| Agency | FY24 # of M/WBE SP contracts | FY25 # of M/WBE SP contracts | Year-Over-Year Change |
|---|---|---|---|
| Department of Parks and Recreation (DPR) | 28 | 44 | 16 |
| Office of Technology and Innovation (OTI) | 143 | 156 | 13 |
| Department of Design and Construction (DDC) | 3 | 16 | 13 |
| NYC Office of Emergency Management (NYCEM) | 5 | 16 | 11 |
| Department of Finance (DOF) | 13 | 22 | 9 |
Agency Rankings: Utilization of M/WBE Small Purchase Method by Average Contract Value
As previously mentioned, the average value of a contract registered using the M/WBE Small Purchase method in FY25 was $363,967,889. The agencies in Table 35 utilized the M/WBE Small Purchase method to register contracts with the highest average contract value in FY25. Most of these agencies generally tend to procure high-dollar-value contracts.
Table 35: FY25 Highest Ranked Agencies – M/WBE Small Purchase Method Average Value
| Agency | M/WBE SP AVG Value |
|---|---|
| Law Department (LAW) | $892,016 |
| Office of Civil Justice (OCJ) | $752,357 |
| Department of Health and Mental Hygiene (DOHMH) | $713,482 |
| Department of Education (DOE) | $606,425 |
| Department of Corrections (DOC) | $547,543 |
Table 36 displays agencies with the lowest relative average value for contracts registered using the M/WBE Small Purchase method in FY25.
Table 36: FY25 Lowest Ranked Agencies – M/WBE Small Purchase Method Average Value
| Agency | M/WBE SP AVG Value |
|---|---|
| Landmarks Preservation Commission (LPC) | $22,500 |
| Department of Veterans’ Services (DVS) | $29,830 |
| Department of Investigations (DOI) | $41,560 |
| Office of Administrative Trials and Hearings (OATH) | $65,523 |
| Department for the Aging (DFTA) | $79,824 |
Table 37 ranks the agencies whose relative average value for contracts registered using the M/WBE Small Purchase method increased the most since FY24.
Table 37: FY24-25 Most Improved Agencies – M/WBE Small Purchase Method Average Value
| Agency | FY24 M/WBE SP Method AV | FY25 M/WBE SP Method AV | Year-Over-Year Change |
|---|---|---|---|
| Law Department (LAW) | $97,450 | $892,016 | $794,566 |
| Office of Civil Justice (OCJ) | $52,331 | $752,357 | $700,026 |
| Department of Probation (DOP) | $71,486 | $427,071 | $355,584 |
| Department of Health and Mental Hygiene (DOHMH) | $447,805 | $713,482 | $265,677 |
| Department of Corrections (DOC) | $285,004 | $547,543 | $262,538 |
All Agencies: Summarized Indicators
These analyses share insights into several key indicators across mayoral agencies, the DOE, and the Comptroller’s Office.
M/WBE Retroactivity
As discussed earlier in this Report, over 65.39% of new contracts with M/WBEs were registered retroactively. Of all rated agencies, only 12 agencies registered more than half of their M/WBE contracts on time or early.
Table 38: FY25 M/WBE Contract Retroactivity by Agency
| Agency | Registered on Time or Early | Retroactive Registrations | ||
|---|---|---|---|---|
| # of Contracts | % Share of Contracts | # of Contracts | % Share of Contracts | |
| Citywide – All Contracts |
2,548 | 27.36% | 6,766 | 72.64% |
| Citywide – All M/WBE Contracts | 865 | 35.03% | 1,604 | 64.97% |
| ACS | 25 | 31.25% | 55 | 68.75% |
| CCHR | 0 | 0.00% | 2 | 100.00% |
| CCRB | 1 | 50.00% | 1 | 50.00% |
| COMP | 7 | 53.85% | 6 | 46.15% |
| DCAS | 50 | 28.90% | 123 | 71.10% |
| DCLA | 6 | 75.00% | 2 | 25.00% |
| DCP | 4 | 50.00% | 4 | 50.00% |
| DCWP | 1 | 11.11% | 8 | 88.89% |
| DDC | 48 | 55.17% | 39 | 44.83% |
| DEP | 47 | 50.54% | 46 | 49.46% |
| DFTA | 2 | 6.90% | 27 | 93.10% |
| DHS/DSS | 3 | 12.50% | 21 | 87.50% |
| DOB | 2 | 28.57% | 5 | 71.43% |
| DOC | 8 | 16.67% | 40 | 83.33% |
| DOE | 5 | 4.85% | 98 | 95.15% |
| DOF | 18 | 78.26% | 5 | 21.74% |
| DOHMH | 71 | 22.26% | 248 | 77.74% |
| DOI | 6 | 54.55% | 5 | 45.45% |
| DOP | 2 | 22.22% | 7 | 77.78% |
| DOT | 42 | 37.84% | 69 | 62.16% |
| DPR | 288 | 63.44% | 166 | 36.66% |
| DSNY | 15 | 39.47% | 23 | 60.53% |
| DSS/HRA | 9 | 10.98% | 73 | 89.02% |
| DVS | 0 | 0.00% | 1 | 100.00% |
| DYCD | 2 | 5.56% | 34 | 94.44% |
| FDNY | 50 | 75.76% | 16 | 24.24% |
| HPD | 5 | 7.69% | 60 | 92.31% |
| LAW | 0 | 0.00% | 18 | 100.00% |
| LPC | 1 | 100.00% | 0 | 0.00% |
| MAYOR | 6 | 27.27% | 16 | 72.73% |
| NYCEM | 4 | 14.29% | 24 | 85.71% |
| NYPD | 41 | 37.27% | 69 | 62.73% |
| OATH | 1 | 11.11% | 8 | 88.89% |
| OCJ | 1 | 33.33% | 2 | 66.67% |
| OTI | 14 | 8.59% | 149 | 91.41% |
| SBS | 0 | 0.00% | 12 | 100.00% |
| TLC | 1 | 25.00% | 3 | 75.00% |
M/WBE Small Purchase Method
With a threshold significantly higher than those for micro- and small purchases, the method should be one of the City’s most effective tools in driving prime contract awards to M/WBEs. Table 39 shows how each agency took advantage of this method over the past three fiscal years, examining both the frequency of use and the average value of contracts registered using this method. Notably, even as the City increased the maximum threshold for use of this method from $500,000 to $1.5 million over this period, agency use of it has stagnated. The number of contracts registered via the M/WBE Small Purchase method by Mayoral agencies has increased only marginally, particularly when comparing FY25 to the prior year. Most agencies tend to register a consistent volume of these contracts year-over-year (with limited exceptions).
Table 39: M/WBE Small Purchase Method Registrations by Agency, FY23-25[41]
| Agency | FY23 | FY24 | FY25 | |||
|---|---|---|---|---|---|---|
| # of Contracts | Avg Contract Value | # of Contracts | Avg Contract Value | # of Contracts | Avg Contract Value | |
| All Agencies | 894 | $196,630 | 956 | $262,810 | 980 | $345,104 |
| ACS | 44 | $183,862 | 48 | $179,817 | 56 | $169,229 |
| BIC | 1 | $38,129 | 1 | $34,731 | 0 | $0 |
| CCHR | 3 | $74,616 | 0 | $0 | 2 | $92,035 |
| CCRB | 4 | $82,974 | 5 | $82,782 | 2 | $103,644 |
| COMP | 18 | $77,327 | 18 | $125,639 | 11 | $192,957 |
| DCAS | 47 | $154,084 | 67 | $139,717 | 68 | $215,326 |
| DCLA | 9 | $192,158 | 5 | $373,535 | 8 | $352,560 |
| DCP | 1 | $24,998 | 10 | $72,048 | 2 | $161,117 |
| DCWP | 2 | $91,300 | 10 | $230,133 | 9 | $162,193 |
| DDC | 17 | $198,979 | 3 | $678,917 | 16 | $241,602 |
| DEP | 53 | $190,626 | 74 | $174,112 | 73 | $266,962 |
| DFTA | 4 | $94,082 | 5 | $84,781 | 6 | $79,824 |
| DHS/DSS | 14 | $369,366 | 2 | $500,000 | 10 | $467,755 |
| DOB | 14 | $108,922 | 7 | $246,484 | 5 | $293,986 |
| DOC | 38 | $136,110 | 34 | $285,004 | 37 | $547,543 |
| DOE | 13 | $465,623 | 41 | $391,731 | 28 | $606,425 |
| DOF | 20 | $117,222 | 13 | $318,118 | 22 | $289,931 |
| DOHMH | 44 | $229,267 | 72 | $447,805 | 75 | $713,482 |
| DOI | 3 | $71,023 | 4 | $77,578 | 1 | $41,560 |
| DOP | 2 | $98,305 | 5 | $71,486 | 6 | $427,071 |
| DORIS | 1 | $63,390 | 2 | $100,877 | 0 | $0 |
| DOT | 93 | $232,887 | 106 | $258,103 | 93 | $465,340 |
| DPR | 30 | $345,394 | 28 | $379,071 | 44 | $480,565 |
| DSNY | 60 | $270,360 | 36 | $553,757 | 35 | $501,417 |
| DSS/HRA | 41 | $113,034 | 27 | $150,485 | 33 | $181,461 |
| DVS | 0 | $0 | 0 | $0 | 1 | $29,830 |
| DYCD | 18 | $83,502 | 22 | $133,649 | 28 | $146,383 |
| FDNY | 43 | $144,204 | 56 | $251,384 | 62 | $341,464 |
| HPD | 27 | $215,525 | 16 | $276,821 | 8 | $173,465 |
| LAW | 11 | $270,572 | 2 | $97,450 | 5 | $892,016 |
| LPC | 2 | $33,615 | 2 | $38,367 | 1 | $22,500 |
| MAYOR | 21 | $139,779 | 29 | $232,646 | 22 | $132,660 |
| NYCEM | 13 | $145,386 | 5 | $64,519 | 16 | $221,314 |
| NYPD | 12 | $212,265 | 26 | $360,888 | 14 | $291,715 |
| OATH | 13 | $116,637 | 5 | $70,924 | 8 | $65,523 |
| OCJ | 0 | $0 | 3 | $52,331 | 2 | $752,357 |
| OTI | 137 | $224,911 | 143 | $272,401 | 156 | $269,403 |
| SBS | 14 | $114,810 | 10 | $129,334 | 11 | $212,793 |
| TLC | 7 | $156,031 | 14 | $263,271 | 4 | $296,113 |
Table 40 provides an additional layer of analysis showing how each agency’s M/WBE Small Purchase method were distributed across unique vendors. For example, OTI registered 137 contracts using the M/WBE Small Purchase method in FY25, but these contracts were only to 52 different M/WBEs.
Table 40: M/WBE Small Purchase Method Unique Vendors, FY23-25
| Agency | FY23 # of Unique Vendors | FY24 # of Unique Vendors | FY25 # of Unique Vendors |
|---|---|---|---|
| Total Citywide | 362 | 360 | 390 |
| ACS | 32 | 32 | 30 |
| BIC | 1 | 1 | 0 |
| CCHR | 3 | 0 | 2 |
| CCRB | 3 | 2 | 2 |
| COMP | 12 | 12 | 9 |
| DCAS | 40 | 53 | 47 |
| DCLA | 8 | 5 | 8 |
| DCP | 1 | 9 | 1 |
| DCWP | 2 | 4 | 5 |
| DDC | 13 | 3 | 12 |
| DEP | 40 | 44 | 38 |
| DFTA | 3 | 5 | 6 |
| DHS/DSS | 12 | 2 | 8 |
| DOB | 10 | 4 | 5 |
| DOC | 25 | 26 | 24 |
| DOE | 5 | 23 | 21 |
| DOF | 13 | 8 | 17 |
| DOHMH | 33 | 51 | 62 |
| DOI | 2 | 3 | 1 |
| DOP | 2 | 4 | 3 |
| DORIS | 1 | 2 | 0 |
| DOT | 68 | 56 | 66 |
| DPR | 19 | 22 | 32 |
| DSNY | 36 | 25 | 26 |
| DSS/HRA | 26 | 21 | 26 |
| DVS | 0 | 0 | 1 |
| DYCD | 15 | 20 | 24 |
| FDNY | 33 | 37 | 34 |
| HPD | 20 | 14 | 4 |
| LAW | 9 | 2 | 4 |
| LPC | 2 | 2 | 1 |
| MAYOR | 19 | 21 | 19 |
| NYCEM | 9 | 5 | 11 |
| NYPD | 10 | 22 | 11 |
| OATH | 7 | 5 | 6 |
| OCJ | 0 | 3 | 2 |
| OTI | 52 | 53 | 56 |
| SBS | 12 | 7 | 8 |
| TLC | 5 | 10 | 4 |
Mayoral Agencies
Administration for Children’s Services (ACS)
The LL 174 totals below represent just 17% of ACS’ total procurement portfolio, as ACS predominantly contracts with vendors for human services, which are exempt from LL 174 participation goals. ACS’ $39.2 million in LL 174-eligible value represents roughly 0.2% of the City’s total LL 174-eligible contracting portfolio.
Table 41: FY25 LL 174-Eligible Contracts and POs
| Certification Status | # of Contracts | % Share of Contracts | Total Registered Contract Value | % Share of Contract Value |
|---|---|---|---|---|
| All Contracts and POs | 603 | 100.00% | $231,536,121 | 100.00% |
| M/WBE | 193 | 32.01% | $20,795,961 | 8.98% |
| Non-Certified | 410 | 67.99% | $210,740,160 | 91.02% |
| LL174 Contracts and POs | 250 | 100.00% | $39,235,116 | 100.00% |
| M/WBE | 160 | 64.00% | $17,420,262 | 44.40% |
| Non-Certified | 90 | 36.00% | $21,814,854 | 55.60% |
| LL174 Subcontracts | 4 | 100.00% | $4,319,817 | 100.00% |
| M/WBE | 4 | 100.00% | $4,319,817 | 100.00% |
| Non-Certified | 0 | 0% | $0 | 0% |
Chart 15: FY22-25 Value of LL 174-Eligible Prime Contracts and POs
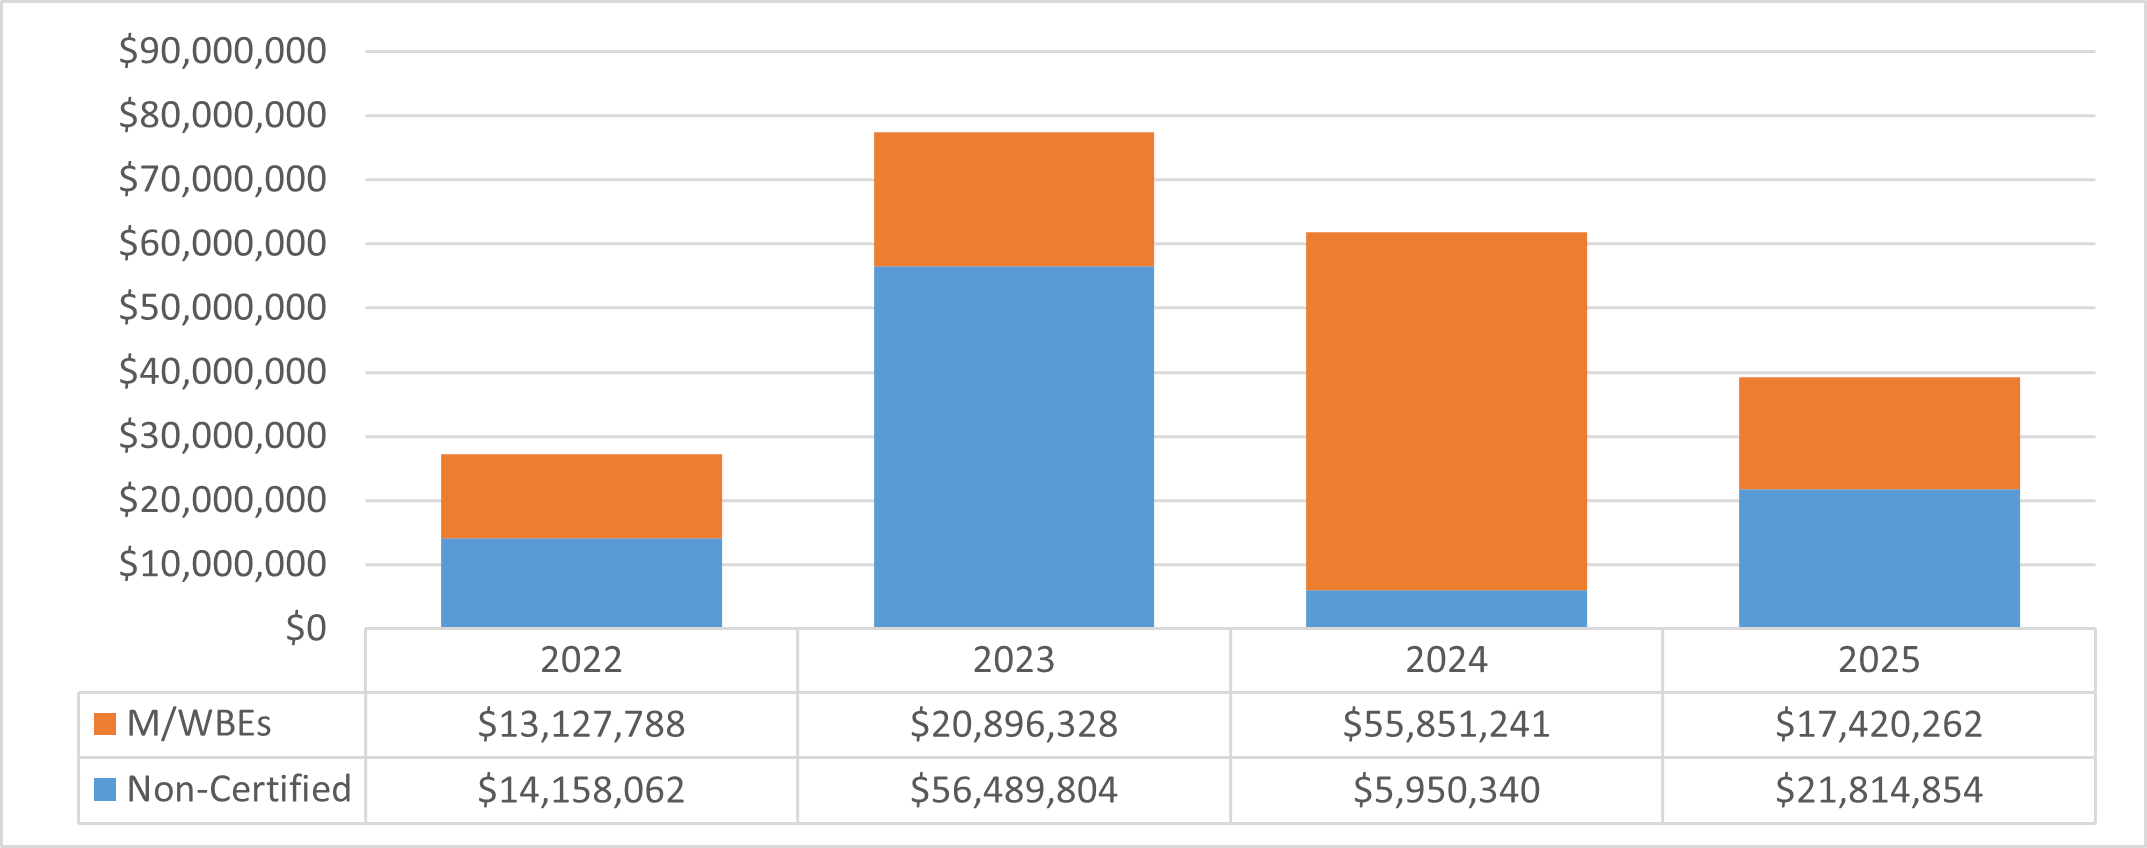
Chart 16: FY25 Value of LL 174-Eligible Contracts and POs, by Race and Gender
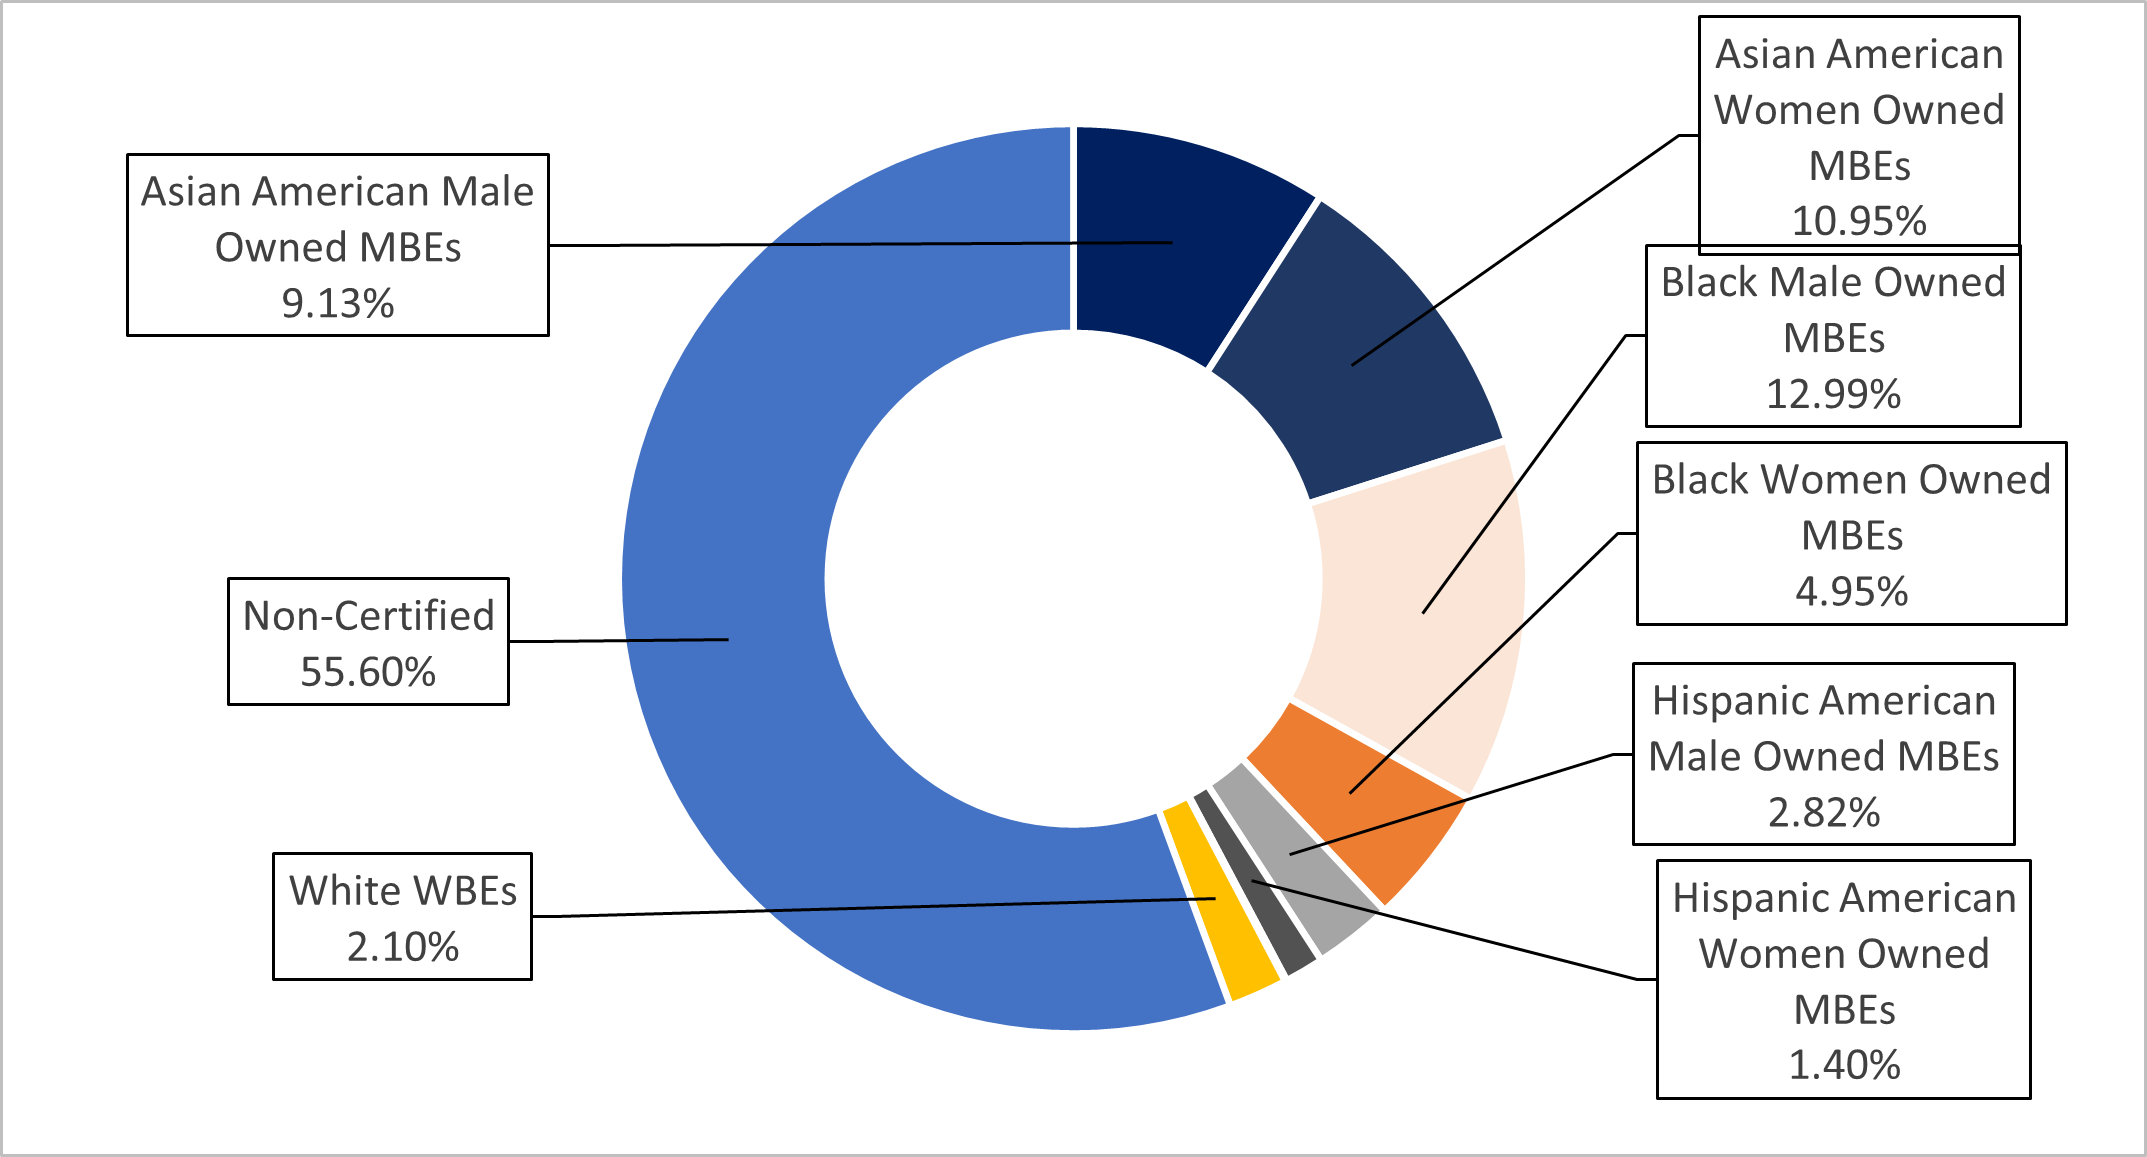
Chart 17: FY25 Share of LL 174-Eligible Contracts and PO Value, by M/WBE Category and Industry
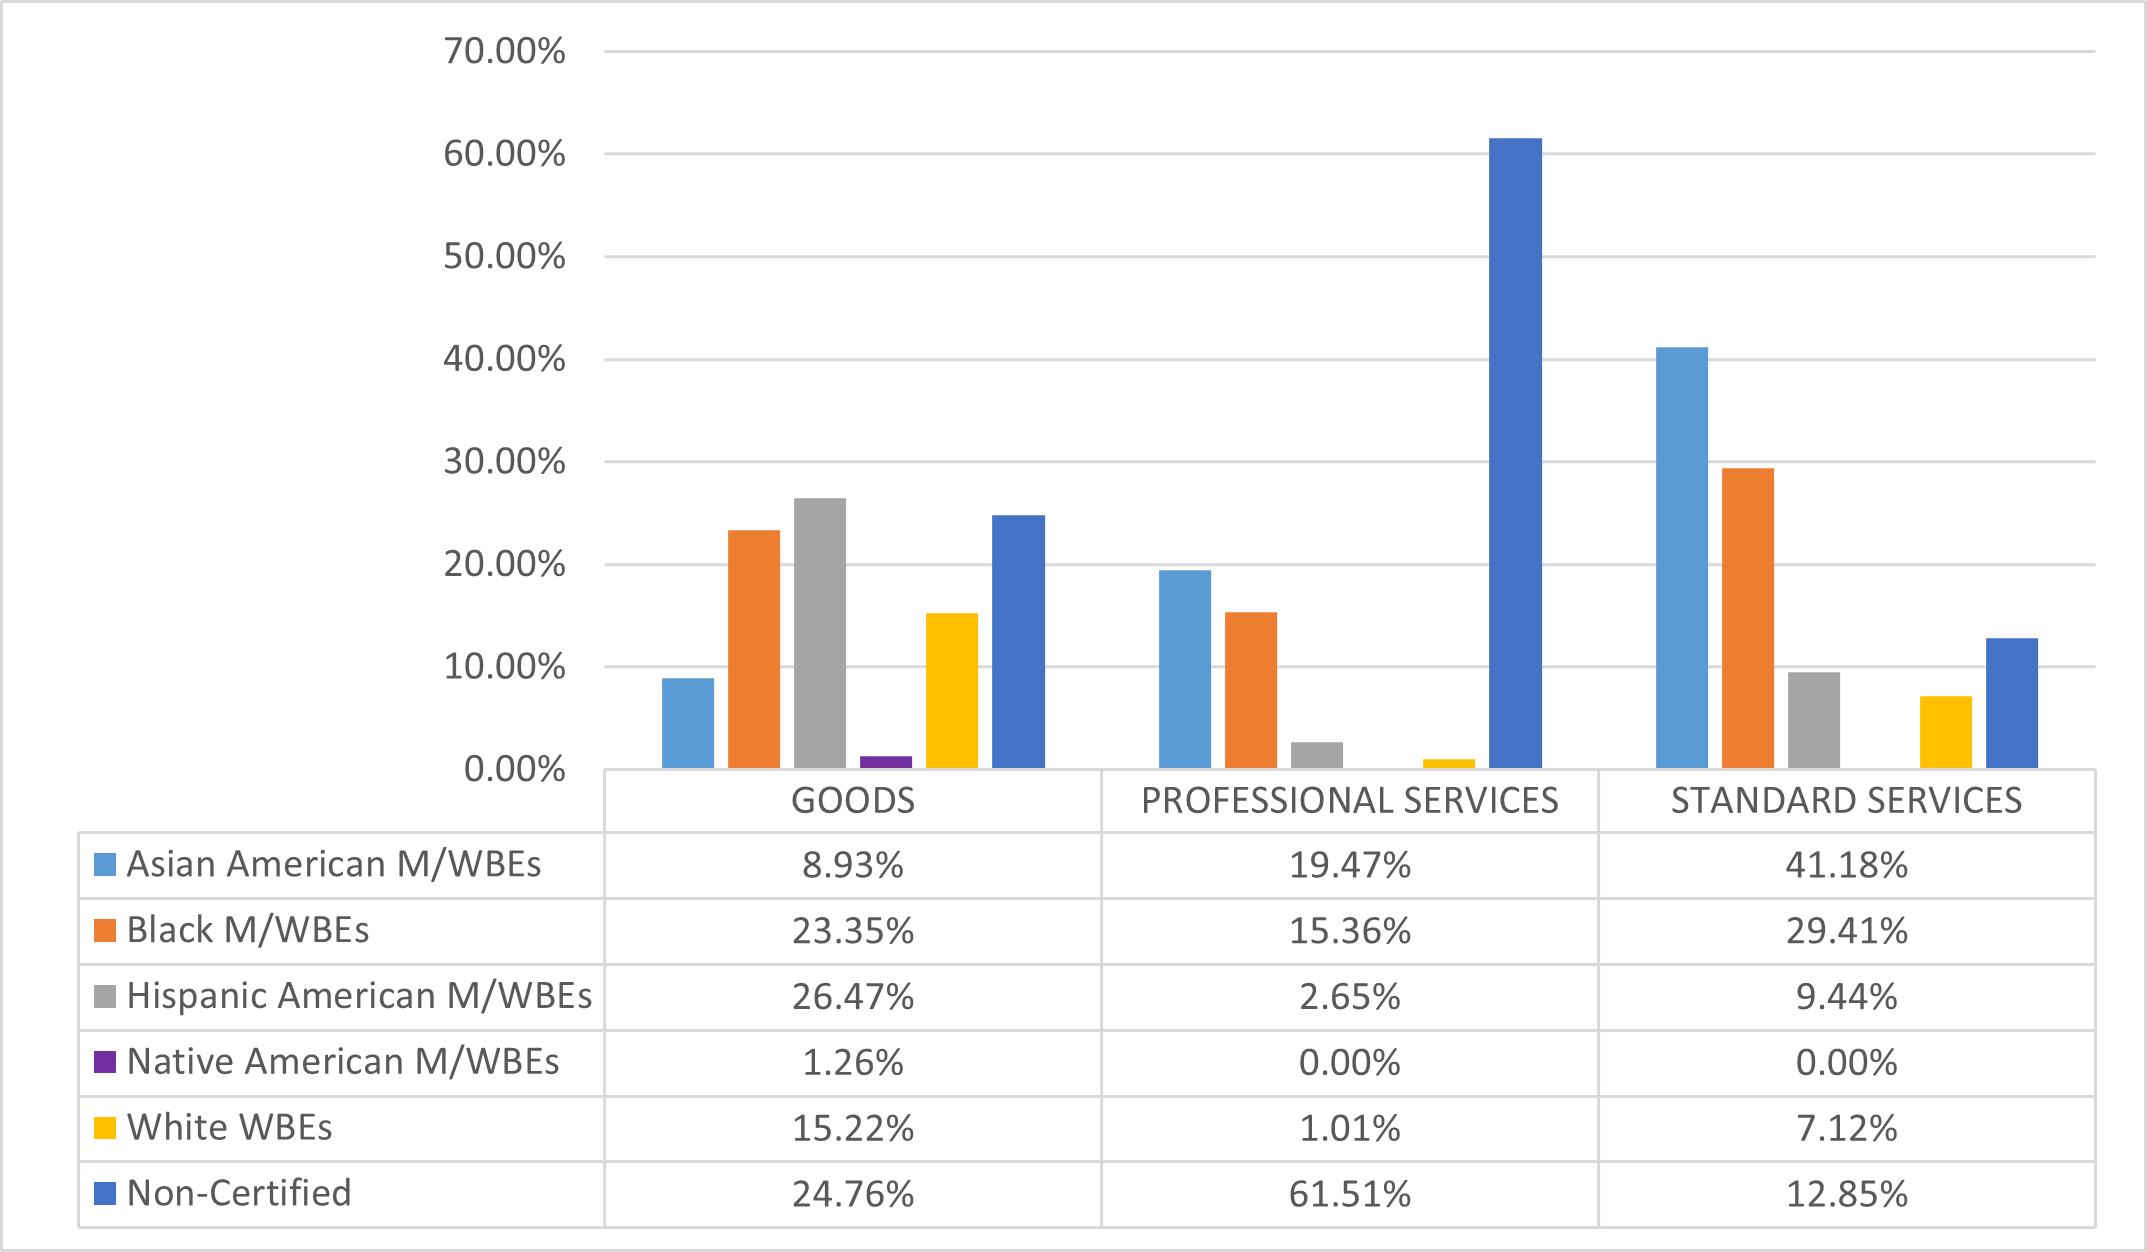
Business Integrity Commission (BIC)
Although 75% of BIC’s procurement portfolio was subject to LL 174 participation goals in FY25, BIC’s $83,584 in LL 174-eligible value represents less than 0.001% of the City’s LL 174-eligible contracting portfolio.
Table 42: FY25 LL 174-Eligible Contracts and POs
| Certification Status | # of Contracts | % Share of Contracts | Total Registered Contract Value | % Share of Contract Value |
|---|---|---|---|---|
| All Contracts and POs | 36 | 100.00% | $112,360 | 100.00% |
| M/WBE | 8 | 22.22% | $33,057 | 29.42% |
| Non-Certified | 28 | 77.78% | $79,302 | 70.58% |
| LL174 Contracts and POs | 32 | 100.00% | $83,584 | 100.00% |
| M/WBE | 8 | 25.00% | $33,057 | 39.55% |
| Non-Certified | 24 | 75.00% | $50,527 | 60.45% |
| LL174 Subcontracts | 0 | 0.00% | 0 | 0.00% |
| M/WBE | 0 | 0.00% | 0 | 0.00% |
| Non-Certified | 0 | 0.00% | 0 | 0.00% |
Chart 18: FY22-25 Value of LL 174-Eligible Prime Contracts and POs
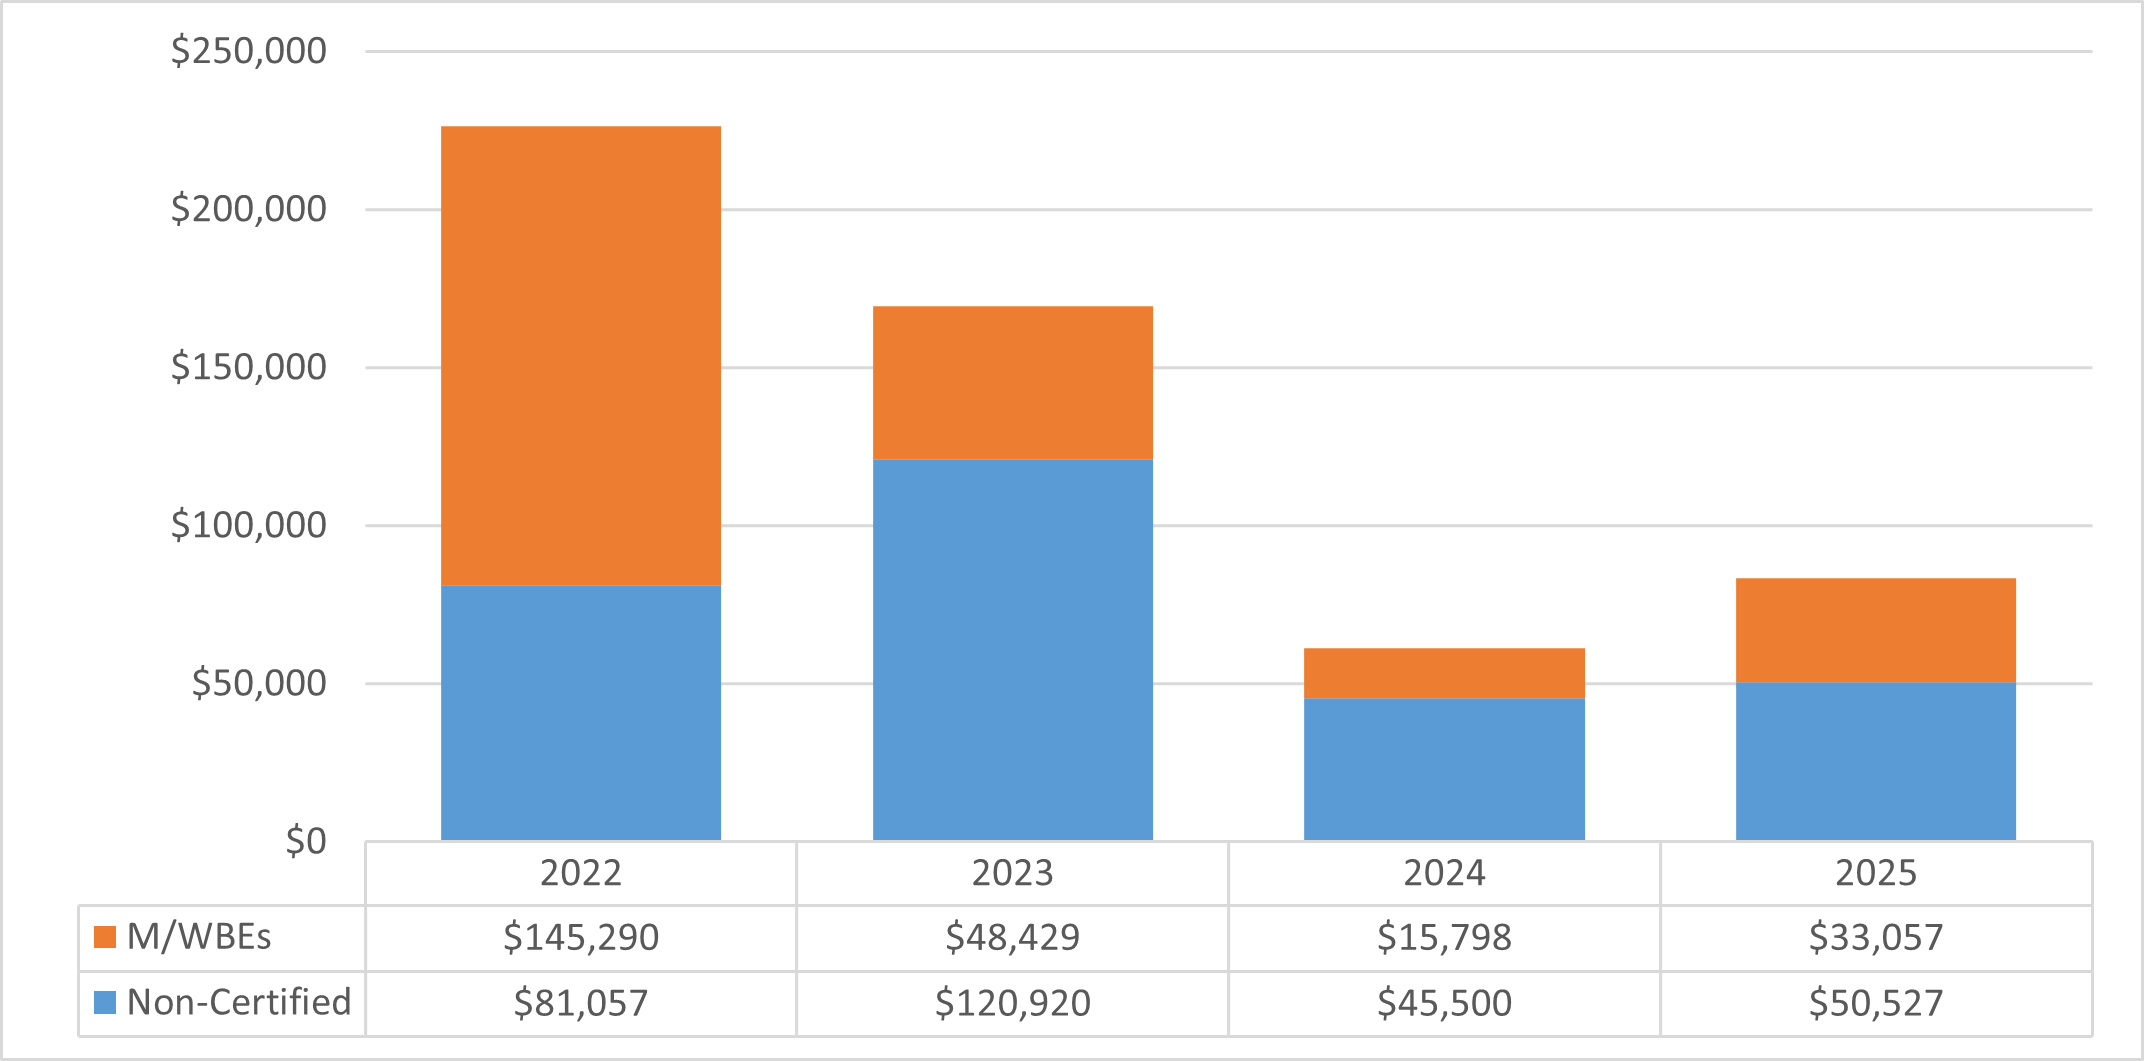
Chart 19: FY25 Value of LL 174-Eligible Contracts and POs, by Race and Gender
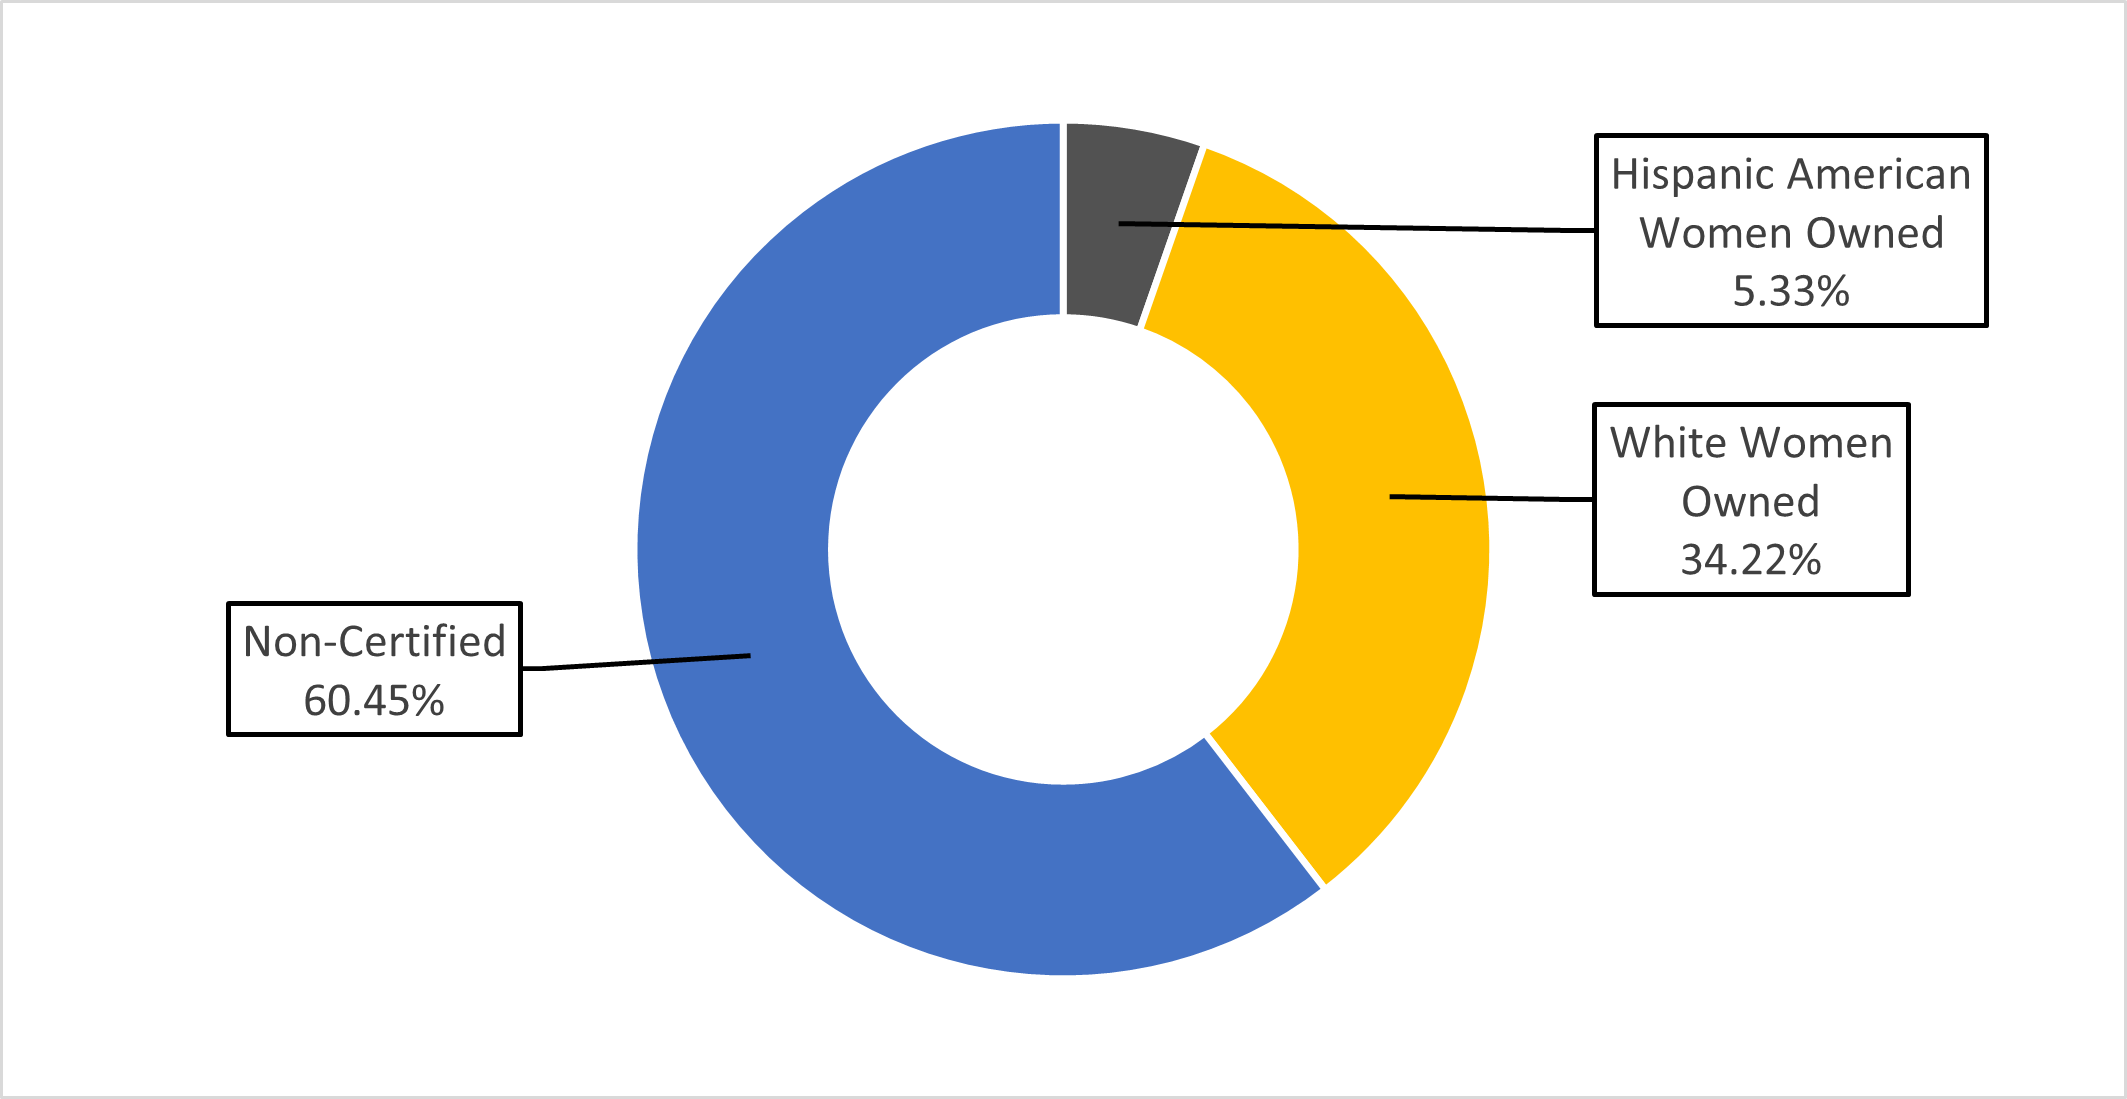
Chart 20: FY25 Share of LL 174-Eligible Contracts and PO Value, by M/WBE Category and Industry

City Commission on Human Rights (CCHR)
The LL 174 totals below represent the vast majority of CCHR’s procurement portfolio. However, CCHR’s $706,559 in LL 174-eligible value represents 0.004% of the City’s LL 174-eligible contracting portfolio.
Table 43: FY25 LL 174-Eligible Contracts and POs
| Certification Status | # of Contracts | % Share of Contracts | Total Registered Contract Value | % Share of Contract Value |
|---|---|---|---|---|
| All Contracts and POs | 71 | 100.00% | $717,559 | 100.00% |
| M/WBE | 37 | 52.11% | $512,541 | 71.43% |
| Non-Certified | 34 | 47.89% | $205,018 | 28.57% |
| LL174 Contracts and POs | 69 | 100.00% | $706,559 | 100.00% |
| M/WBE | 37 | 53.62% | $512,541 | 72.54% |
| Non-Certified | 32 | 46.38% | $194,018 | 27.46% |
| LL174 Subcontracts | 0 | 0.00% | $0 | 0.00% |
| M/WBE | 0 | 0.00% | $0 | 0.00% |
| Non-Certified | 0 | 0.00% | $0 | 0.00% |
Chart 21: FY22-25 Value of LL 174-Eligible Prime Contracts and POs
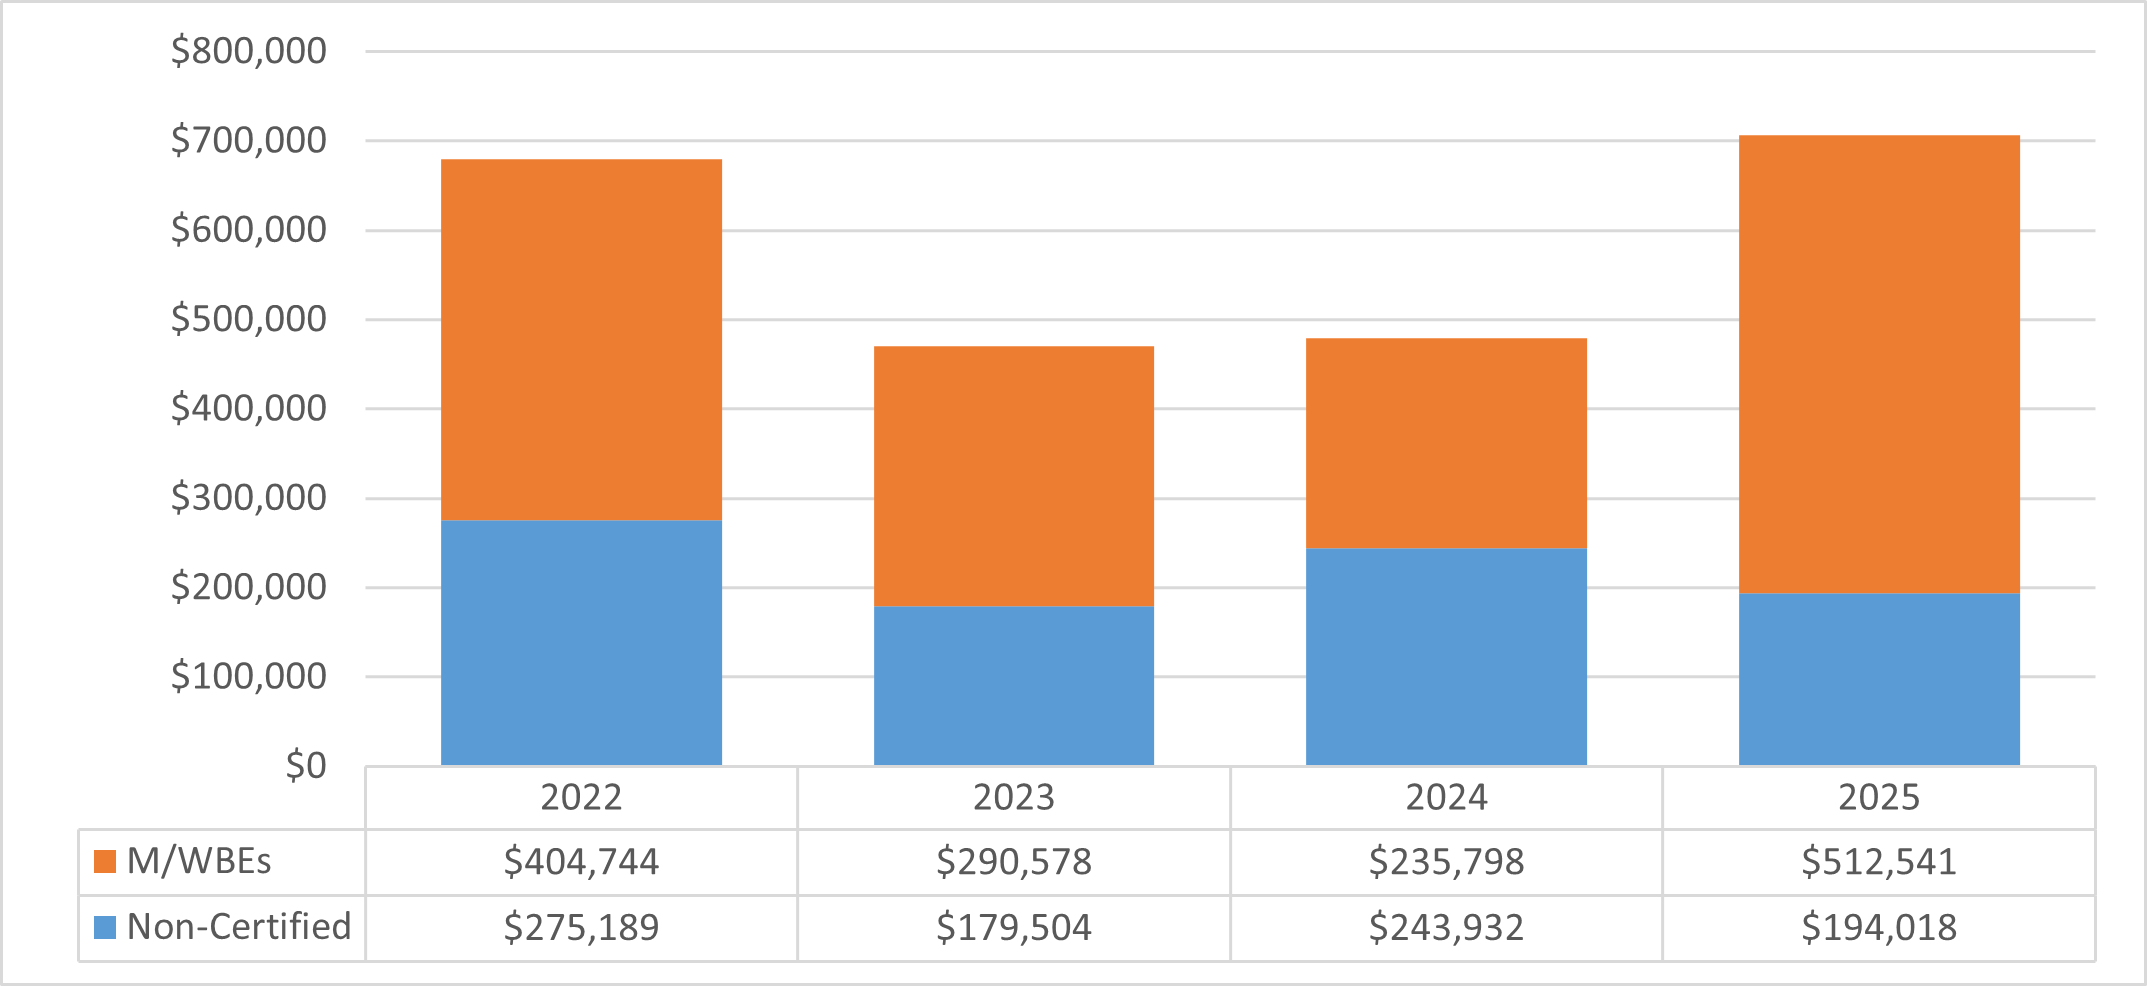
Chart 22: FY25 Value of LL 174-Eligible Contracts and POs, by Race and Gender
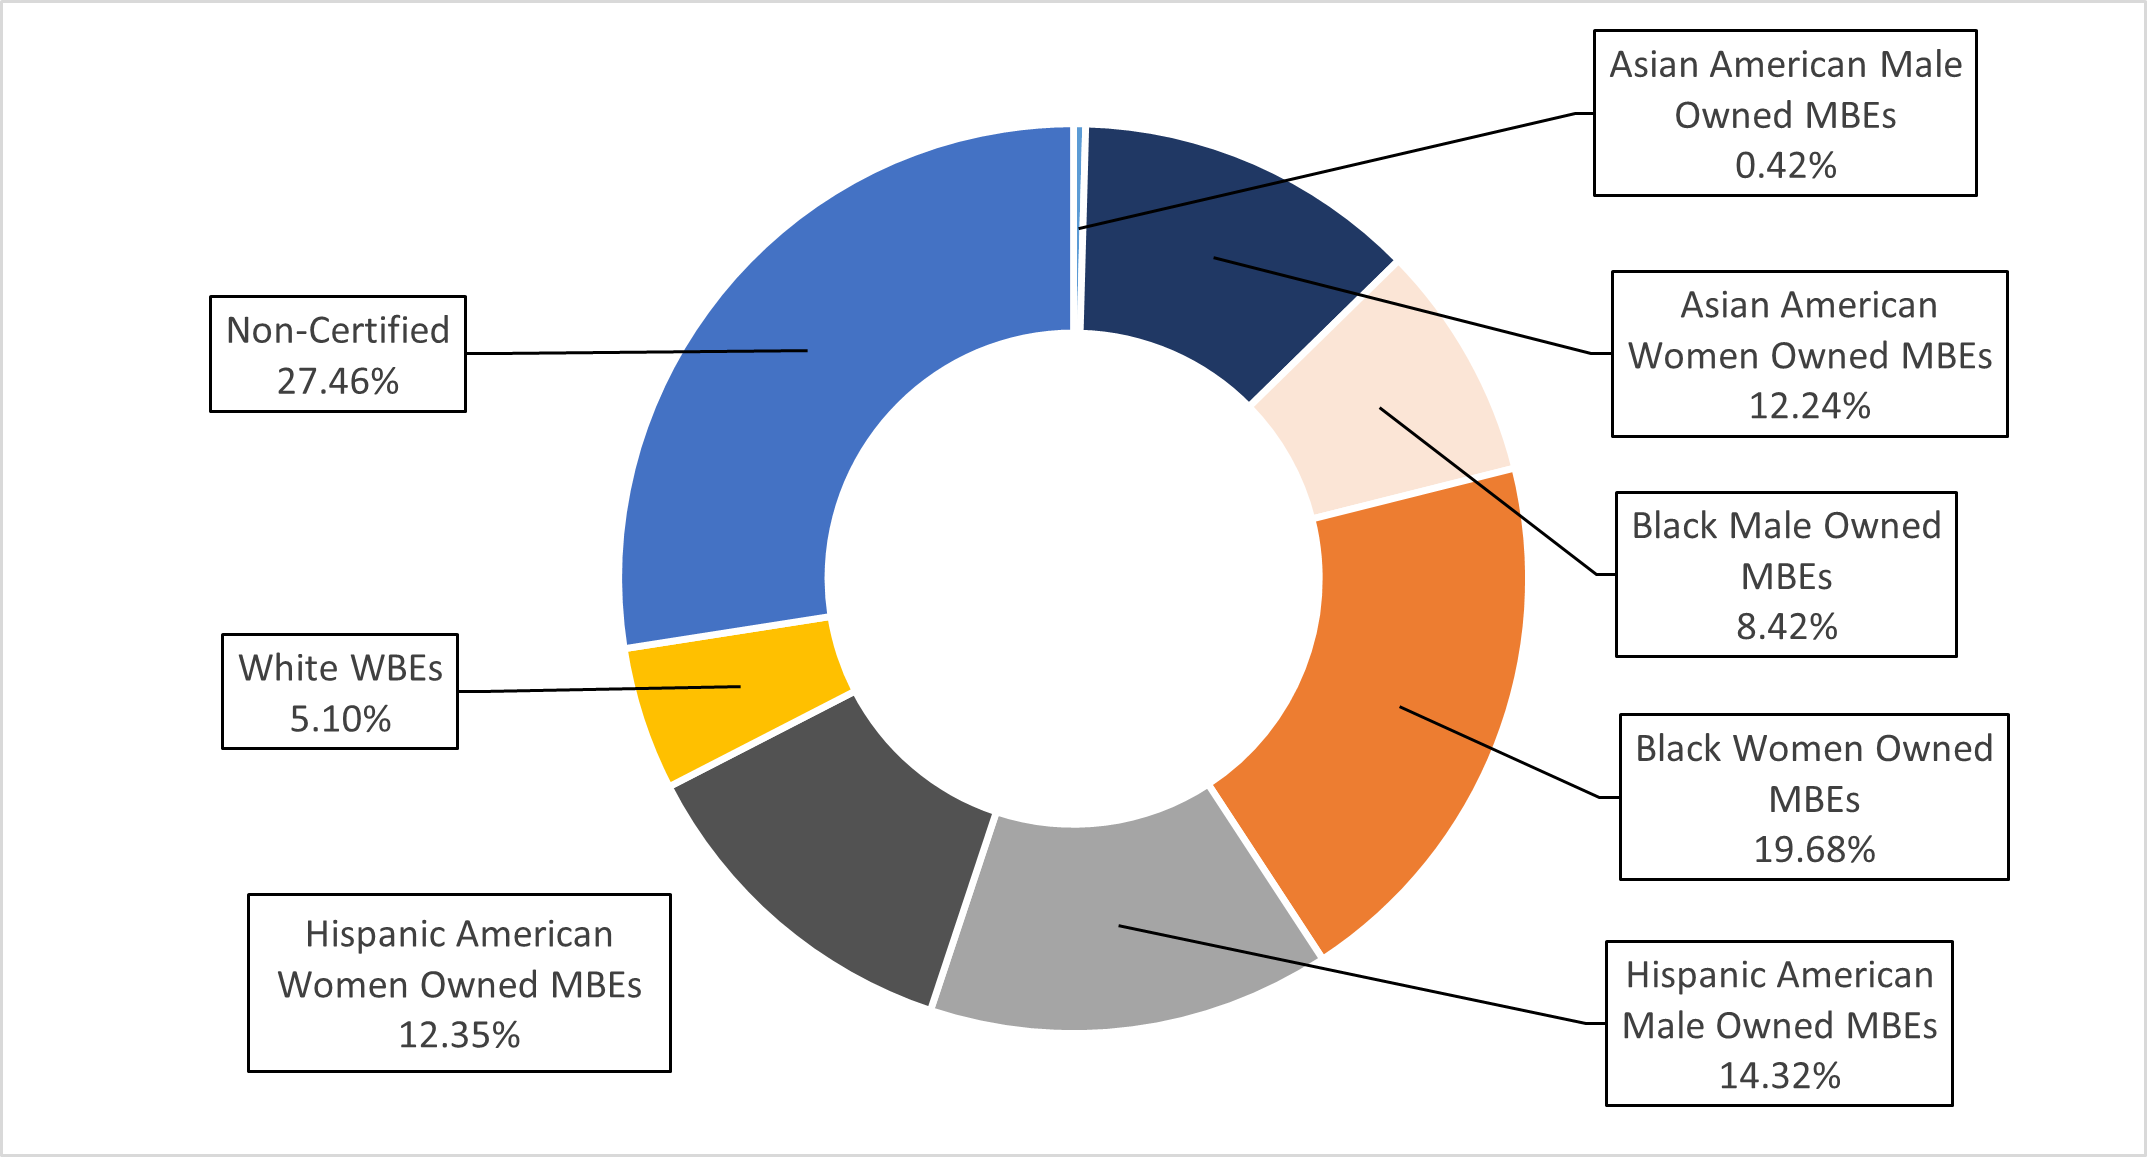
Chart 23: FY25 Share of LL 174-Eligible Contracts and PO Value, by M/WBE Category and Industry
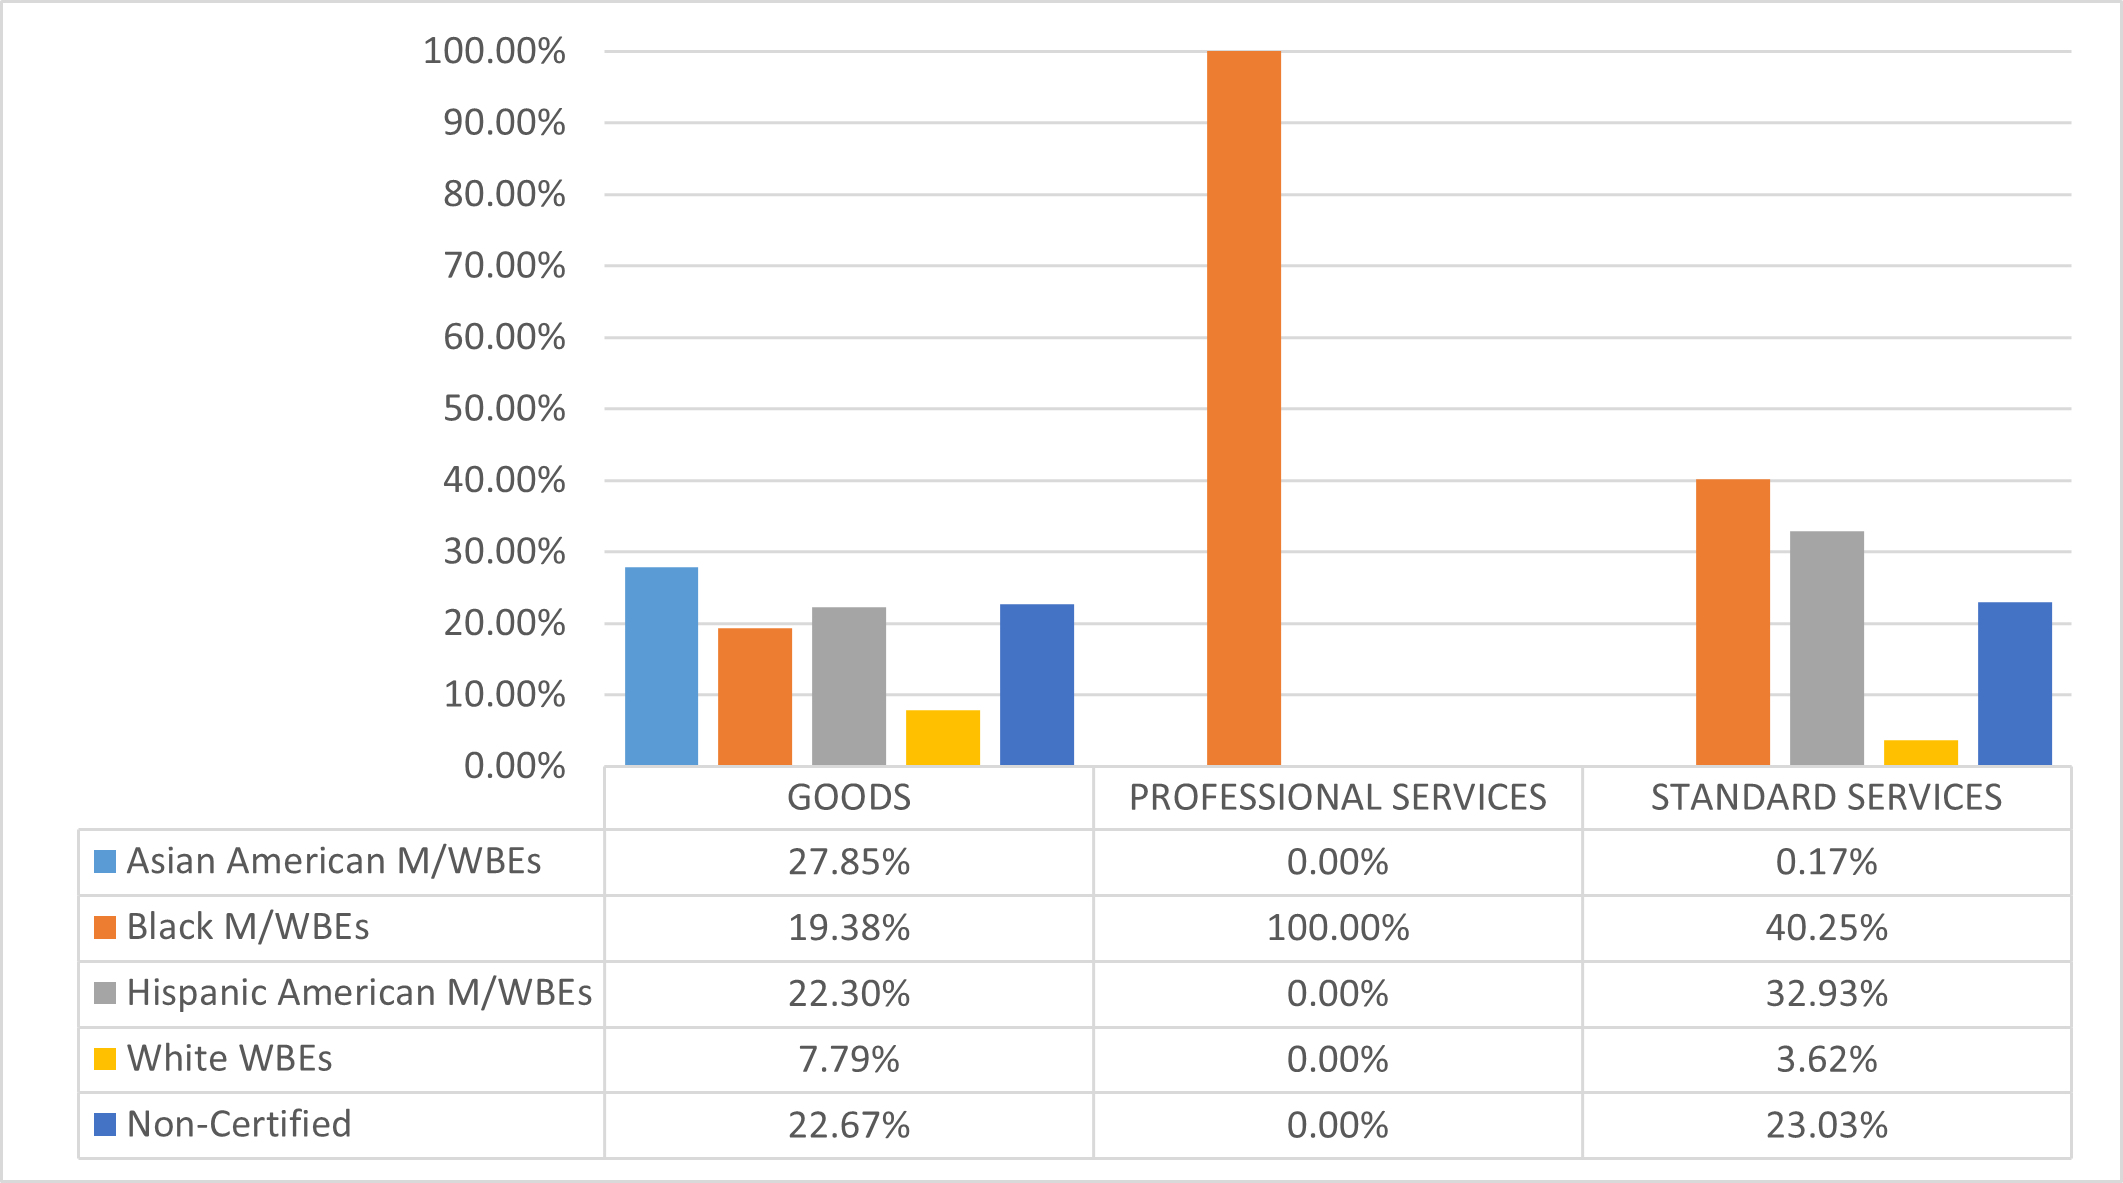
Civilian Complaint Review Board (CCRB)
Almost all of CCRB’s procurement actions in FY25 were subject to LL 174 participation goals. These account for 0.003% of the City’s LL 174-eligible contracting portfolio.
Table 44: FY25 LL 174-Eligible Contracts and POs
| Certification Status | # of Contracts | % Share of Contracts | Total Registered Contract Value | % Share of Contract Value |
|---|---|---|---|---|
| All Contracts and POs | 59 | 100.00% | $609,162 | 100.00% |
| M/WBE | 12 | 20.34% | $283,790 | 46.59% |
| Non-Certified | 47 | 79.66% | $325,372 | 53.41% |
| LL174 Contracts and POs | 55 | 100.00% | $544,747 | 100.00% |
| M/WBE | 12 | 21.82% | $283,790 | 52.10% |
| Non-Certified | 43 | 78.18% | $260,957 | 47.90% |
| LL174 Subcontracts | 0 | 0% | $0 | 0% |
| M/WBE | 0 | 0.00% | $0 | 0.00% |
| Non-Certified | 0 | 0% | $0 | 0% |
Chart 24: FY22-25 Value of LL 174-Eligible Prime Contracts and POs
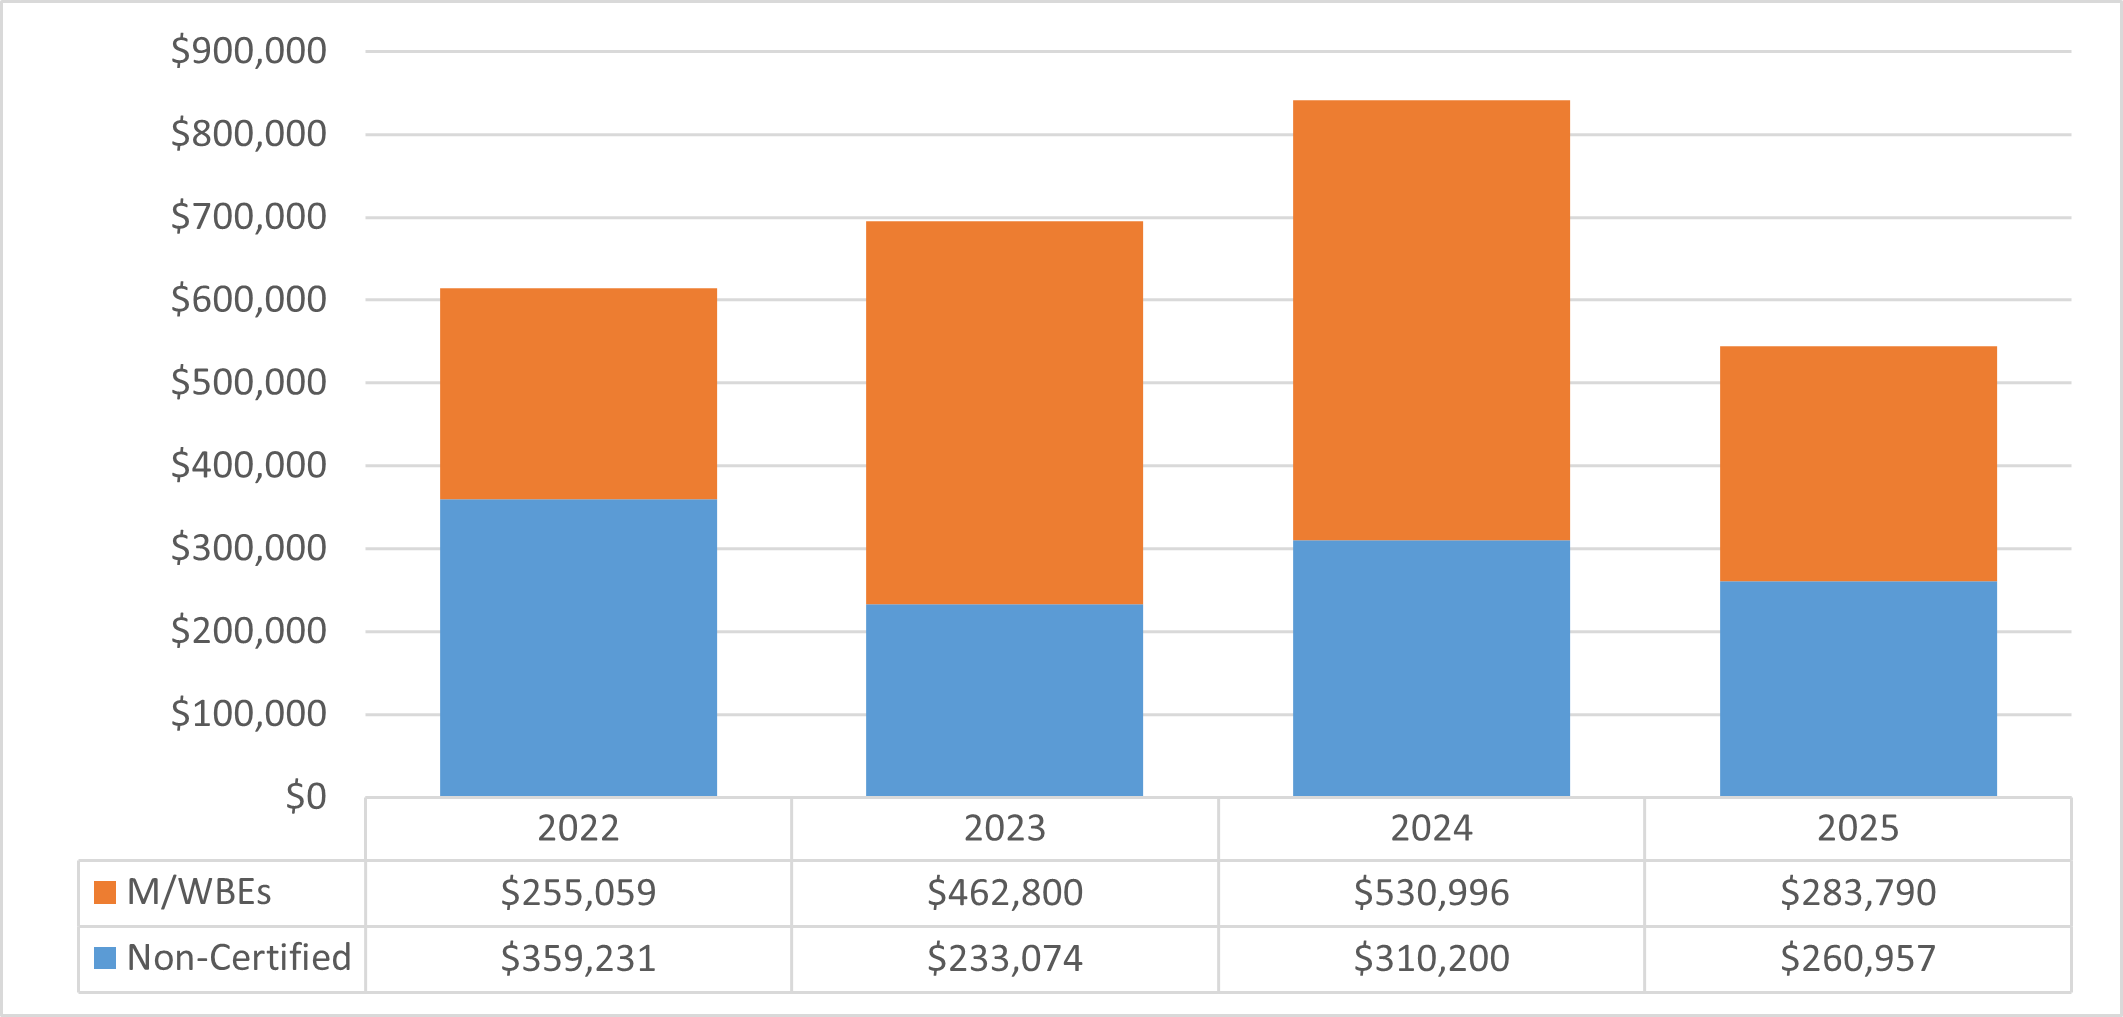
Chart 25: FY25 Value of LL 174-Eligible Contracts and POs, by Race and Gender
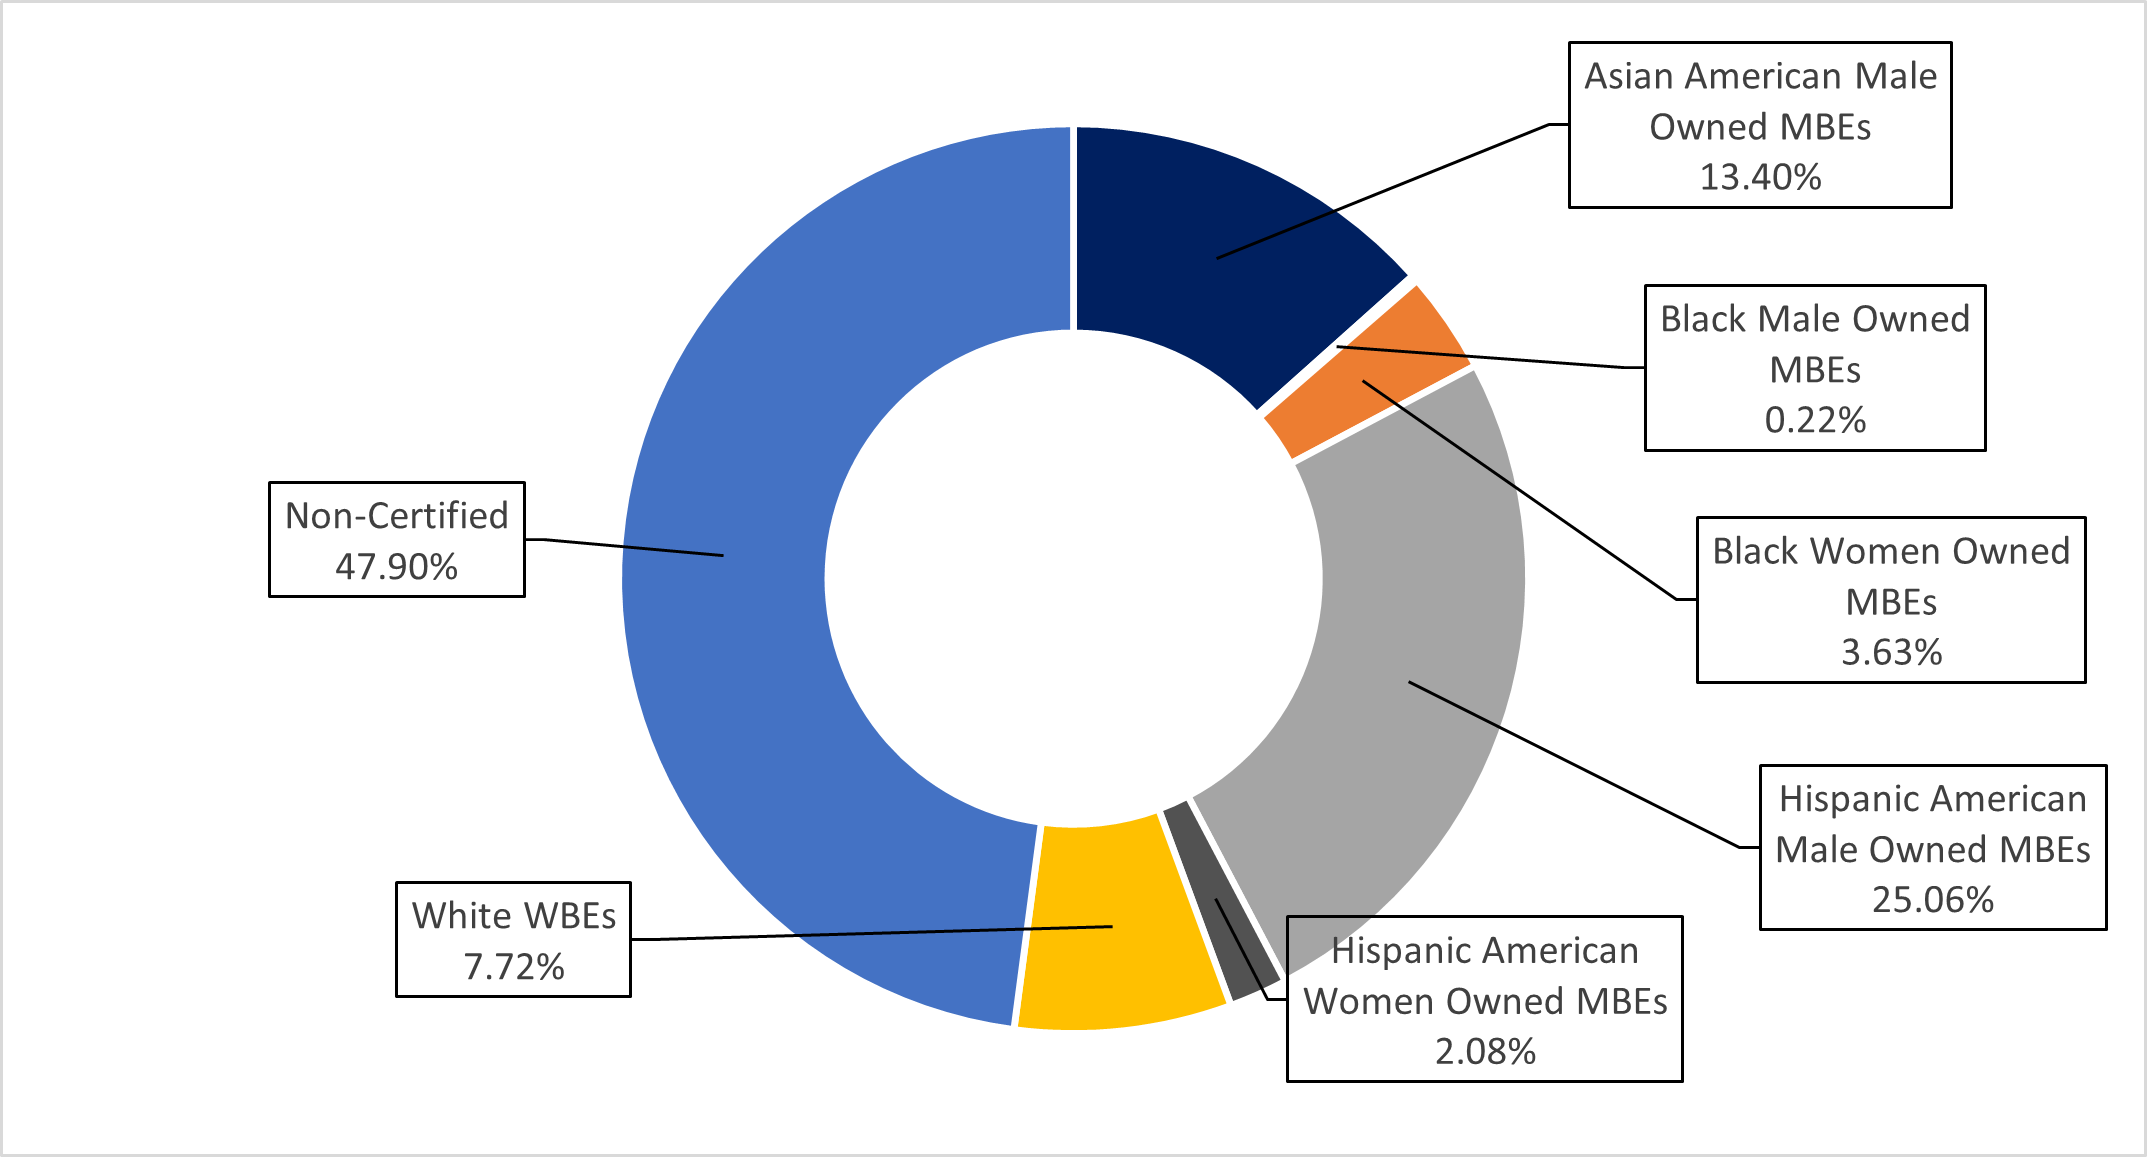
Chart 26: FY25 Share of LL 174-Eligible Contracts and PO Value, by M/WBE Category and Industry
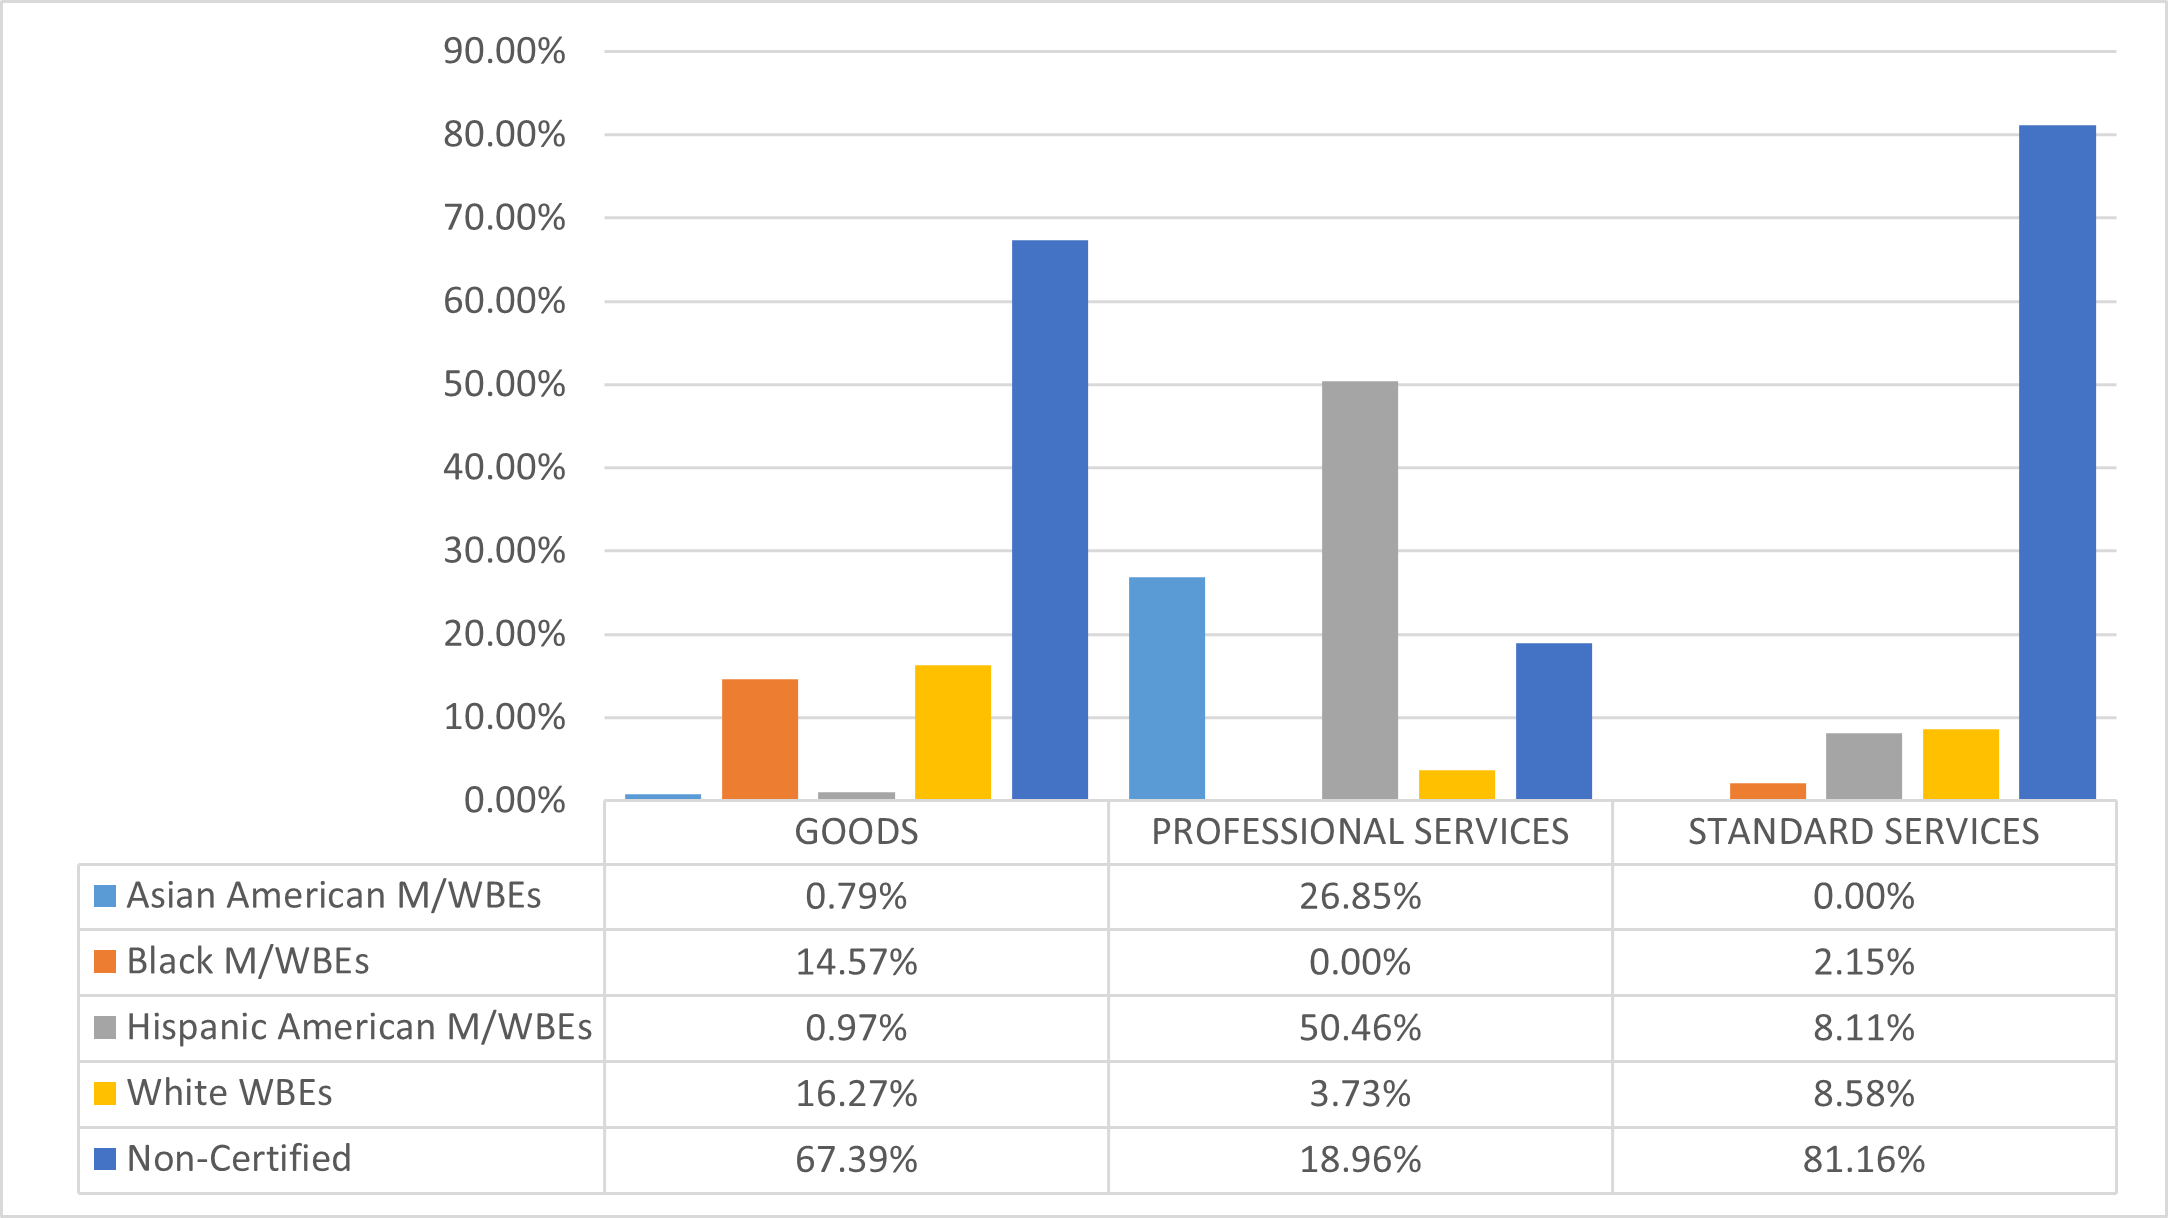
Department of Citywide Administrative Services (DCAS)
The LL 174 data below represent a relatively small share of DCAS’ total procurement portfolio (10%), as DCAS manages high-value contracts with vendors for goods (over $1 million) which are exempt from LL 174 participation goals. DCAS’ $183.7 million in LL 174-eligible value represents 1% of the City’s LL 174-eligible contracting portfolio.
Table 45: FY25 LL 174-Eligible Contracts and POs
| Certification Status | # of Contracts | % Share of Contracts | Total Registered Contract Value | % Share of Contract Value |
|---|---|---|---|---|
| All Contracts and POs | 747 | 100.00% | $1,875,578,470 | 100.00% |
| M/WBE | 346 | 46.32% | $111,312,592 | 5.93% |
| Non-Certified | 401 | 53.68% | $1,764,265,878 | 94.07% |
| LL174 Contracts and POs | 520 | 100.00% | $183,699,354 | 100.00% |
| M/WBE | 330 | 63.46% | $47,355,051 | 25.78% |
| Non-Certified | 190 | 36.54% | $136,344,303 | 74.22% |
| LL174 Subcontracts | 5 | 100.00% | $1,366,490 | 100.00% |
| M/WBE | 2 | 40.00% | $283,690 | 20.76% |
| Non-Certified | 3 | 60.00% | $1,082,800 | 79.24% |
Chart 27: FY22-25 Value of LL 174-Eligible Prime Contracts and POs
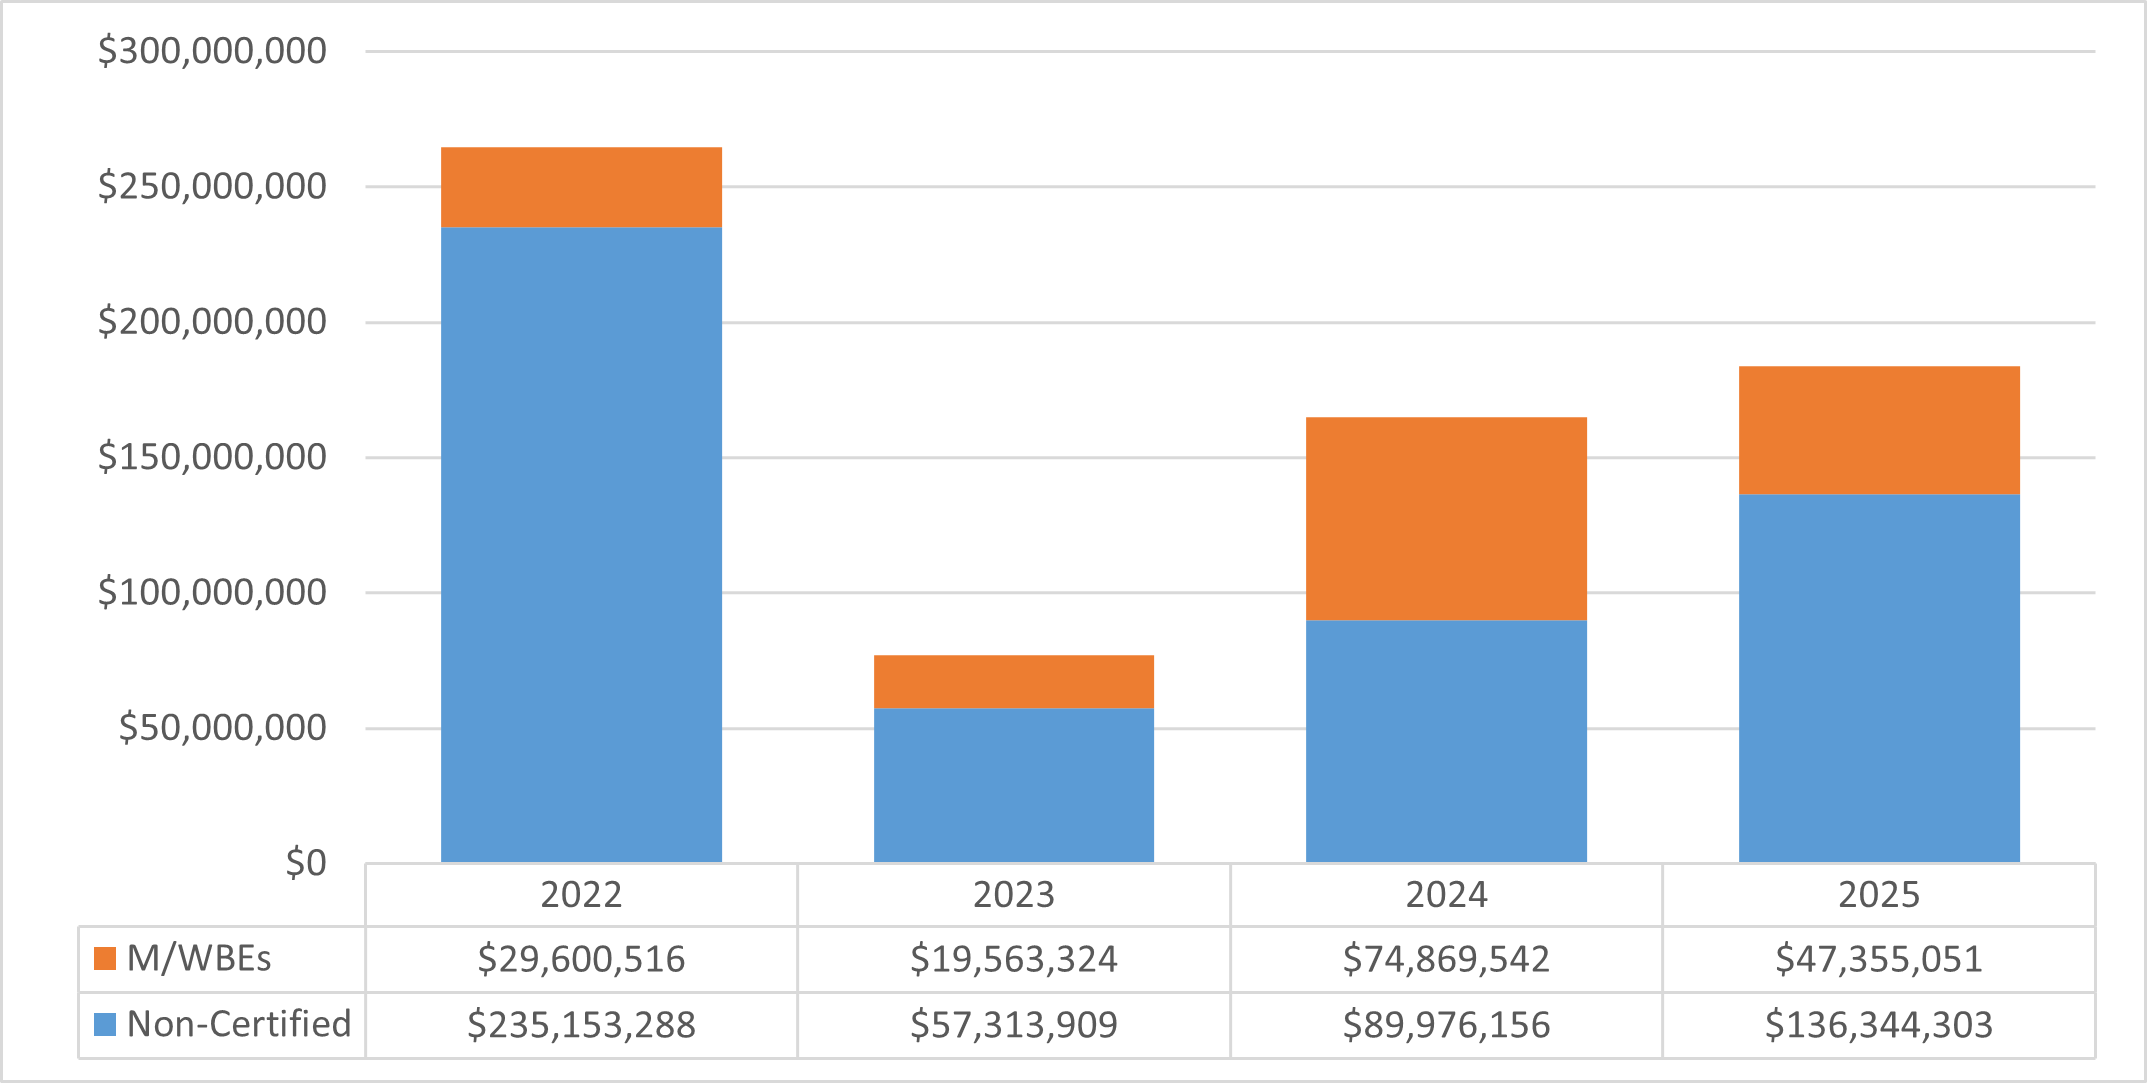
Chart 28: FY25 Value of LL 174-Eligible Contracts and POs, by Race and Gender
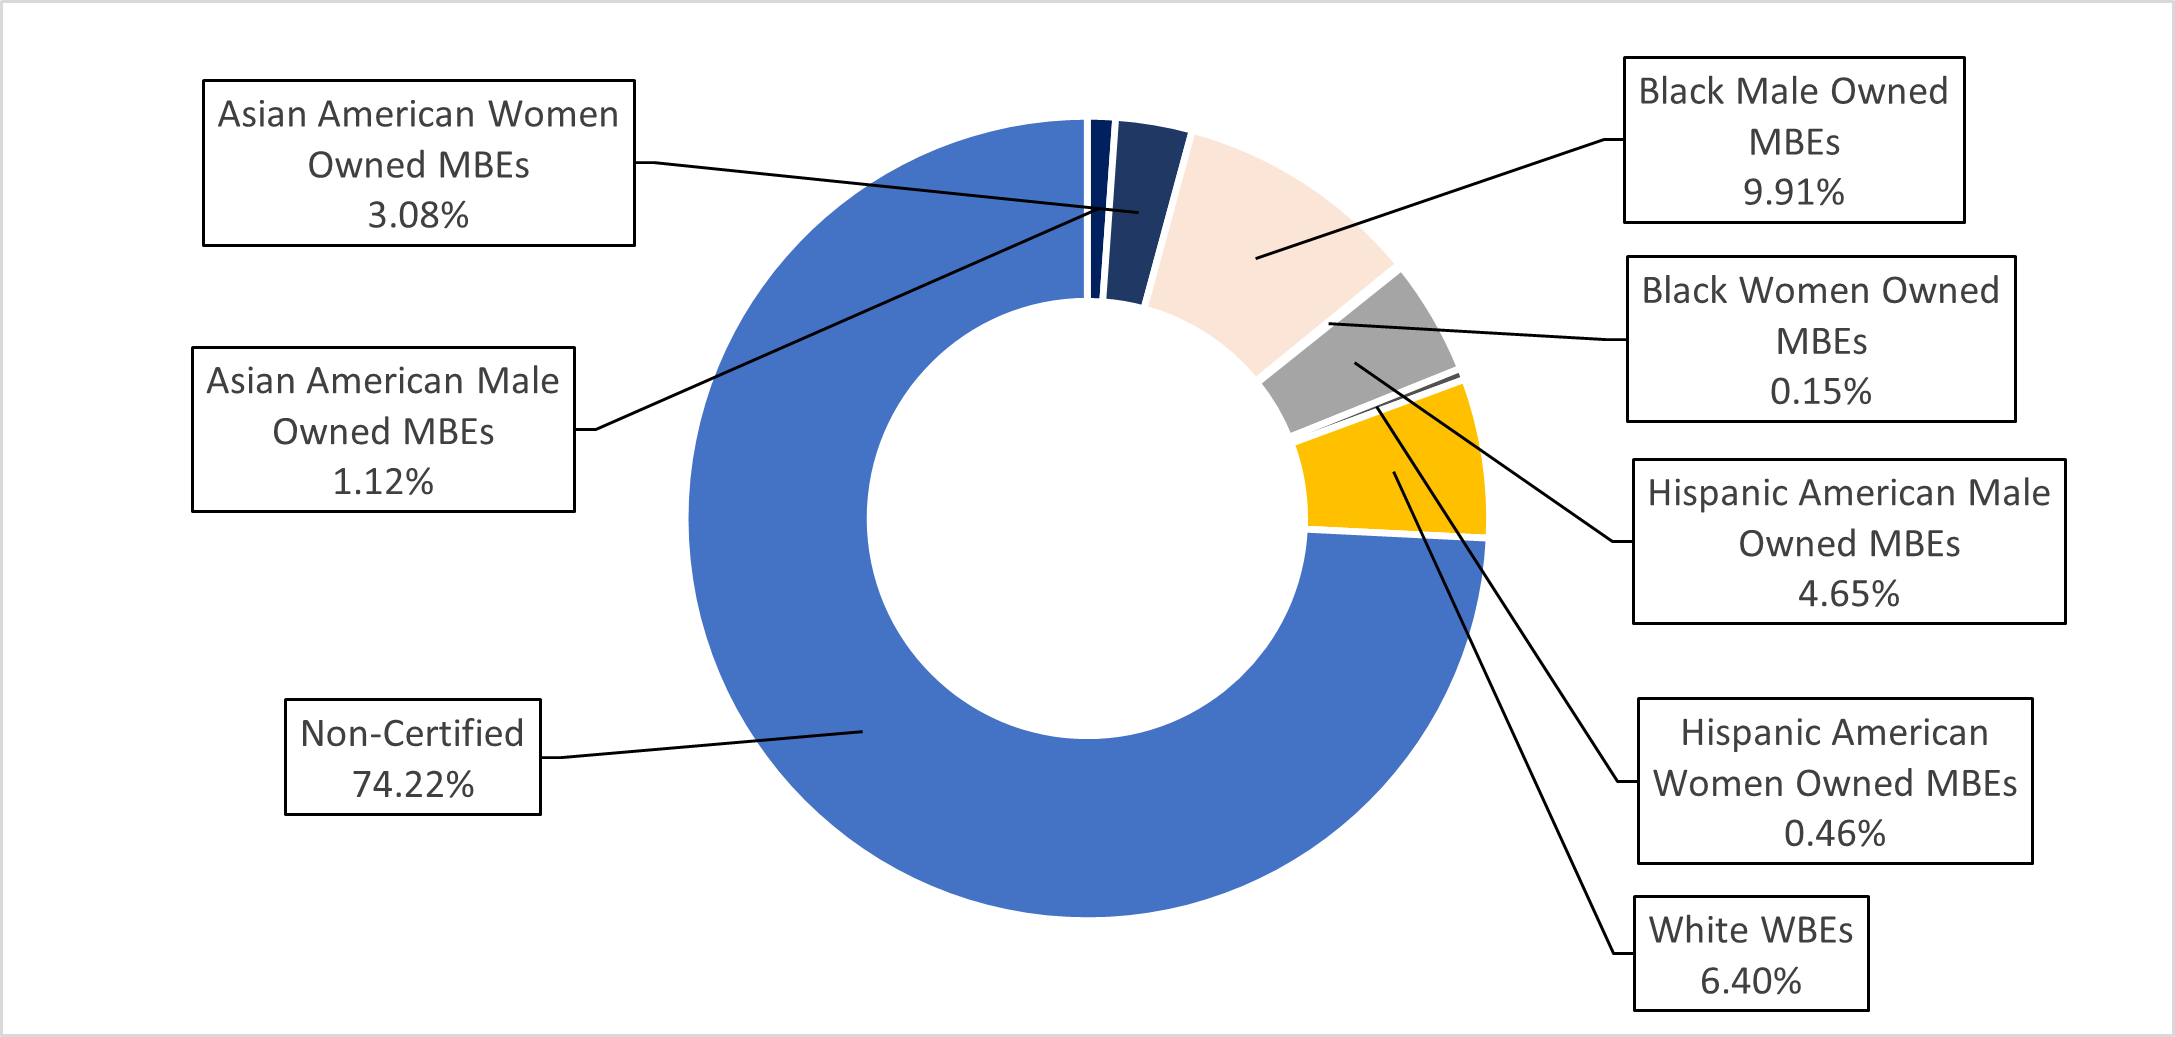
Chart 29: FY25 Share of LL 174-Eligible Contracts and PO Value, by M/WBE Category and Industry
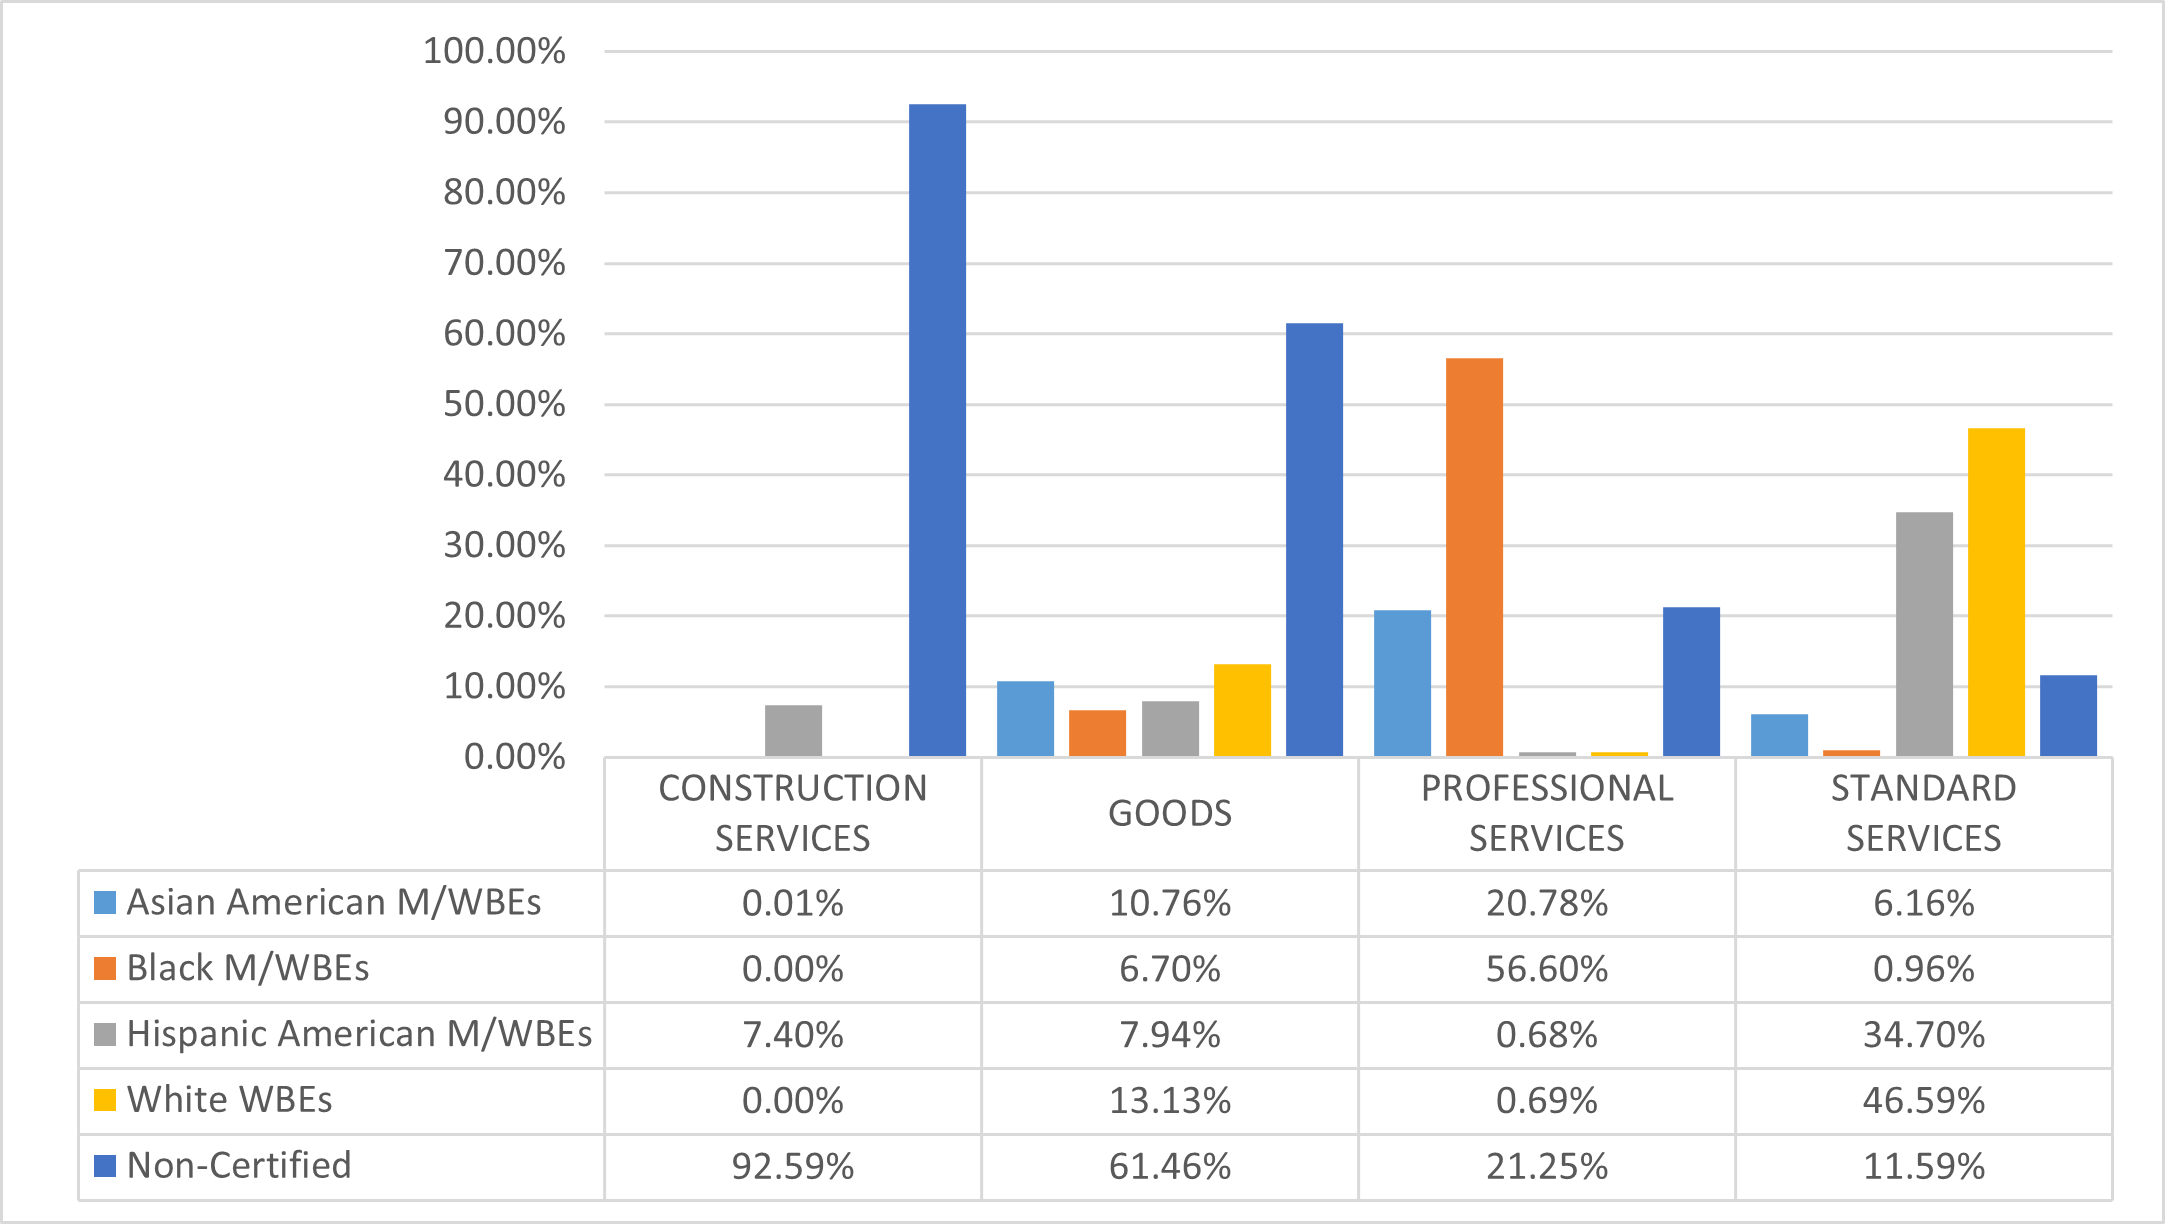
Department of Cultural Affairs (DCLA)
The LL 174 data below represent about a third of DCLA’S total procurement portfolio in FY25. DCLA has a relatively small procurement portfolio that includes some high value City Council Discretionary-funded contracts which are exempt from LL 174 participation goals. DCLA’s $1.8 million in LL 174-eligible value represents 0.001% of the City’s LL 174-eligible contracting portfolio.
Table 46: FY25 LL 174-Eligible Contracts and POs
| Certification Status | # of Contracts | % Share of Contracts | Total Registered Contract Value | % Share of Contract Value |
|---|---|---|---|---|
| All Contracts and POs | 66 | 100.00% | $5,333,375 | 100.00% |
| M/WBE | 11 | 16.67% | $2,846,002 | 53.36% |
| Non-Certified | 55 | 83.33% | $2,487,373 | 46.64% |
| LL174 Contracts and POs | 62 | 100.00% | $1,820,751 | 100.00% |
| M/WBE | 10 | 16.13% | $1,636,378 | 89.87% |
| Non-Certified | 52 | 83.87% | $184,373 | 10.13% |
| LL174 Subcontracts | 0 | 0.00% | $0 | 0% |
| M/WBE | 0 | 0.00% | $0 | 0% |
| Non-Certified | 0 | 0.00% | $0 | 0% |
Chart 30: FY22-25 Value of LL 174-Eligible Prime Contracts and POs
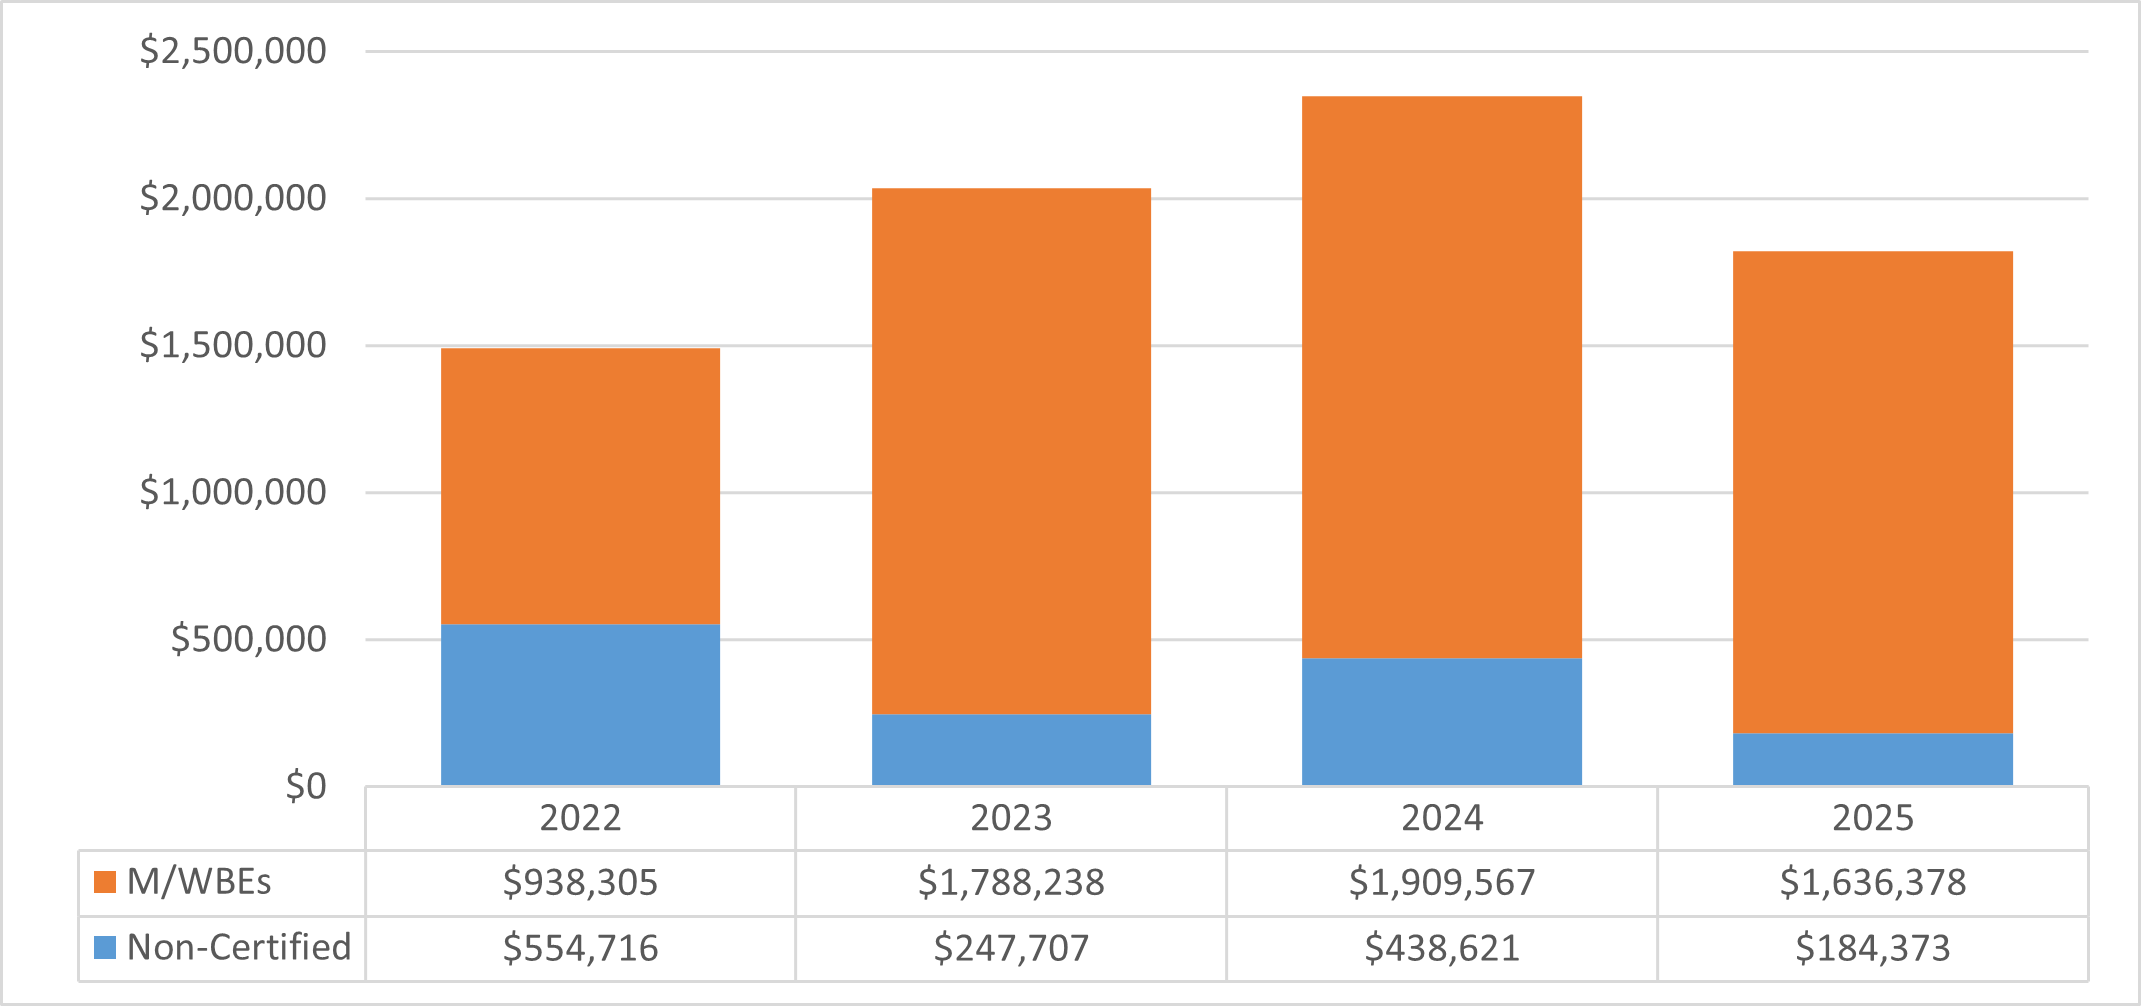
Chart 31: FY25 Value of LL 174-Eligible Contracts and POs, by Race and Gender
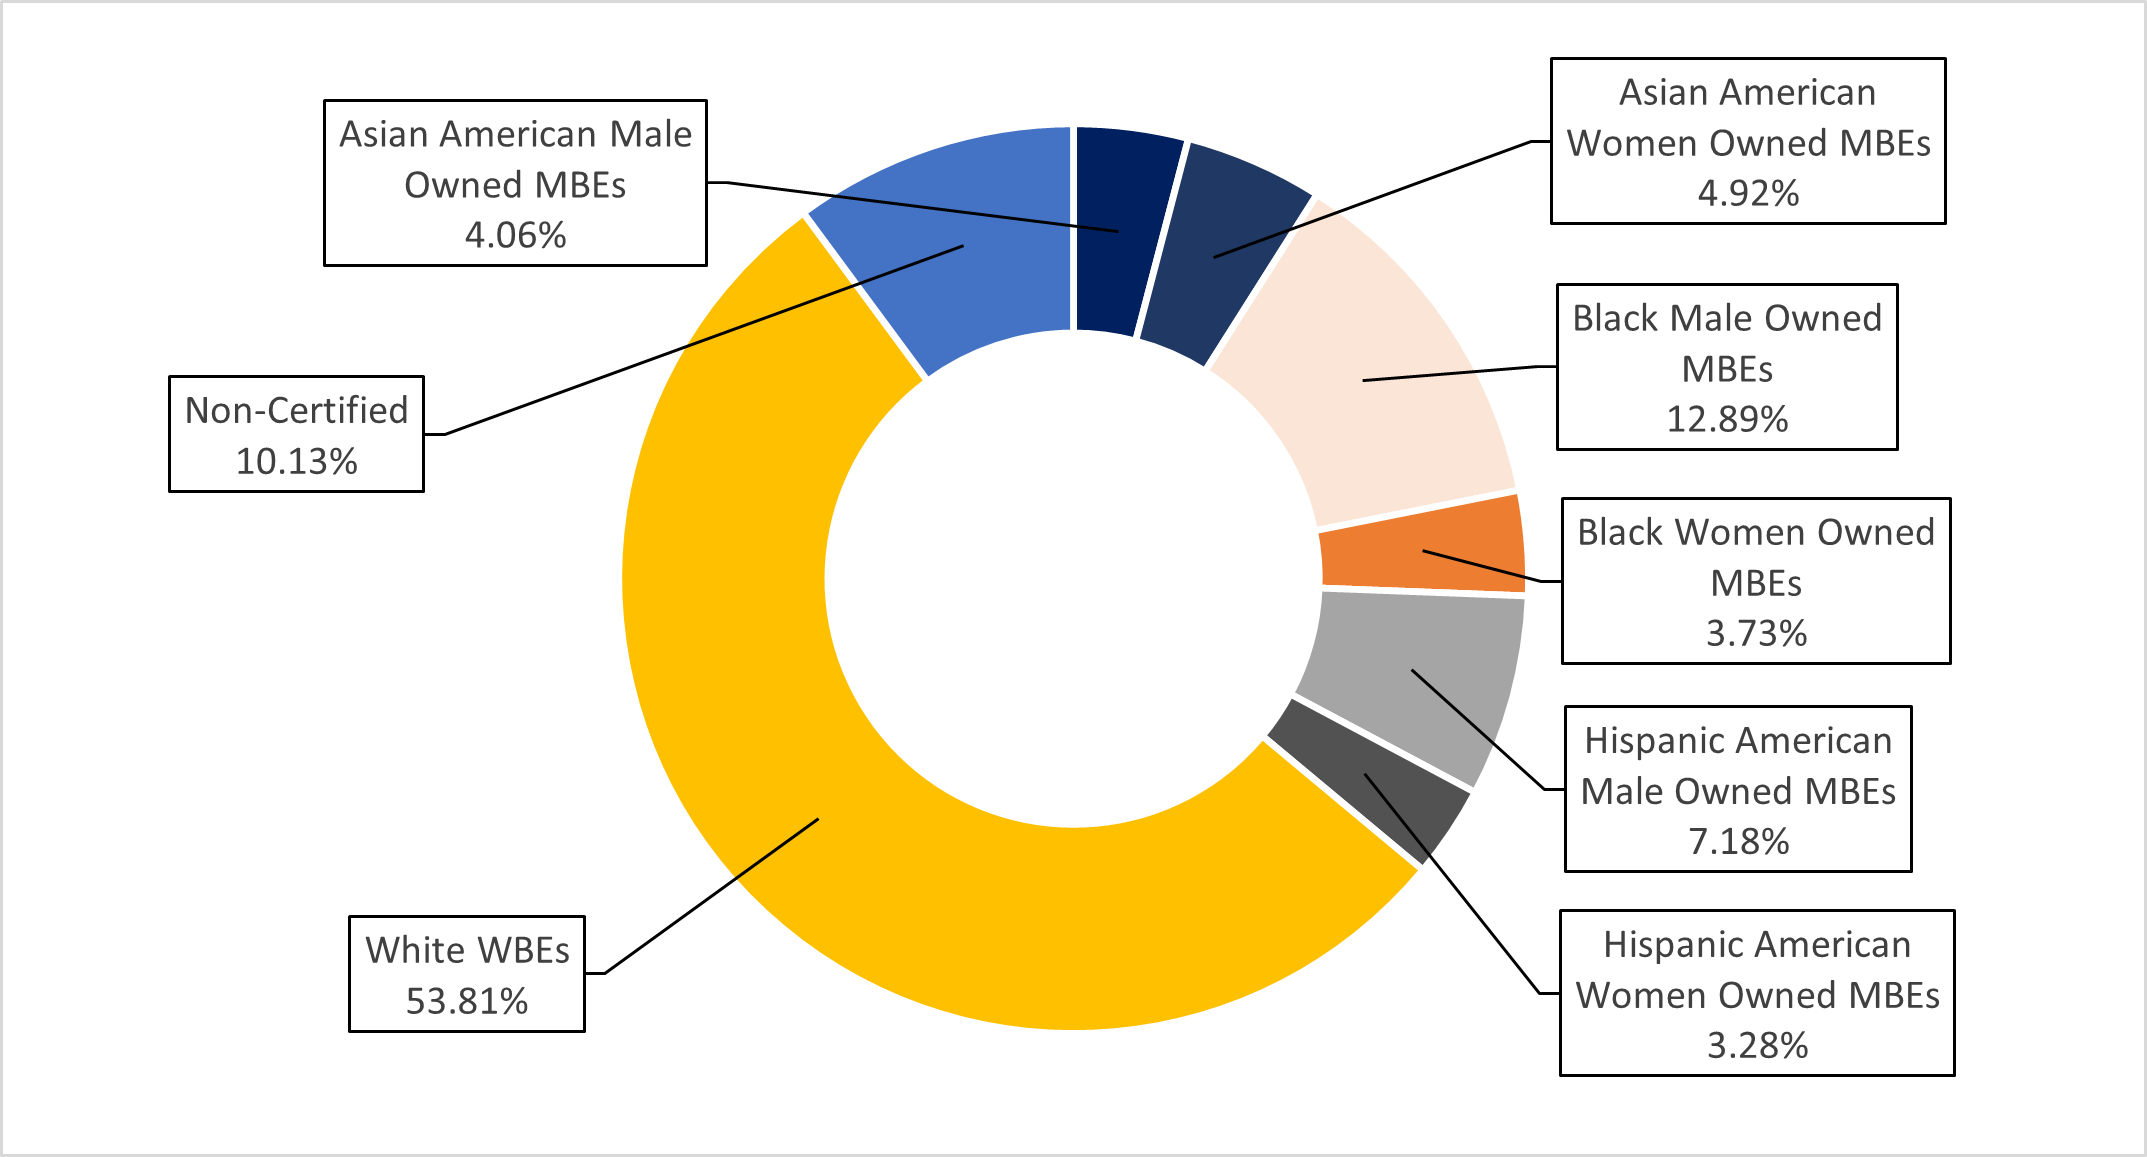
Chart 32: FY25 Share of LL 174-Eligible Contracts and PO Value, by M/WBE Category and Industry
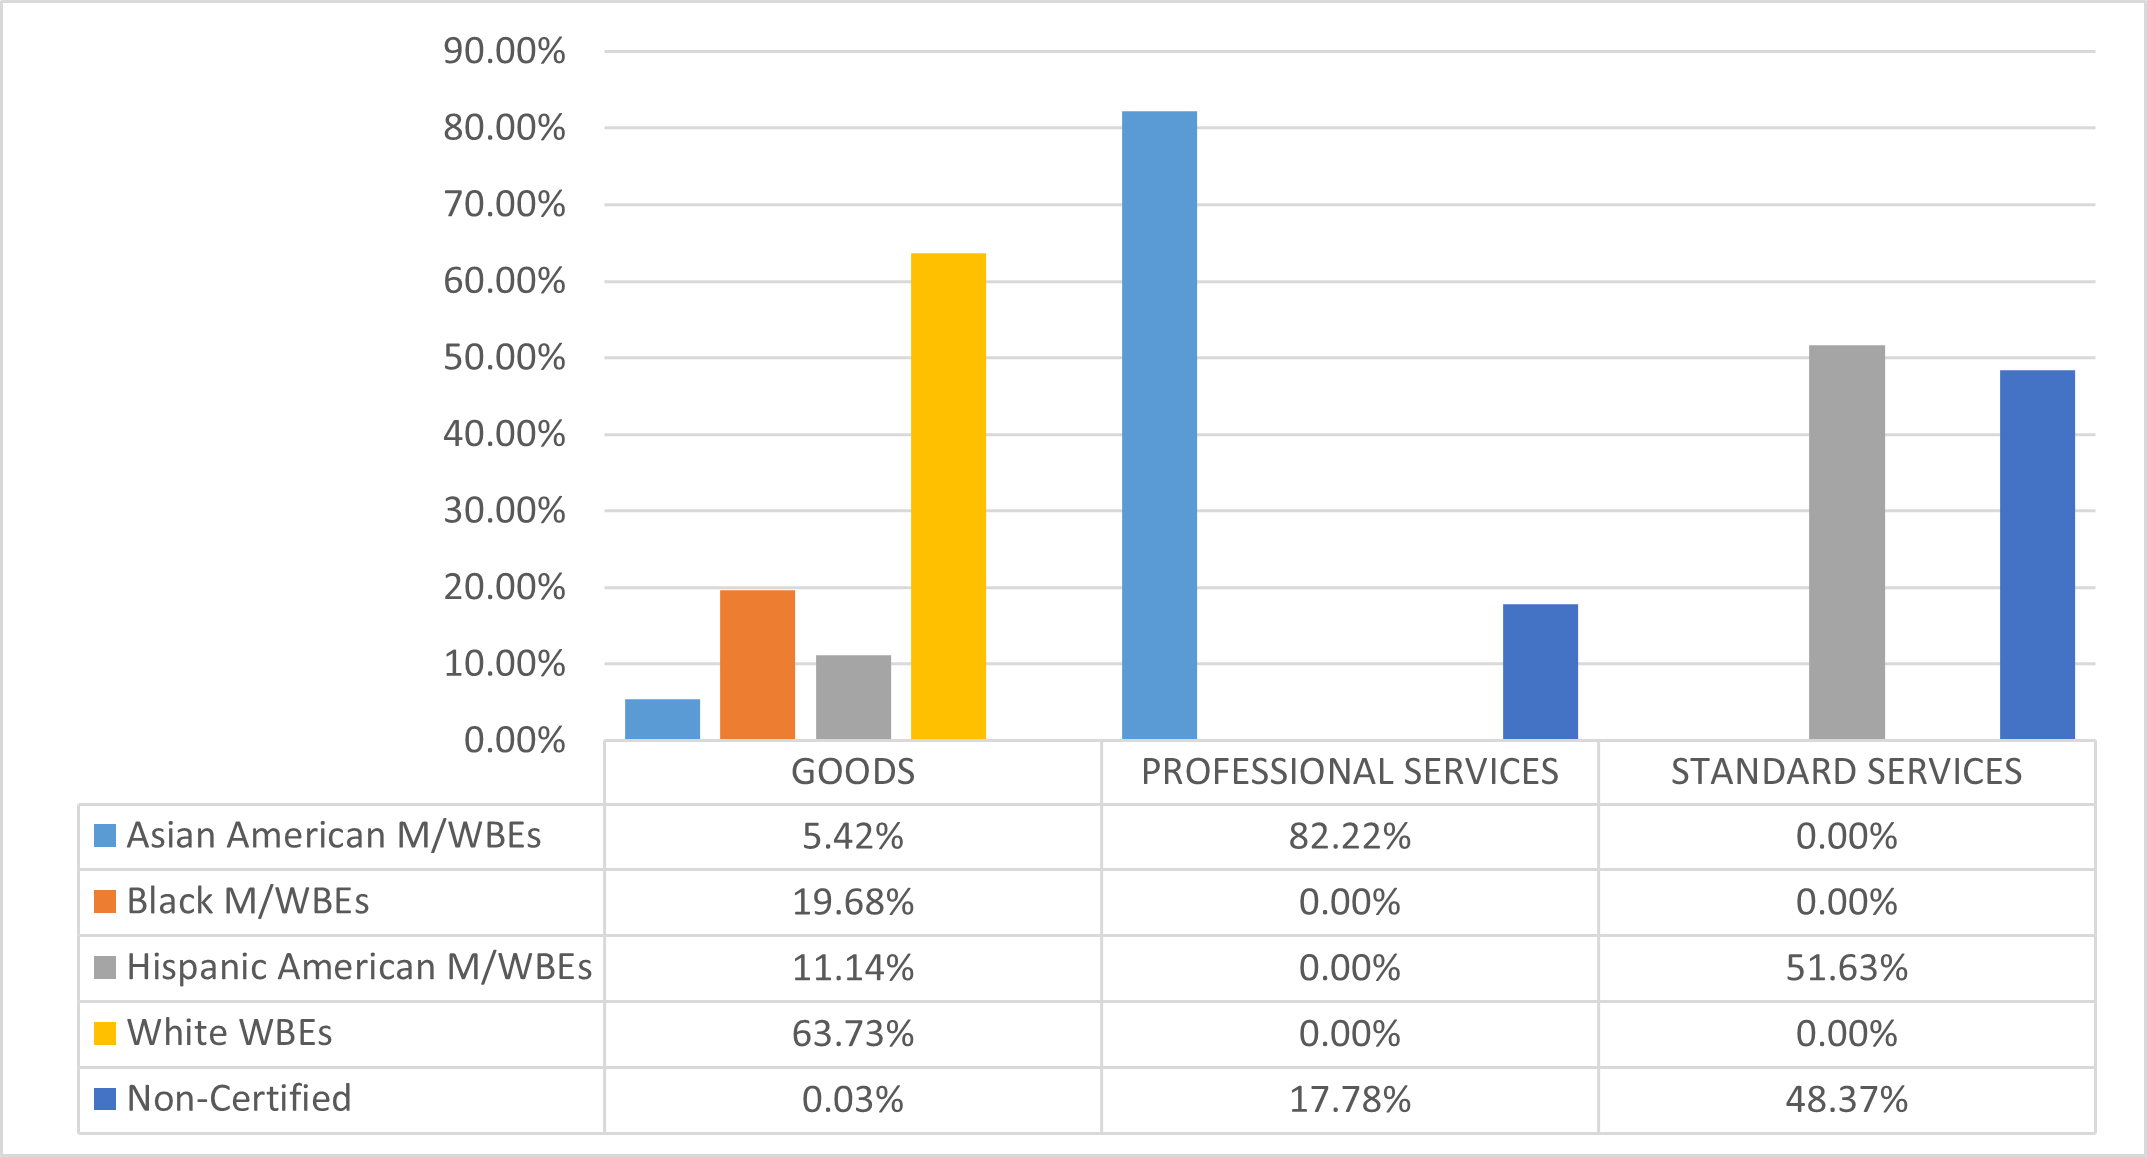
Department of City Planning (DCP)
Almost 30% of DCP’s procurement portfolio in FY25 was subject to LL 174 participation goals. Its $933,165 in LL 174-eligible value accounted for 0.005% of the City’s LL 174-eligible contracting portfolio.
Table 47: FY25 LL 174-Eligible Contracts and POs
| Certification Status | # of Contracts | % Share of Contracts | Total Registered Contract Value | % Share of Contract Value |
|---|---|---|---|---|
| All Contracts and POs | 119 | 100.00% | $3,175,871 | 100.00% |
| M/WBE | 72 | 60.50% | $832,033 | 26.20% |
| Non-Certified | 47 | 39.50% | $2,343,838 | 73.80% |
| LL174 Contracts and POs | 108 | 100.00% | $933,175 | 100.00% |
| M/WBE | 70 | 64.81% | $752,991 | 80.69% |
| Non-Certified | 38 | 35.19% | $180,184 | 19.31% |
| LL174 Subcontracts | 0 | 0.00% | $0 | 0% |
| M/WBE | 0 | 0.00% | $0 | 0% |
| Non-Certified | 0 | 0.00% | $0 | 0% |
Chart 33: FY22-25 Value of LL 174-Eligible Prime Contracts and POs
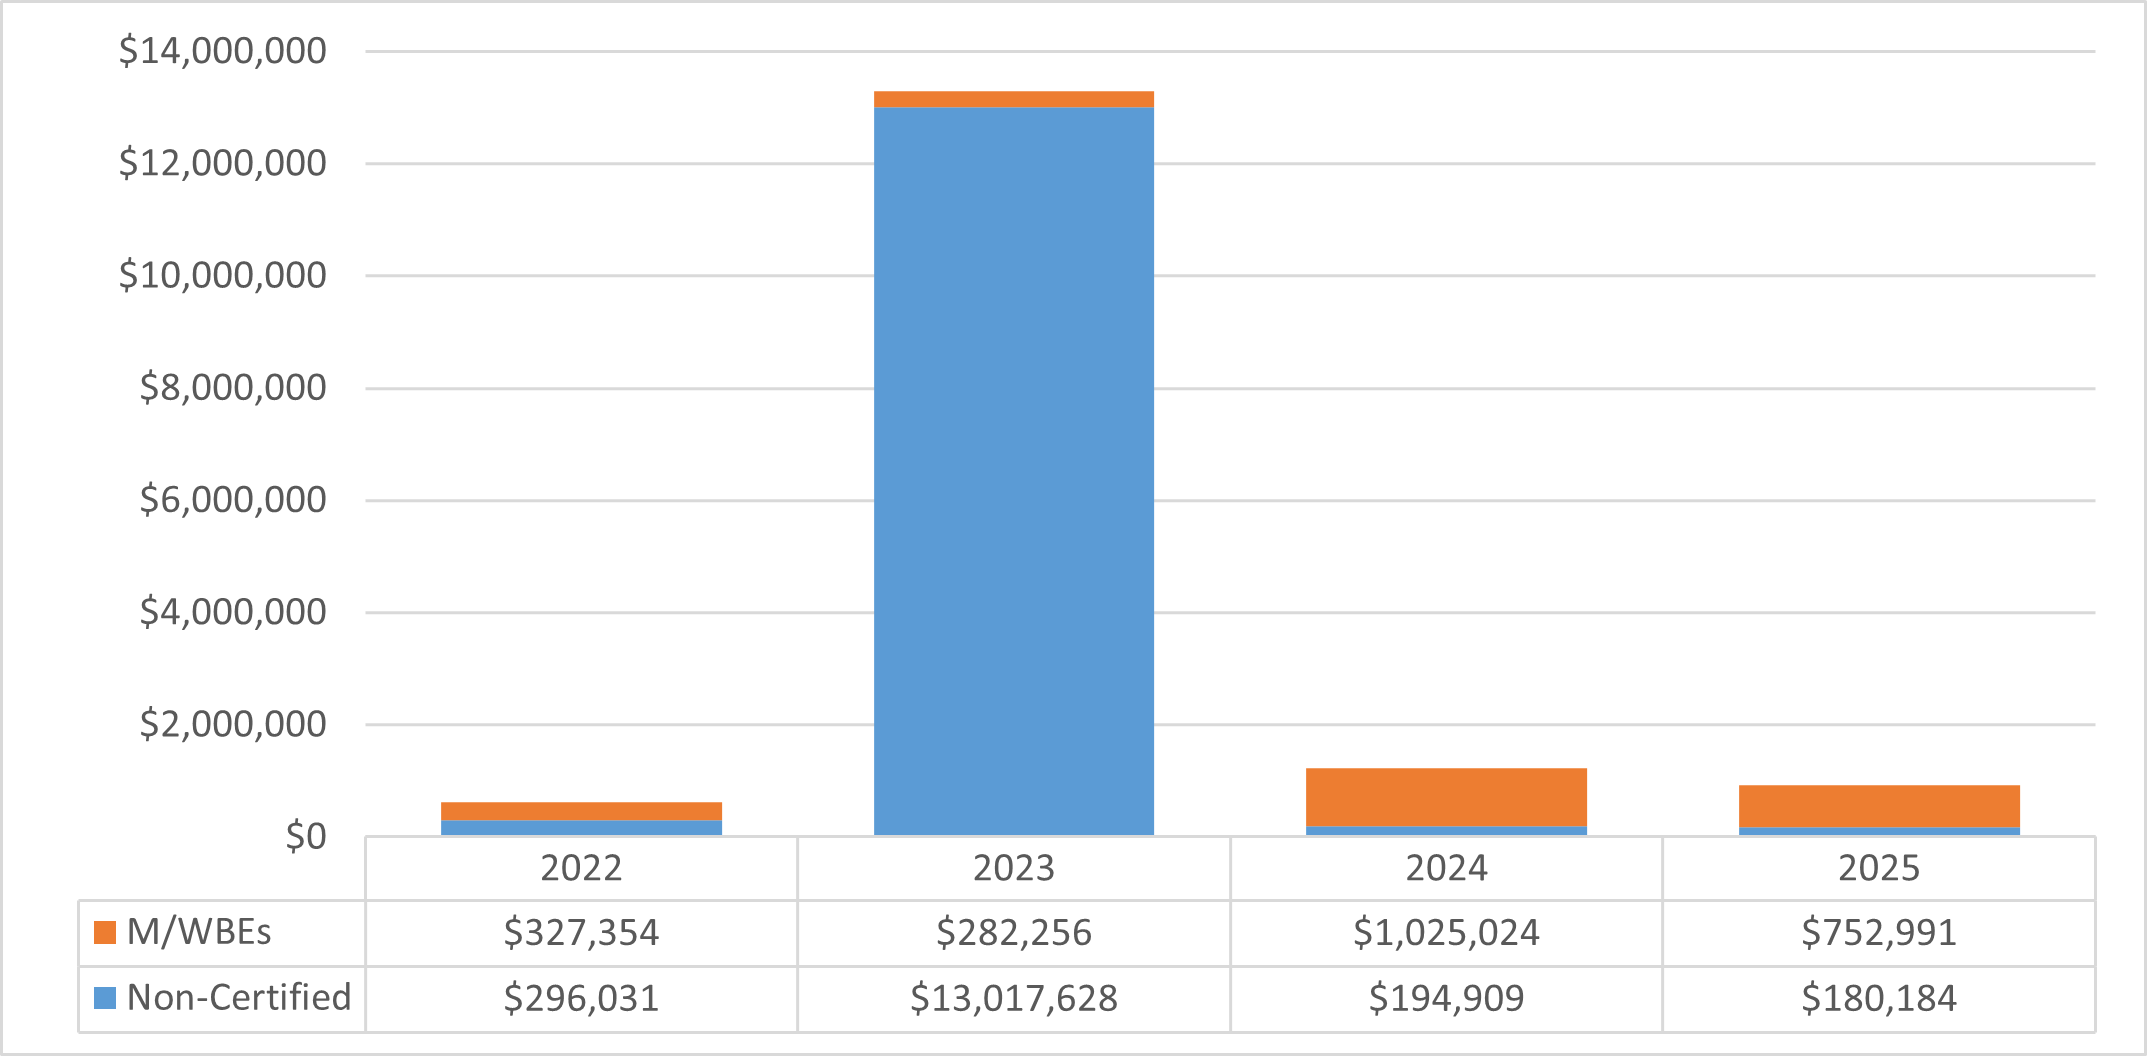
Chart 34: FY25 Value of LL 174-Eligible Contracts and POs, by Race and Gender
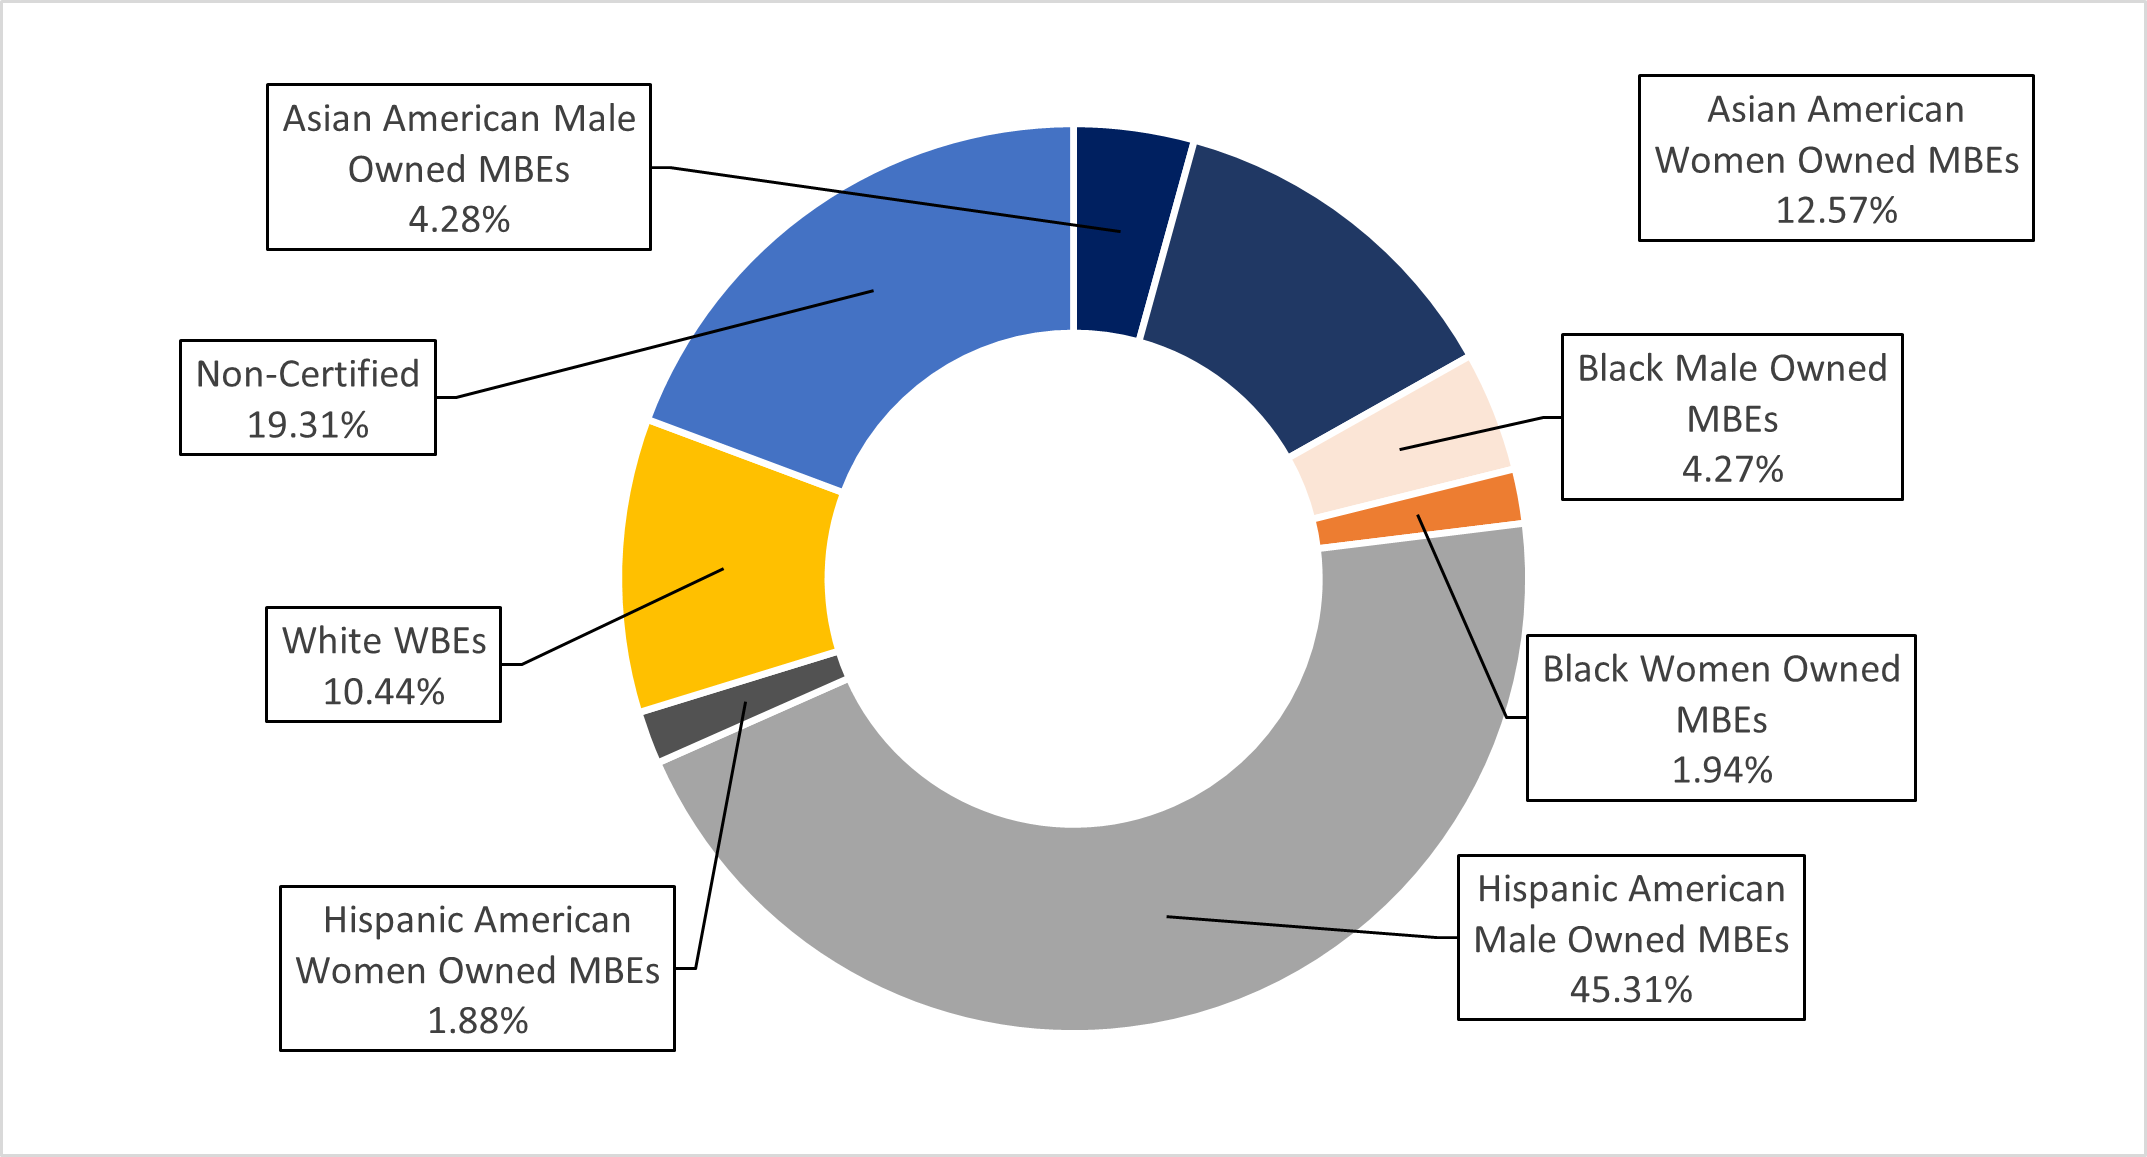
Chart 35: FY25 Share of LL 174-Eligible Contracts and PO Value, by M/WBE Category and Industry
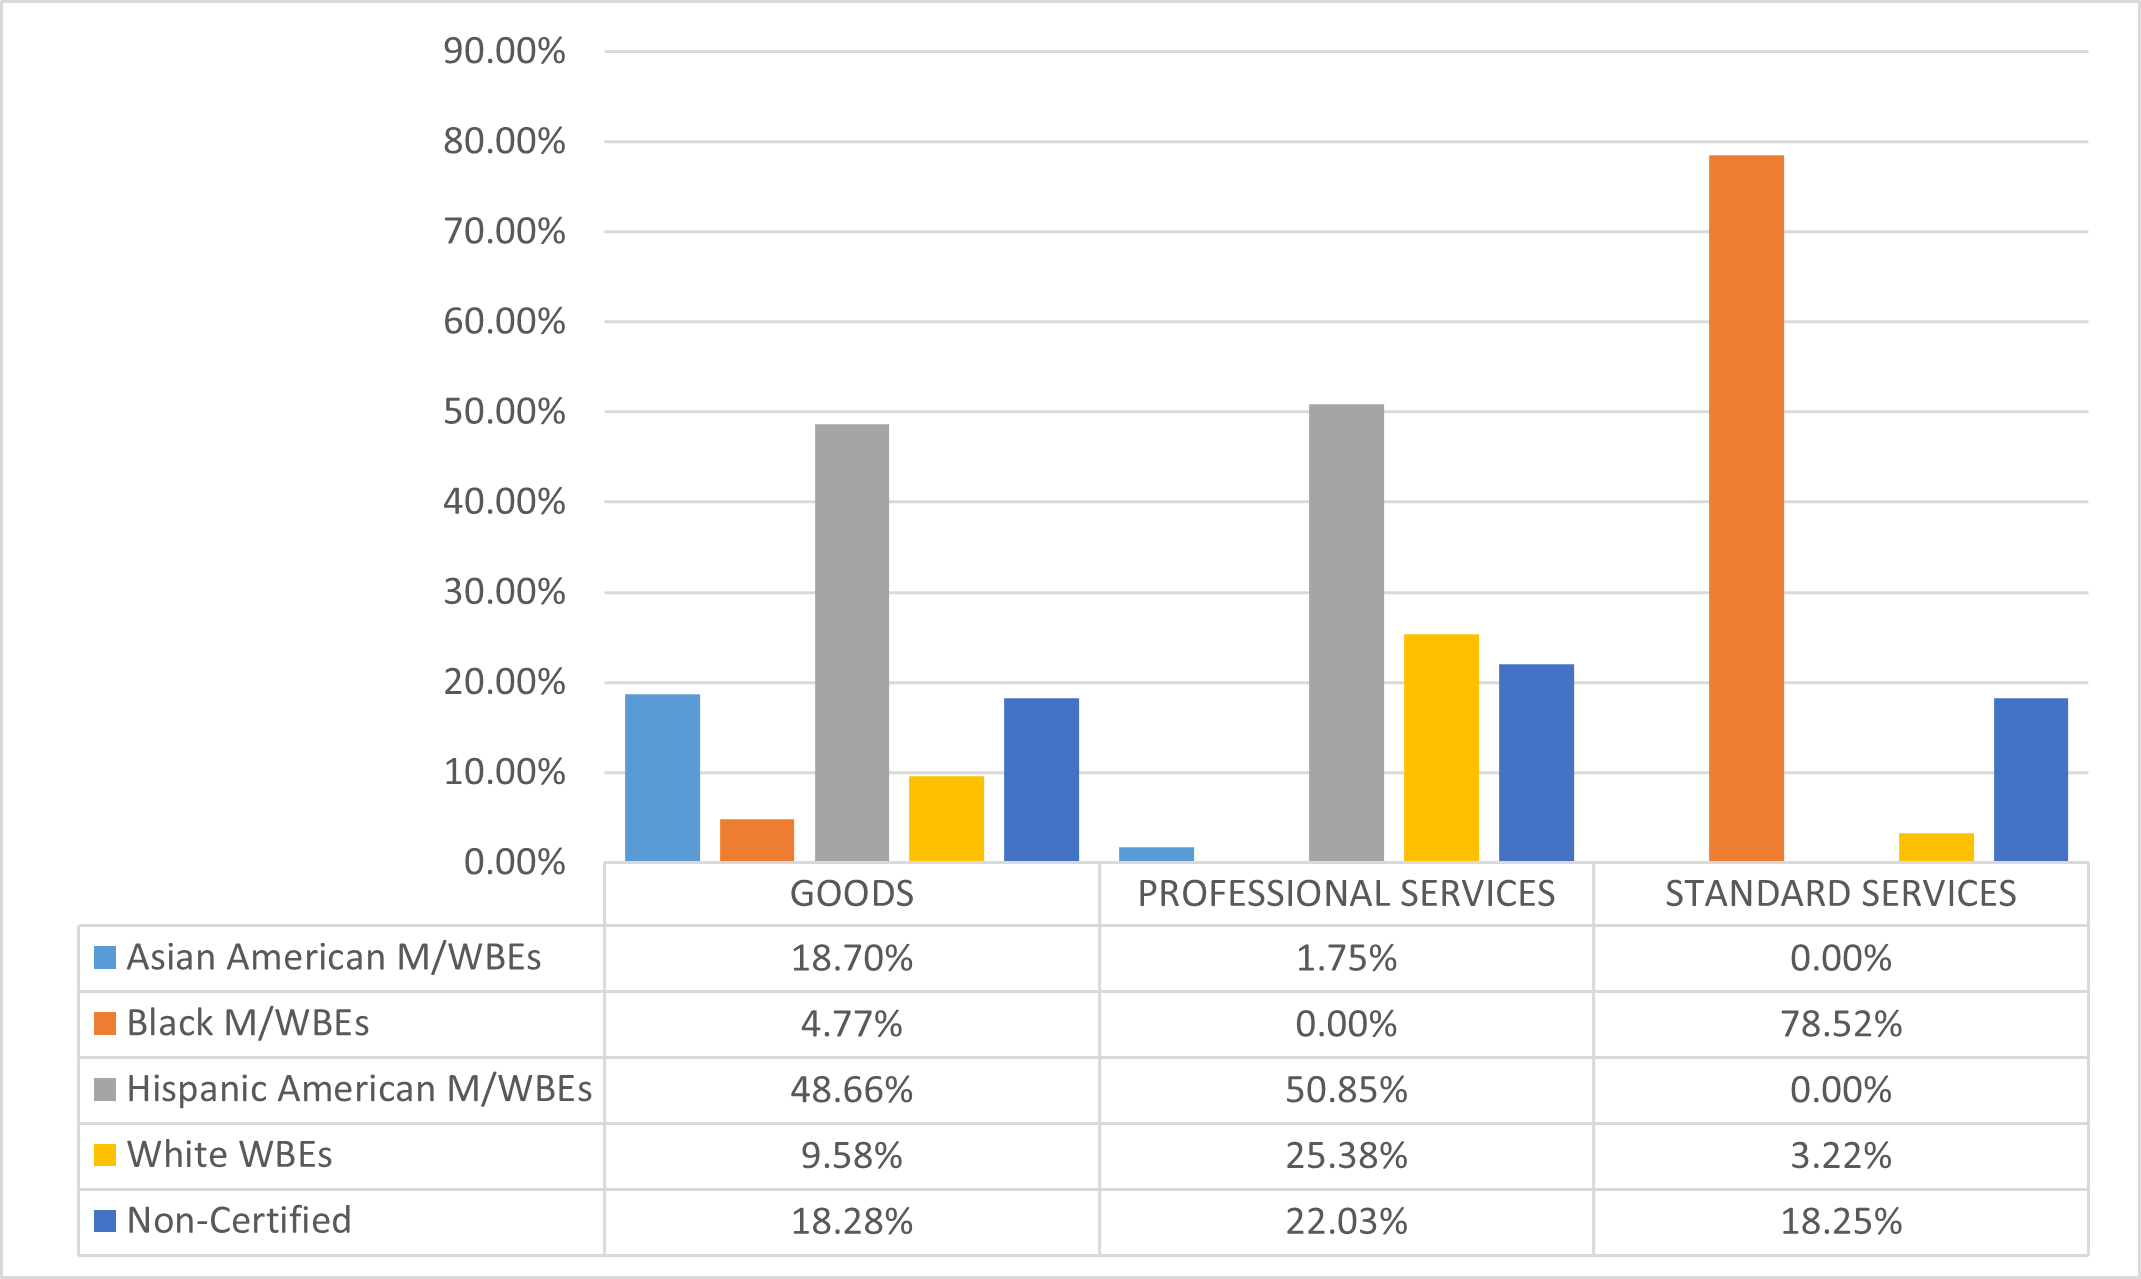
Department of Consumer and Worker Protection (DCWP)
The LL 174 totals below represent only 5% of DCWP’s procurement portfolio, as DCWP predominantly contracts with vendors for human services, which are exempt from LL 174 participation goals. DCWP’s $2 million in LL 174-eligible value represents 0.01% of the City’s LL 174-eligible contracting portfolio.
Table 48: FY25 LL 174-Eligible Contracts and POs
| Certification Status | # of Contracts | % Share of Contracts | Total Registered Contract Value | % Share of Contract Value |
|---|---|---|---|---|
| All Contracts and POs | 116 | 100.00% | $40,409,253 | 100.00% |
| M/WBE | 43 | 37.07% | $1,712,474 | 4.24% |
| Non-Certified | 73 | 62.93% | $38,696,780 | 95.76% |
| LL174 Contracts and POs | 100 | 100.00% | $2,023,194 | 100.00% |
| M/WBE | 42 | 42.00% | $1,674,974 | 82.79% |
| Non-Certified | 58 | 58.00% | $348,221 | 17.21% |
| LL174 Subcontracts | 0 | 0.00% | $0 | 0% |
| M/WBE | 0 | 0.00% | $0 | 0% |
| Non-Certified | 0 | 0.00% | $0 | 0% |
Chart 36: FY22-25 Value of LL 174-Eligible Prime Contracts and POs
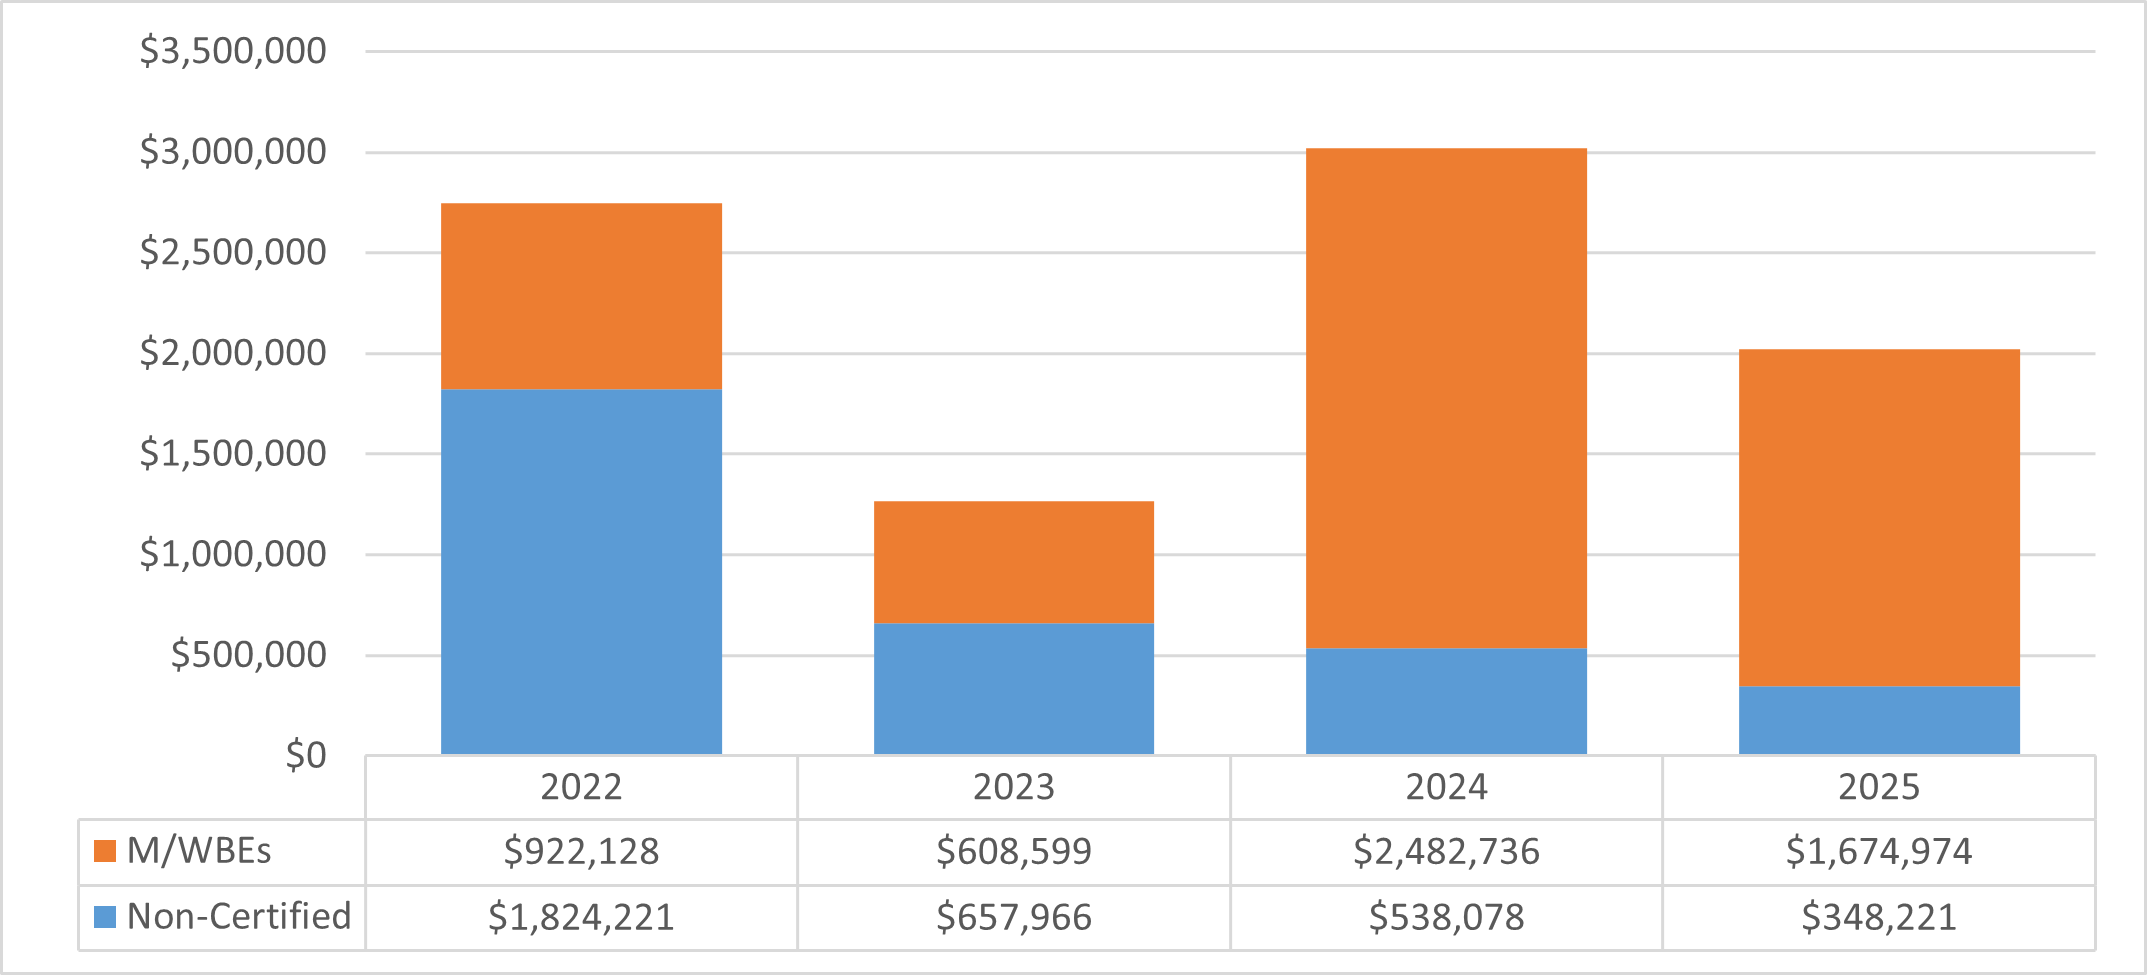
Chart 37: FY25 Value of LL 174-Eligible Contracts and POs, by Race and Gender
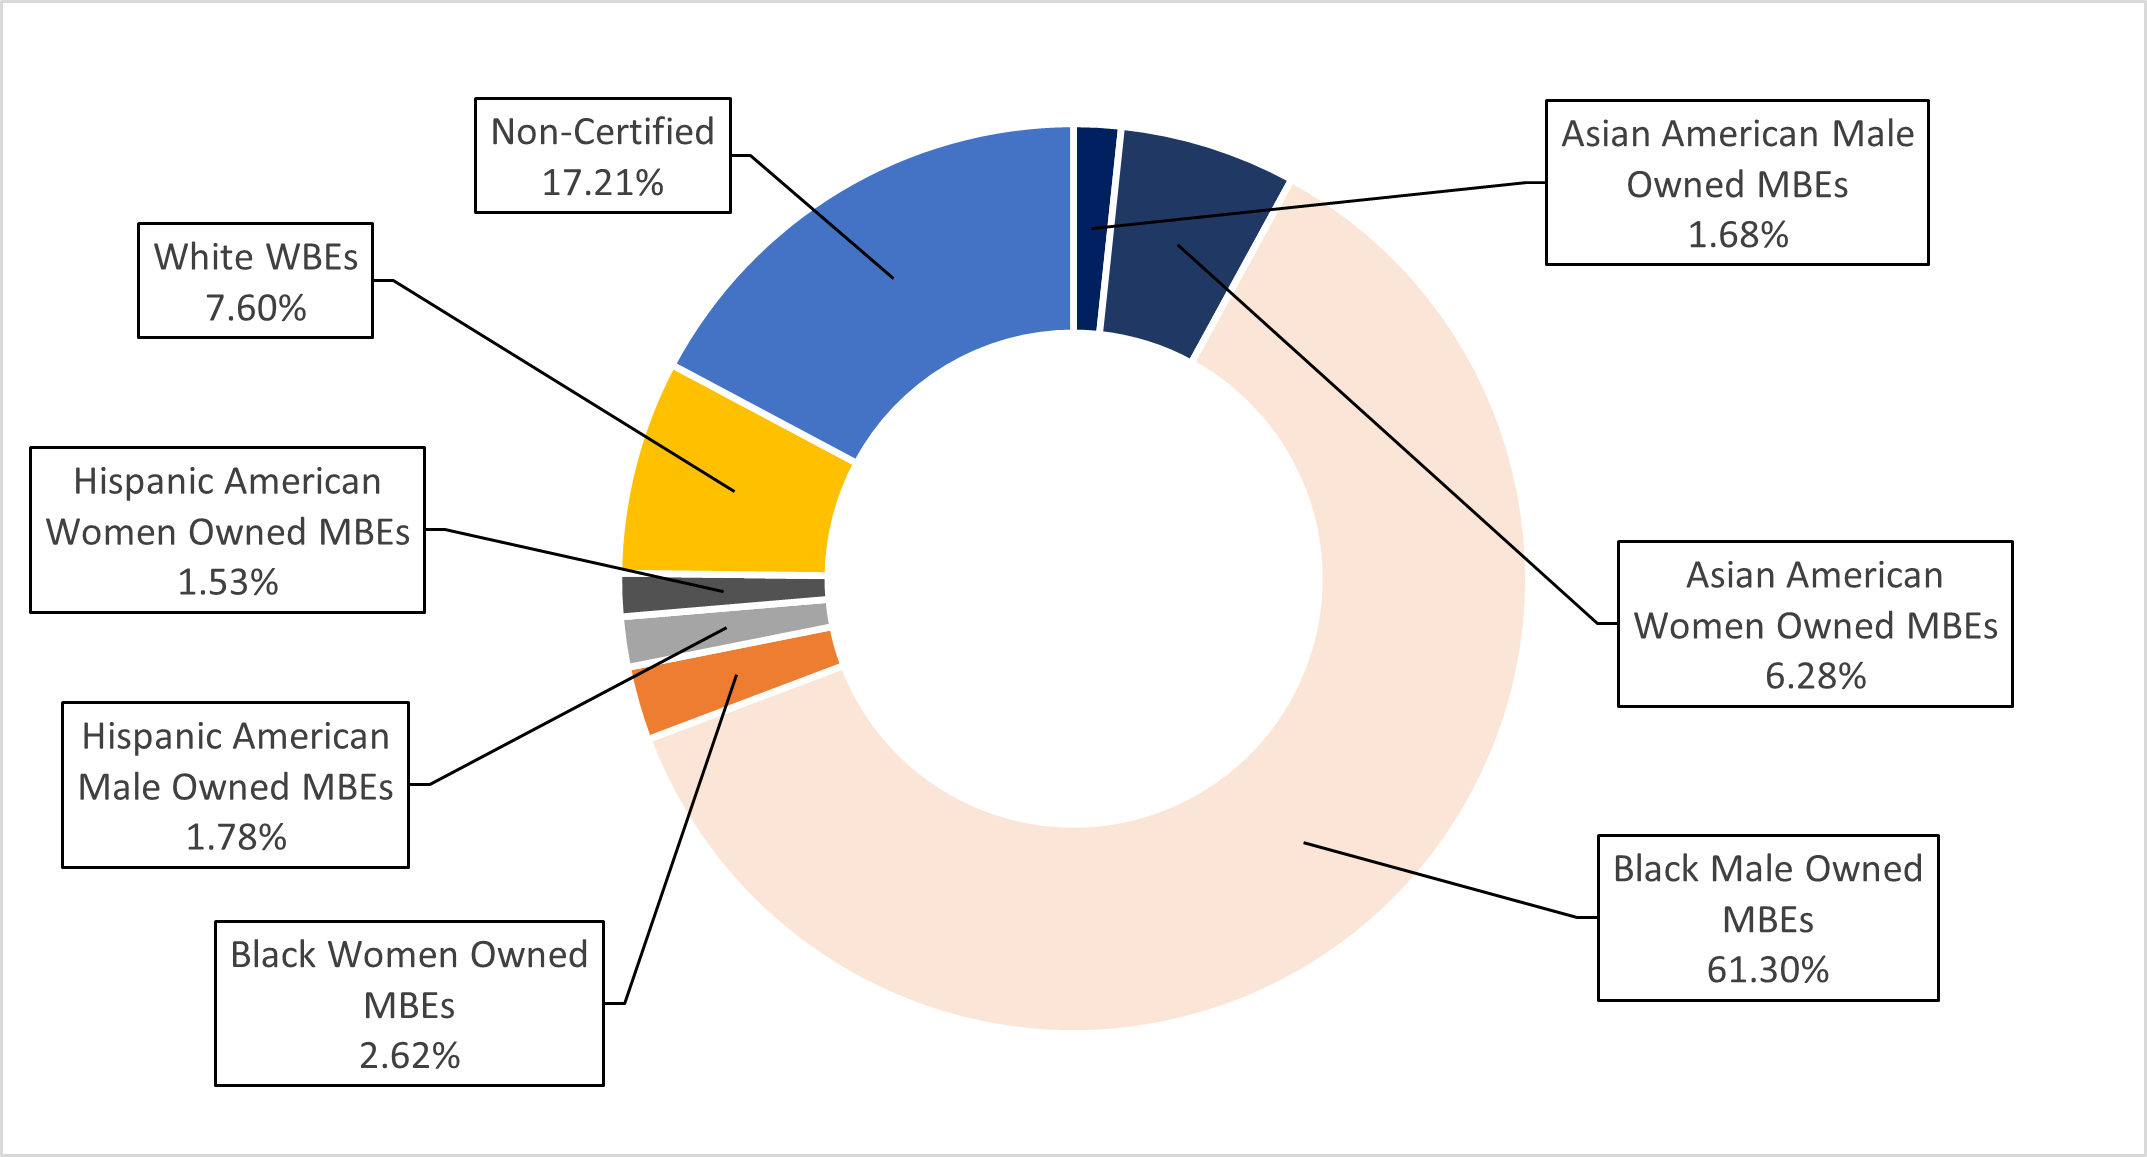
Chart 38: FY25 Share of LL 174-Eligible Contracts and PO Value, by M/WBE Category and Industry
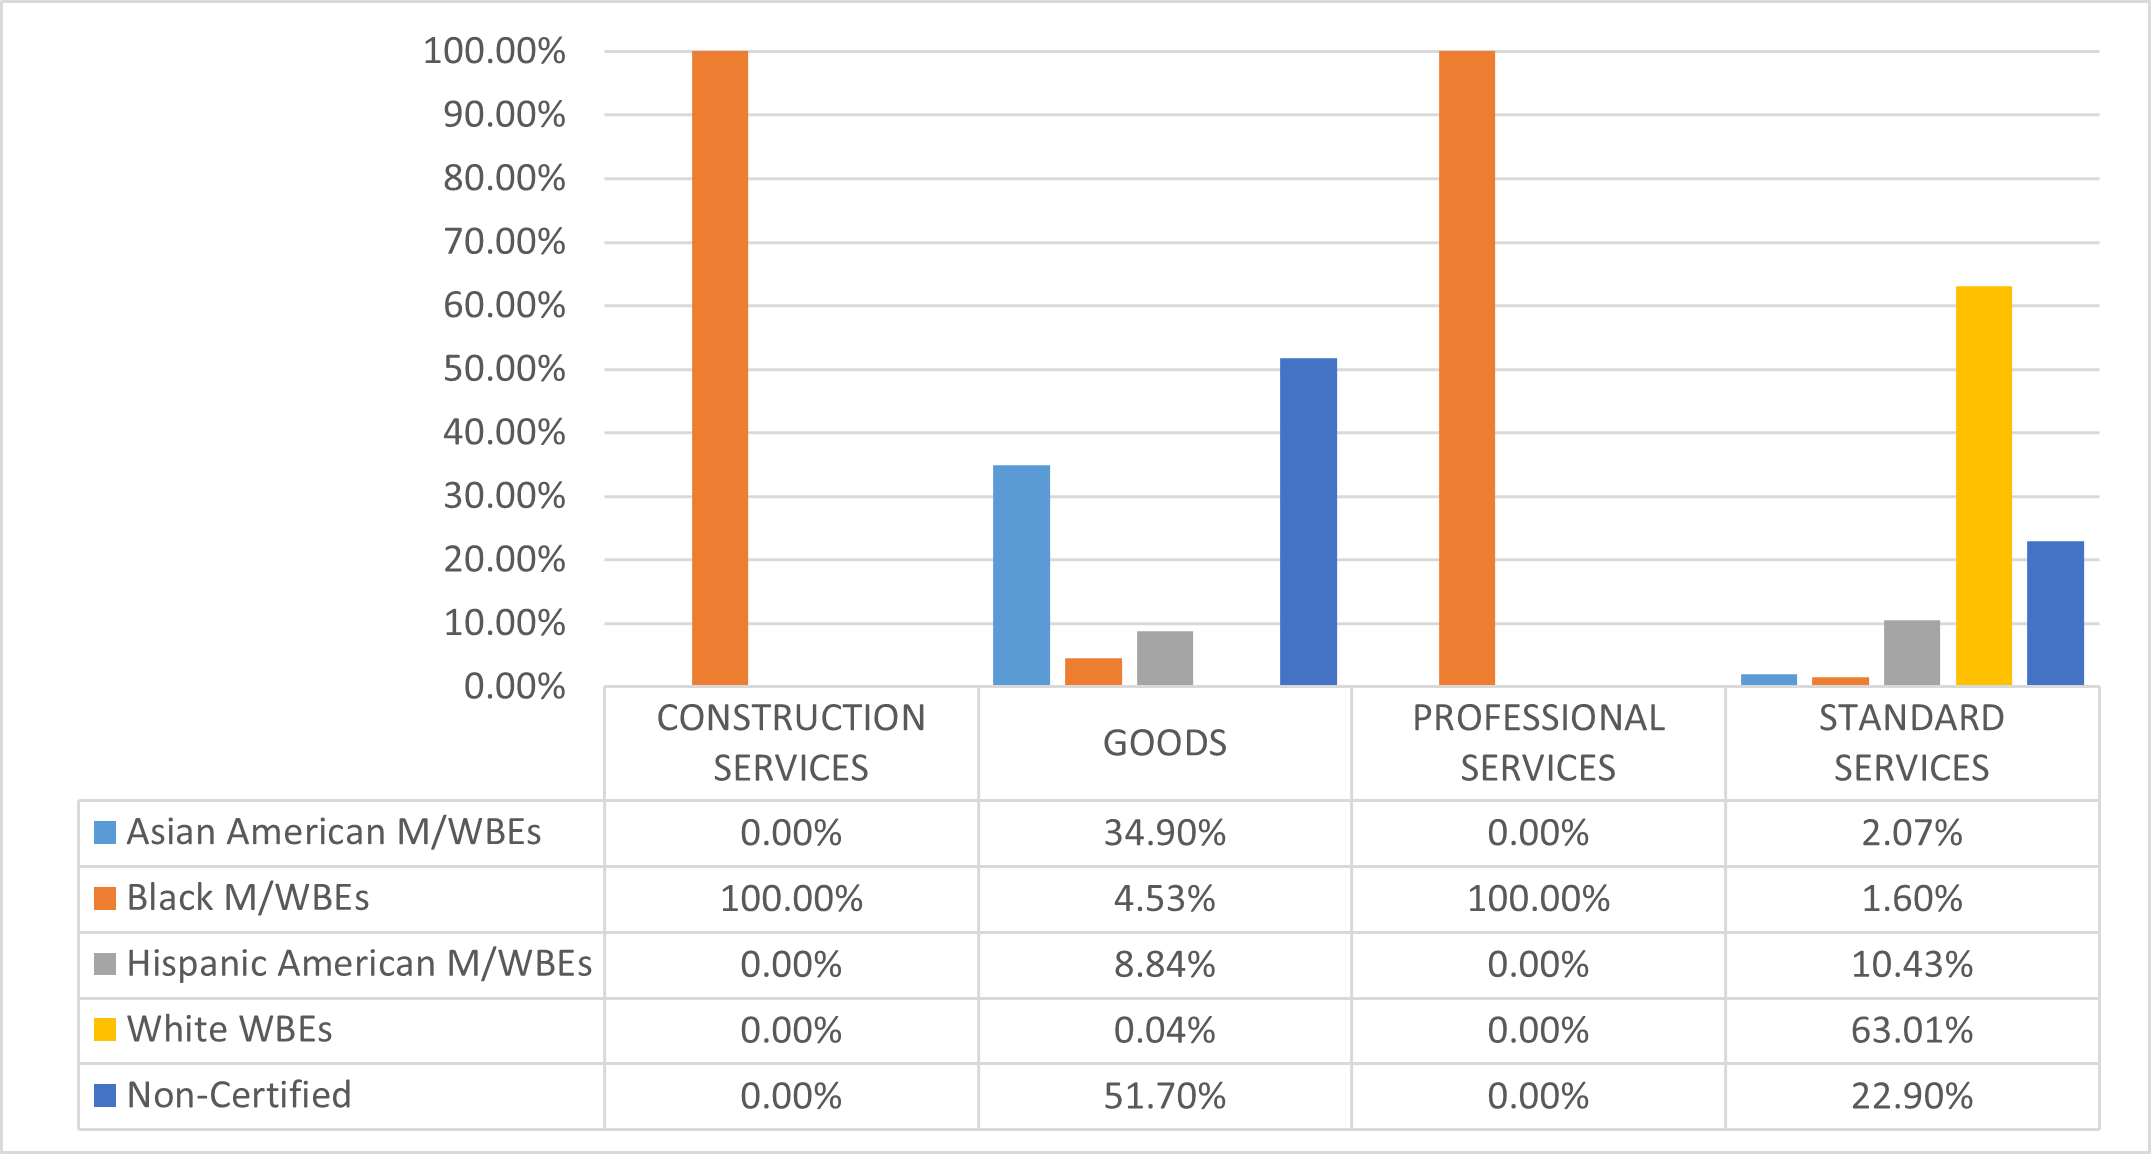
Department of Design and Construction (DDC)
DDC has one of the largest procurement portfolios across the City and almost all of its registered contract value is subject to LL 174 participation goals. DDC’s $13 billion in LL 174-eligible contracts accounts for about 75% of the City’s overall LL 174-eligible contracting portfolio. Notably, in FY25, DDC registered 3 contracts to non-certified firms for the design-build construction of borough-based jails in Queens, Manhattan, and the Bronx (referred to as “the FY25 DDC BBJ contracts”). Together, these contracts are valued at $10.7 billion and impacted the agency’s and City’s M/WBE utilization rate. Construction contracts procured via design-build are expected to comply with the objectives and goals of LL 174, and as such are included in these analyses.
Furthermore, many of DDC’s contracts are funded, at least in part, by non-City sources, which are excluded from the local law. City procurement systems are limited and do not include the necessary data to confirm if a contract is in fact funded by State or Federal funds. Due to these limitations, LL 174-eligible data in this Report includes some contracts that may actually be excluded from LL 174.
DDC recorded 309 subcontracts in PASSPort, the most of all agencies, and almost 45% of reported subcontract value was registered to M/WBEs.
Table 49: FY25 LL 174-Eligible Contracts and POs
| Certification Status | # of Contracts | % Share of Contracts | Total Registered Contract Value | % Share of Contract Value |
|---|---|---|---|---|
| All Contracts and POs | 431 | 100.00% | $13,632,194,893 | 100.00% |
| M/WBE | 121 | 28.07% | $826,376,334 | 6.06% |
| Non-Certified | 310 | 71.93% | $12,805,818,559 | 93.94% |
| LL174 Contracts and POs | 266 | 100.00% | $13,184,840,383 | 100.00% |
| M/WBE | 94 | 35.34% | $743,212,937 | 5.64% |
| Non-Certified | 172 | 64.66% | $12,441,627,447 | 94.36% |
| LL174 Subcontracts | 466 | 100.00% | $601,254,331 | 100.00% |
| M/WBE | 309 | 66.31% | $131,641,821 | 21.89% |
| Non-Certified | 157 | 33.69% | $469,612,510 | 78.11% |
Chart 39: FY22-25 Value of LL 174-Eligible Prime Contracts and POs
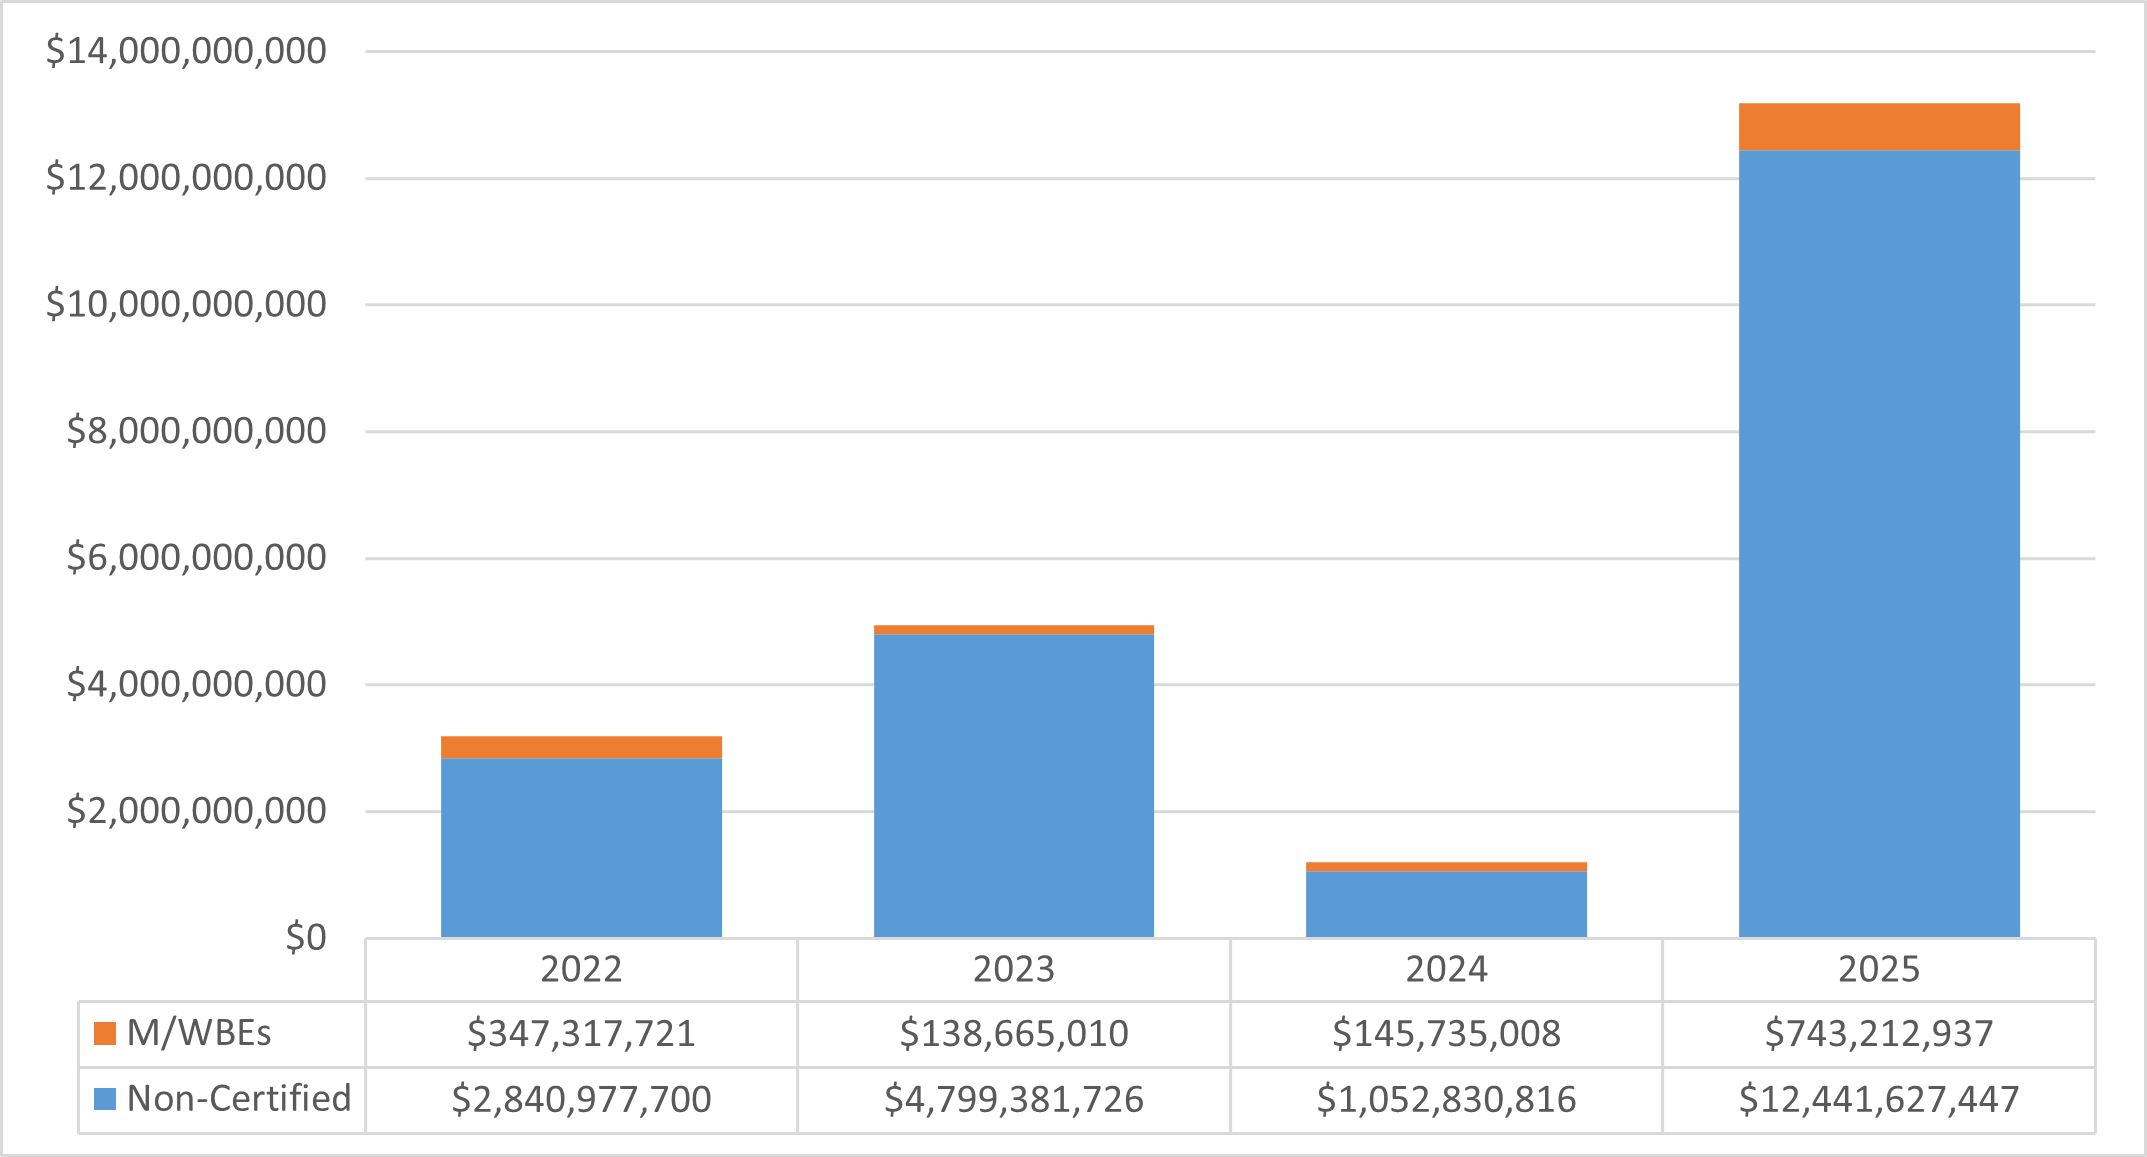
Chart 40: FY25 Value of LL 174-Eligible Contracts and POs, by Race and Gender
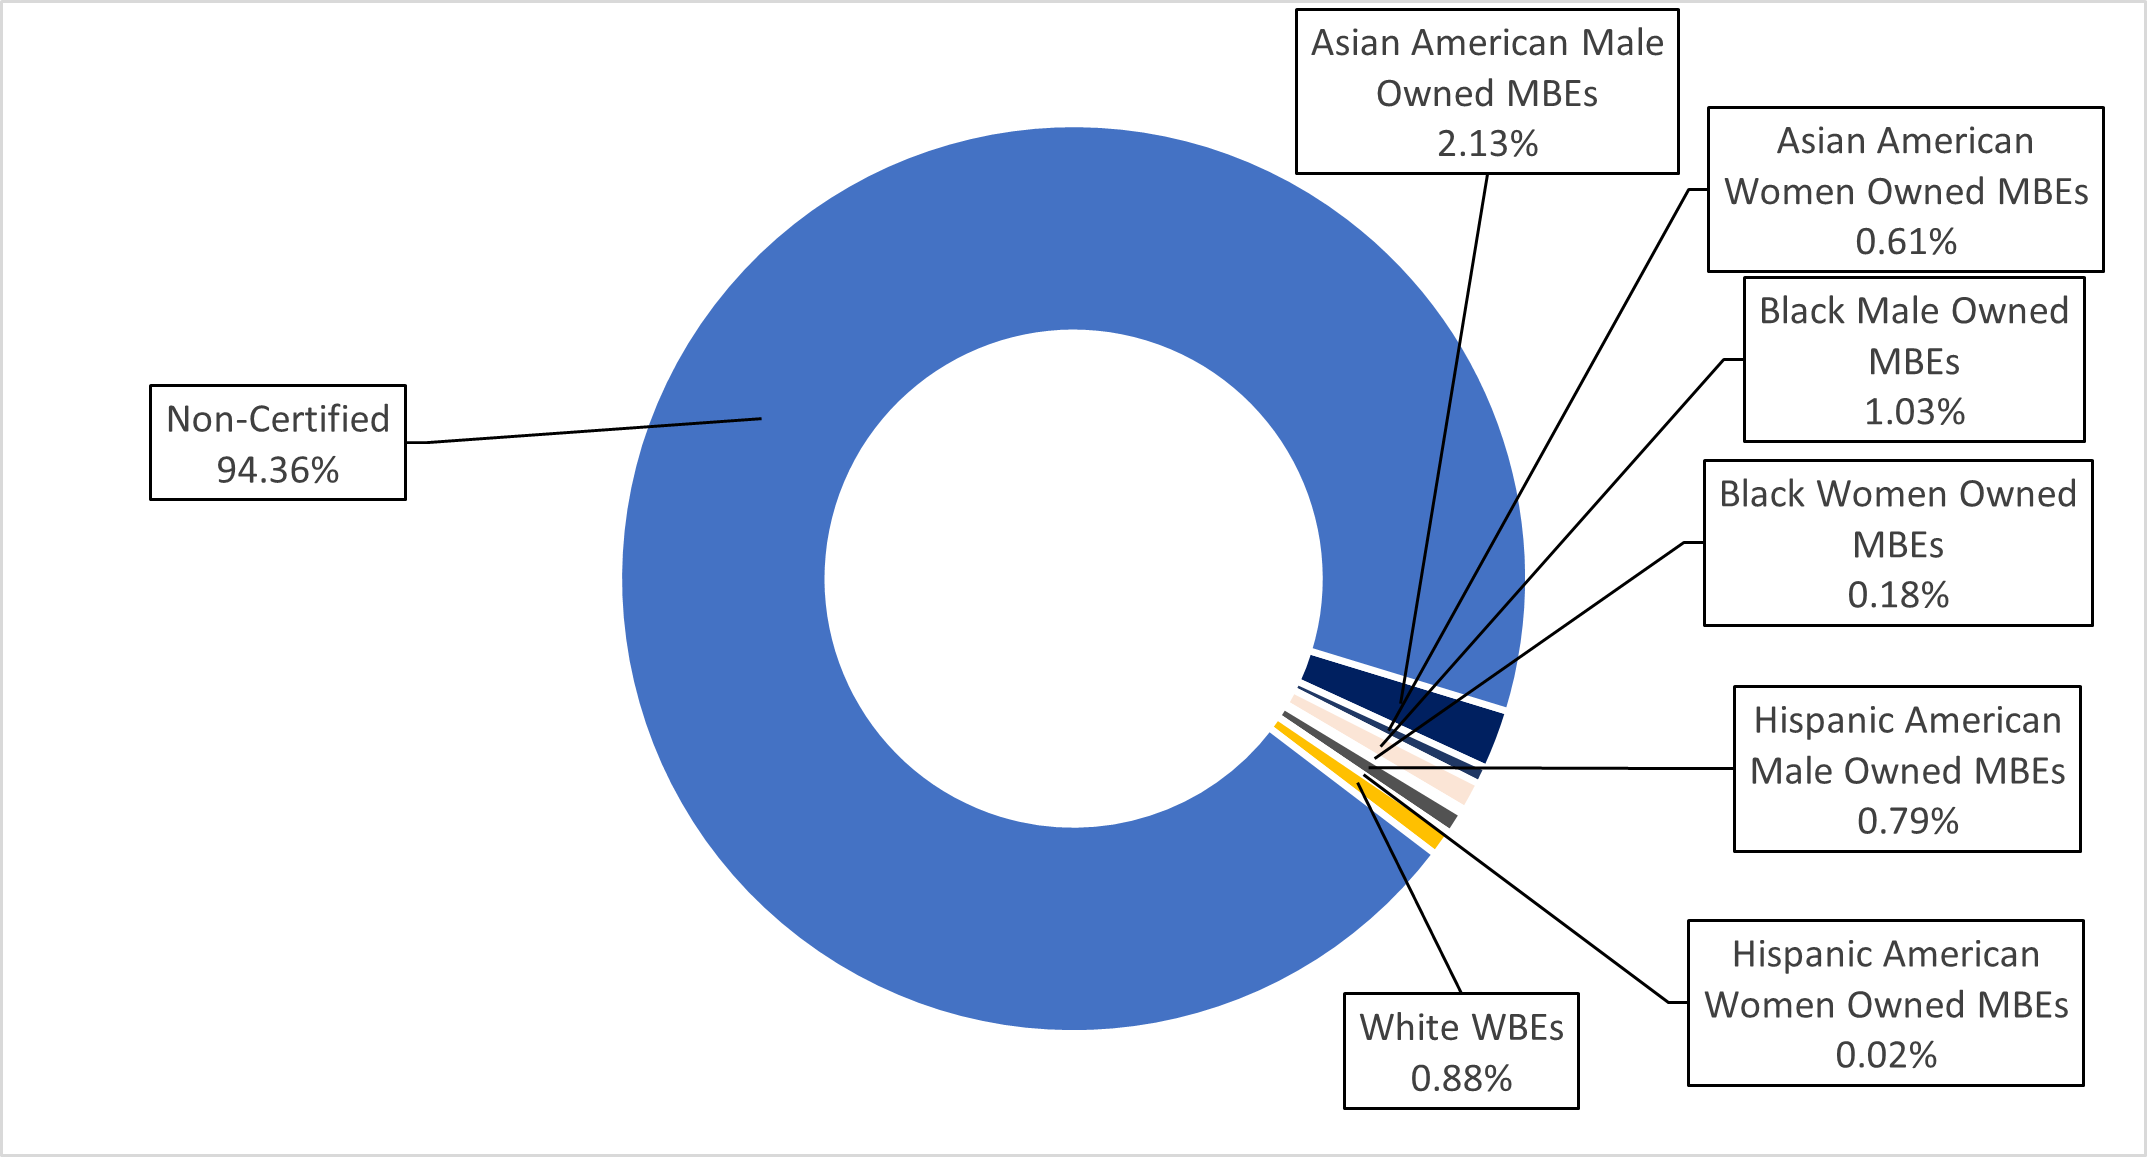
Chart 41: FY25 Share of LL 174-Eligible Contracts and PO Value, by M/WBE Category and Industry
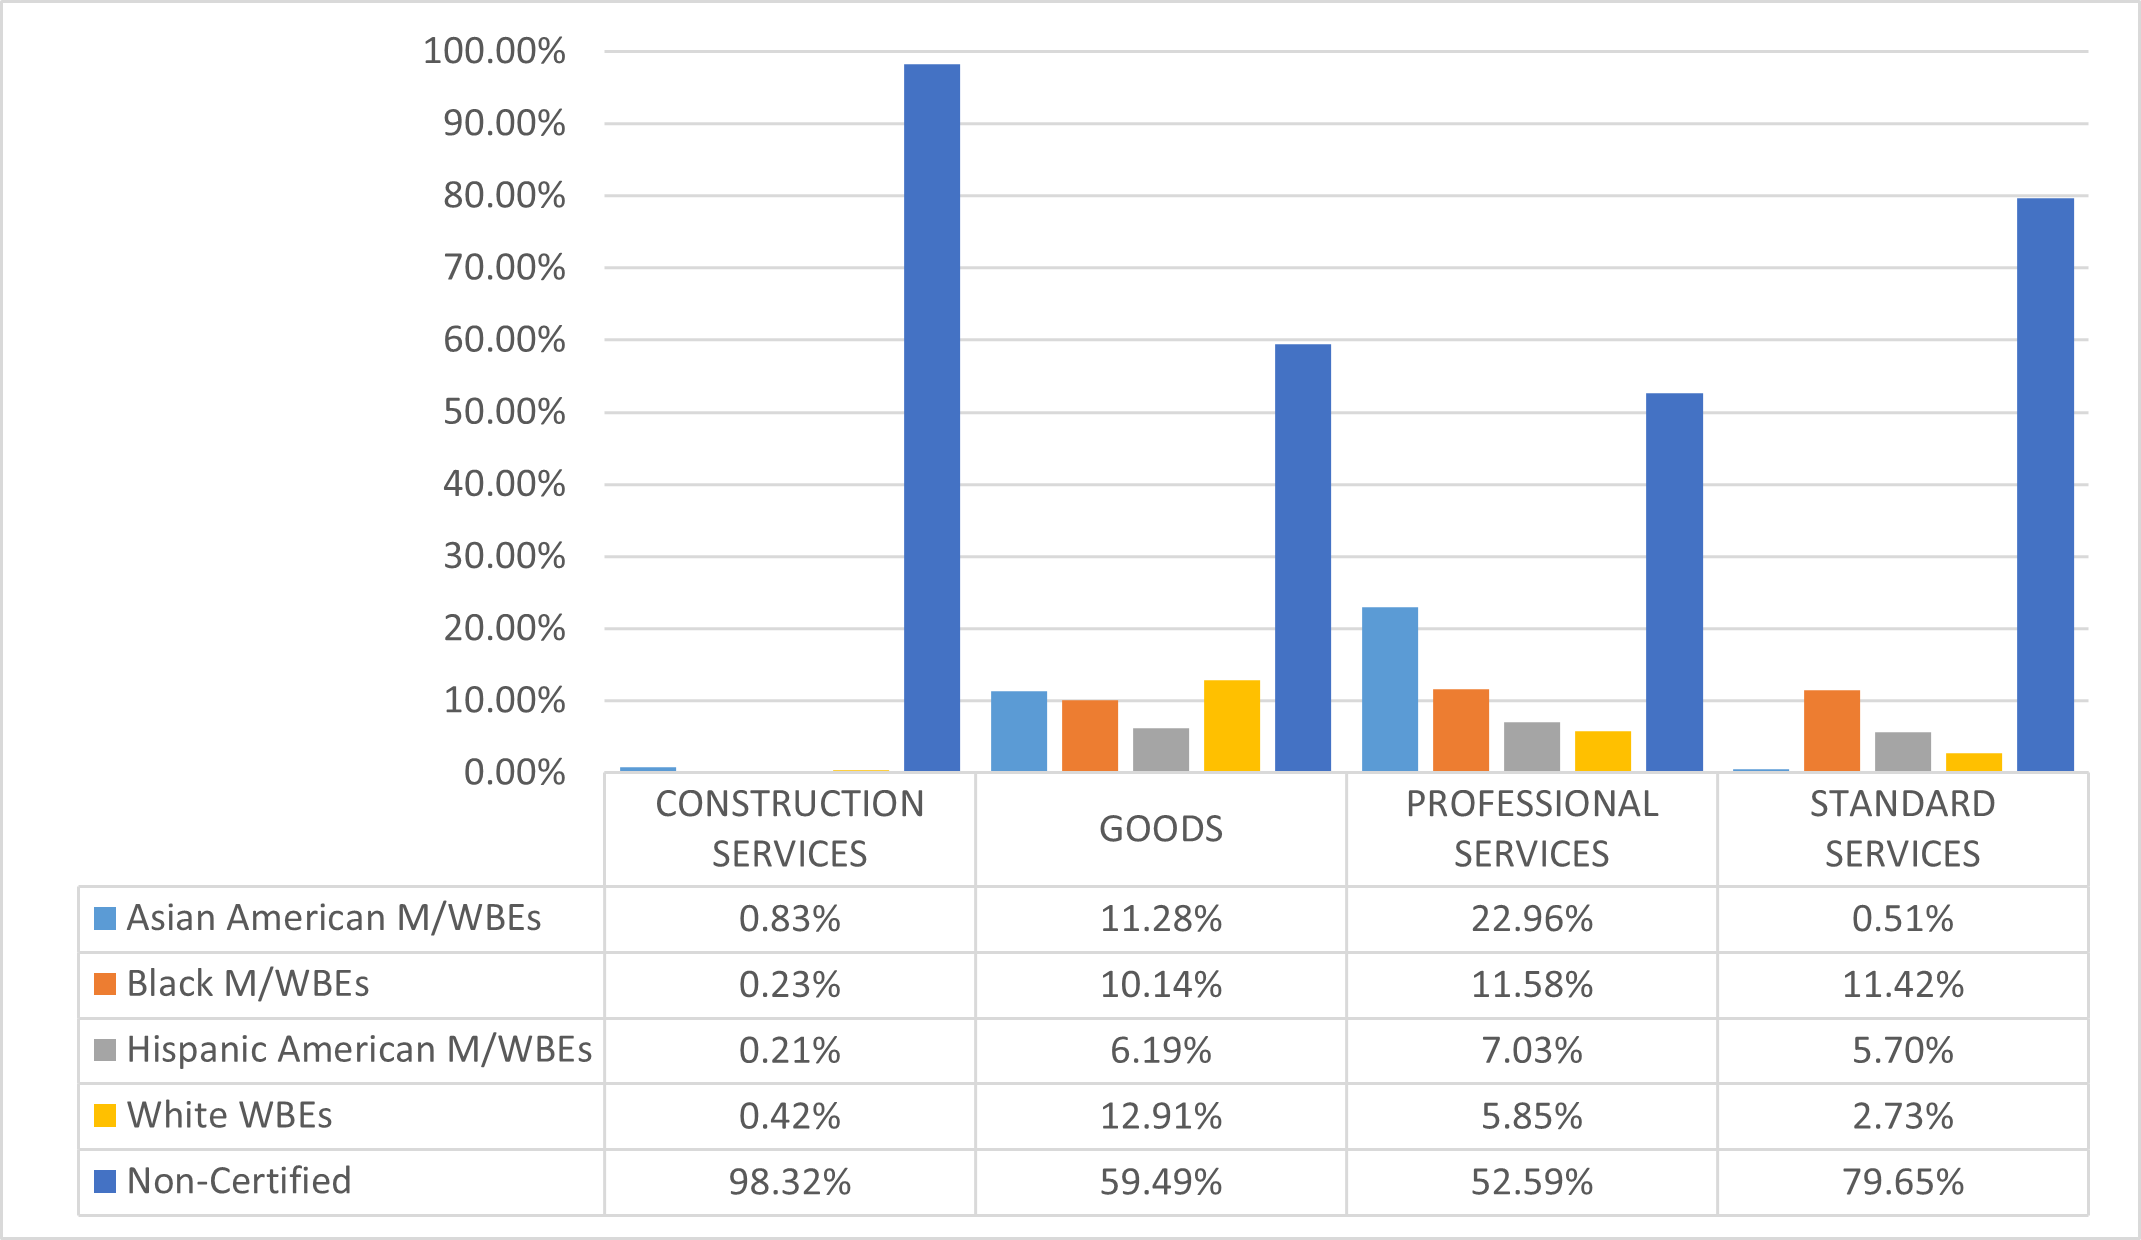
Department of Environmental Protection (DEP)
The majority of DEP’s FY25 procurement portfolio is subject to LL 174 participation goals (72%). However, many of DEP’s contracts are funded, at least in part, by non-City sources, which are excluded from the local law.[42] DEP represents about 15% of the City’s total LL 174-eligible contracting portfolio (acknowledging that this total may include some excluded contracts).
Table 50: FY25 LL 174-Eligible Contracts and POs
| Certification Status | # of Contracts | % Share of Contracts | Total Registered Contract Value | % Share of Contract Value |
|---|---|---|---|---|
| All Contracts and POs | 2,016 | 100.00% | $3,675,413,851 | 100.00% |
| M/WBE | 1,271 | 63.05% | $84,482,391 | 2.30% |
| Non-Certified | 745 | 36.95% | $3,590,931,460 | 97.70% |
| LL174 Contracts and POs | 1,892 | 100.00% | $2,679,119,824 | 100.00% |
| M/WBE | 1,256 | 66.38% | $67,285,129 | 2.51% |
| Non-Certified | 636 | 33.62% | $2,611,834,695 | 97.49% |
| LL174 Subcontracts | 176 | 100.00% | $515,339,604 | 100.00% |
| M/WBE | 129 | 73.30% | $209,713,409 | 40.69% |
| Non-Certified | 47 | 26.70% | $305,626,194 | 59.31% |
Chart 42: FY22-25 Value of LL 174-Eligible Prime Contracts and POs
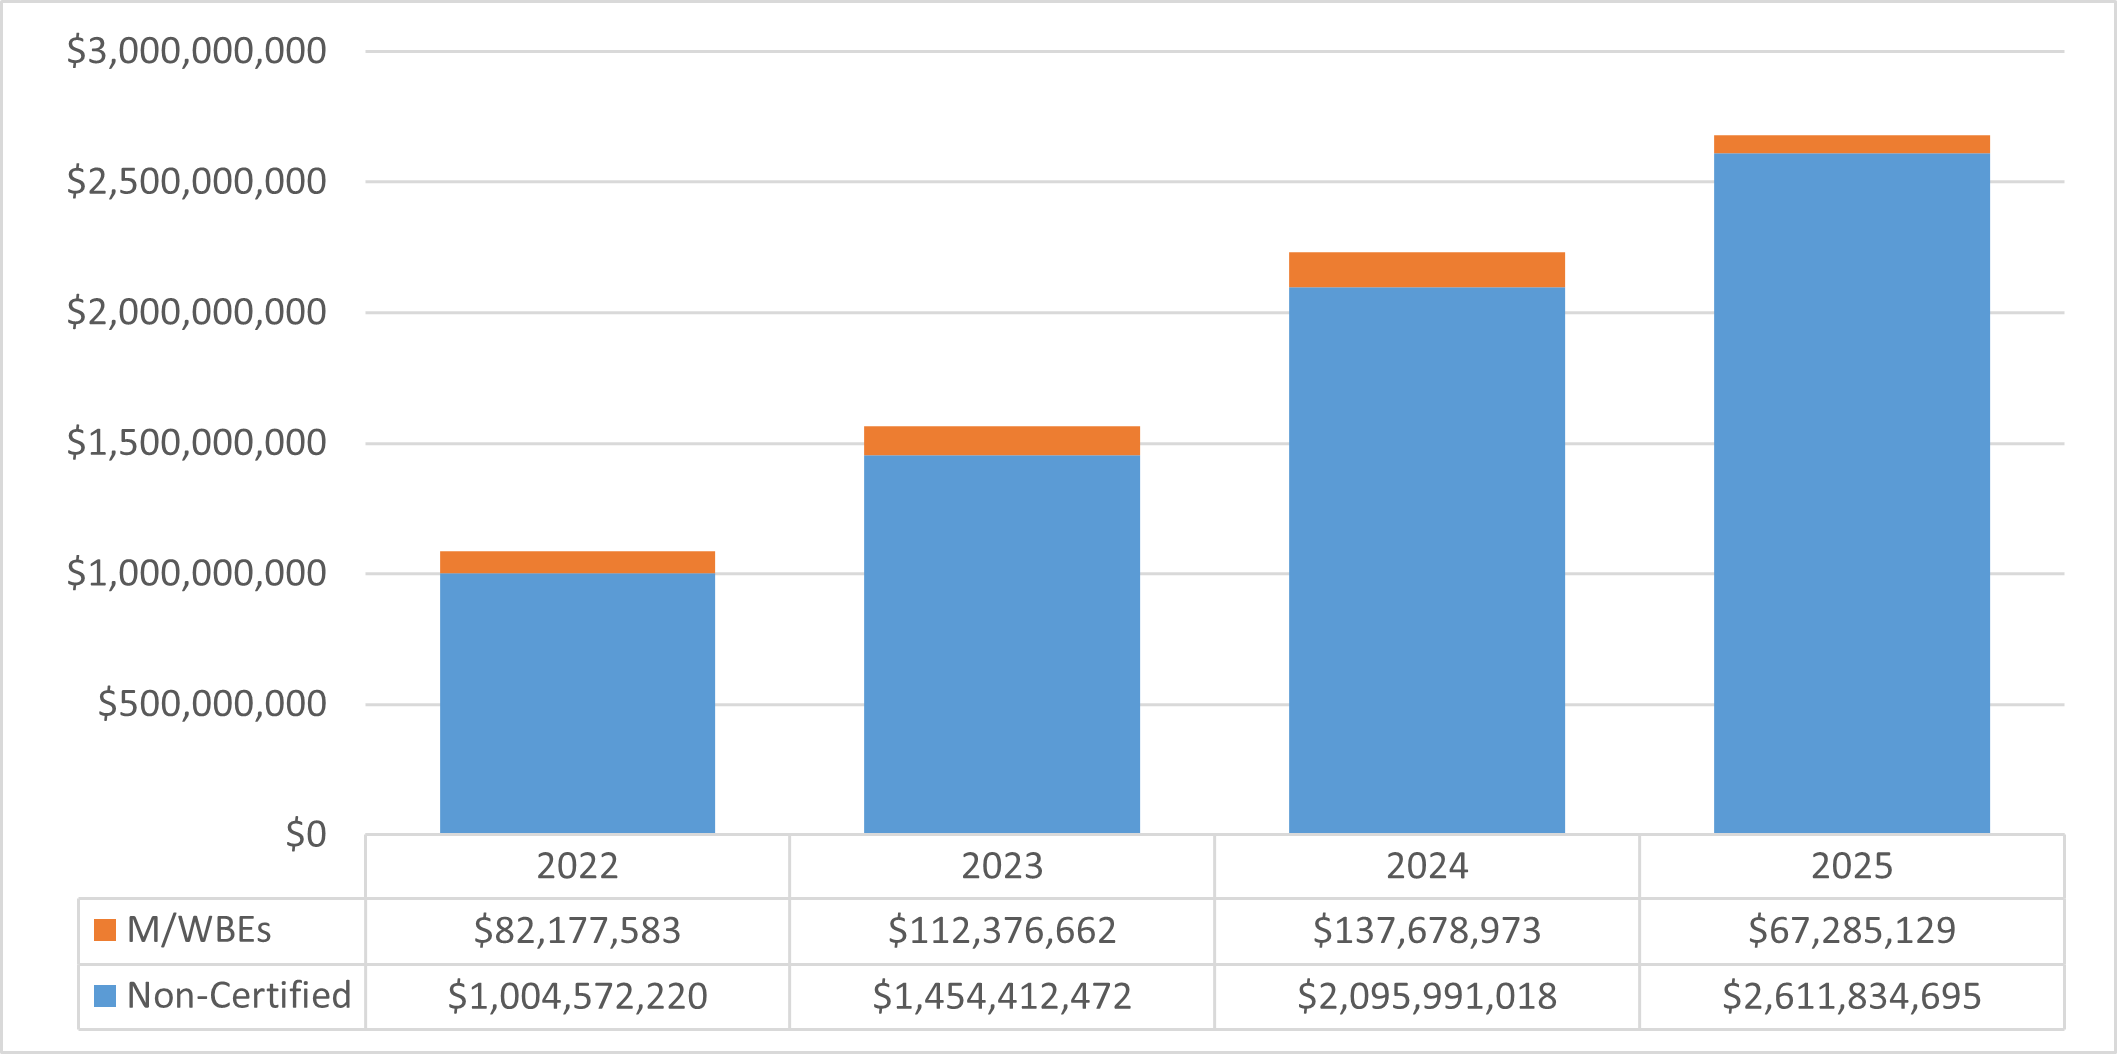
Chart 43: FY25 Value of LL 174-Eligible Contracts and POs, by Race and Gender
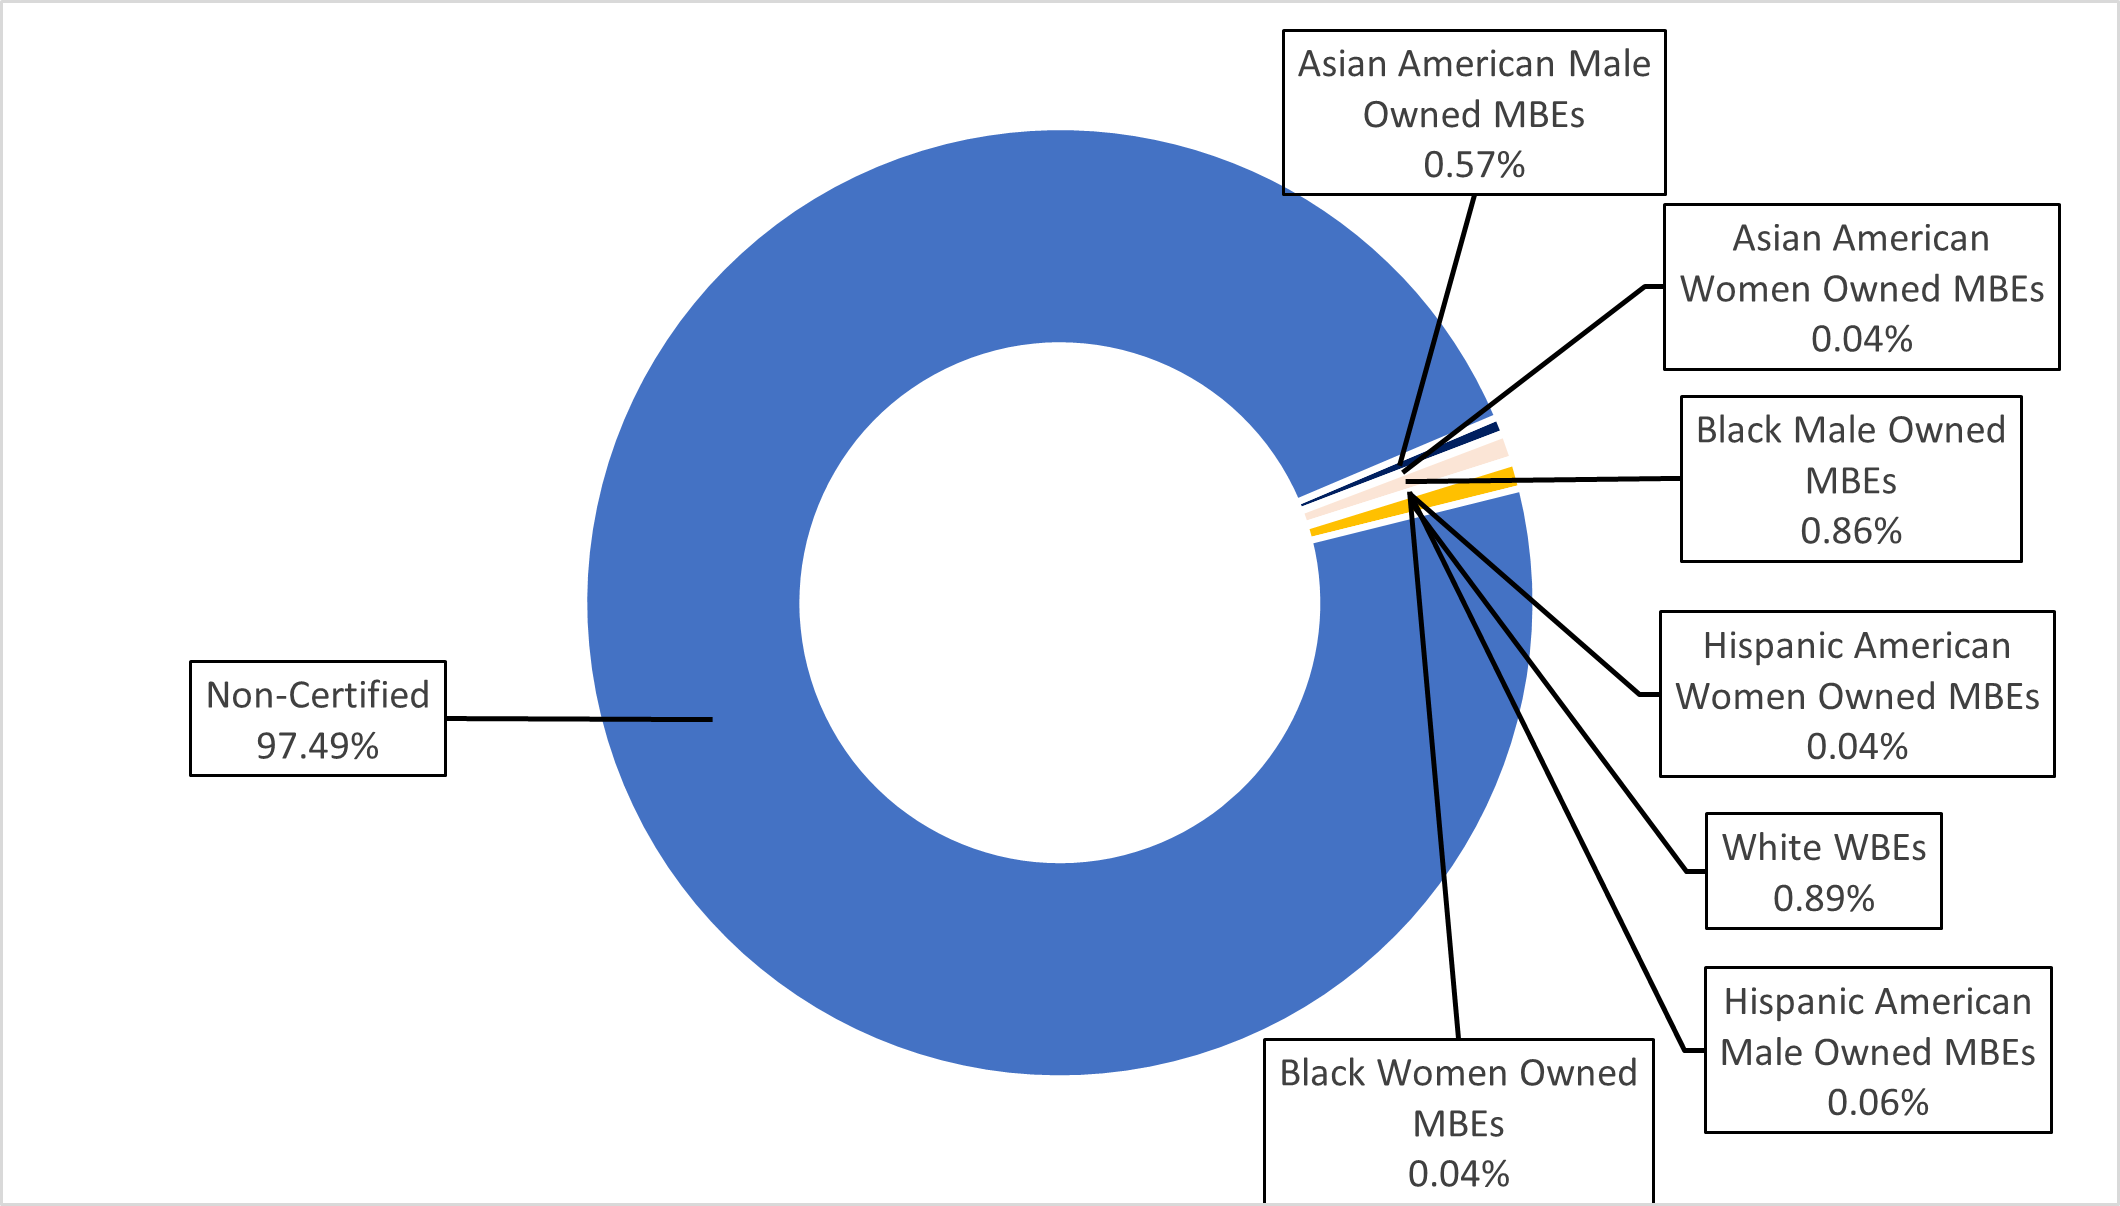
Chart 44: FY25 Share of LL 174-Eligible Contracts and PO Value, by M/WBE Category and Industry
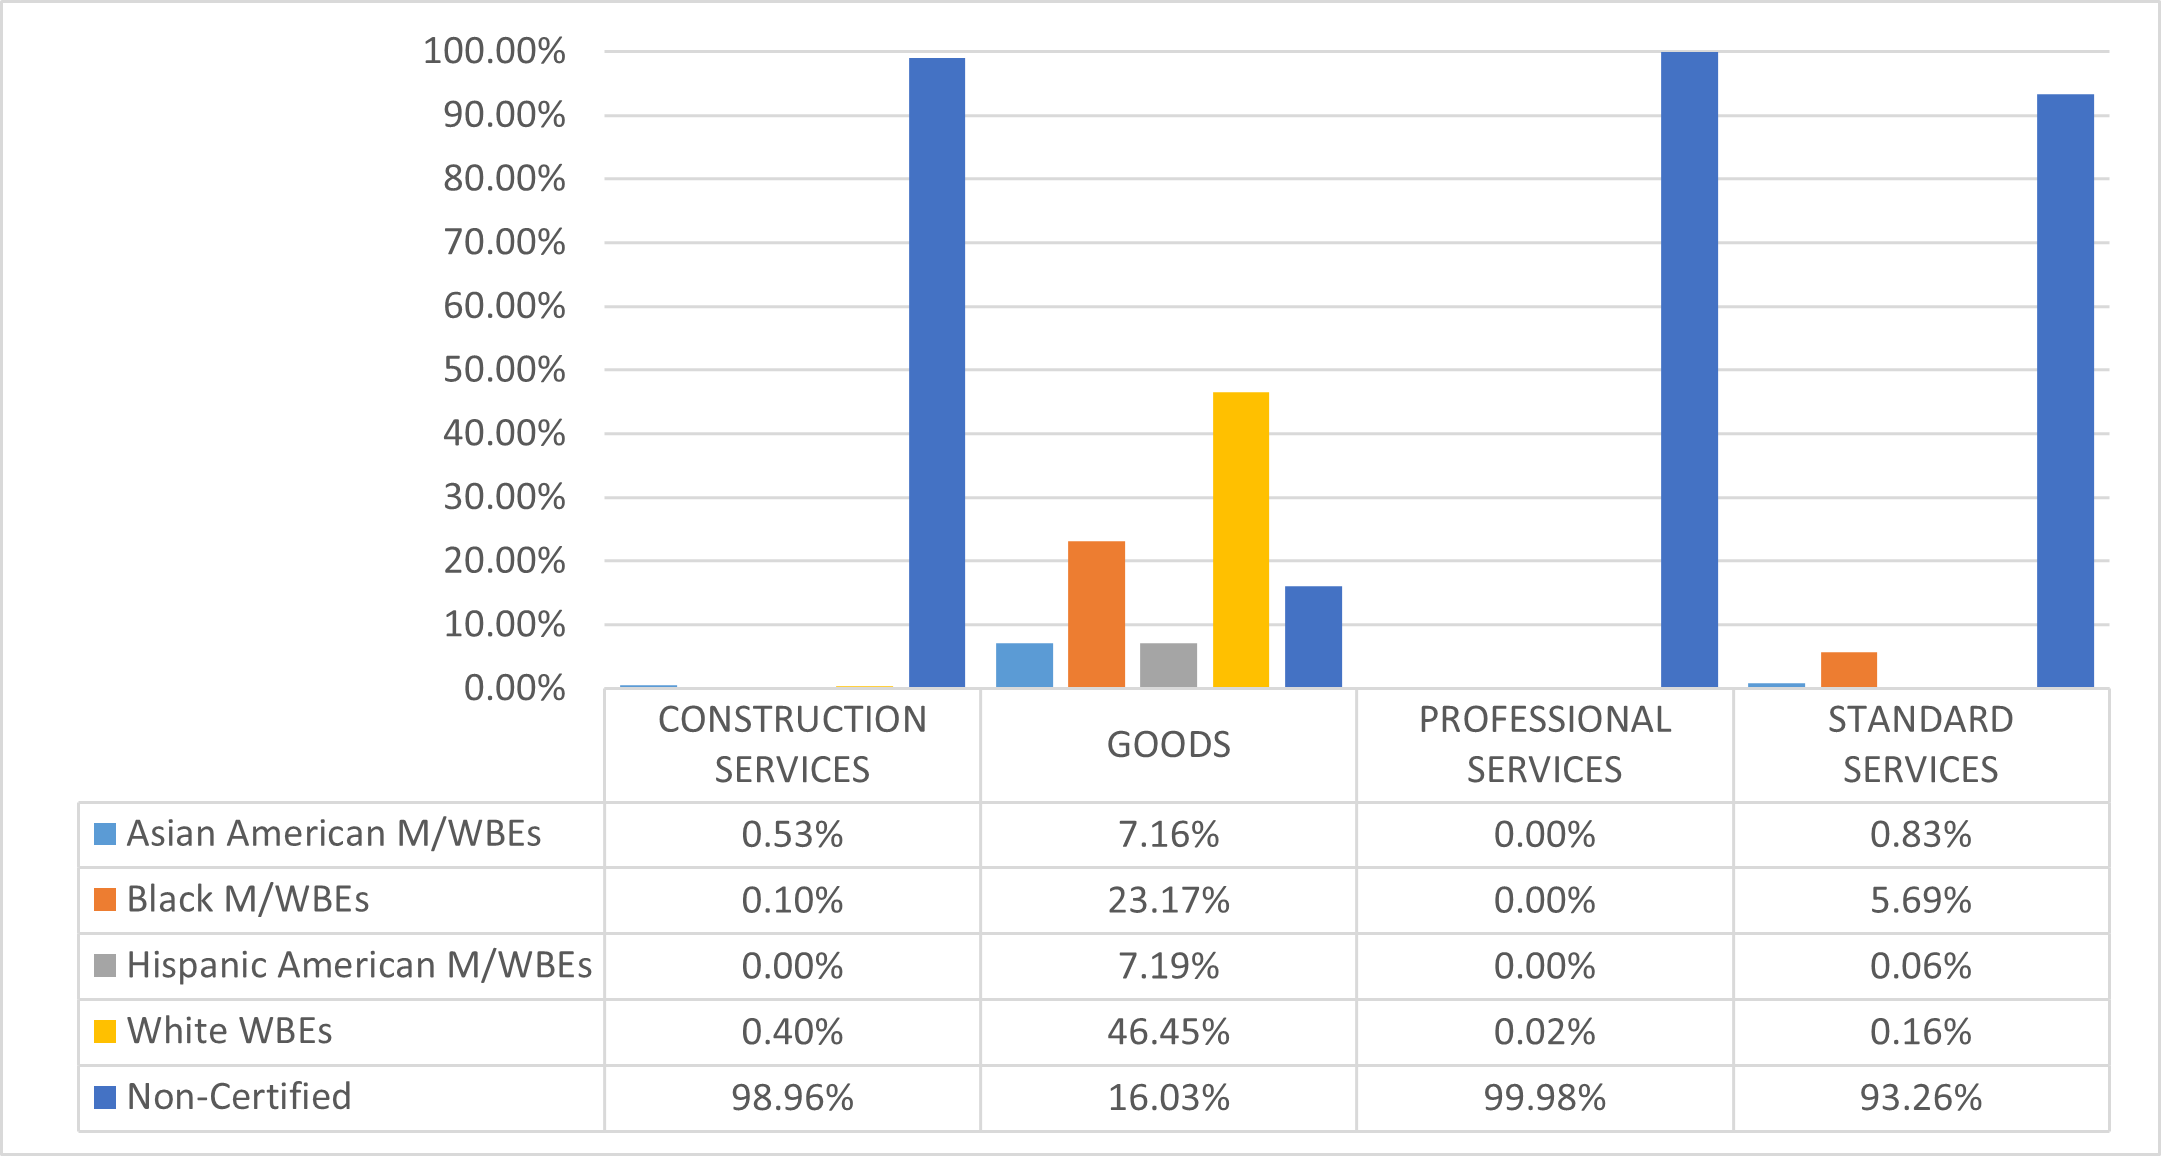
Department for the Aging (DFTA)
The LL 174 totals below represent a very small share of DFTA’s total procurement portfolio, as DFTA predominantly contracts for human services, which are exempt from LL 174 participation goals. DFTA’s $1 million in LL 174-eligible value represents 0.006% of the City’s LL 174-eligible contracting portfolio.
Table 51: FY25 LL 174-Eligible Contracts and POs
| Certification Status | # of Contracts | % Share of Contracts | Total Registered Contract Value | % Share of Contract Value |
|---|---|---|---|---|
| All Contracts and POs | 517 | 100.00% | $769,132,377 | 100.00% |
| M/WBE | 121 | 23.40% | $6,993,512 | 0.91% |
| Non-Certified | 396 | 76.60% | $762,138,865 | 99.09% |
| LL174 Contracts and POs | 189 | 100.00% | $1,071,712 | 100.00% |
| M/WBE | 118 | 62.43% | $827,747 | 77.24% |
| Non-Certified | 71 | 37.57% | $243,965 | 22.76% |
| LL174 Subcontracts | 0 | 0.00% | $0 | 0.00% |
| M/WBE | 0 | 0.00% | $0 | 0.00% |
| Non-Certified | 0 | 0.00% | $0 | 0.00% |
Chart 45: FY22-25 Value of LL 174-Eligible Prime Contracts and POs
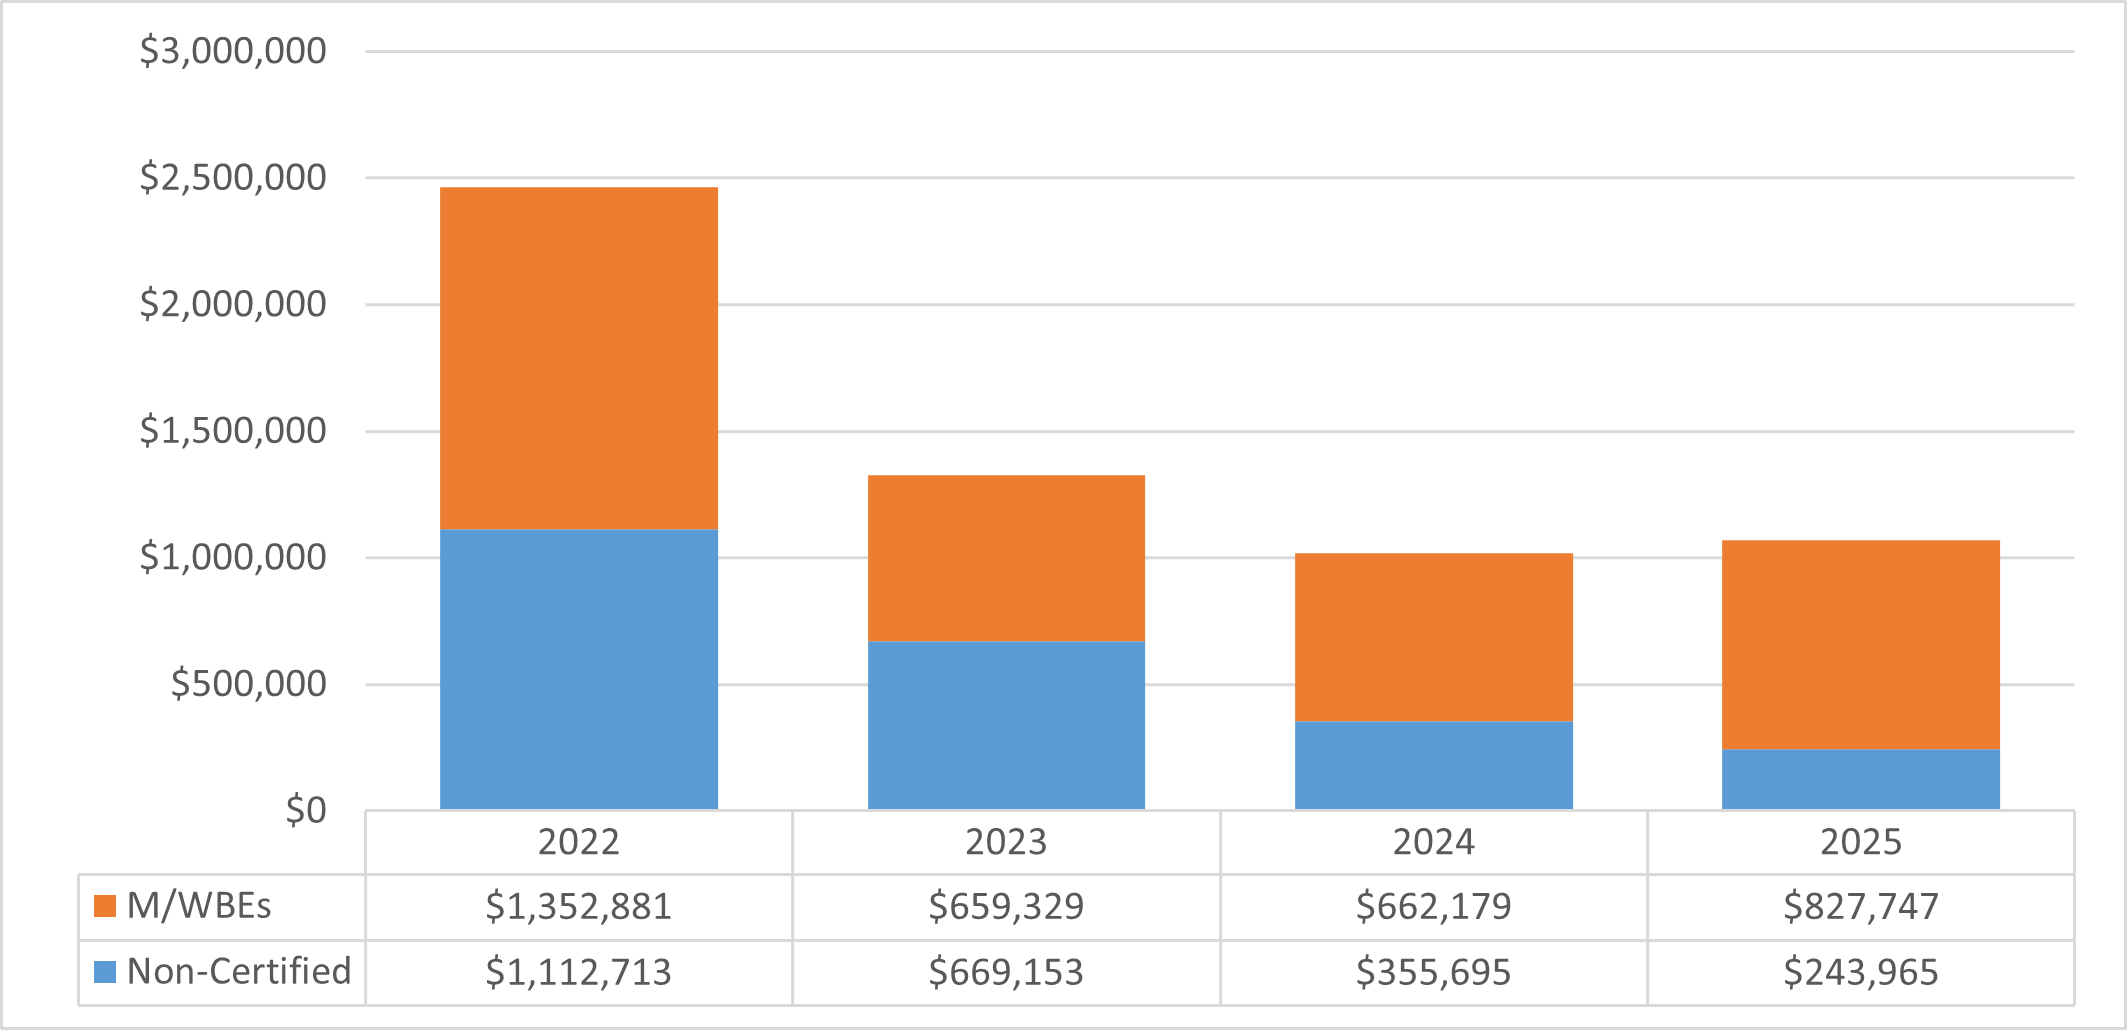
Chart 46: FY25 Value of LL 174-Eligible Contracts and POs, by Race and Gender
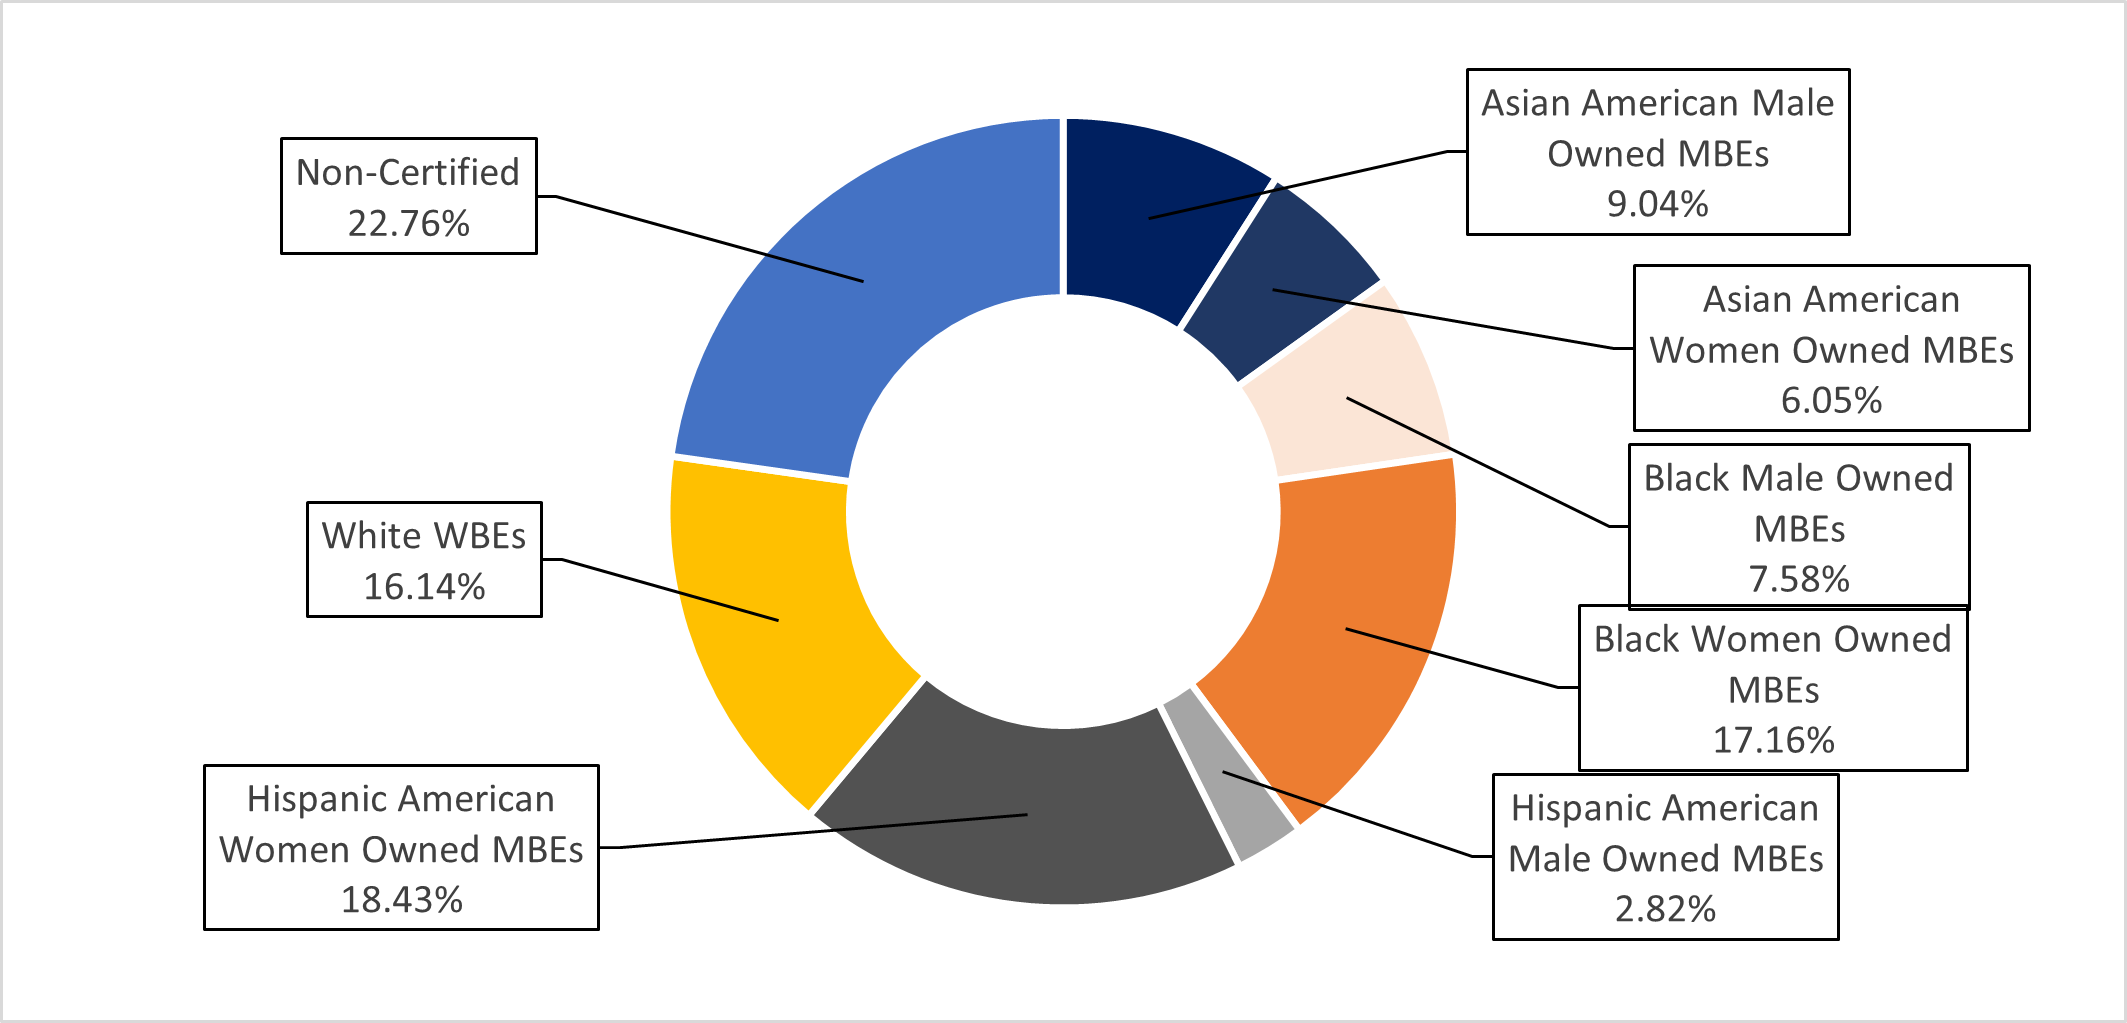
Chart 47: FY25 Share of LL 174-Eligible Contracts and PO Value, by M/WBE Category and Industry
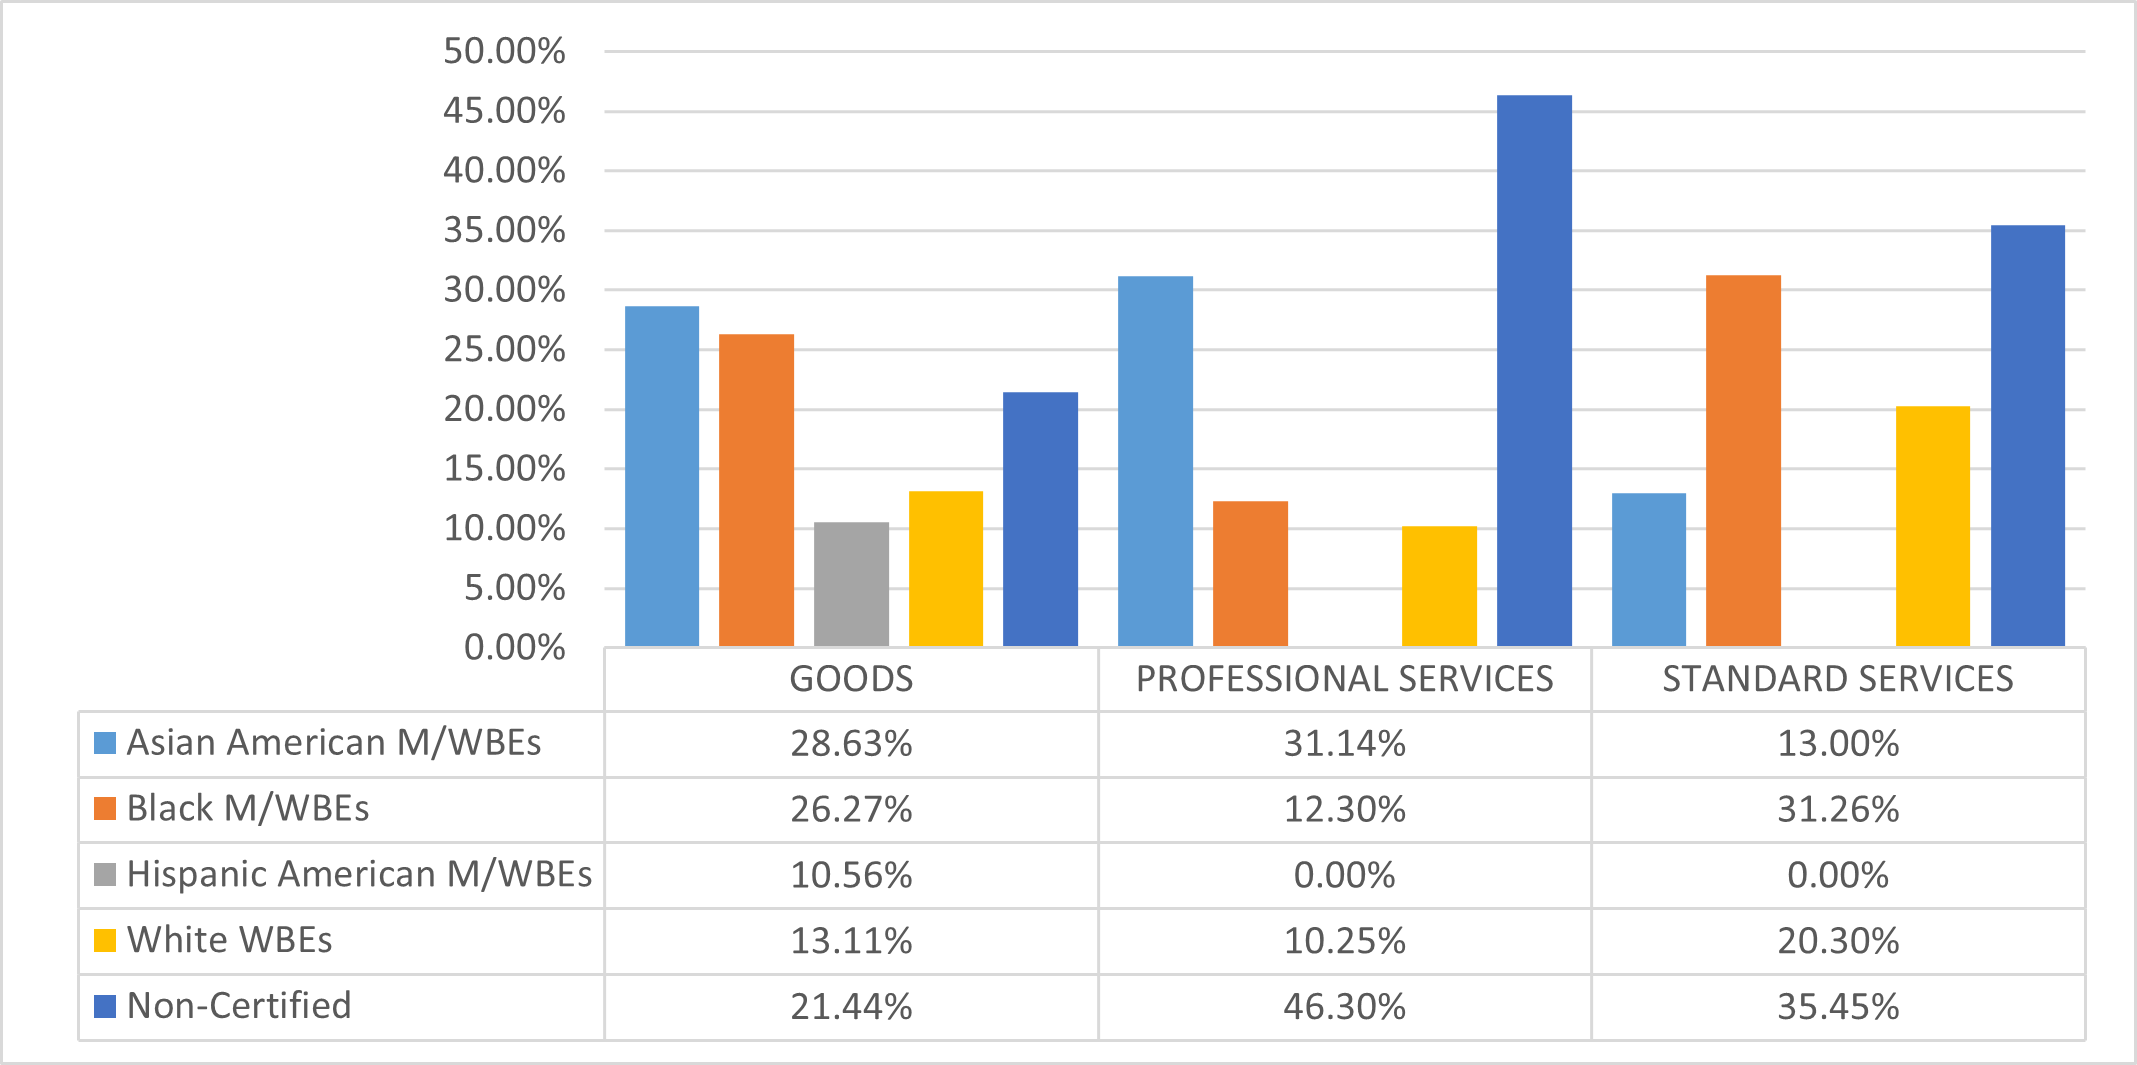
Department of Buildings (DOB)
Nearly 88% of DOB’s FY25 procurement portfolio was subject to LL 174 participation goals. In FY25, DOB registered $4 million in Renewal contracts, which are excluded from this analysis. DOB’s $37.8 million in LL 174-eligible value represents 0.002% of the City’s LL 174-eligible contracting portfolio.
Table 52: FY25 LL 174-Eligible Contracts and POs
| Certification Status | # of Contracts | % Share of Contracts | Total Registered Contract Value | % Share of Contract Value |
|---|---|---|---|---|
| All Contracts and POs | 202 | 100.00% | $42,680,040 | 100.00% |
| M/WBE | 89 | 44.06% | $29,971,007 | 70.22% |
| Non-Certified | 113 | 55.94% | $12,709,032 | 29.78% |
| LL174 Contracts and POs | 185 | 100.00% | $37,831,402 | 100.00% |
| M/WBE | 89 | 48.11% | $29,971,007 | 79.22% |
| Non-Certified | 96 | 51.89% | $7,860,394 | 20.78% |
| LL174 Subcontracts | 7 | 100.00% | $884,130 | 100.00% |
| M/WBE | 4 | 57.14% | $343,880 | 38.89% |
| Non-Certified | 3 | 42.86% | $540,250 | 61.11% |
Chart 48: FY22-25 Value of LL 174-Eligible Prime Contracts and POs
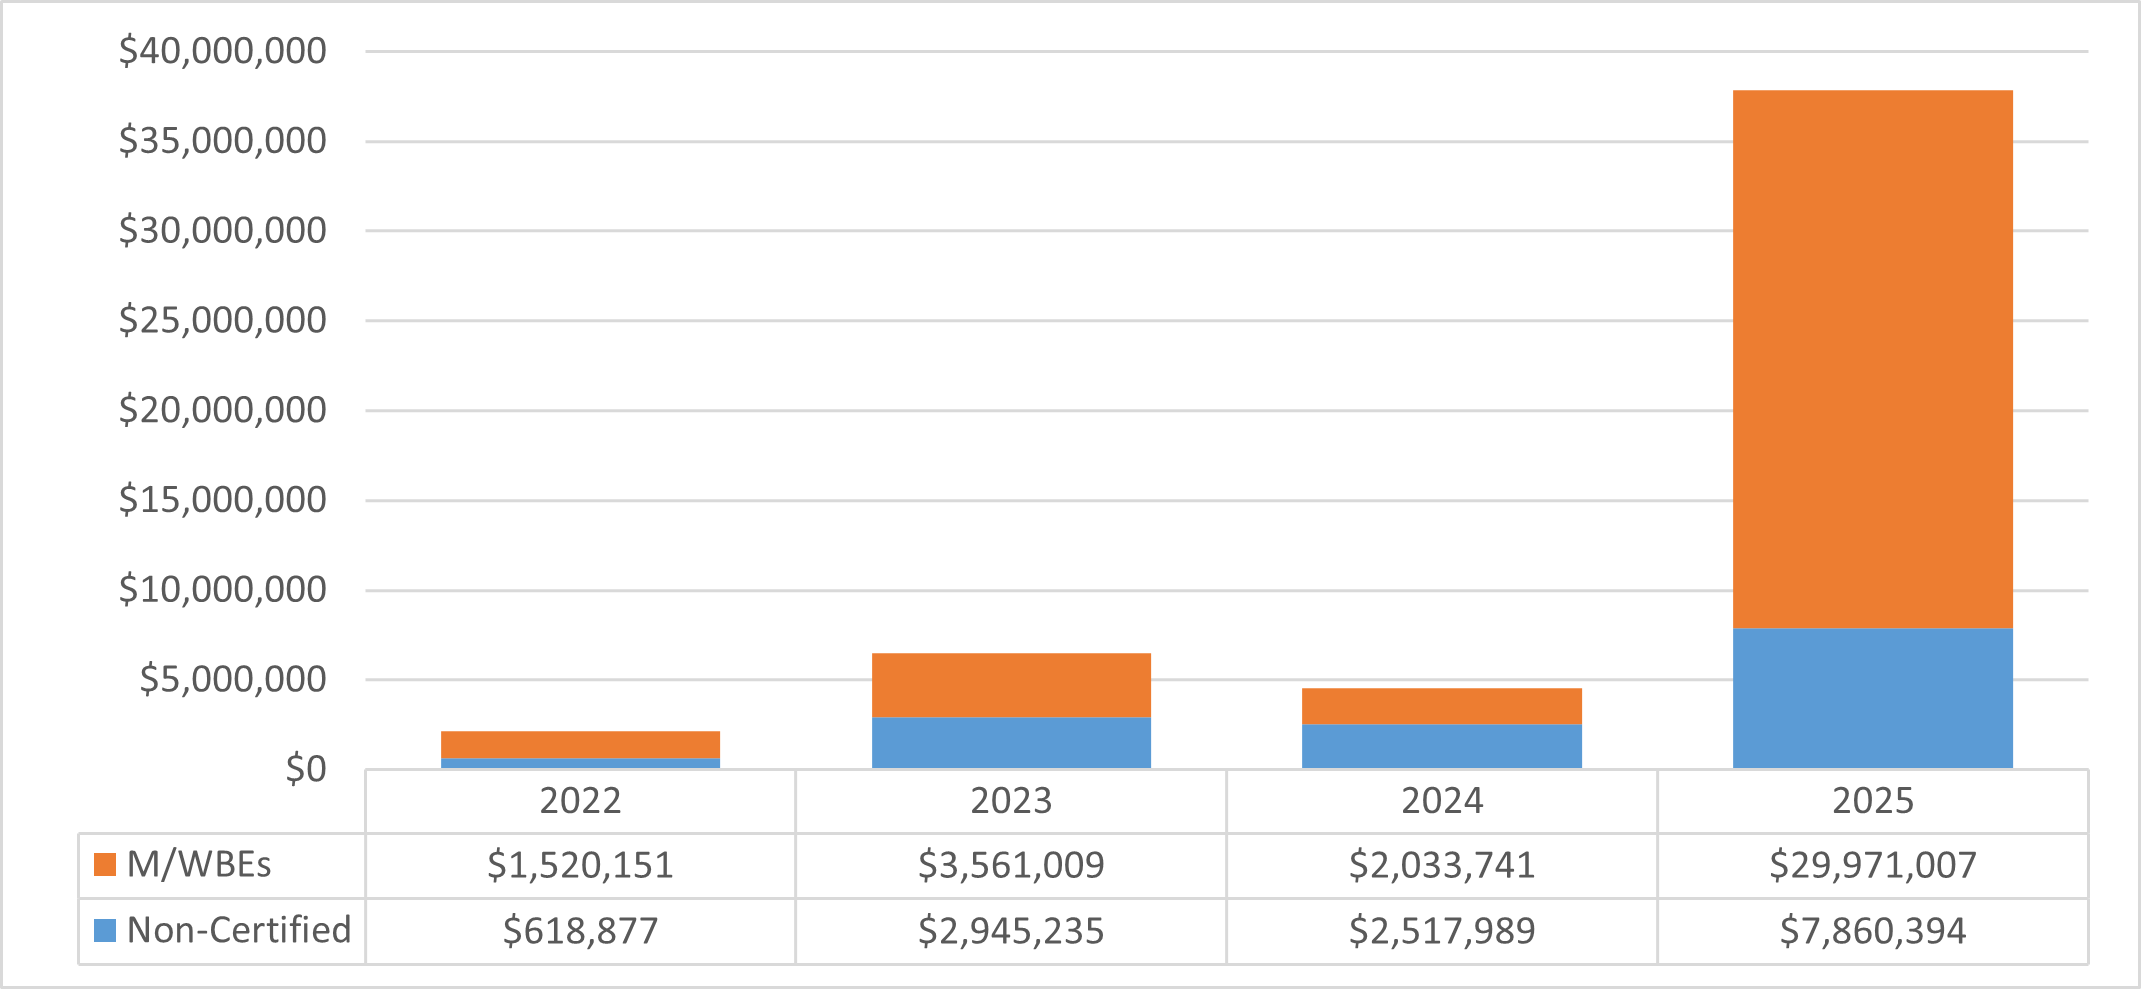
Chart 49: FY25 Value of LL 174-Eligible Contracts and POs, by Race and Gender
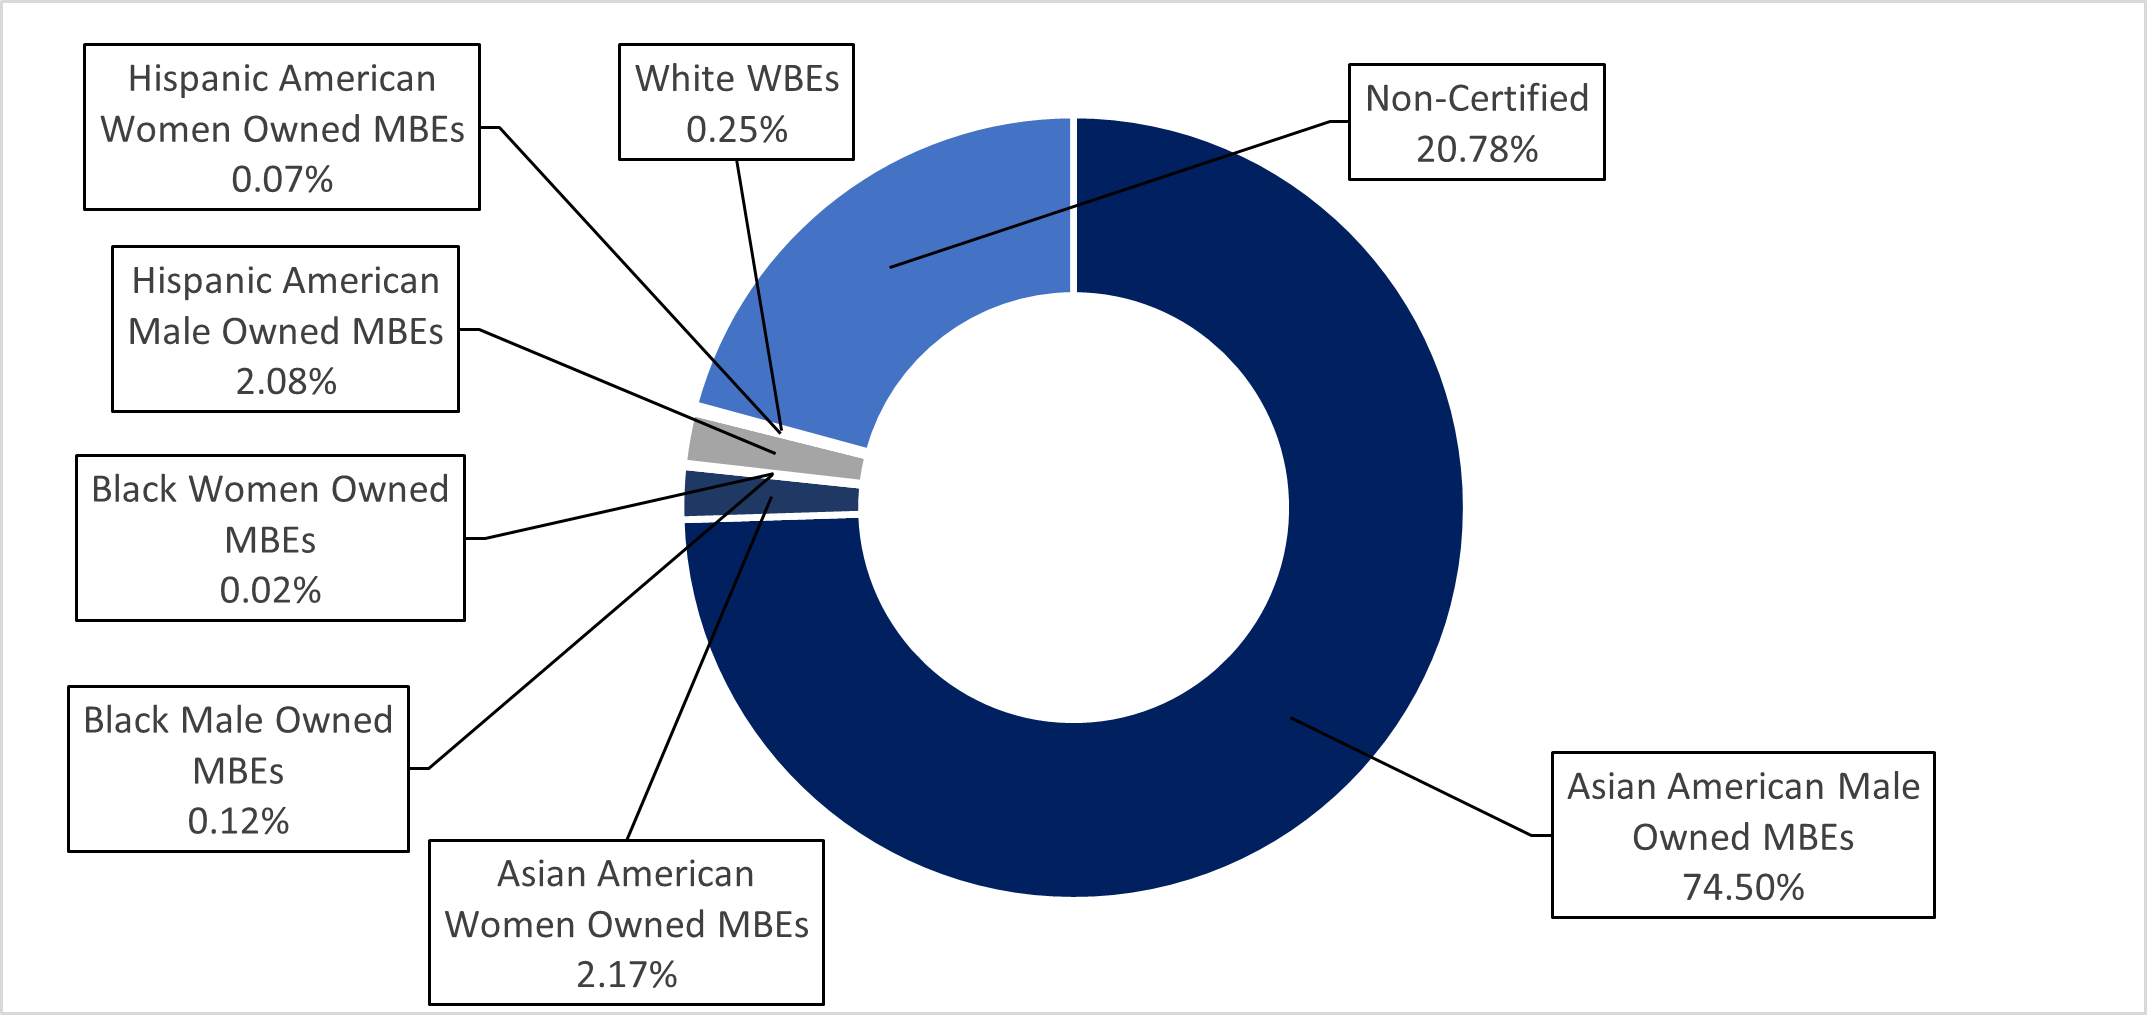
Chart 50: FY25 Share of LL 174-Eligible Contracts and PO Value, by M/WBE Category and Industry
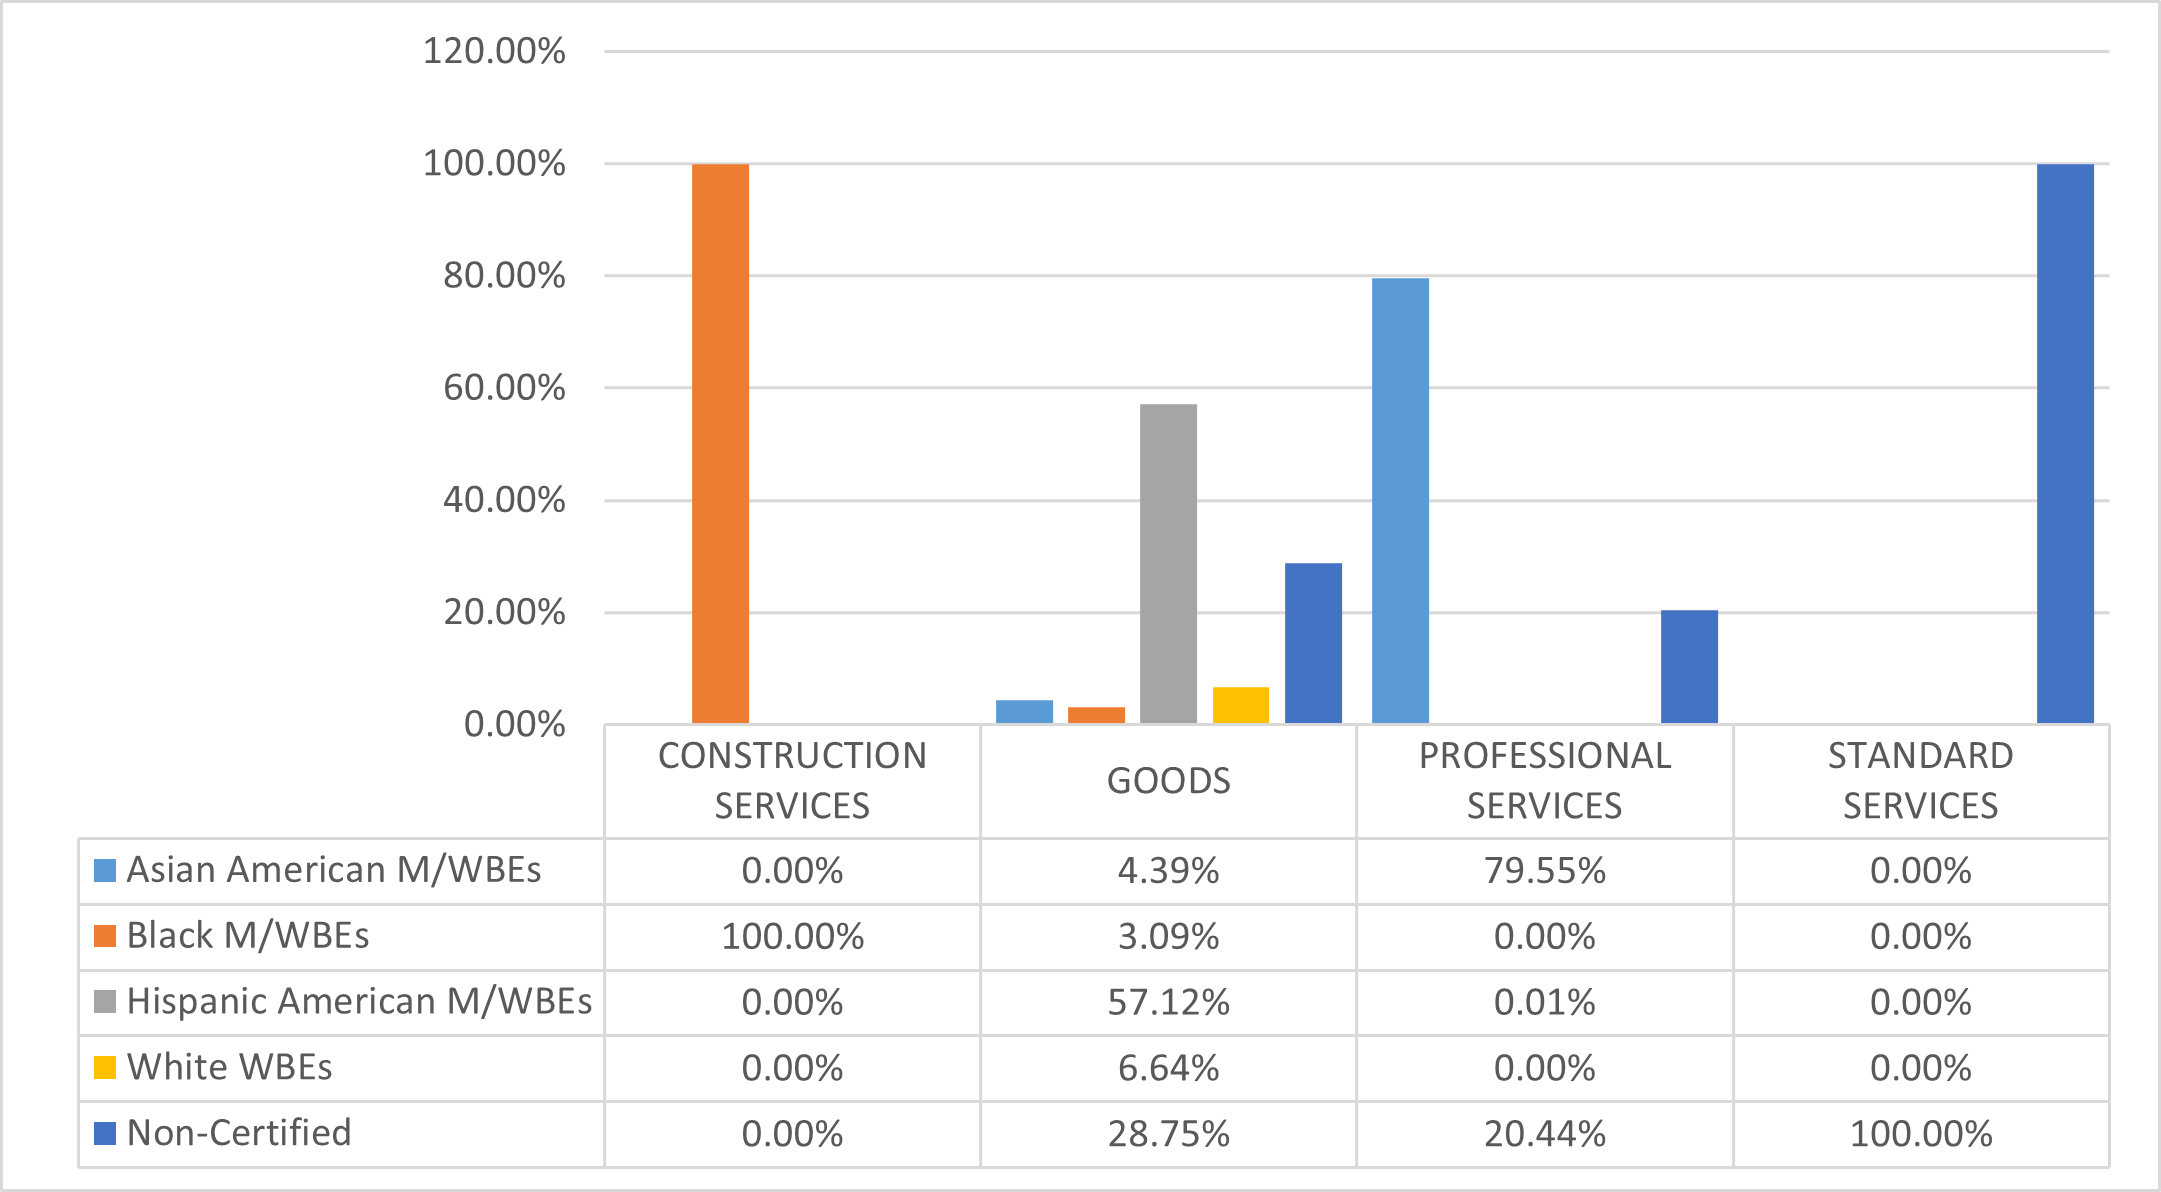
Department of Correction (DOC)
The LL 174 totals below represent over half of DOC’s total contracting portfolio (66%). DOC’s $24.6 million in LL 174-eligible value represents 0.001% of the City’s LL 174-eligible contracting portfolio.
Table 53: FY25 LL 174-Eligible Contracts and POs
| Certification Status | # of Contracts | % Share of Contracts | Total Registered Contract Value | % Share of Contract Value |
|---|---|---|---|---|
| All Contracts and POs | 792 | 100.00% | $38,247,545 | 100.00% |
| M/WBE | 436 | 55.05% | $26,179,661 | 68.45% |
| Non-Certified | 356 | 44.95% | $12,067,885 | 31.55% |
| LL174 Contracts and POs | 697 | 100.00% | $24,612,592 | 100.00% |
| M/WBE | 404 | 57.96% | $17,617,119 | 71.58% |
| Non-Certified | 293 | 42.04% | $6,995,474 | 28.42% |
| LL174 Subcontracts | 0 | 0.00% | $0 | 0.00% |
| M/WBE | 0 | 0.00% | $0 | 0.00% |
| Non-Certified | 0 | 0% | $0 | 0% |
Chart 51: FY22-25 Value of LL 174-Eligible Prime Contracts and POs
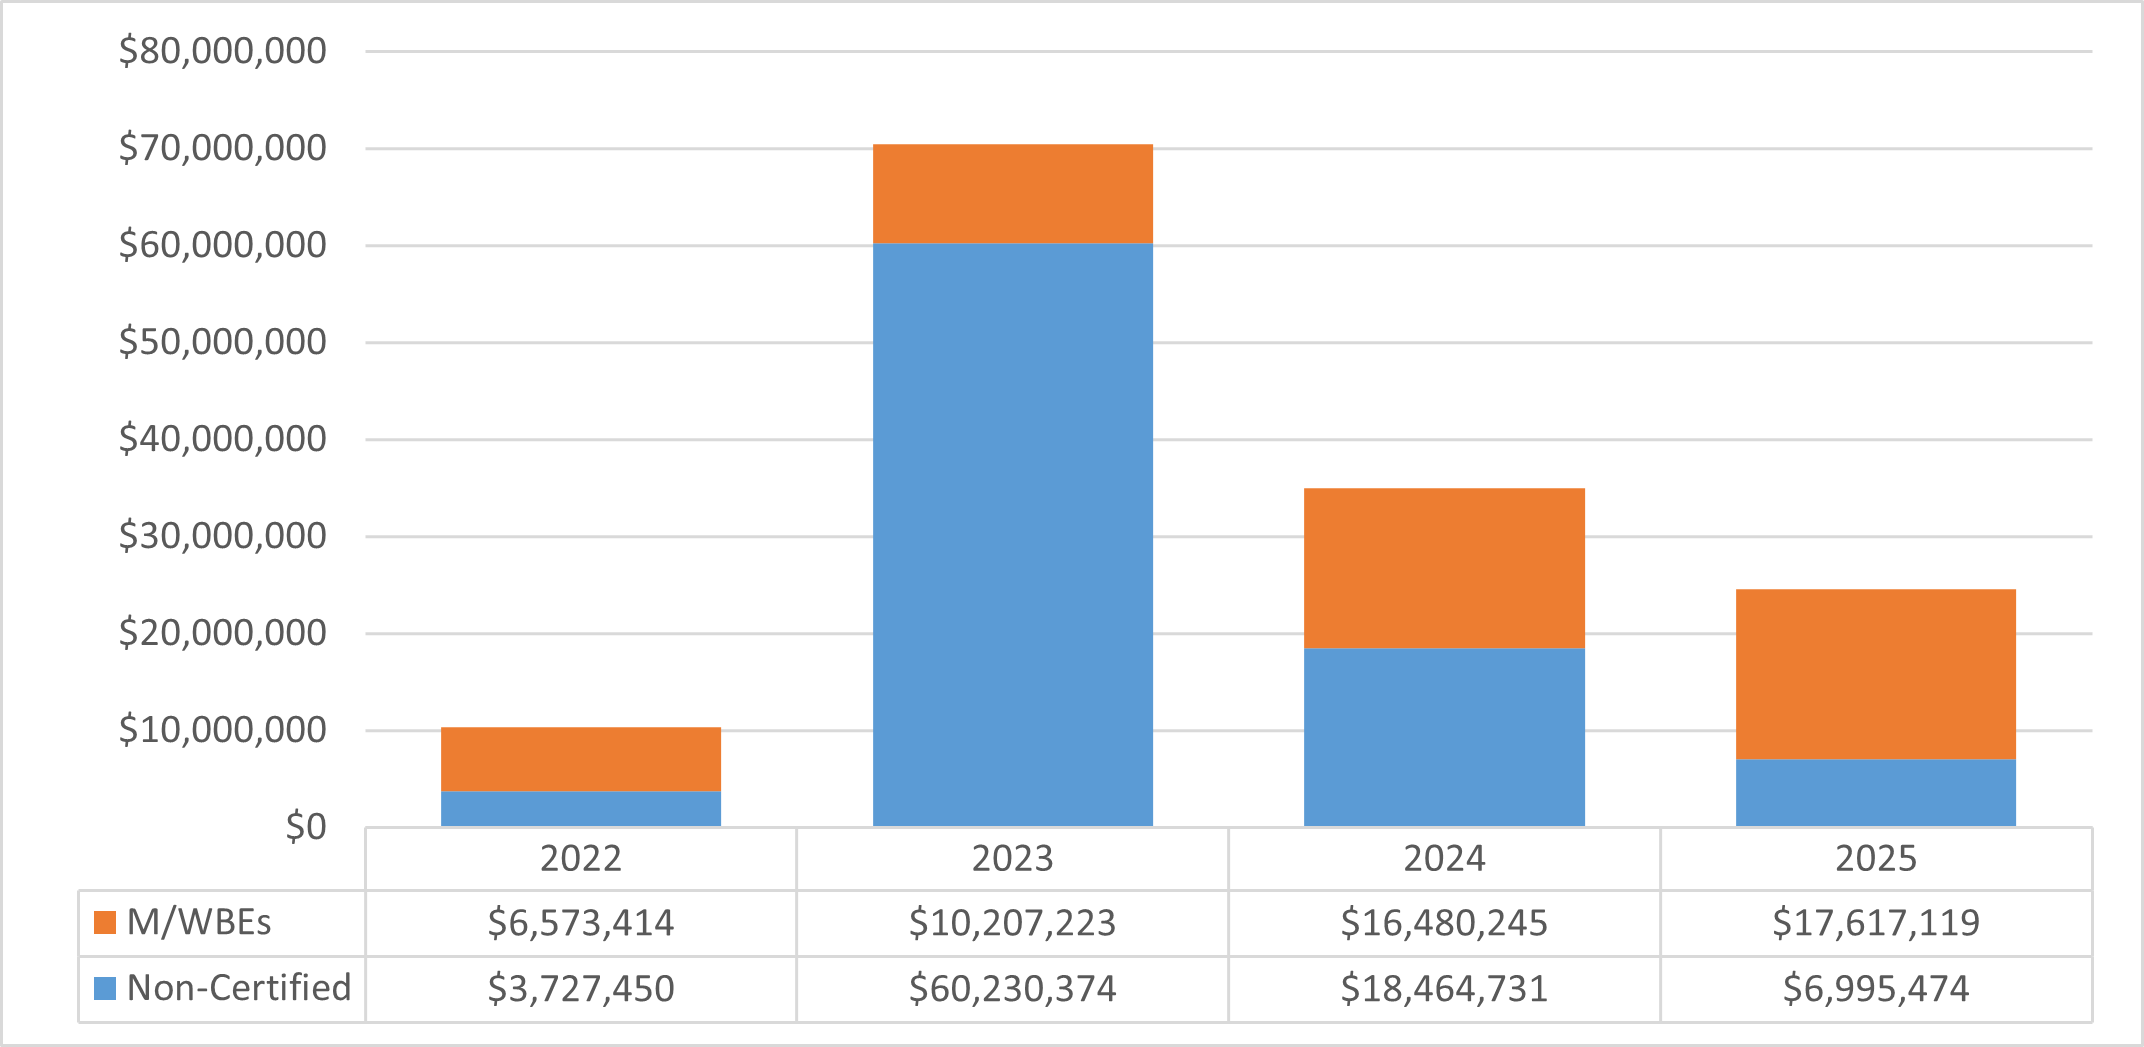
Chart 52: FY25 Value of LL 174-Eligible Contracts and POs, by Race and Gender
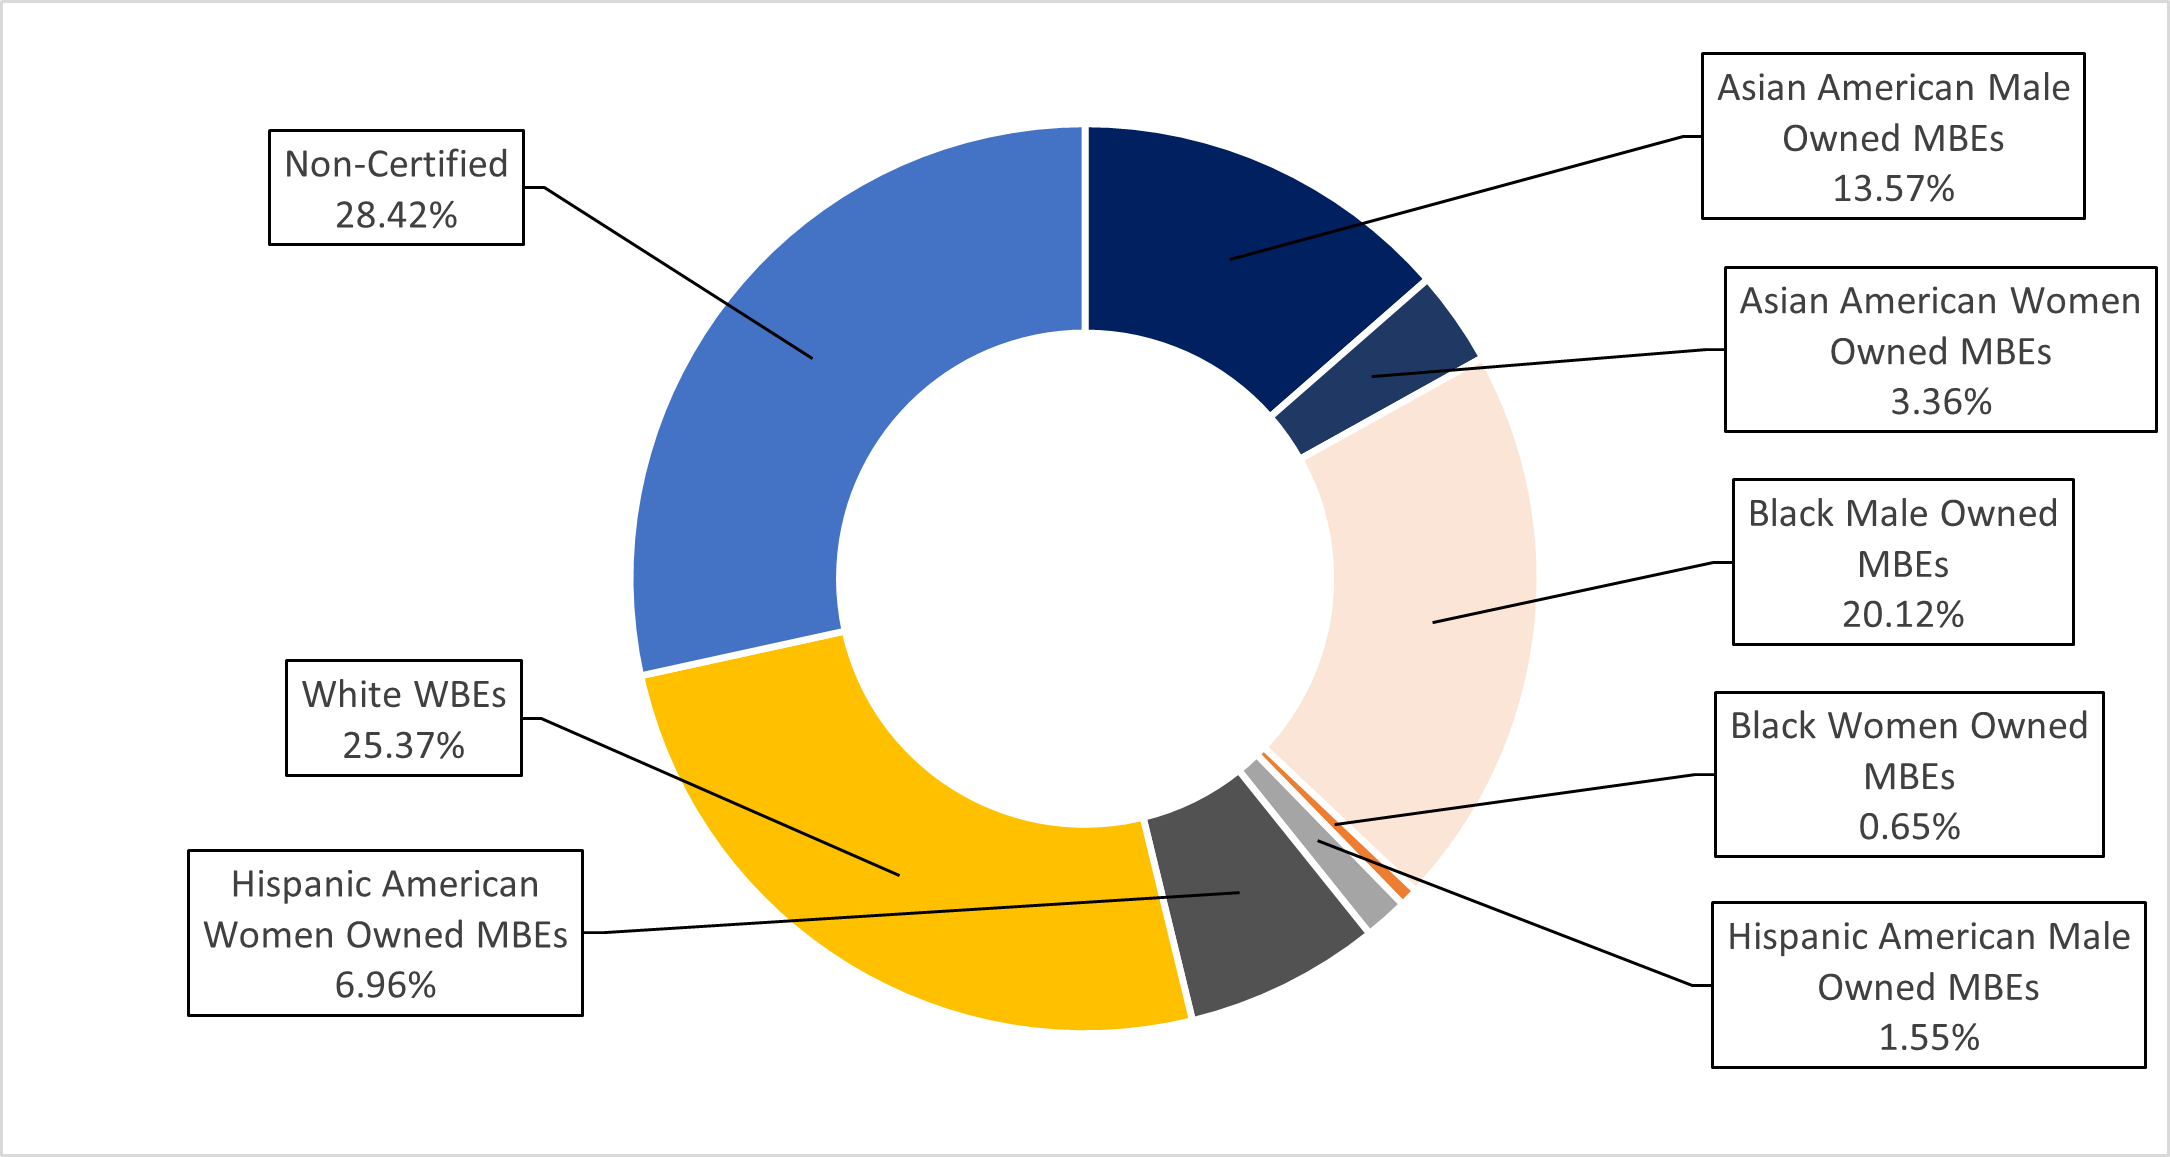
Chart 53: FY25 Share of LL 174-Eligible Contracts and PO Value, by M/WBE Category and Industry
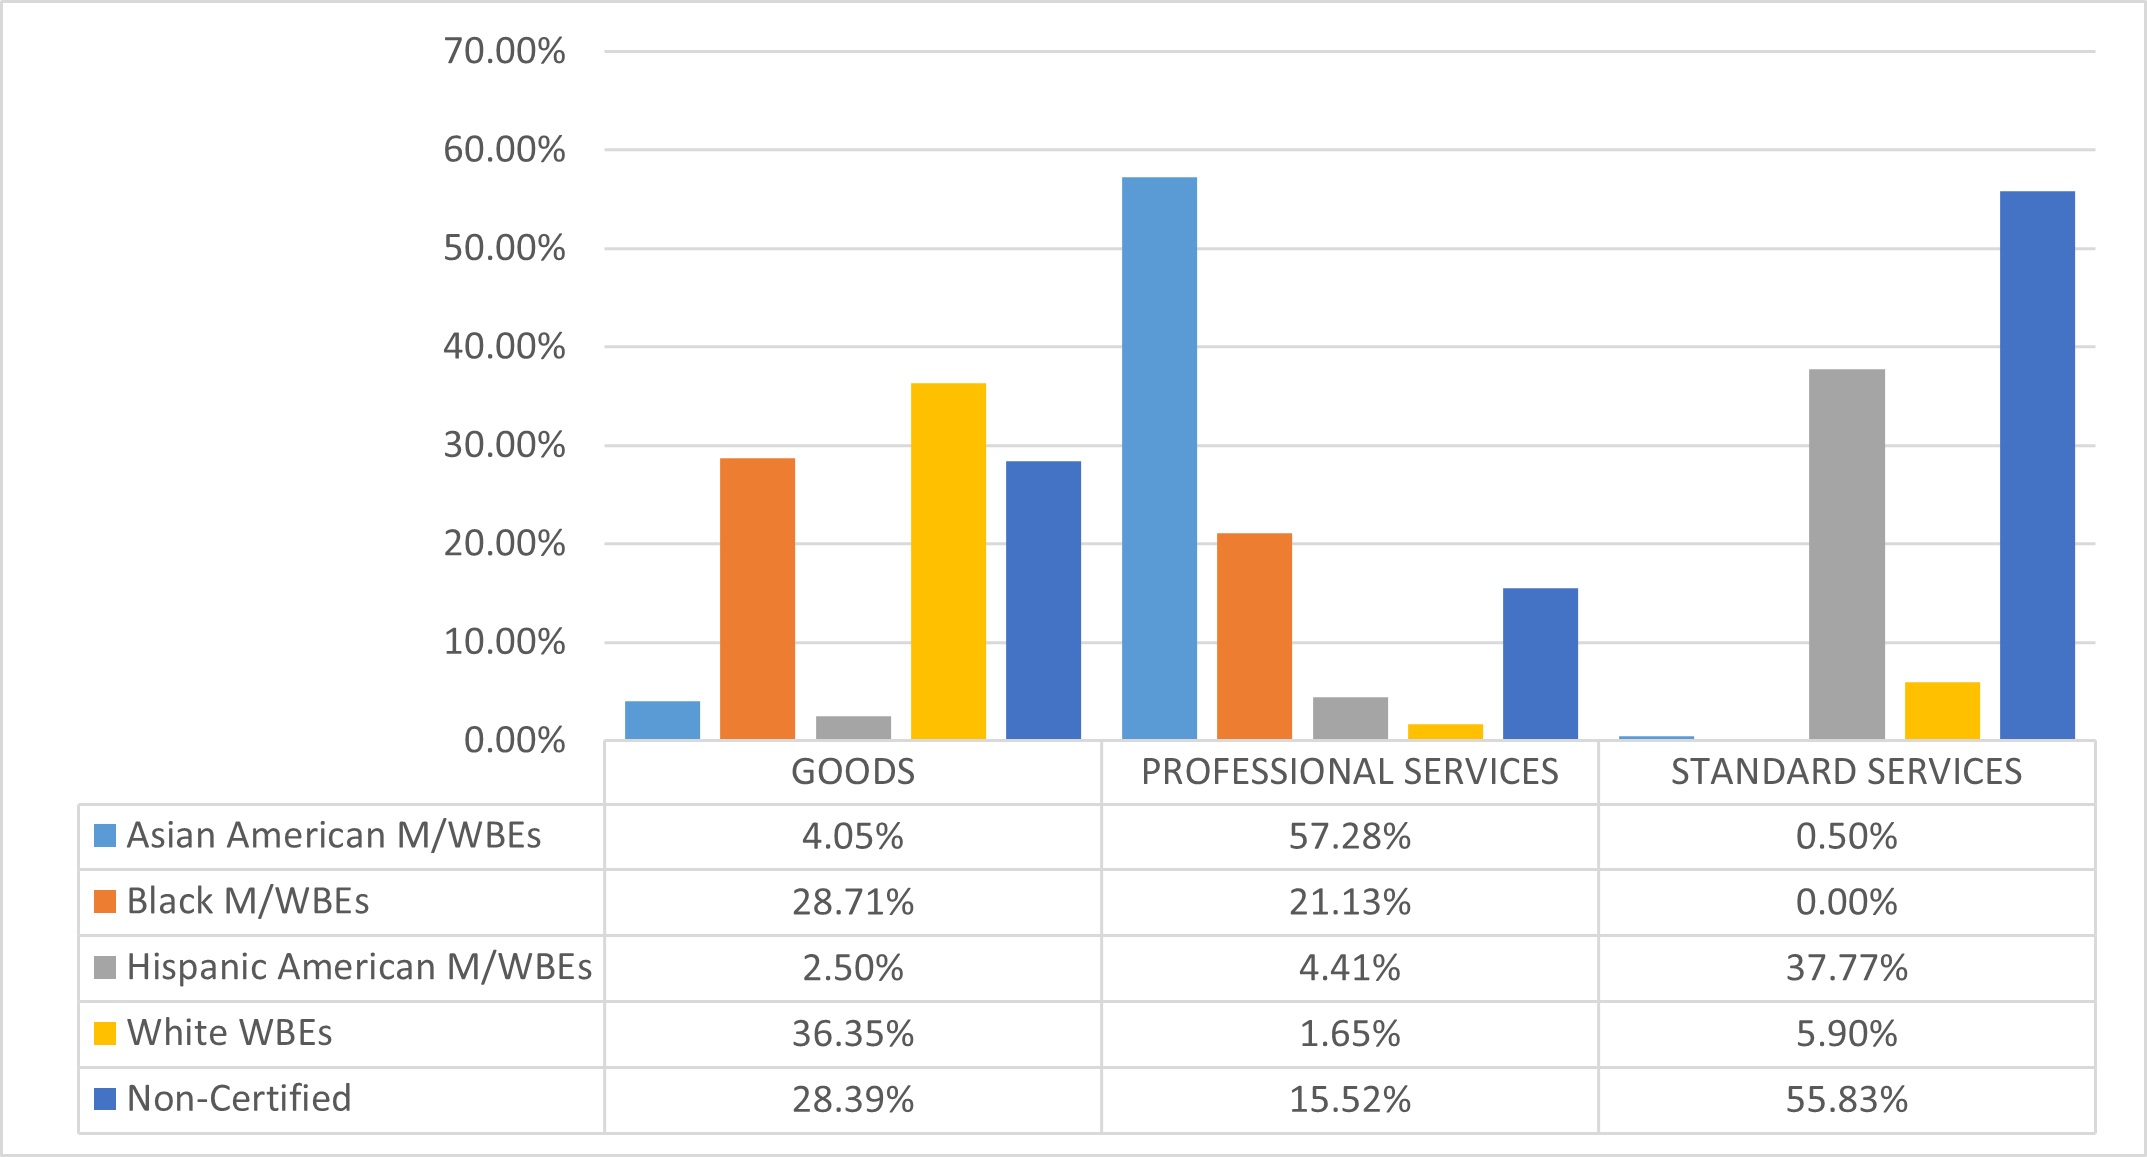
Department of Finance (DOF)
The LL 174 totals below represent a quarter of DOF’s procurement portfolio. In FY25, DOF registered valuable contracts via Sole Source and Intergovernmental procurement methods which are not subject to LL 174 participation goals. DOF also registered valuable Renewal and Determined by Government Mandate contracts in FY25, which were excluded from this analysis. The $11.5 million in LL 174-eligible value accounts for 0.06% of the City’s total LL 174-eligible contracting portfolio.
Table 54: FY25 LL 174-Eligible Contracts and POs
| Certification Status | # of Contracts | % Share of Contracts | Total Registered Contract Value | % Share of Contract Value |
|---|---|---|---|---|
| All Contracts and POs | 214 | 100.00% | $46,705,492 | 100.00% |
| M/WBE | 73 | 34.11% | $7,210,215 | 15.44% |
| Non-Certified | 141 | 65.89% | $39,495,277 | 84.56% |
| LL174 Contracts and POs | 150 | 100.00% | $11,459,424 | 100.00% |
| M/WBE | 71 | 47.33% | $5,773,638 | 50.38% |
| Non-Certified | 79 | 52.67% | $5,685,786 | 49.62% |
| LL174 Subcontracts | 2 | 100.00% | $198,120 | 100.00% |
| M/WBE | 1 | 50.00% | $123,825 | 62.50% |
| Non-Certified | 1 | 50.00% | $74,295 | 37.50% |
Chart 54: FY22-25 Value of LL 174-Eligible Prime Contracts and POs
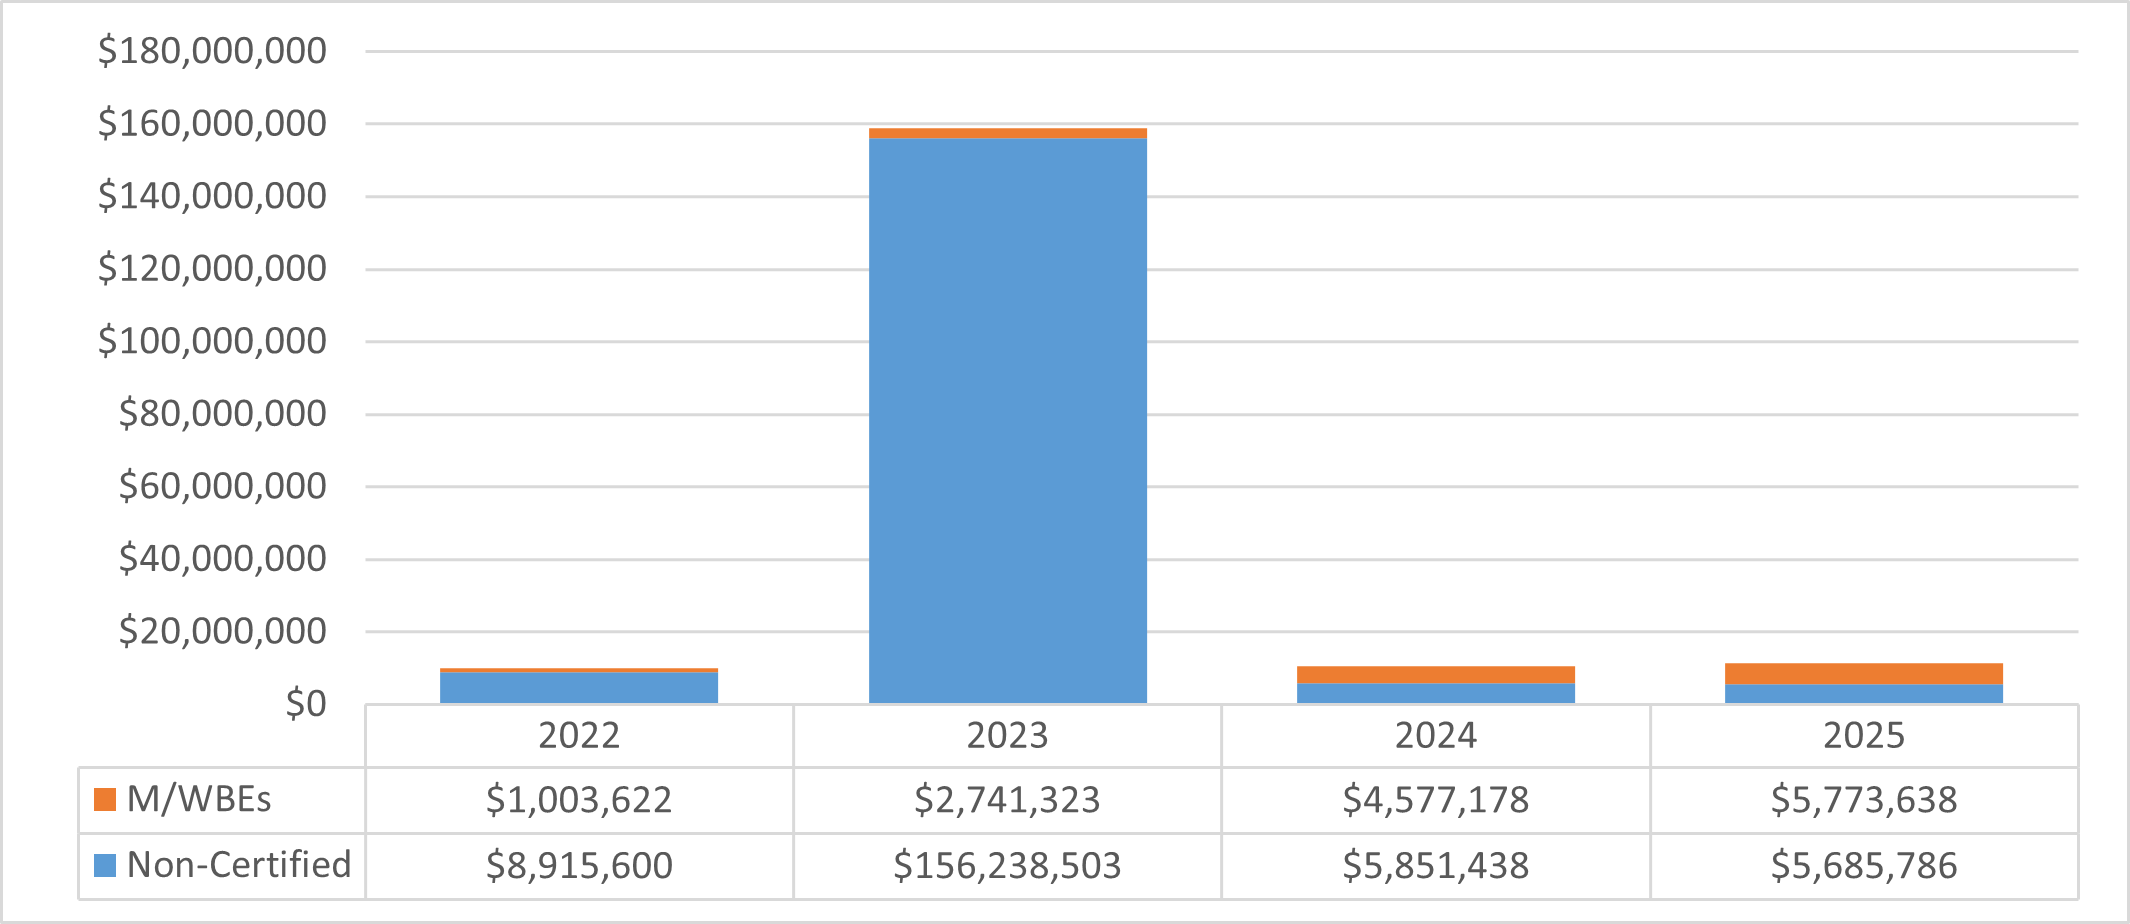
Chart 55: FY25 Value of LL 174-Eligible Contracts and POs, by Race and Gender
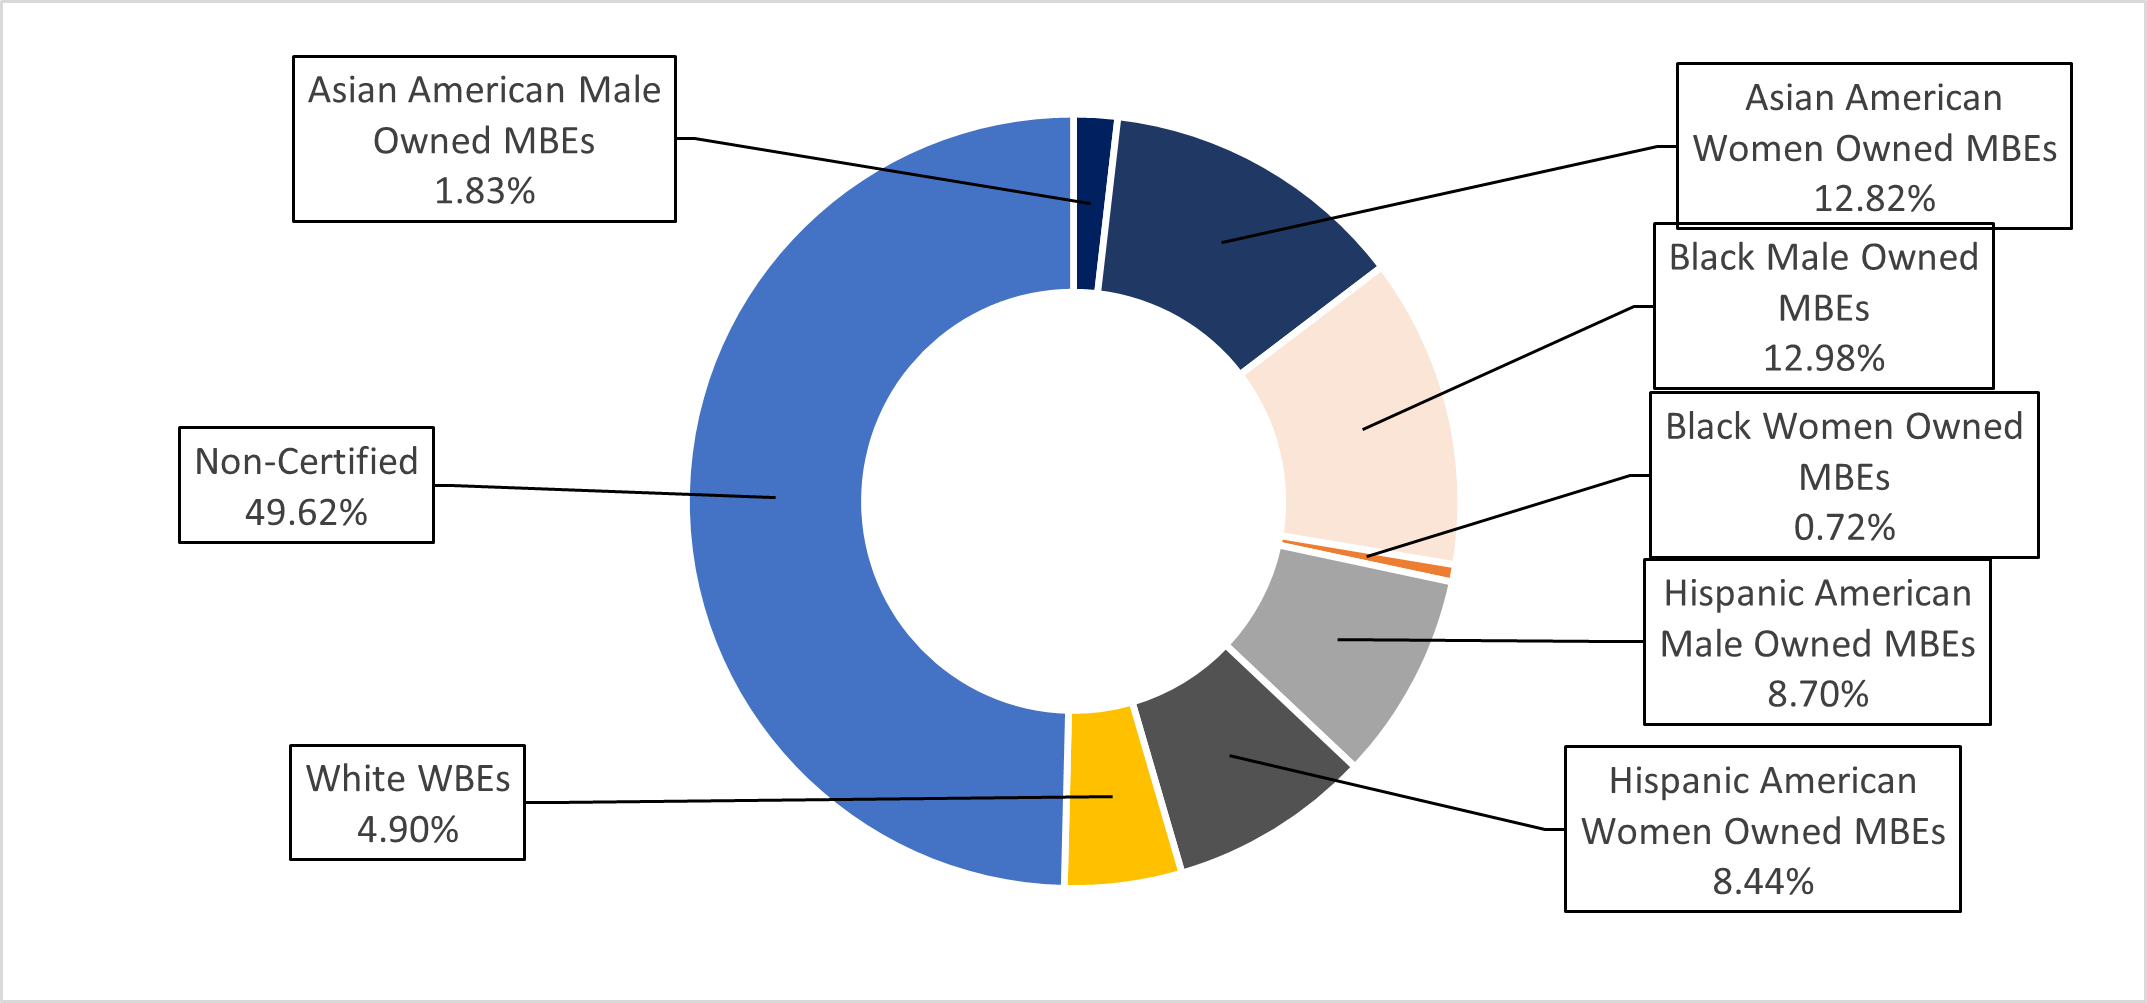
Chart 56: FY25 Share of LL 174-Eligible Contracts and PO Value, by M/WBE Category and Industry
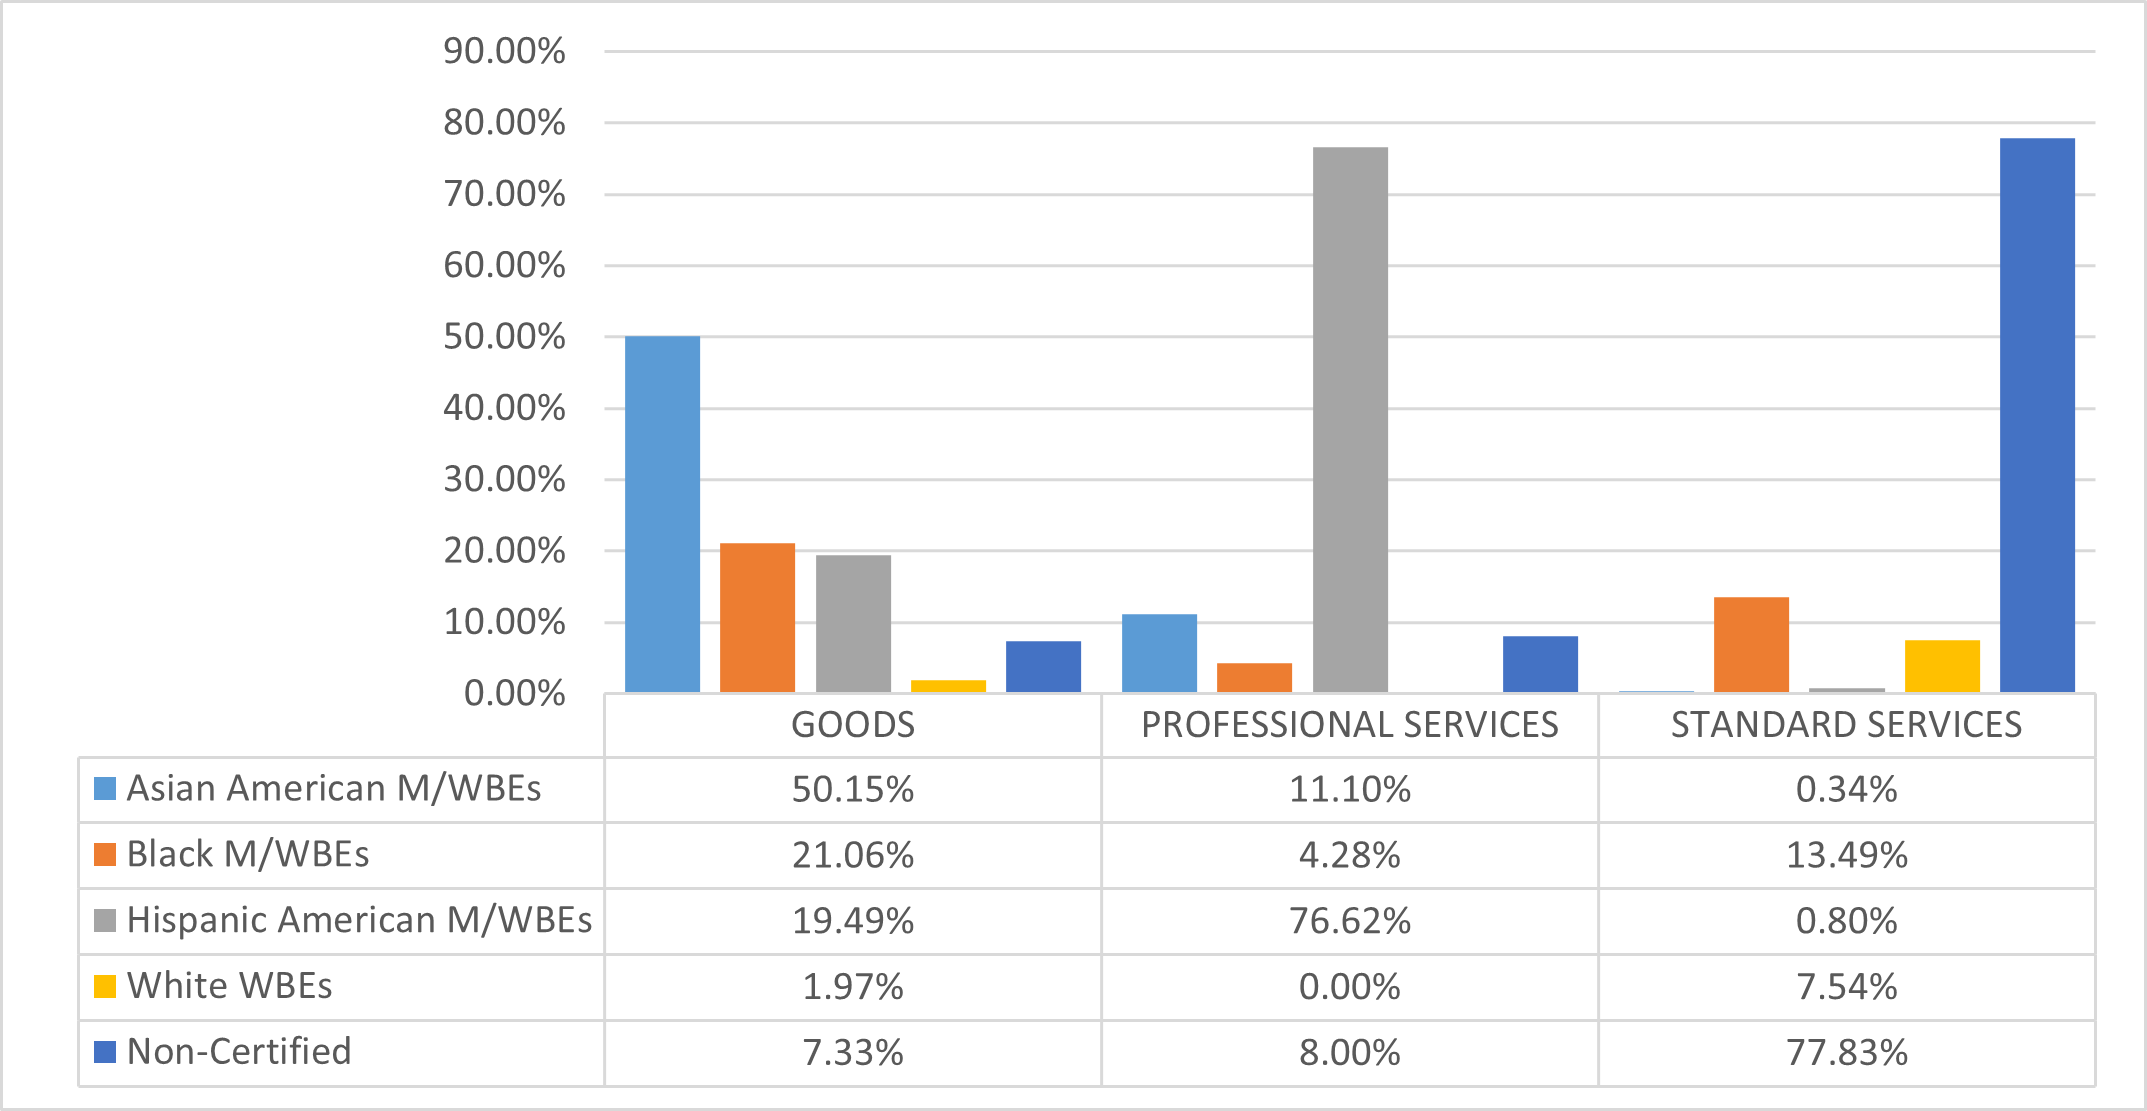
Department of Health and Mental Hygiene (DOHMH)
The LL 174 totals below represent only a very small portion (4%) of DOHMH’s total procurement portfolio, as it predominantly contracts with vendors for human services, which are exempt from LL 174 participation goals. DOHMH’s $97.3 million in LL 174-eligible value accounts for 0.5% of the City’s total LL 174-eligible contracting portfolio.
Table 55: FY25 LL 174-Eligible Contracts and POs
| Certification Status | # of Contracts | % Share of Contracts | Total Registered Contract Value | % Share of Contract Value |
|---|---|---|---|---|
| All Contracts and POs | 1,284 | 100.00% | $2,408,993,508 | 100.00% |
| M/WBE | 425 | 33.10% | $106,912,451 | 4.44% |
| Non-Certified | 859 | 66.90% | $2,302,081,057 | 95.56% |
| LL174 Contracts and POs | 916 | 100.00% | $97,334,587 | 100.00% |
| M/WBE | 372 | 40.61% | $44,977,888 | 46.21% |
| Non-Certified | 544 | 59.39% | $52,356,698 | 53.79% |
| LL174 Subcontracts | 7 | 100.00% | $1,080,000 | 100.00% |
| M/WBE | 3 | 42.86% | $450,000 | 41.67% |
| Non-Certified | 4 | 57.14% | $630,000 | 58.33% |
Chart 57: FY22-25 Value of LL 174-Eligible Prime Contracts and POs
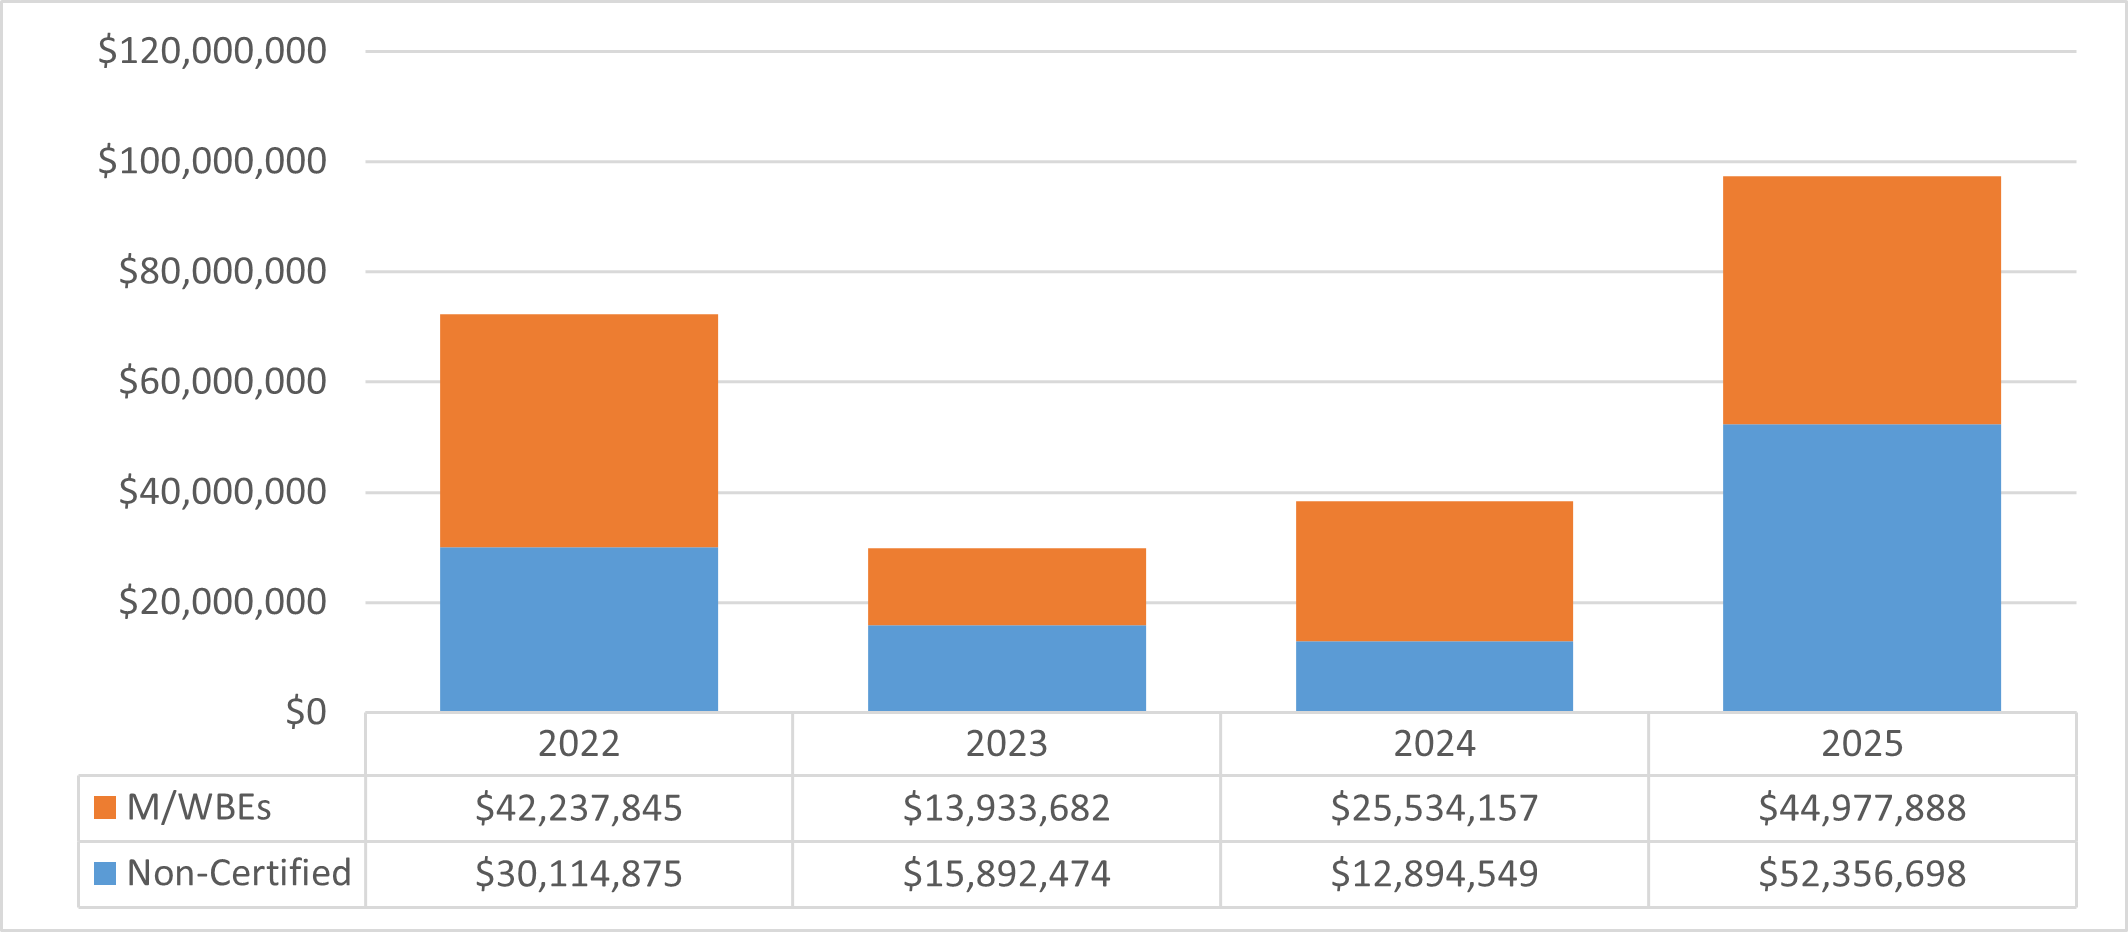
Chart 58: FY25 Value of LL 174-Eligible Contracts and POs, by Race and Gender
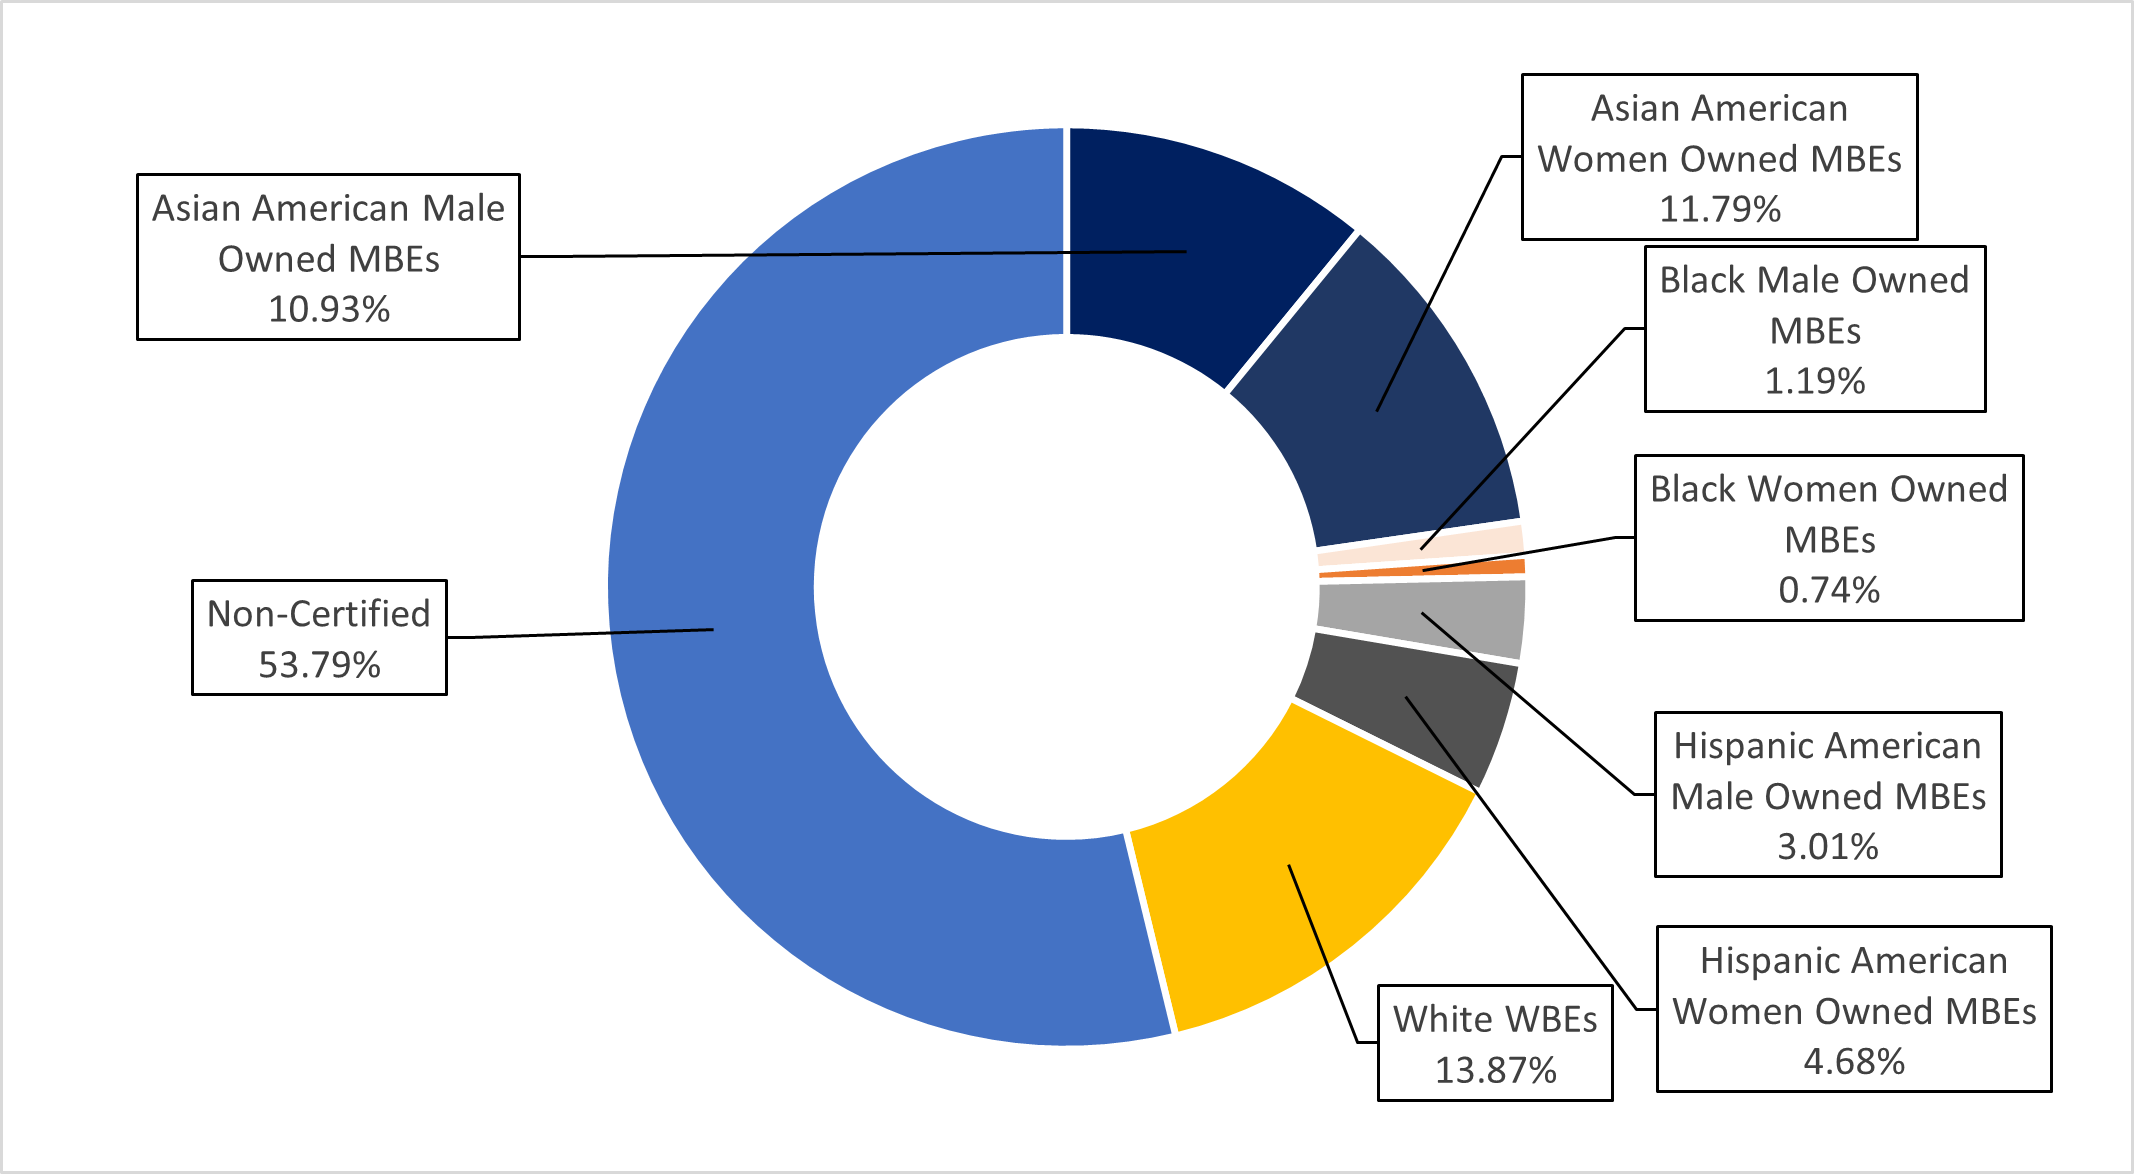
Chart 59: FY25 Share of LL 174-Eligible Contracts and PO Value, by M/WBE Category and Industry
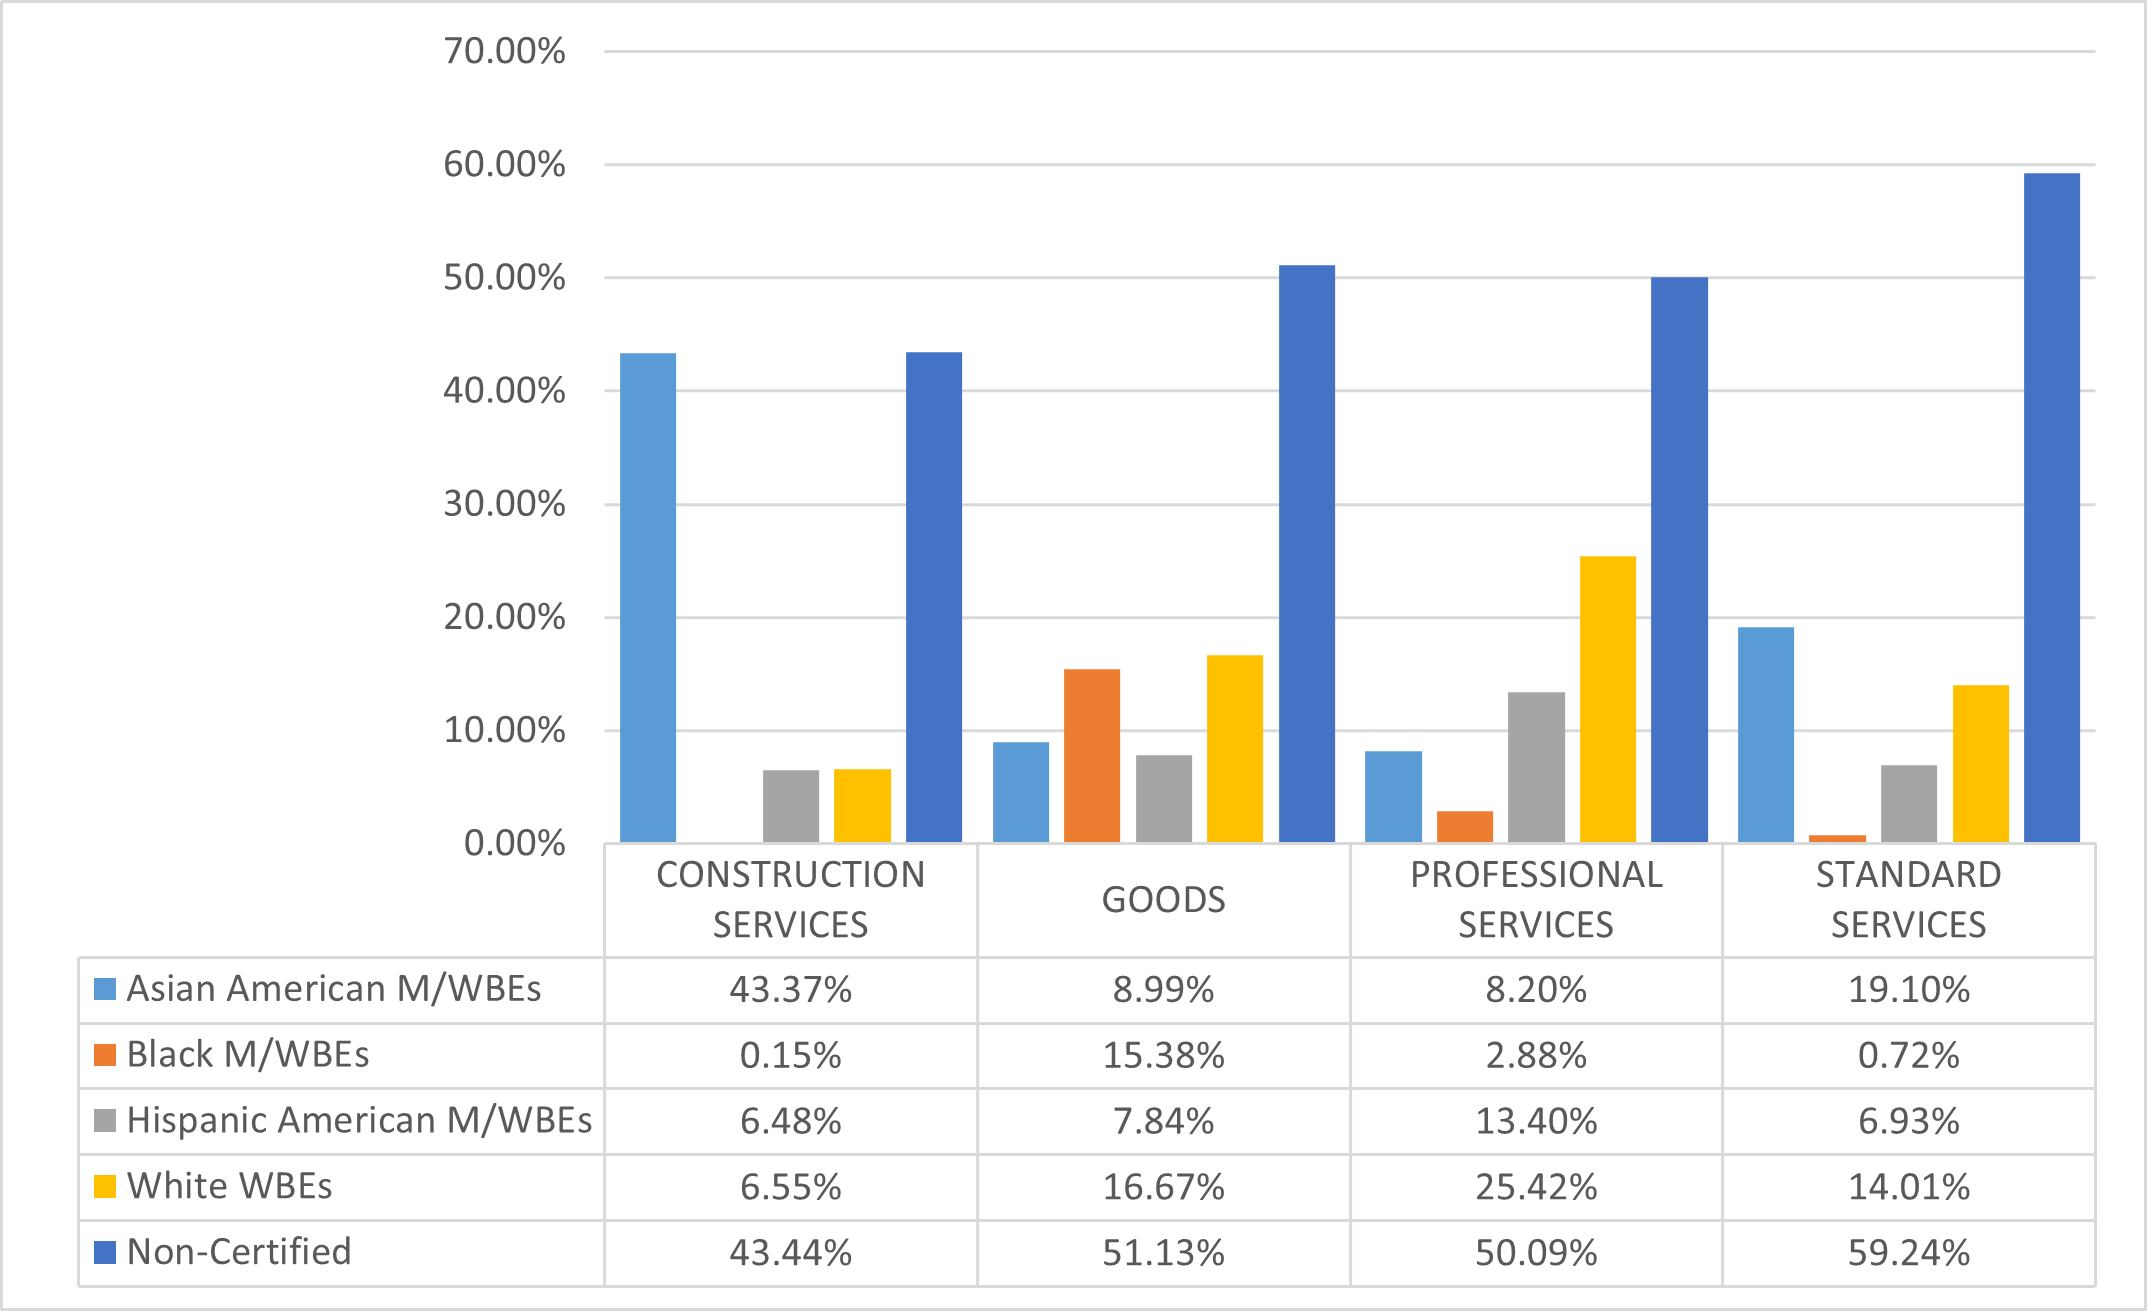
Department of Investigation (DOI)
Almost all of DOI’s FY25 procurement portfolio was subject to LL 174 participation goals in FY25. Its $17.8 million in LL 174-eligible value represents 0.1% of the City’s total LL 174-eligible contracting portfolio.
Table 56: FY25 LL 174-Eligible Contracts and POs
| Certification Status | # of Contracts | % Share of Contracts | Total Registered Contract Value | % Share of Contract Value |
|---|---|---|---|---|
| All Contracts and POs | 190 | 100.00% | $18,040,598 | 100.00% |
| M/WBE | 69 | 36.32% | $989,450 | 5.48% |
| Non-Certified | 121 | 63.68% | $17,051,147 | 94.52% |
| LL174 Contracts and POs | 185 | 100.00% | $17,827,872 | 100.00% |
| M/WBE | 69 | 37.30% | $989,450 | 5.55% |
| Non-Certified | 116 | 62.70% | $16,838,421 | 94.45% |
| LL174 Subcontracts | 0 | 0.00% | $0 | 0.00% |
| M/WBE | 0 | 0.00% | $0 | 0.00% |
| Non-Certified | 0 | 0.00% | $0 | 0.00% |
Chart 60: FY22-25 Value of LL 174-Eligible Prime Contracts and POs
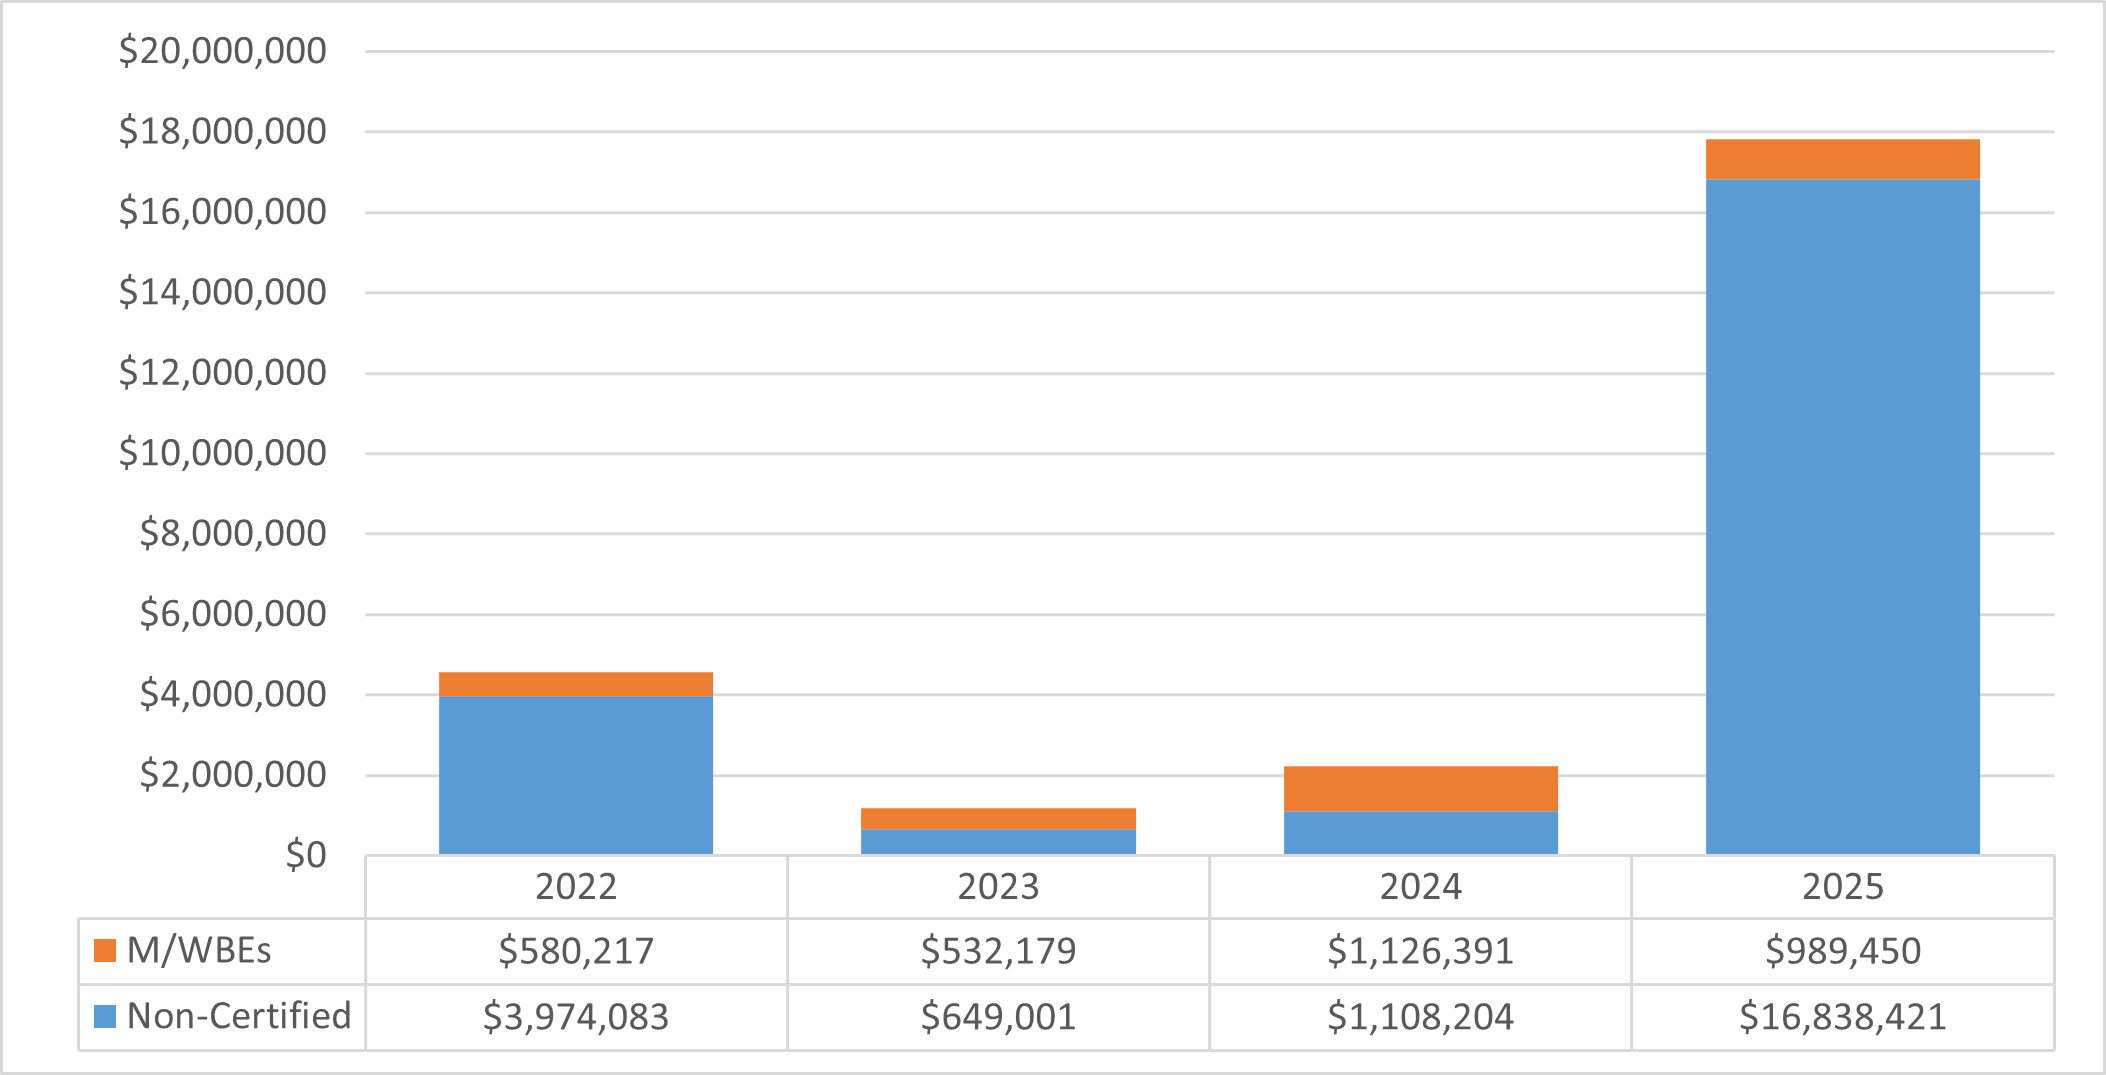
Chart 61: FY25 Value of LL 174-Eligible Contracts and POs, by Race and Gender
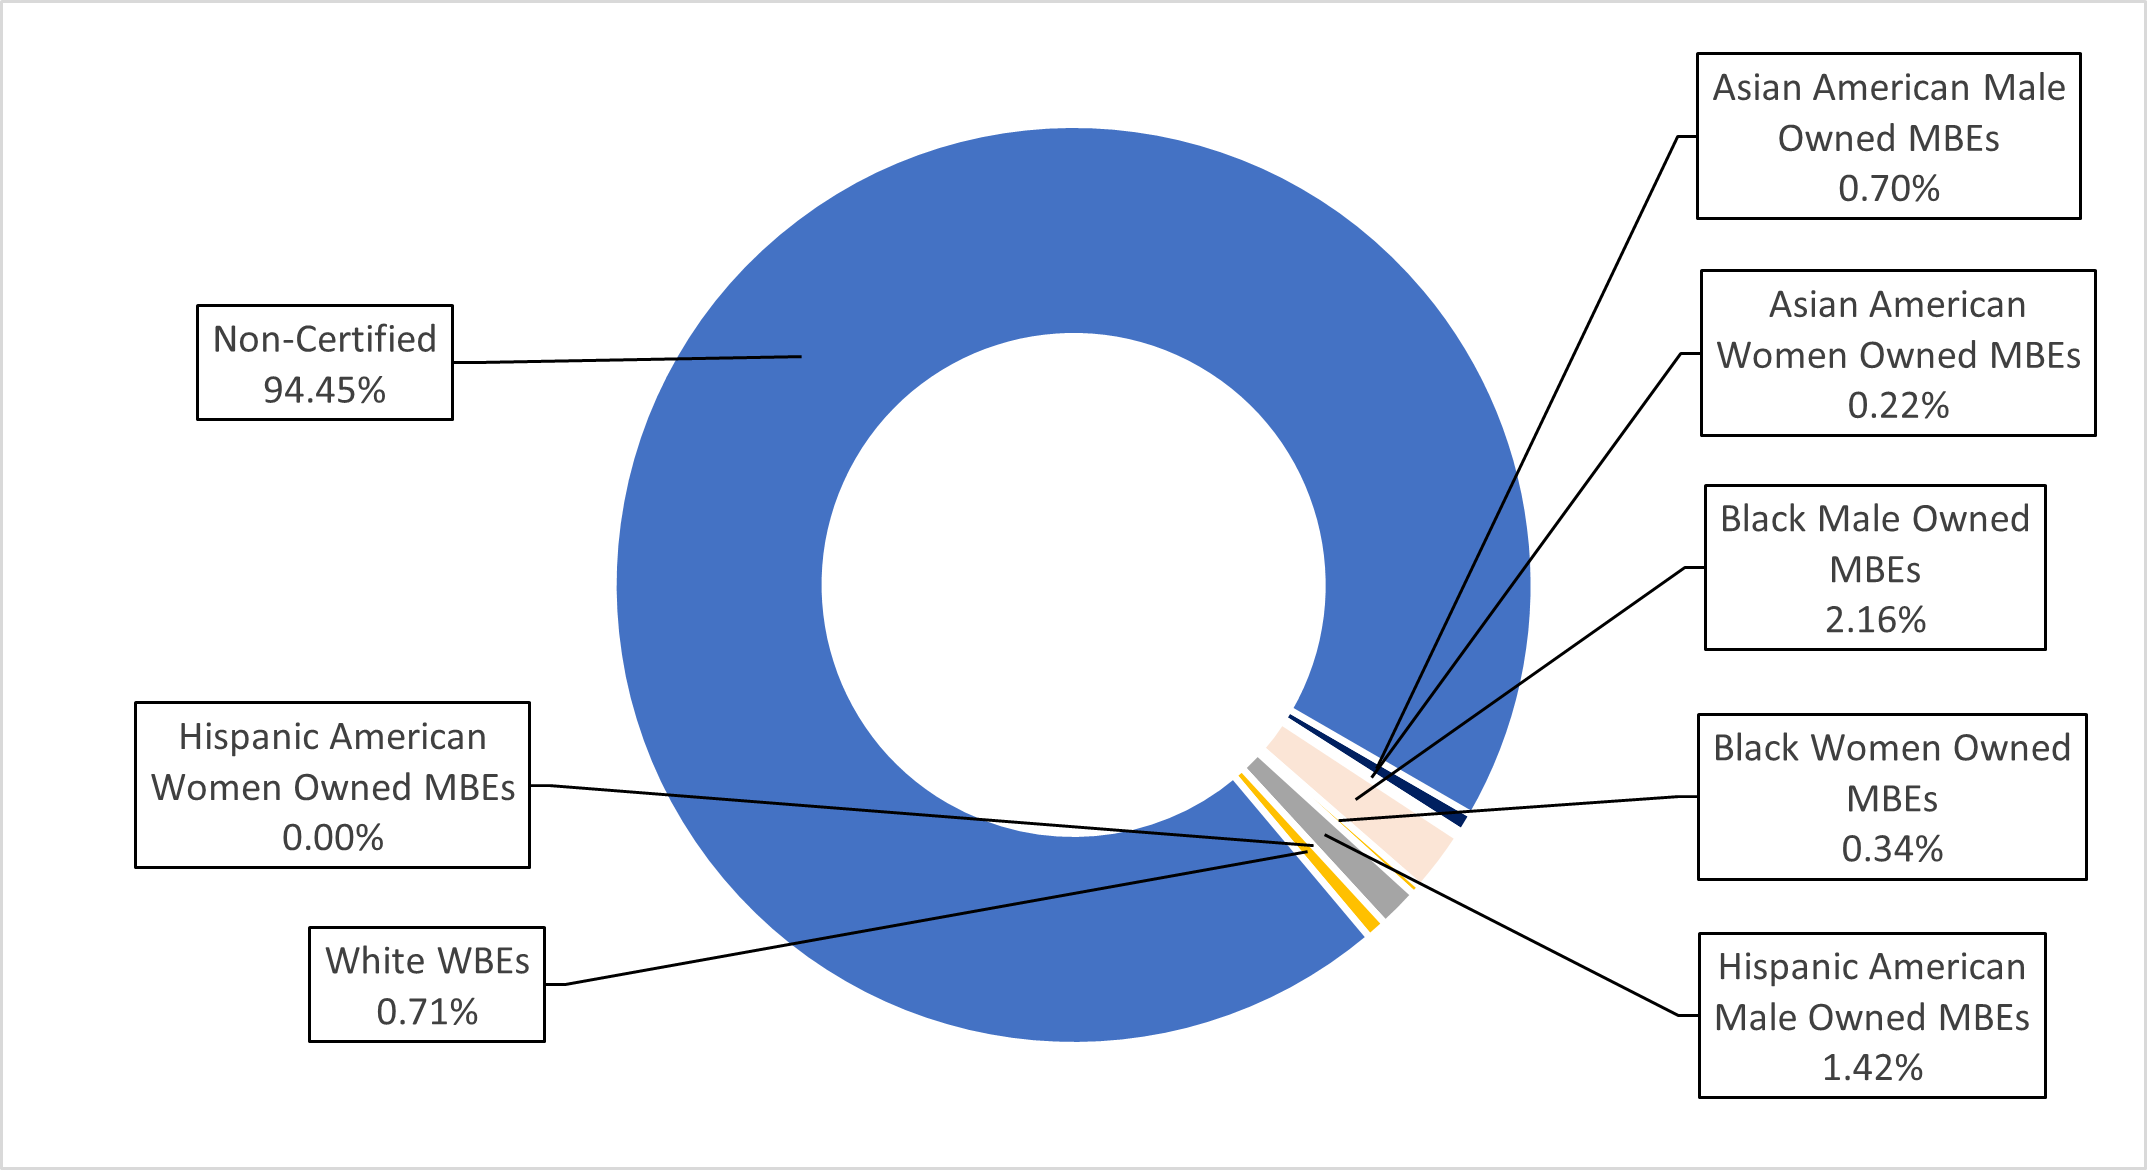
Chart 62: FY25 Share of LL 174-Eligible Contracts and PO Value, by M/WBE Category and Industry
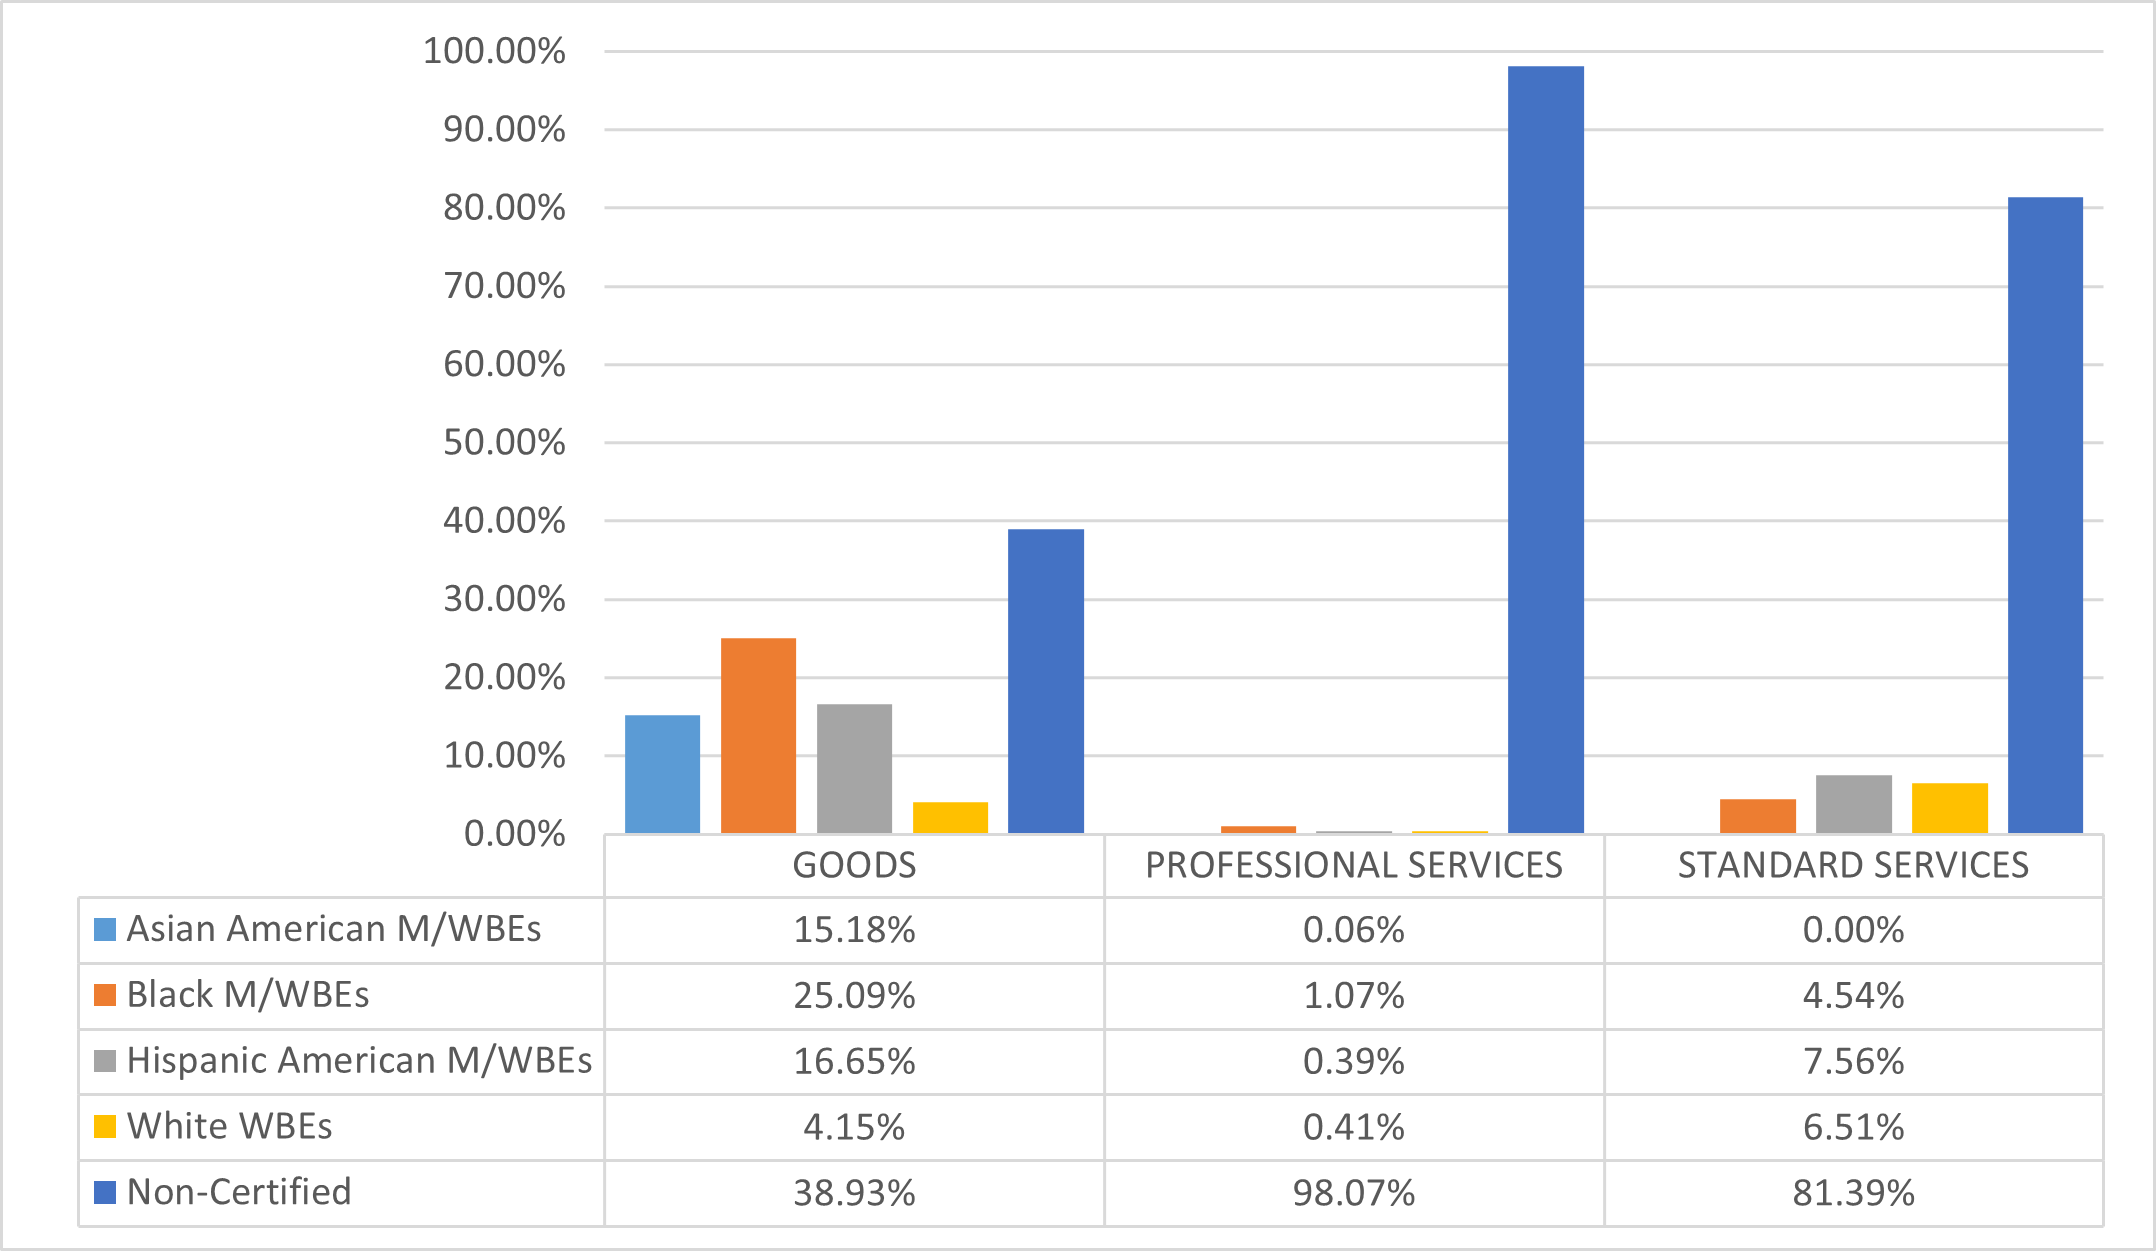
Department of Probation (DOP)
The LL 174 totals below represent a small share of DOP’s total procurement portfolio, as DOP predominantly contracts with vendors for human services, which are exempt from LL 174 participation goals. Its $3.6 million in LL 174-eligible value represents just 0.02% of the City’s total LL 174-eligible contracting portfolio.
Table 57: FY25 LL 174-Eligible Contracts and POs
| Certification Status | # of Contracts | % Share of Contracts | Total Registered Contract Value | % Share of Contract Value |
|---|---|---|---|---|
| All Contracts and POs | 245 | 100.00% | $31,928,682 | 100.00% |
| M/WBE | 80 | 32.65% | $3,822,884 | 11.97% |
| Non-Certified | 165 | 67.35% | $28,105,798 | 88.03% |
| LL174 Contracts and POs | 183 | 100.00% | $3,610,622 | 100.00% |
| M/WBE | 72 | 39.34% | $2,835,782 | 78.54% |
| Non-Certified | 111 | 60.66% | $774,840 | 21.46% |
| LL174 Subcontracts | 0 | 0.00% | $0 | 0.00% |
| M/WBE | 0 | 0.00% | $0 | 0.00% |
| Non-Certified | 0 | 0.00% | $0 | 0.00% |
Chart 63: FY22-25 Value of LL 174-Eligible Prime Contracts and POs
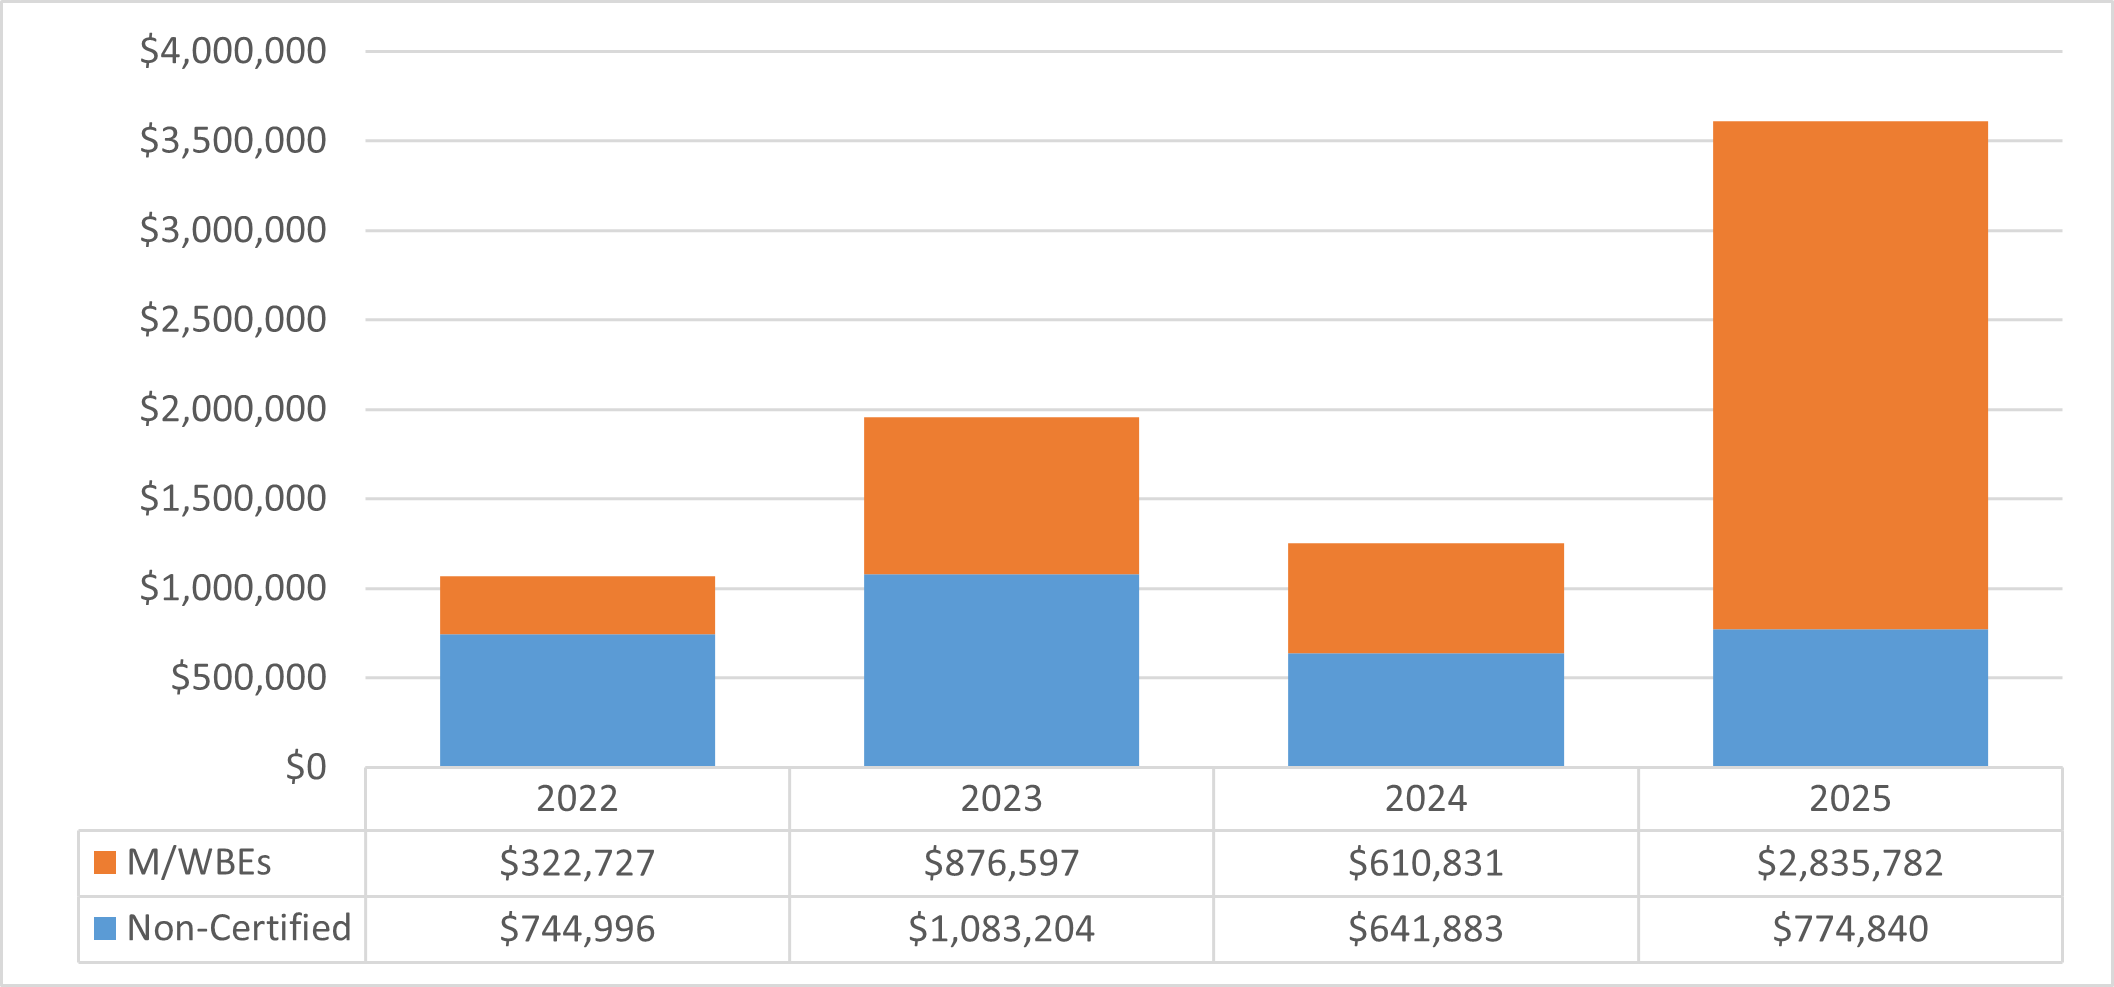
Chart 64: FY25 Value of LL 174-Eligible Contracts and POs, by Race and Gender
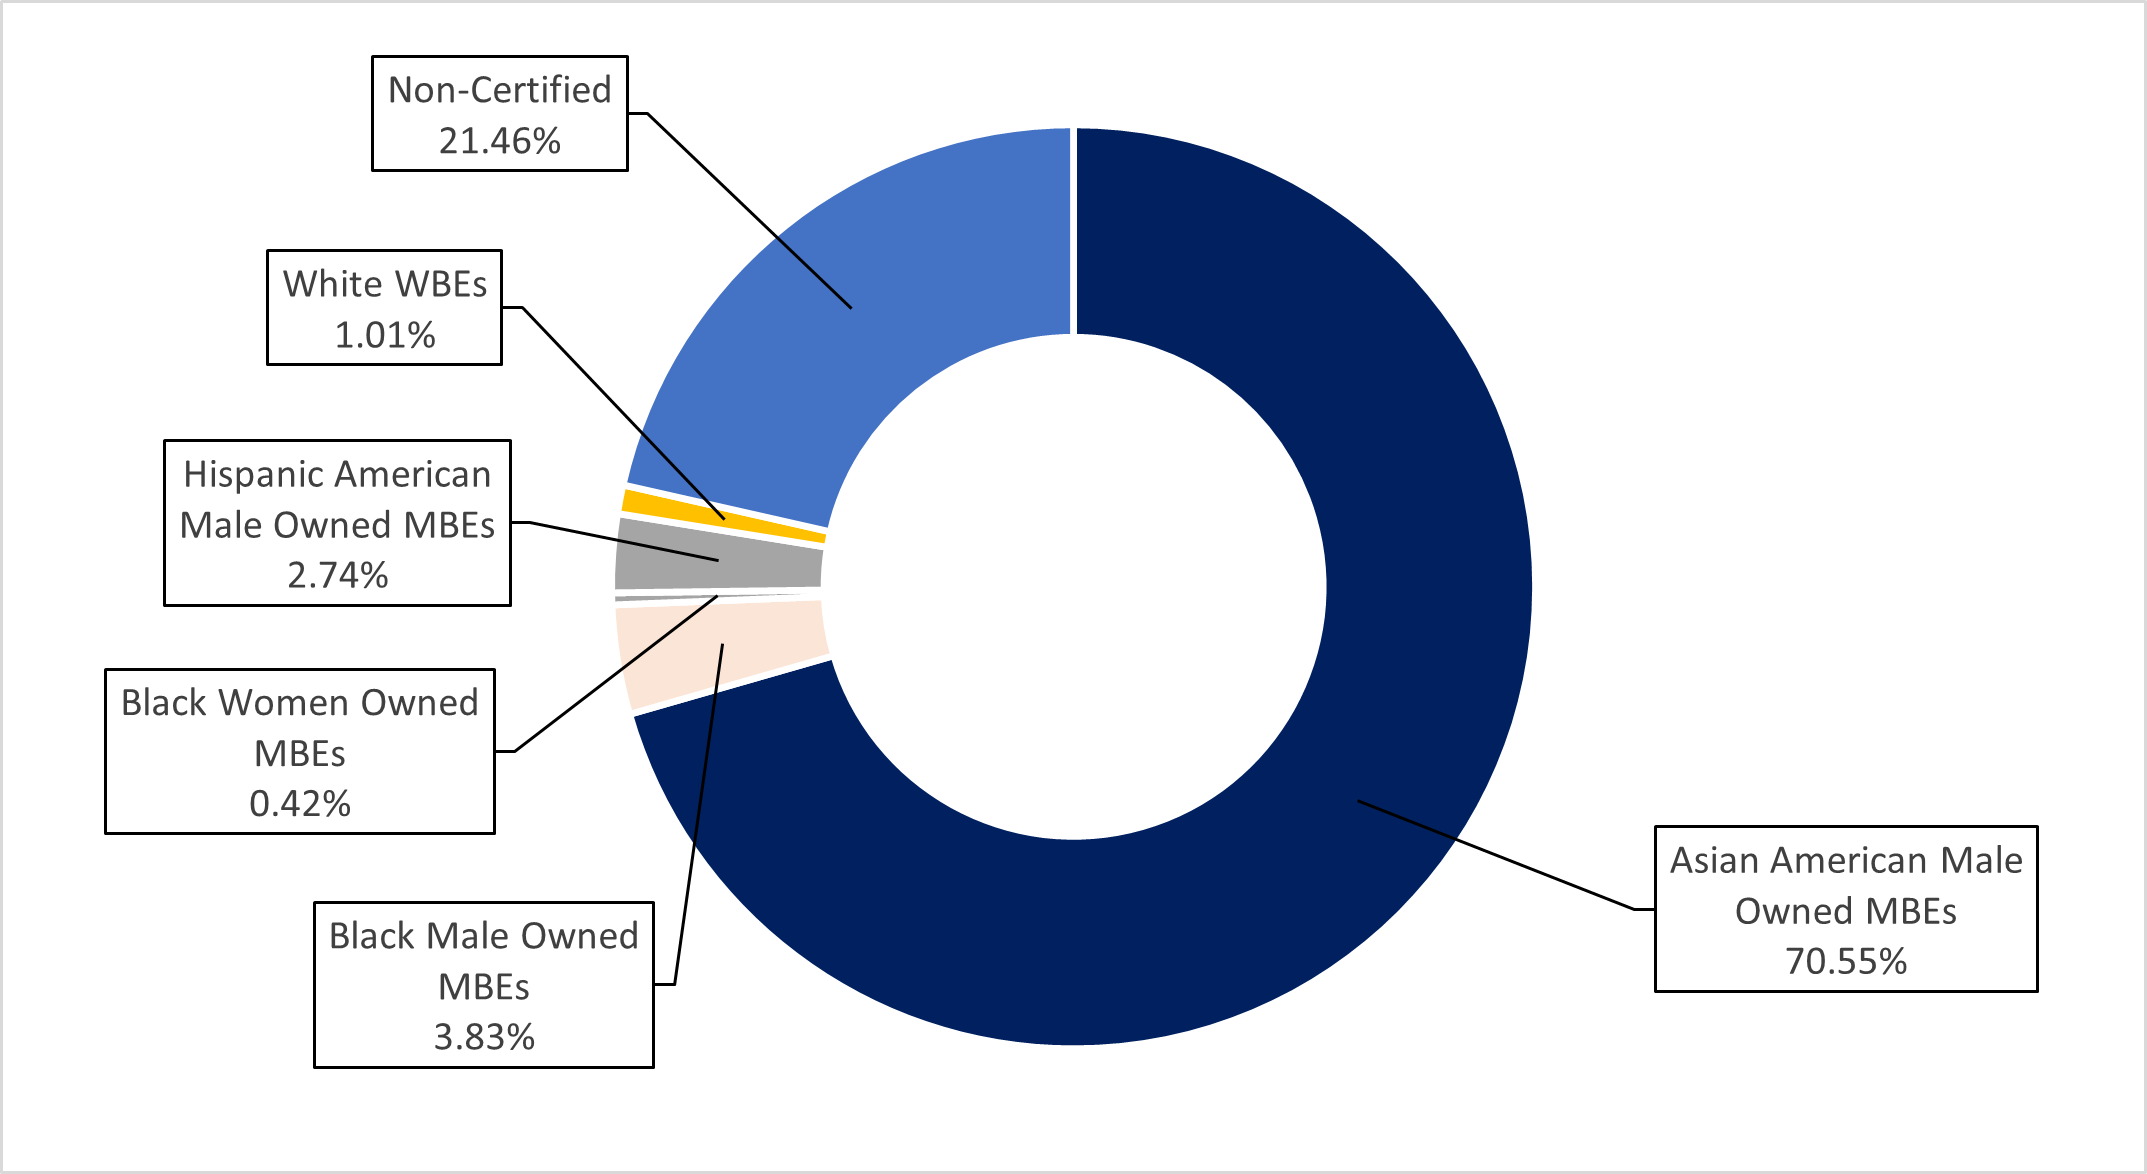
Chart 65: FY25 Share of LL 174-Eligible Contracts and PO Value, by M/WBE Category and Industry
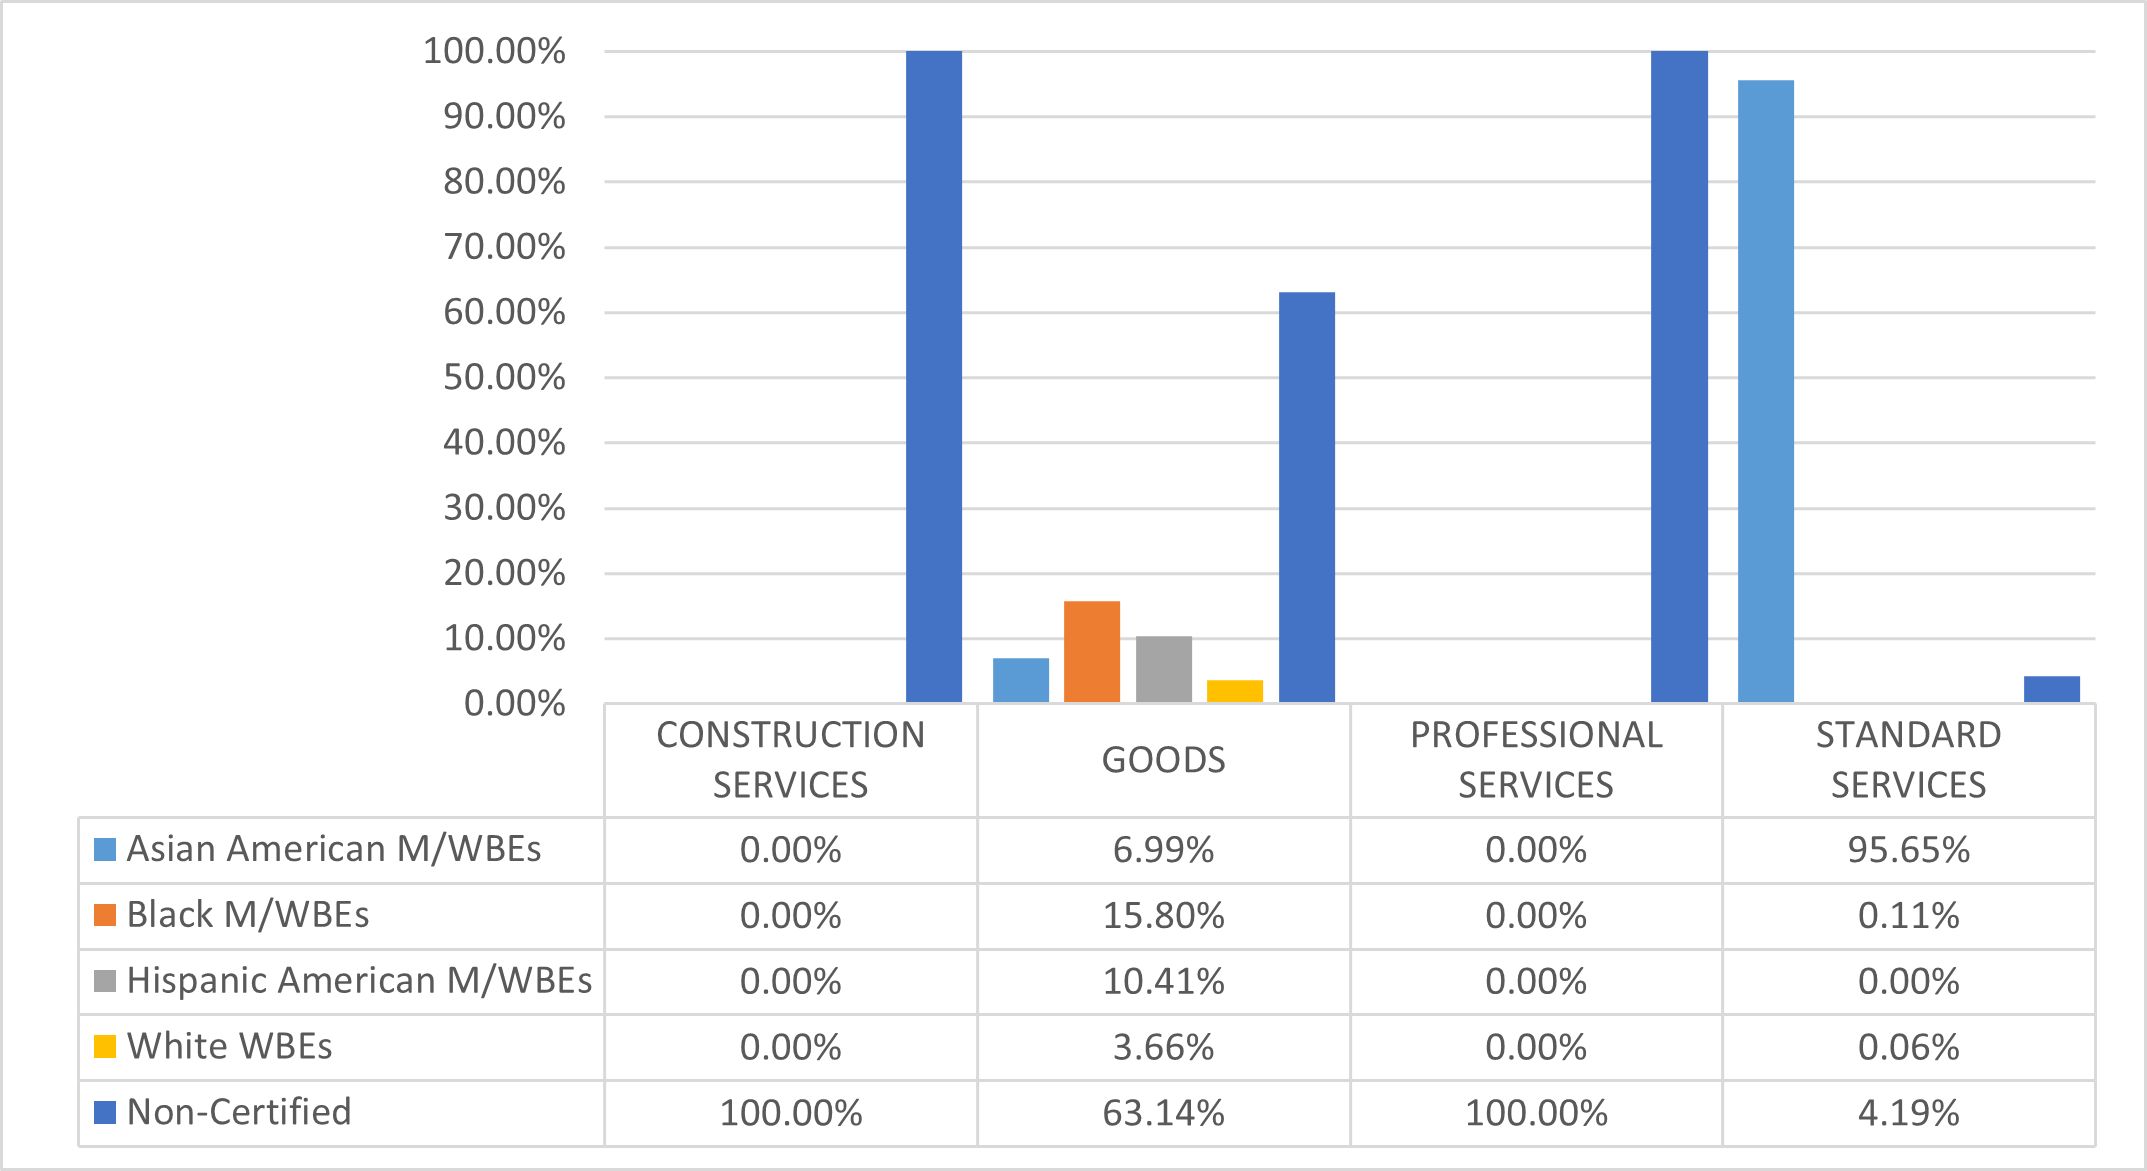
Department of Records and Information Services (DORIS)
About half of DORIS’ procurement portfolio was subject to LL 174 participation goals in FY25. DORIS’ $474,118 in LL 174-eligible value represents 0.002% of the City’s total LL 174-eligible contracting portfolio.
Table 58: FY25 LL 174-Eligible Contracts and POs
| Certification Status | # of Contracts | % Share of Contracts | Total Registered Contract Value | % Share of Contract Value |
|---|---|---|---|---|
| All Contracts and POs | 145 | 100.00% | $845,890 | 100.00% |
| M/WBE | 20 | 13.79% | $67,029 | 7.92% |
| Non-Certified | 125 | 86.21% | $778,861 | 92.08% |
| LL174 Contracts and POs | 139 | 100.00% | $474,118 | 100.00% |
| M/WBE | 20 | 14.39% | $67,029 | 14.14% |
| Non-Certified | 119 | 85.61% | $407,089 | 85.86% |
| LL174 Subcontracts | 0 | 0.00% | $0 | 0.00% |
| M/WBE | 0 | 0.00% | $0 | 0.00% |
| Non-Certified | 0 | 0.00% | $0 | 0.00% |
Chart 66: FY22-25 Value of LL 174-Eligible Prime Contracts and POs
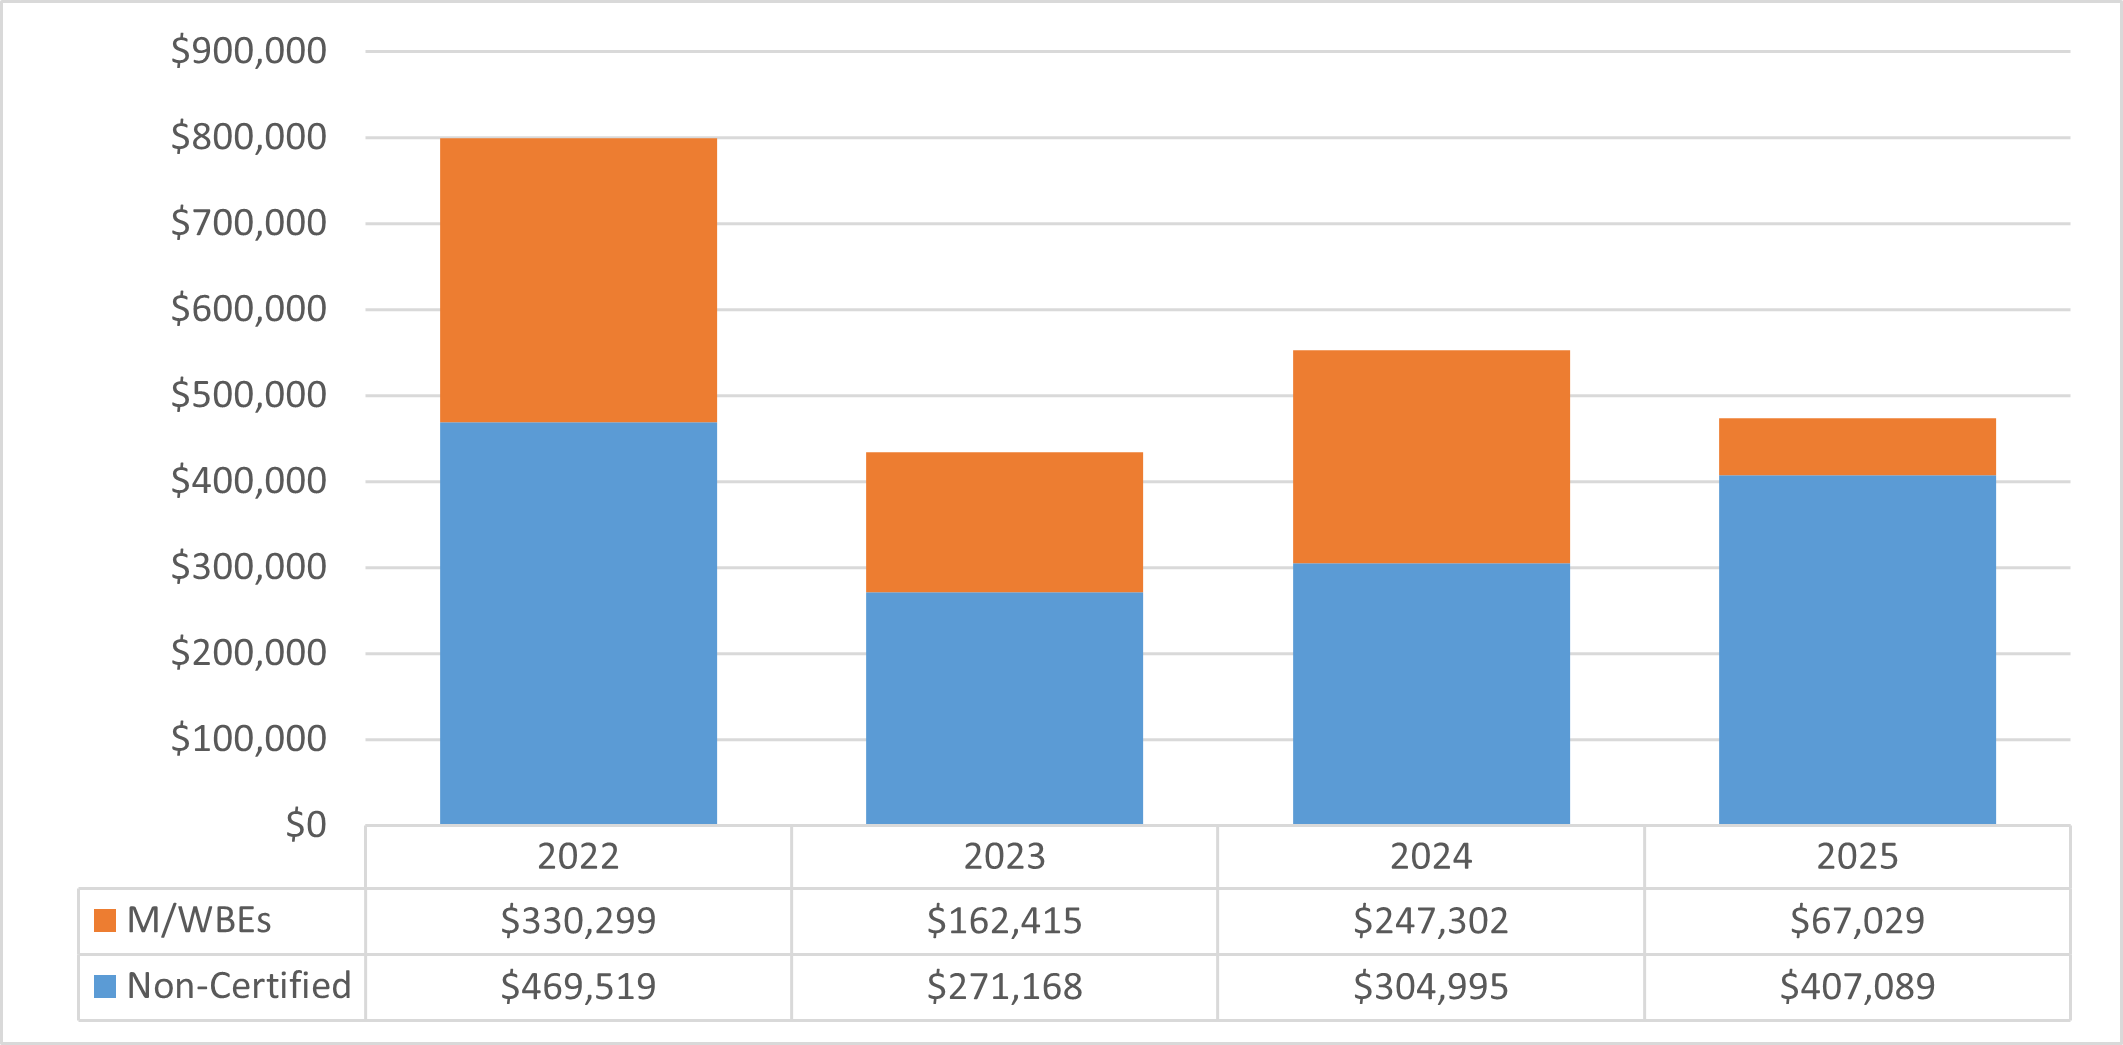
Chart 67: FY25 Value of LL 174-Eligible Contracts and POs, by Race and Gender
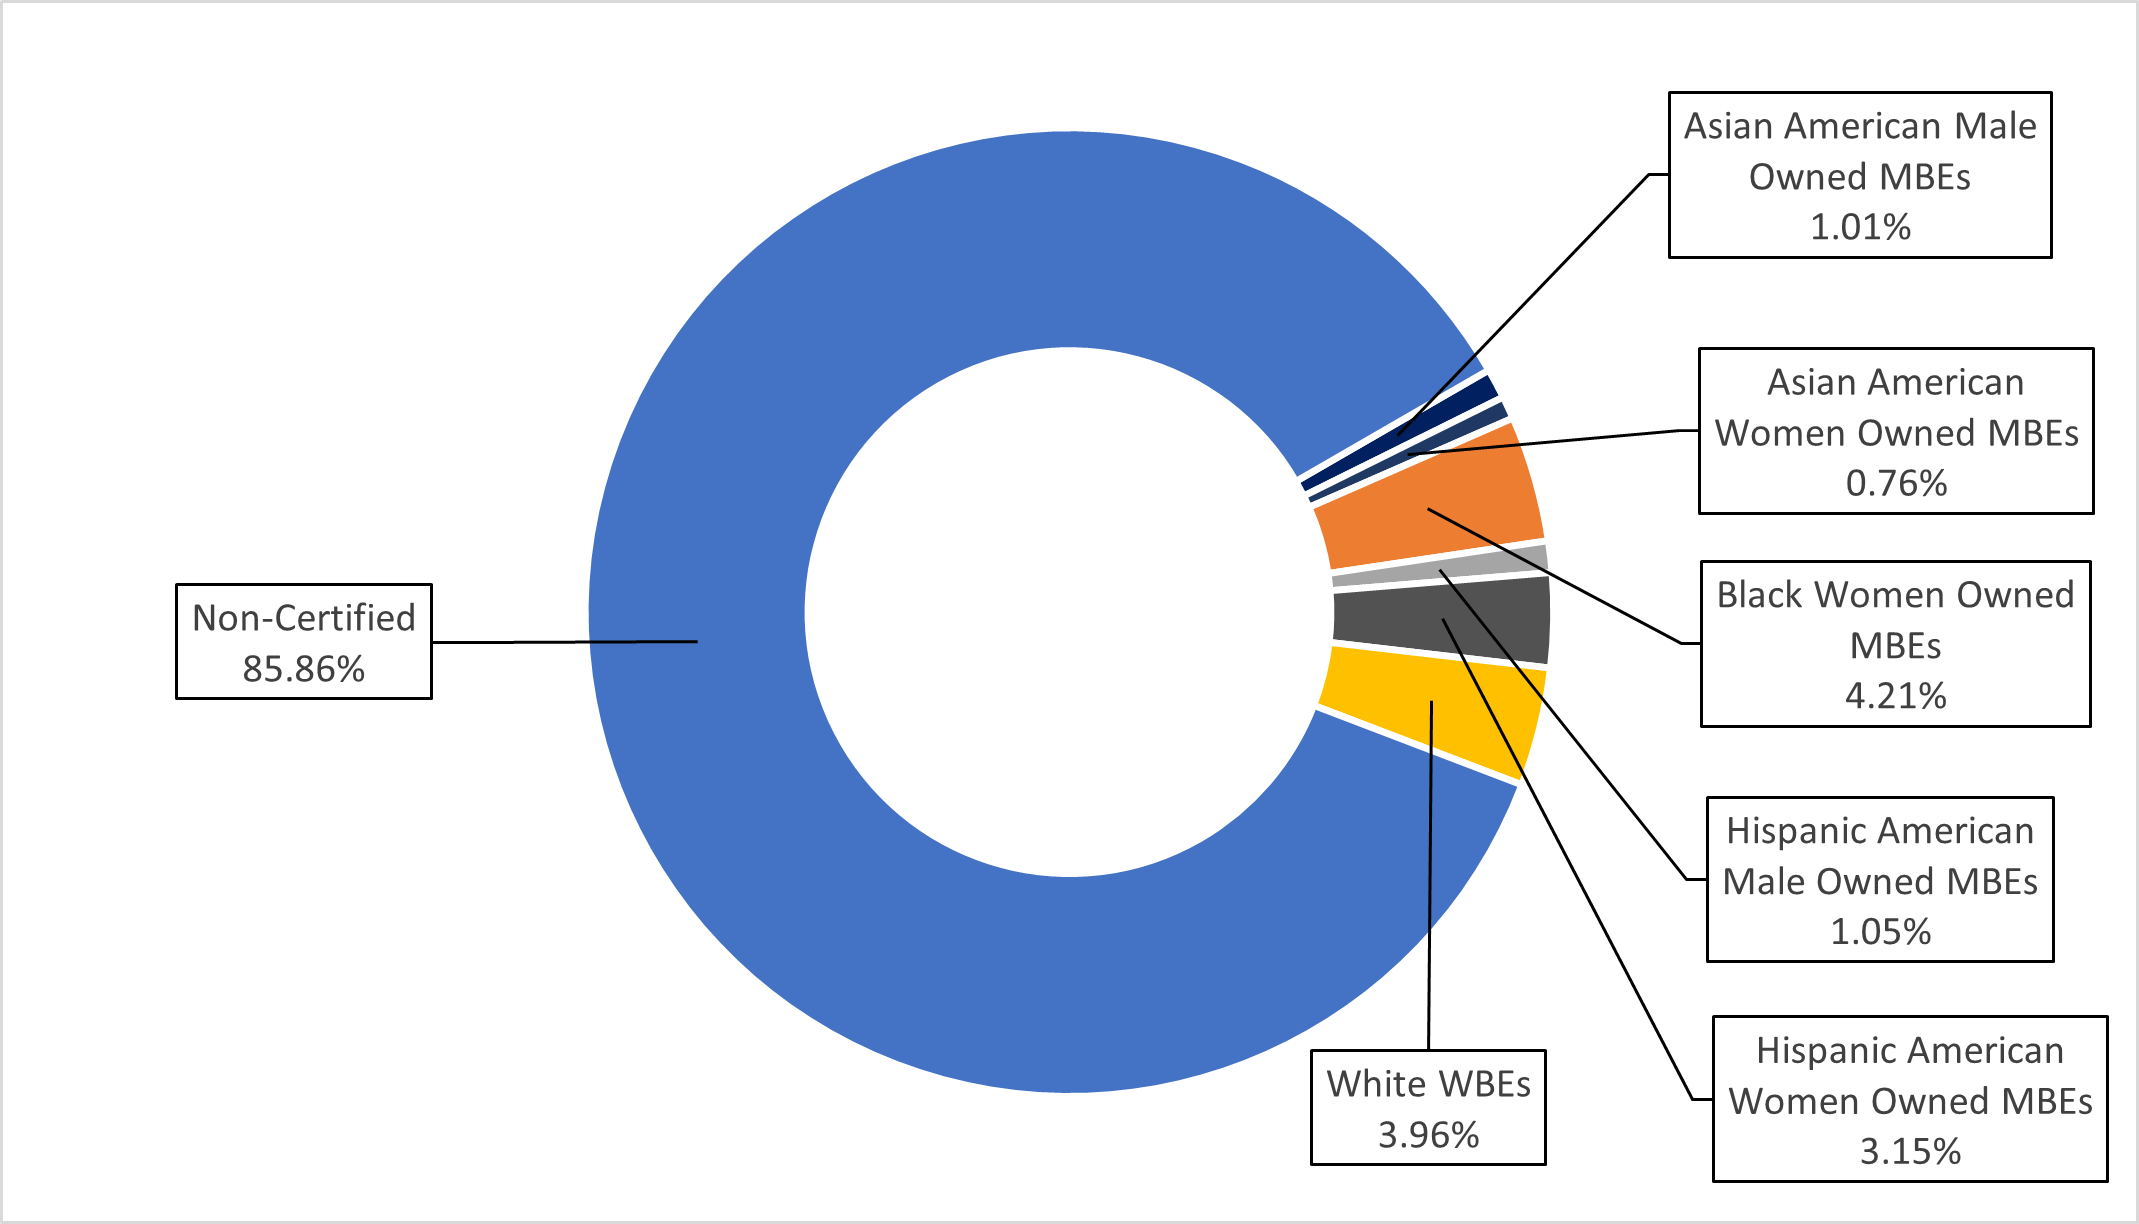
Chart 68: FY25 Share of LL 174-Eligible Contracts and PO Value, by M/WBE Category and Industry
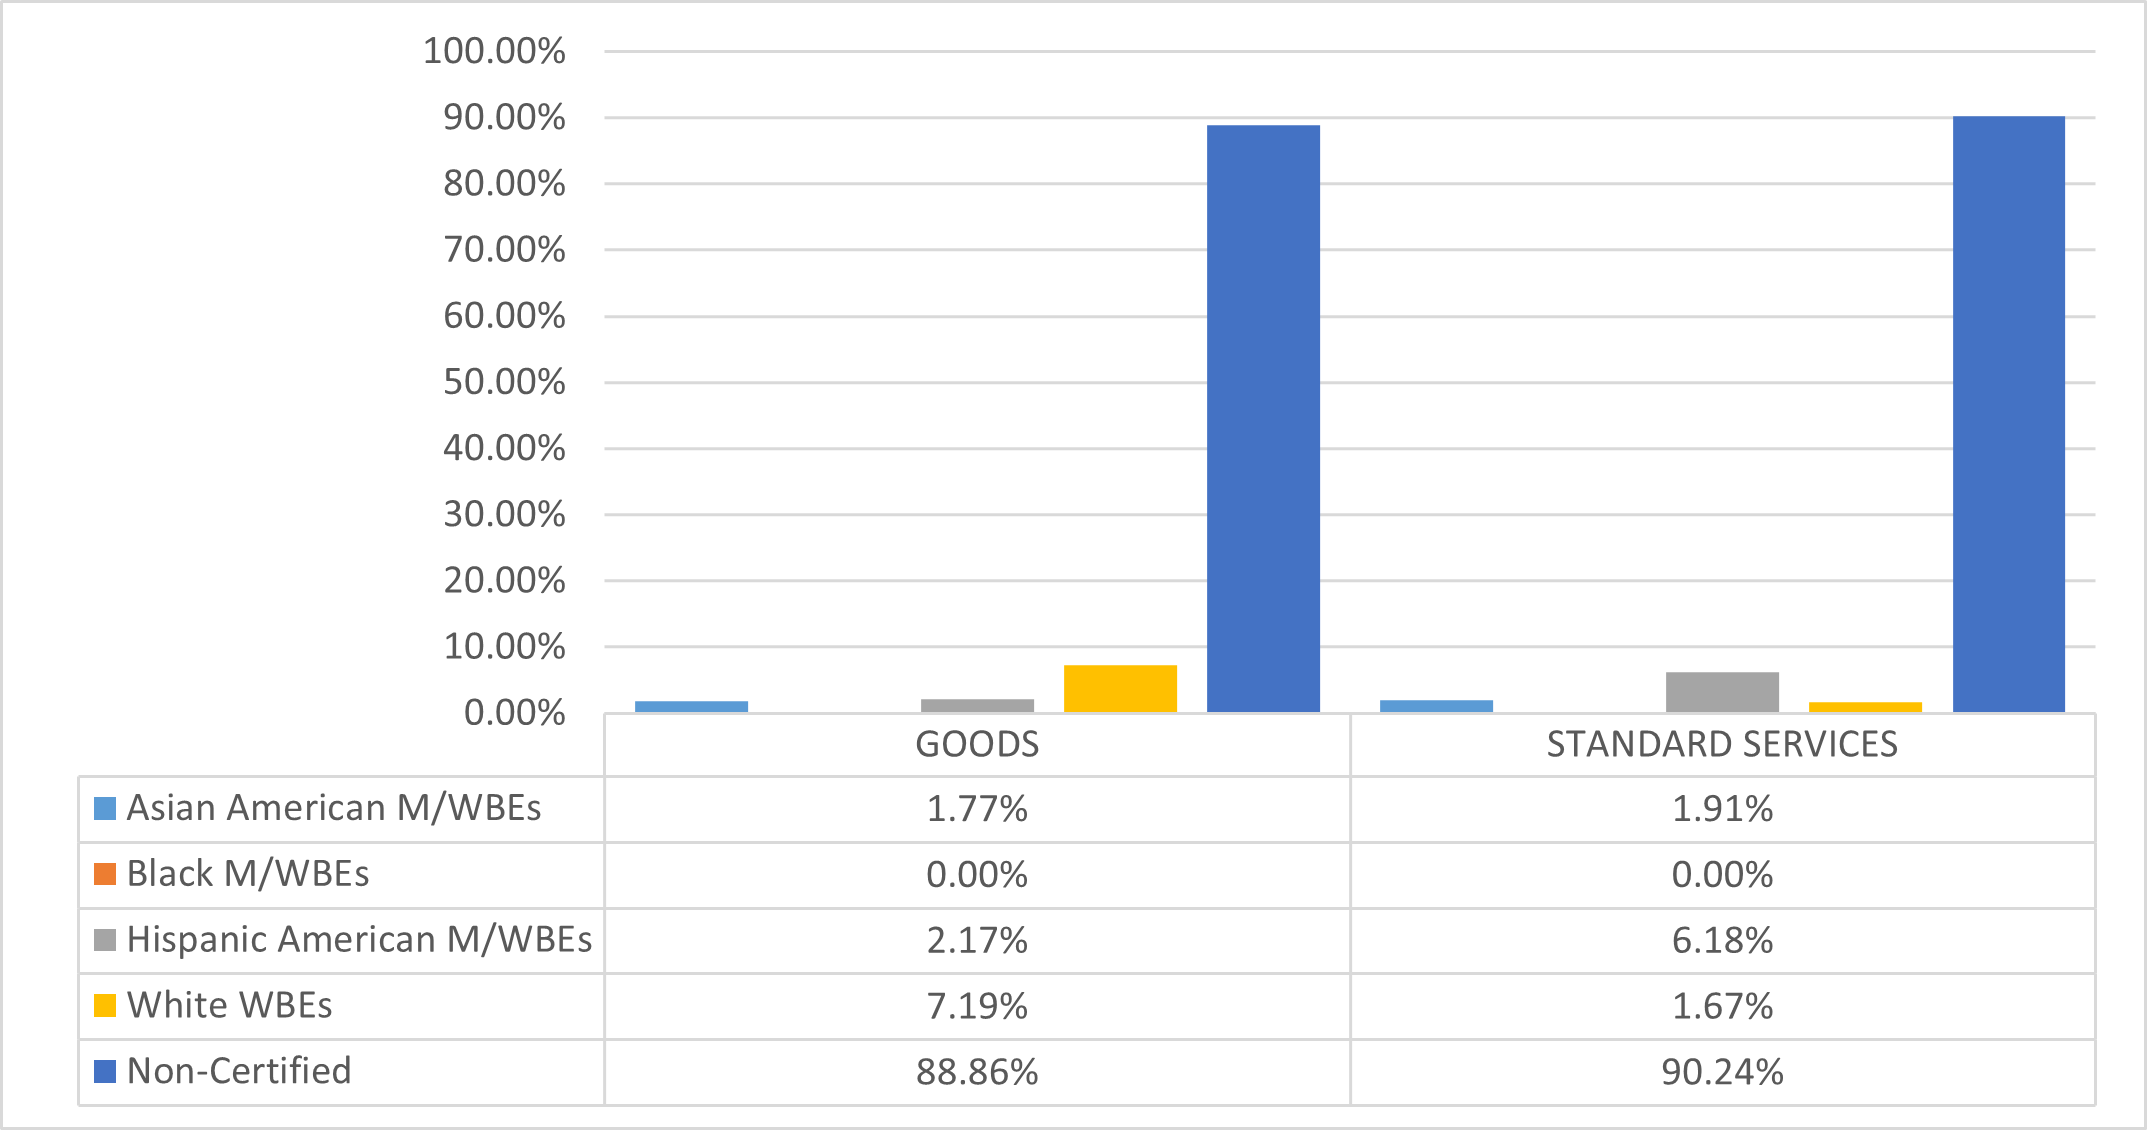
Department of Transportation (DOT)
Half of DOT’s FY25 contract portfolio is subject to LL 174 participation goals. However, many of DOT’s contracts are funded, at least in part, by non-City sources, which are excluded from the local law. City procurement systems are limited and do not include the necessary data to confirm if a contract is in fact funded by State or Federal funds. Due to these limitations, LL 174-eligible data in this Report includes some contracts that may actually be excluded from LL 174. DOT’s $282 million in LL 174-eligible value accounts for 1.6% of the City’s total LL 174-eligible contracting portfolio (acknowledging that this total may include some excluded contracts).
Table 59: FY25 LL 174-Eligible Contracts and POs – FY23
| Certification Status | # of Contracts | % Share of Contracts | Total Registered Contract Value | % Share of Contract Value |
|---|---|---|---|---|
| All Contracts and POs | 872 | 100.00% | $449,372,738 | 100.00% |
| M/WBE | 455 | 52.18% | $83,503,931 | 18.58% |
| Non-Certified | 417 | 47.82% | $365,868,807 | 81.42% |
| LL174 Contracts and POs | 706 | 100.00% | $282,155,294 | 100.00% |
| M/WBE | 444 | 62.89% | $71,291,859 | 25.27% |
| Non-Certified | 262 | 37.11% | $210,863,435 | 74.73% |
| LL174 Subcontracts | 12 | 100.00% | $3,704,592 | 100.00% |
| M/WBE | 12 | 100.00% | $3,704,592 | 100.00% |
| Non-Certified | 0 | 0% | $0 | 0% |
Chart 69: FY22-25 Value of LL 174-Eligible Prime Contracts and POs
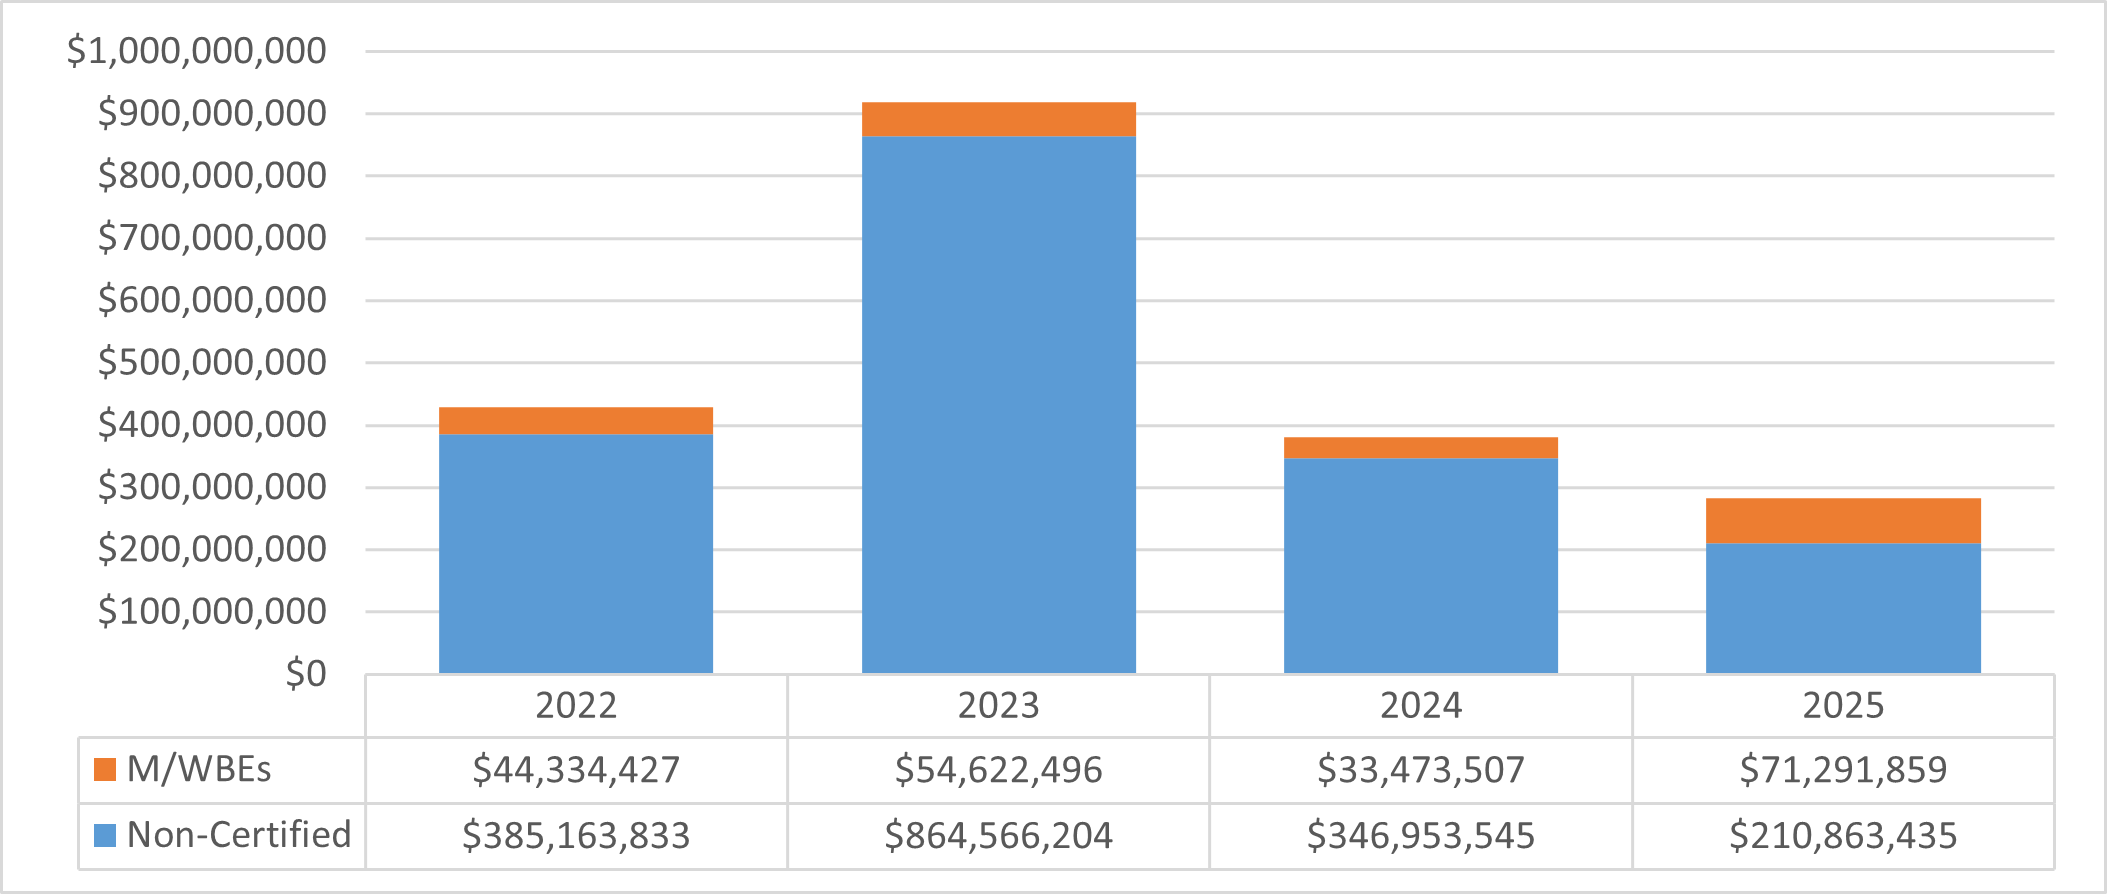
Chart 70: FY25 Value of LL 174-Eligible Contracts and POs, by Race and Gender
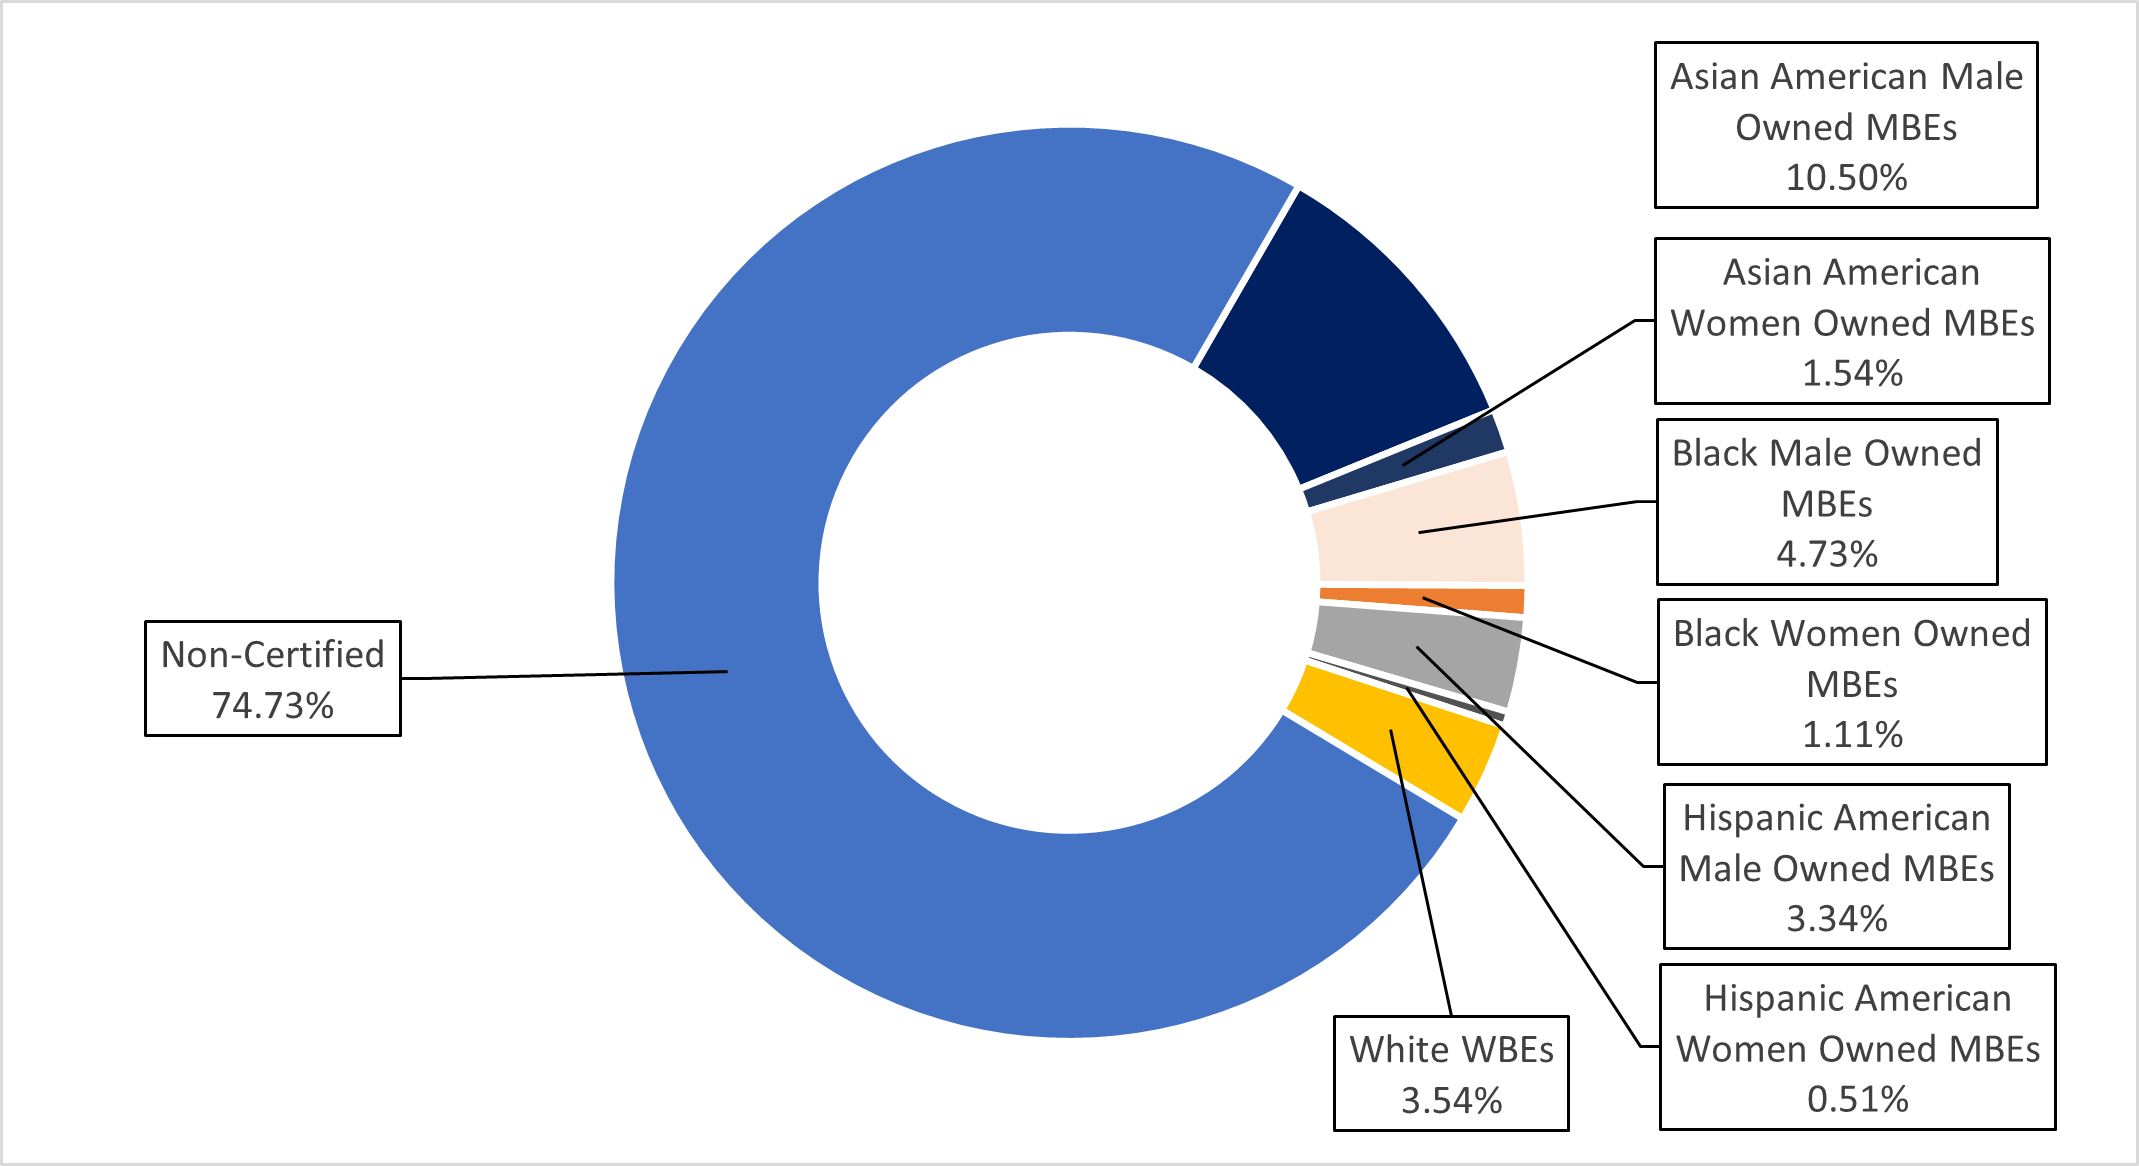
Chart 71: FY25 Share of LL 174-Eligible Contracts and PO Value, by M/WBE Category and Industry
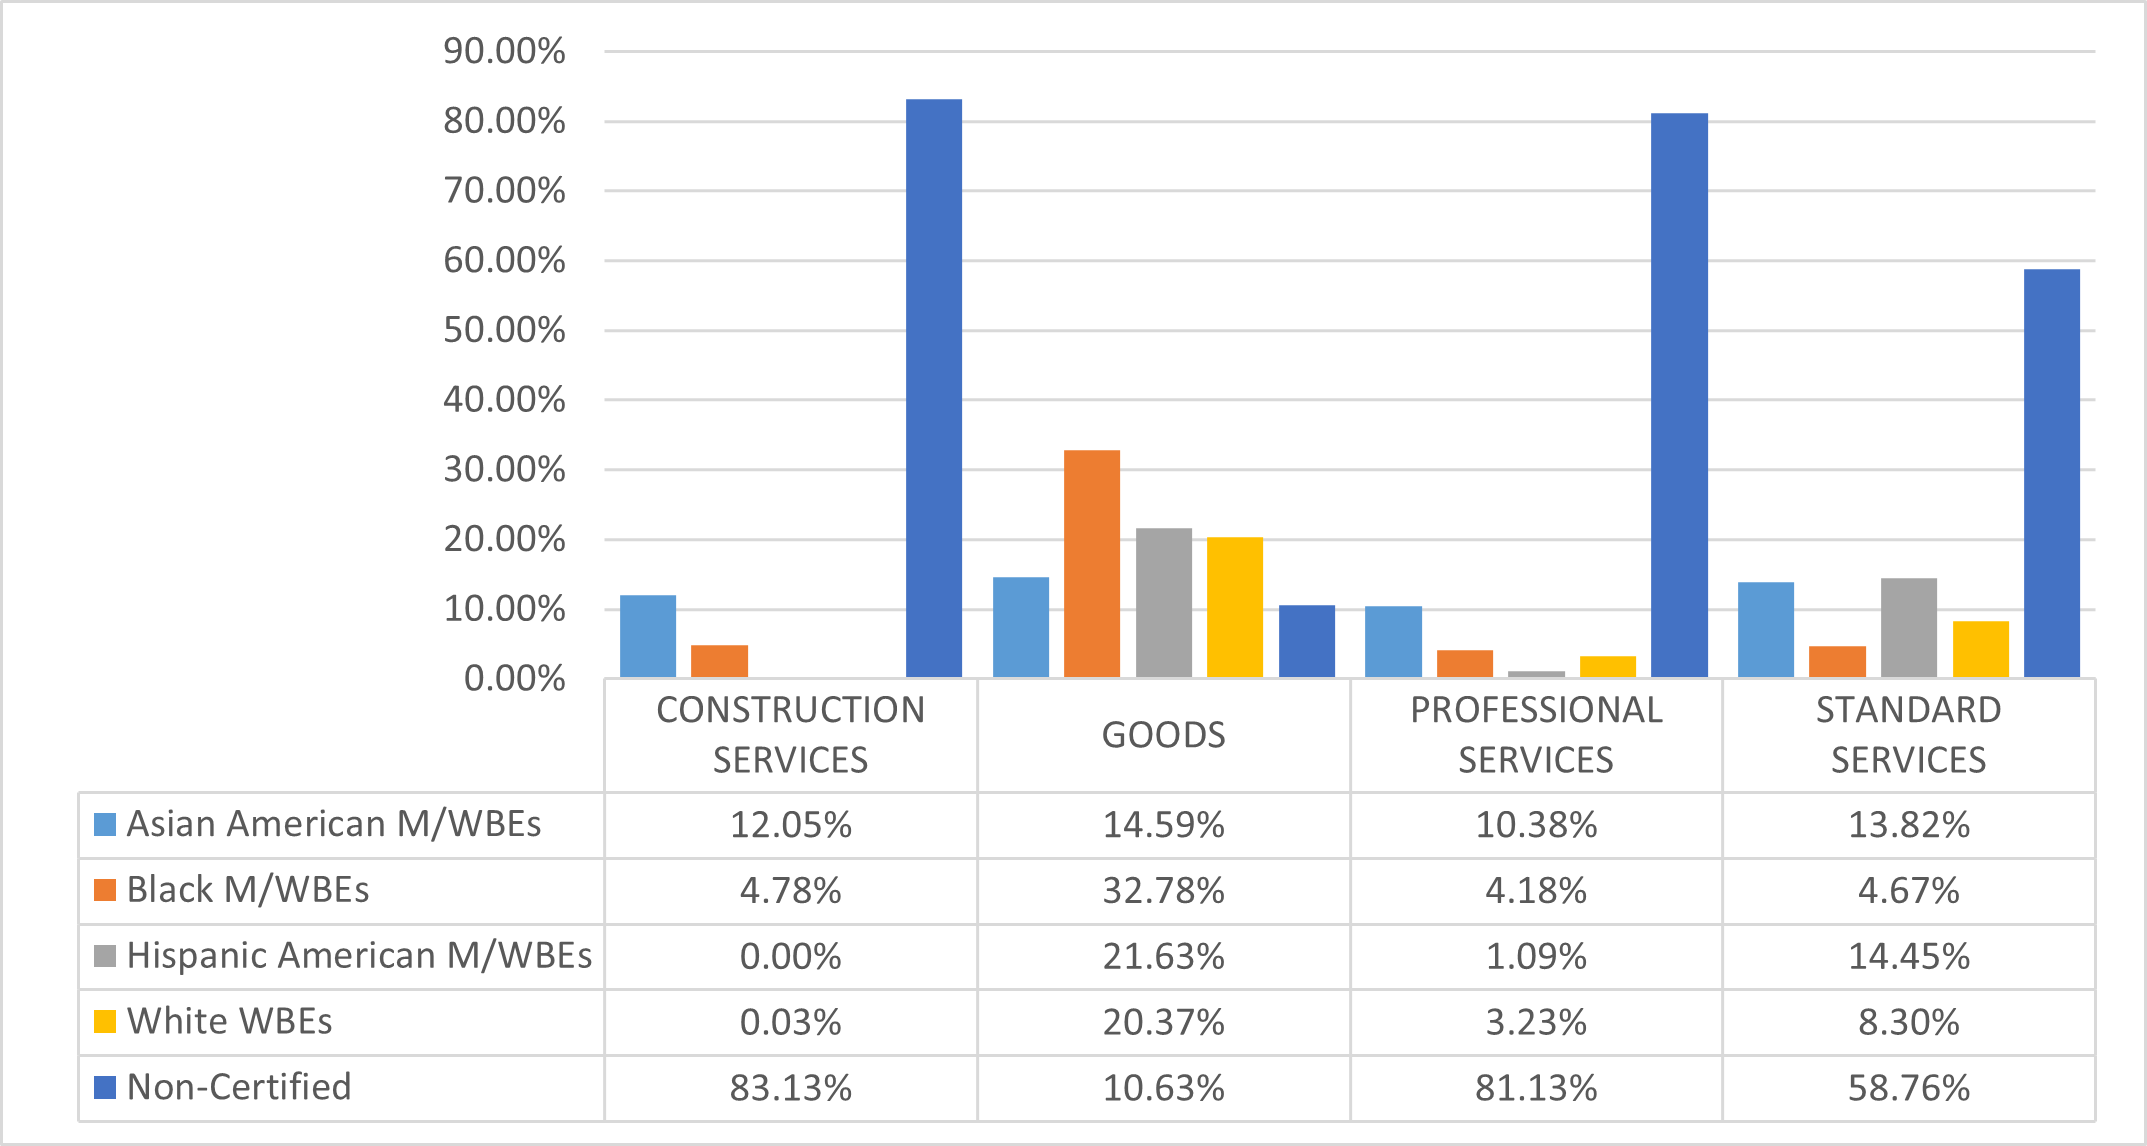
Department of Parks and Recreation (DPR)
More than half of DPR’s contract portfolio was subject to LL 174 participation goals in FY25 (61%). In FY25, DPR registered valuable Renewals, which are excluded from this analysis. These contracts total $182 million and represent the majority of the excluded value. Its $434.7 million in LL 174-eligible value represents 2.5% of the City’s total LL 174-eligible contracting portfolio.
Table 60: FY25 LL 174-Eligible Contracts and POs
| Certification Status | # of Contracts | % Share of Contracts | Total Registered Contract Value | % Share of Contract Value |
|---|---|---|---|---|
| All Contracts and POs | 1,273 | 100.00% | $705,170,996 | 100.00% |
| M/WBE | 498 | 39.12% | $226,192,076 | 32.08% |
| Non-Certified | 775 | 60.88% | $478,978,920 | 67.92% |
| LL174 Contracts and POs | 1,167 | 100.00% | $434,701,945 | 100.00% |
| M/WBE | 492 | 42.16% | $150,567,076 | 34.64% |
| Non-Certified | 675 | 57.84% | $284,134,869 | 65.36% |
| LL174 Subcontracts | 417 | 100.00% | $67,205,195 | 100.00% |
| M/WBE | 213 | 51.08% | $39,782,706 | 59.20% |
| Non-Certified | 204 | 48.92% | $27,422,489 | 40.80% |
Chart 72: FY22-25 Value of LL 174-Eligible Prime Contracts and POs
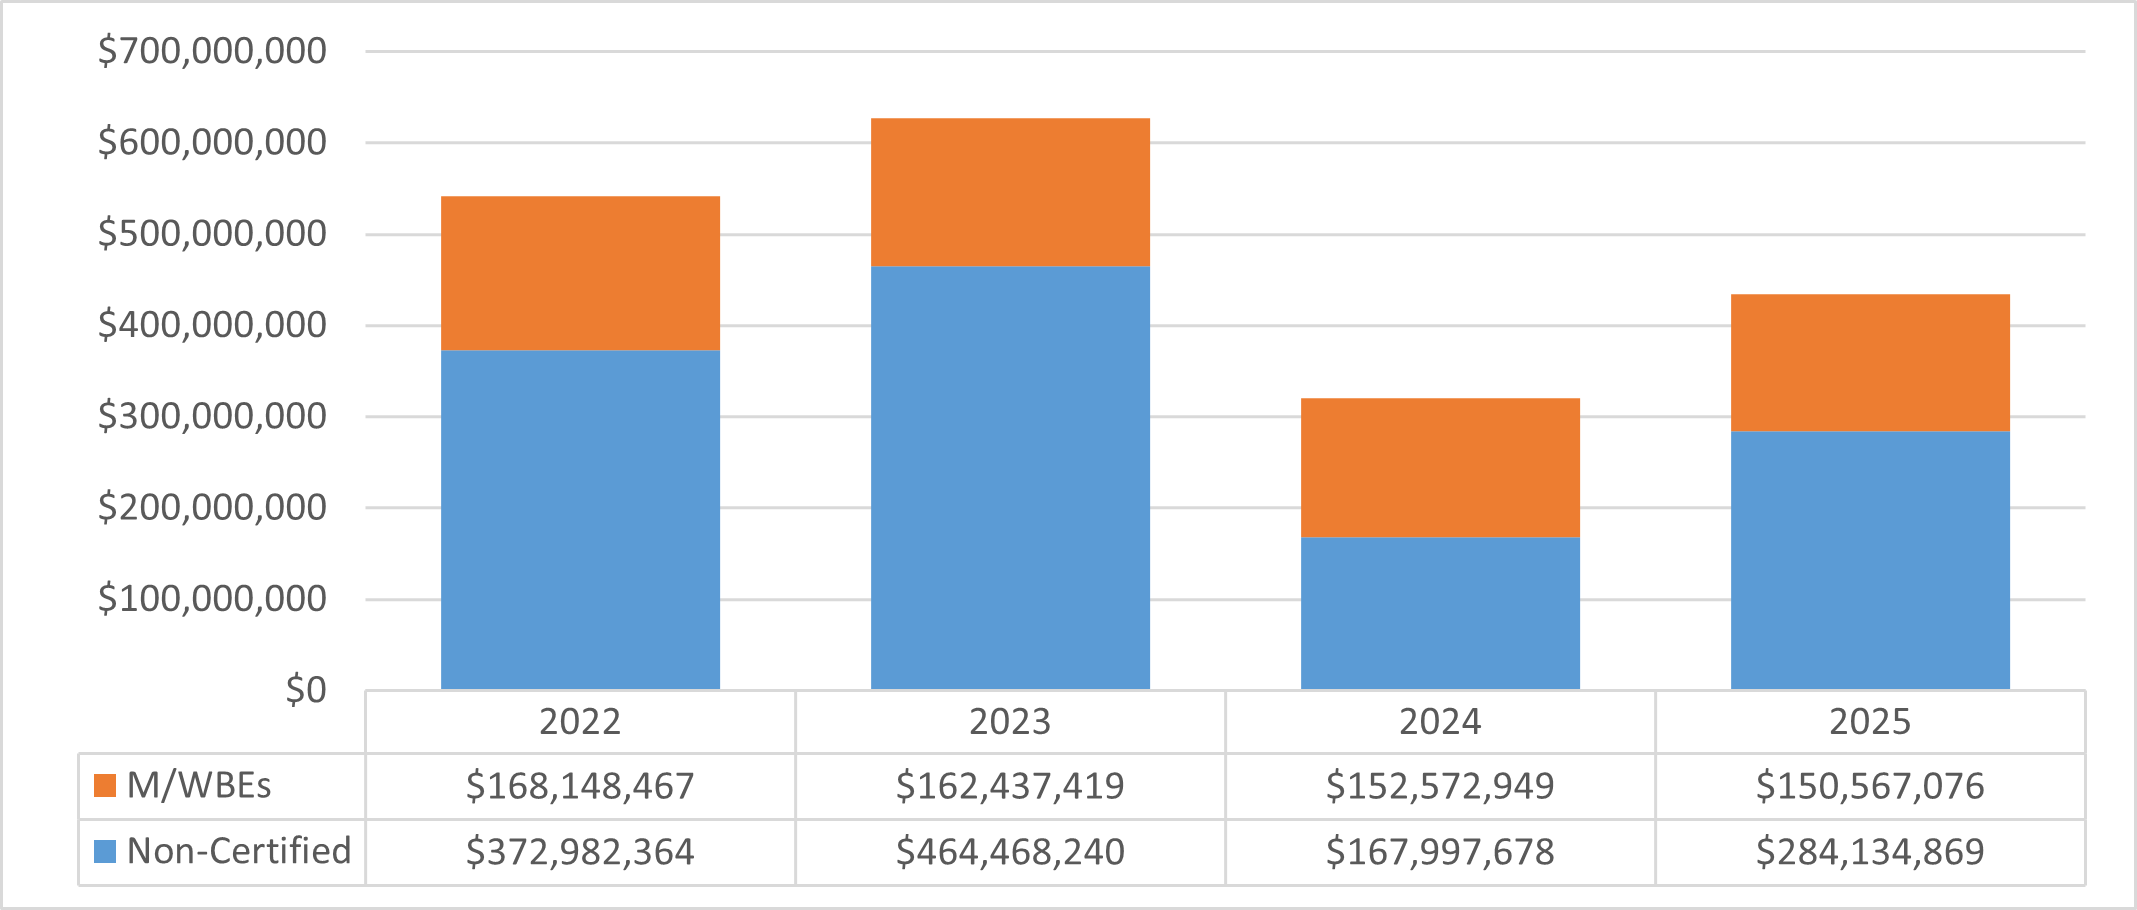
Chart 73: FY25 Value of LL 174-Eligible Contracts and POs, by Race and Gender
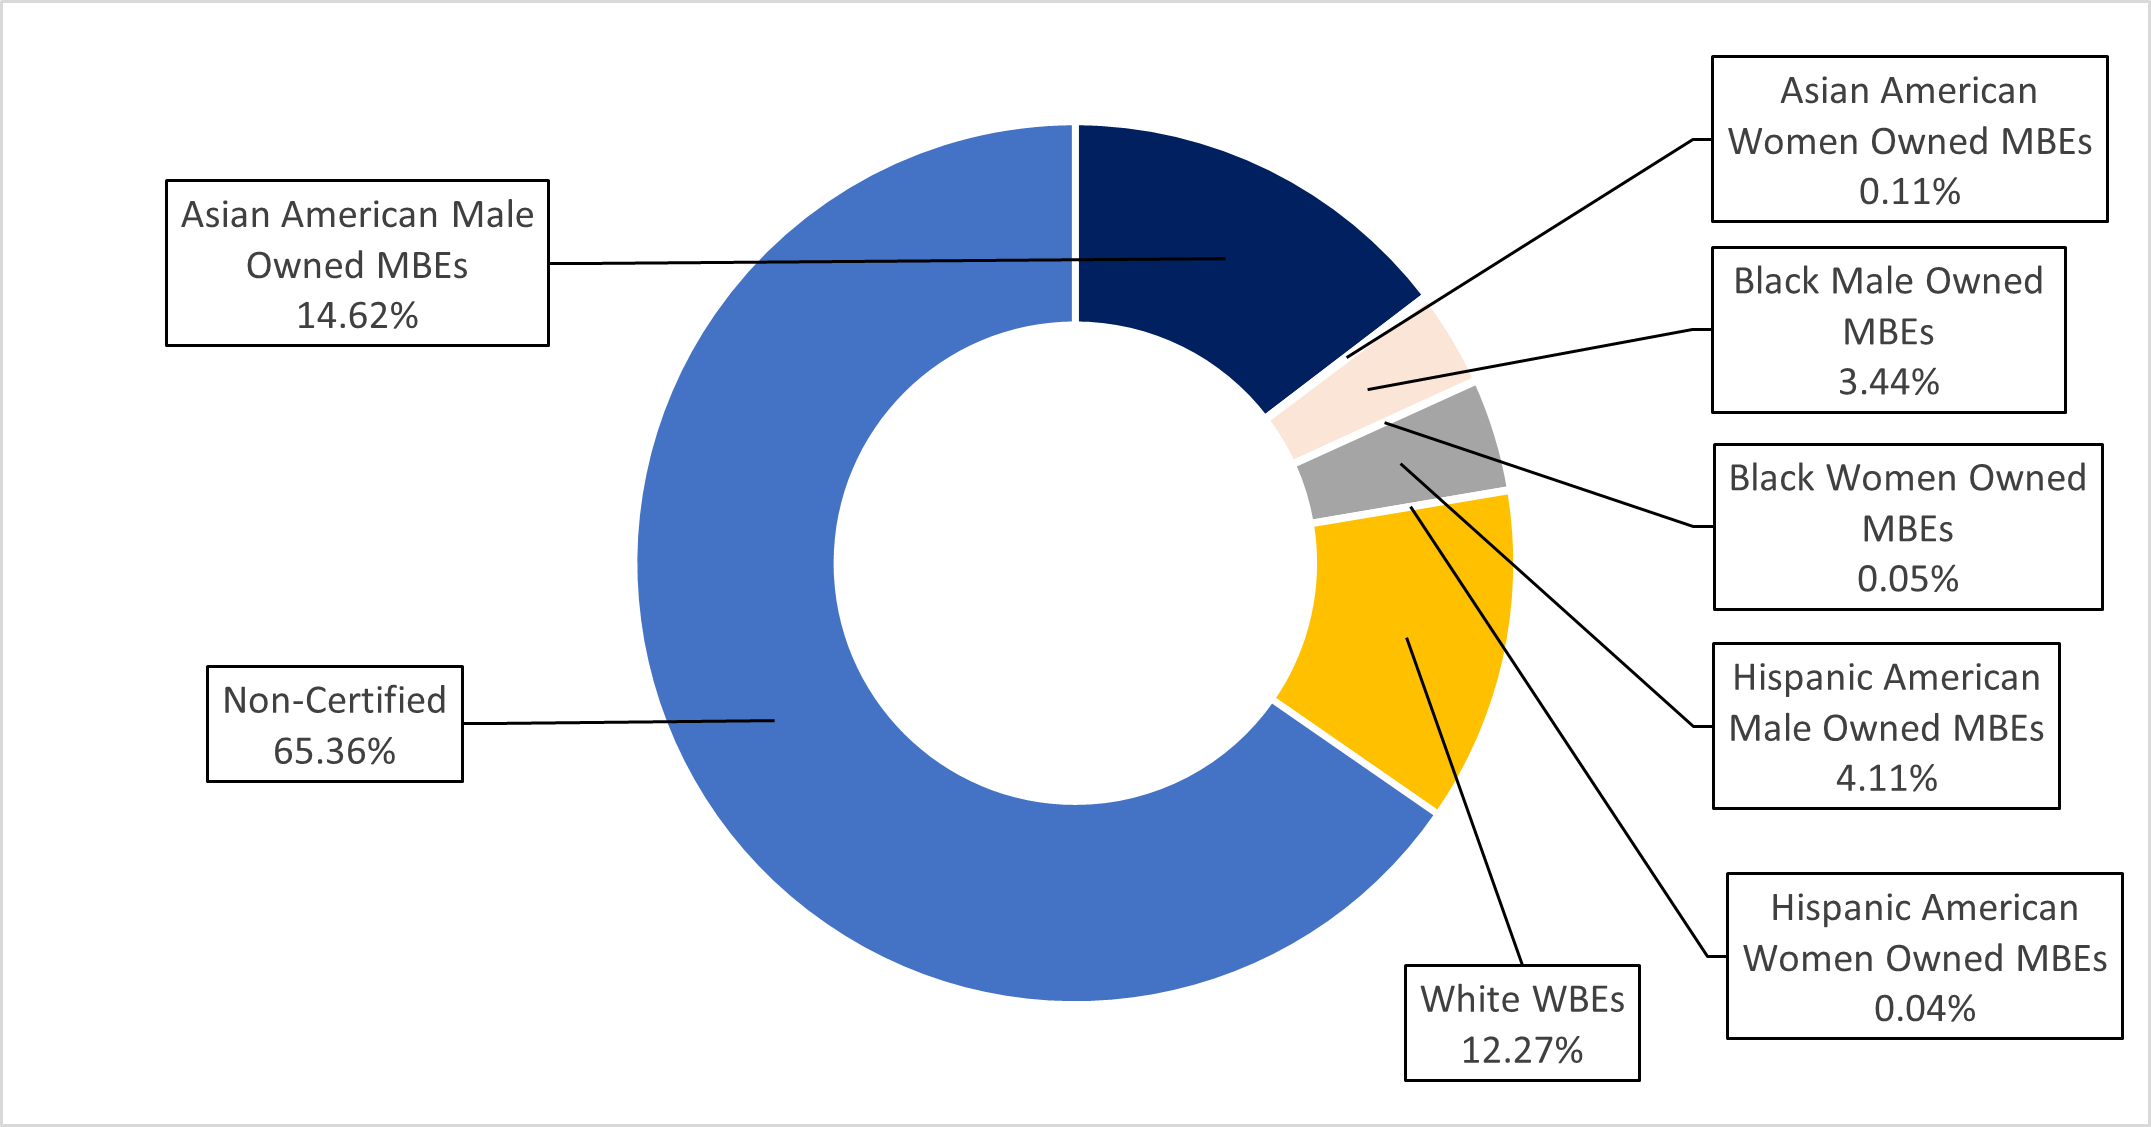
Chart 74: FY25 Share of LL 174-Eligible Contracts and PO Value, by M/WBE Category and Industry
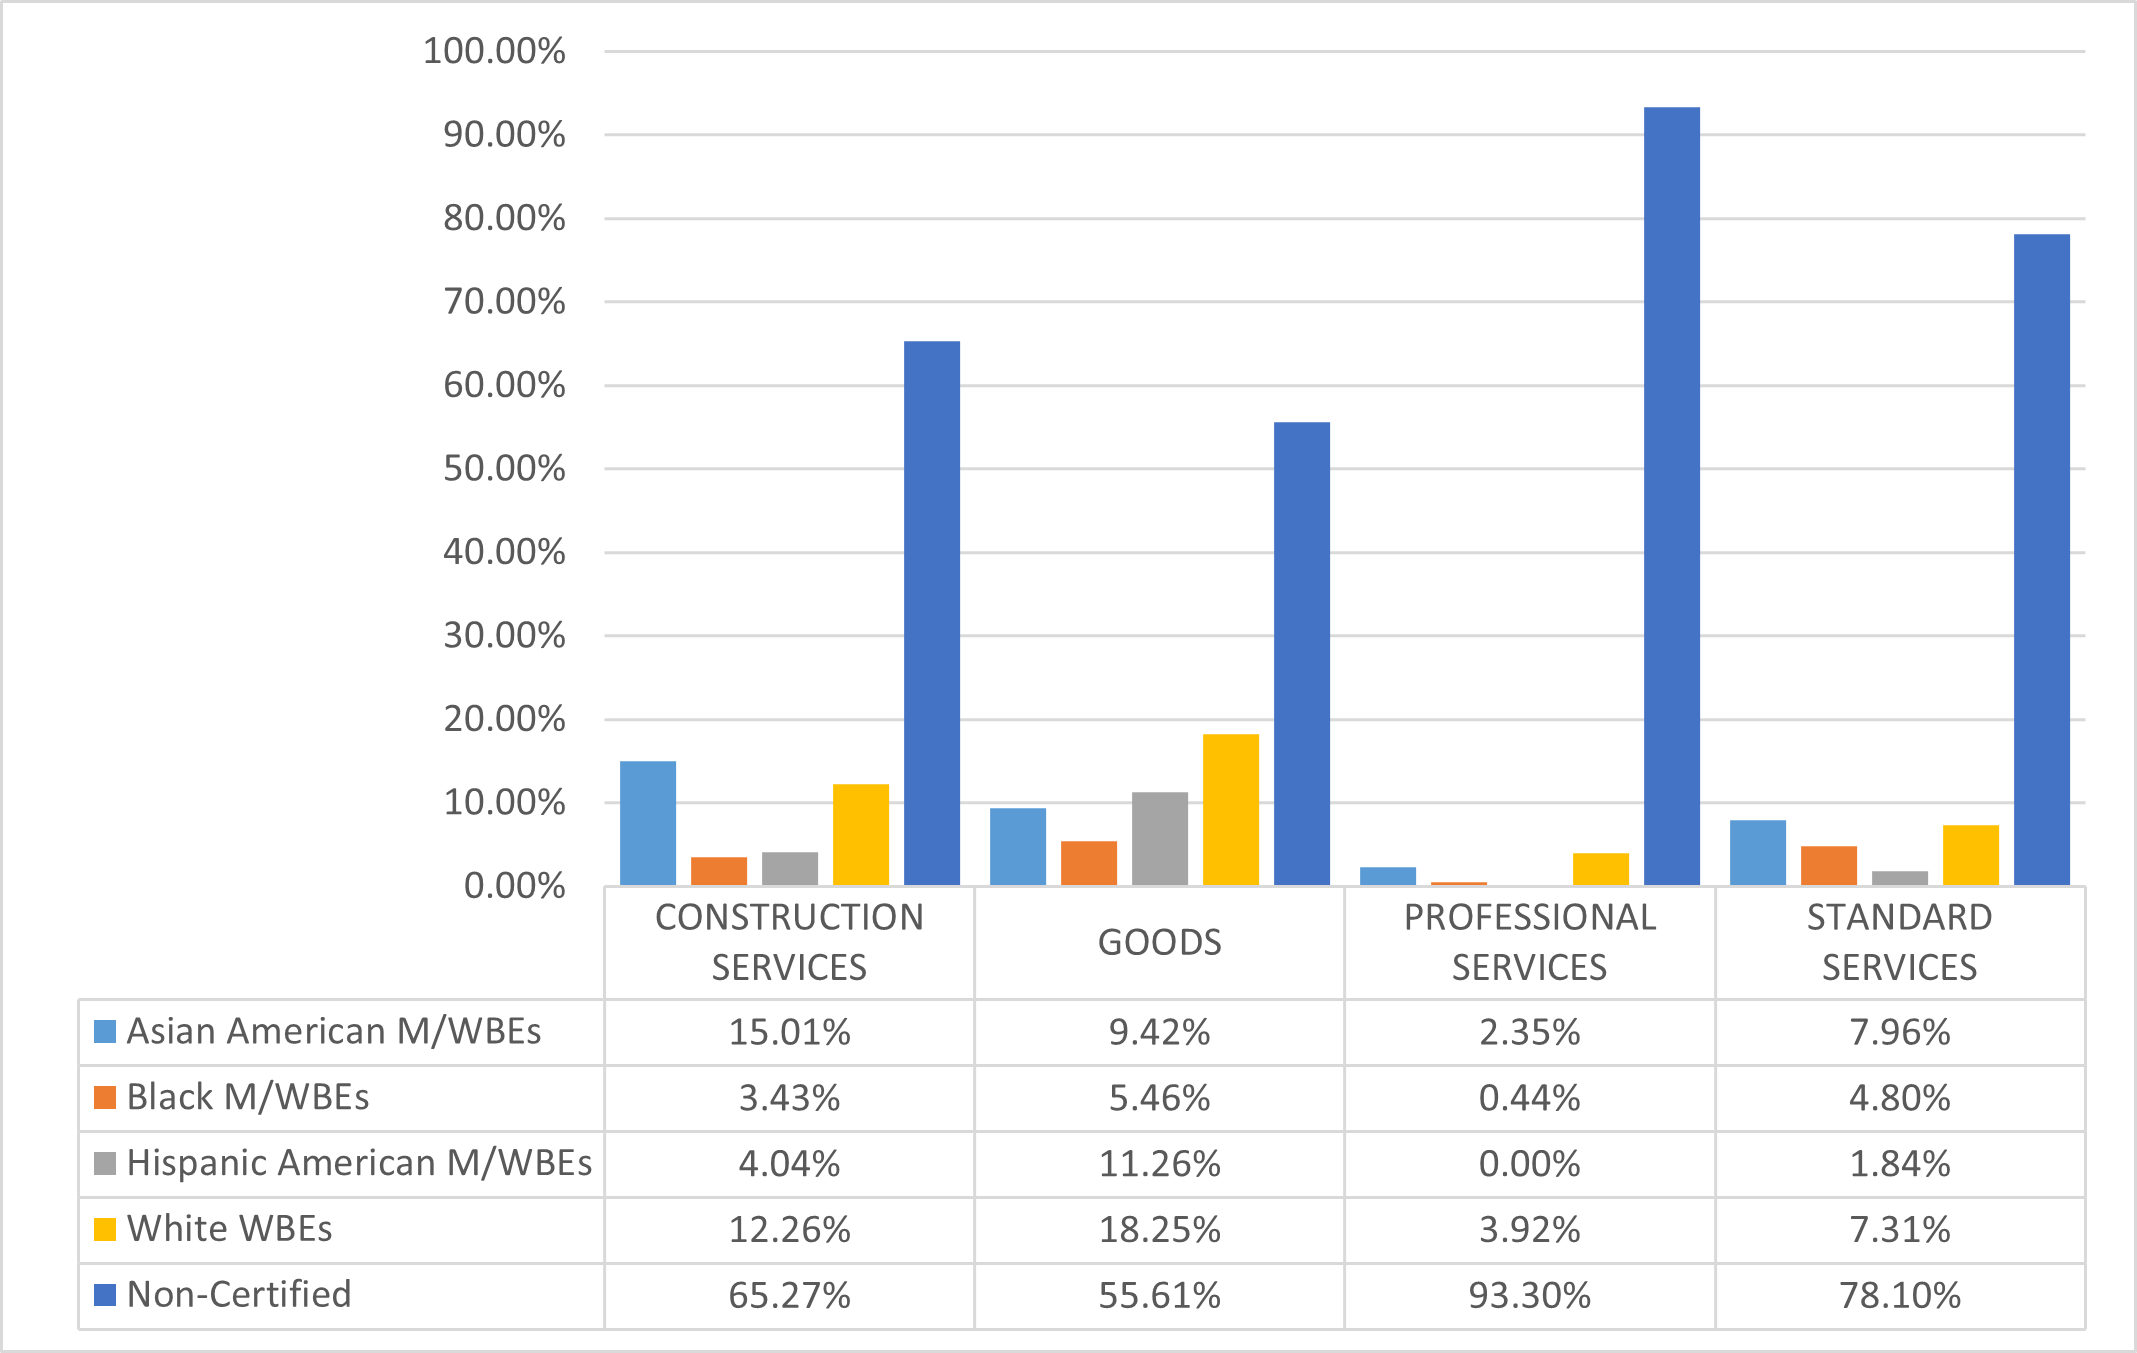
Department of Sanitation (DSNY)
About 20% of DSNY’s procurement portfolio was subject to LL 174 participation goals in FY25. The LL 174 value below does not include large Renewals, which were excluded from this analysis. DSNY’s $641.5 million in LL 174-eligible value accounts for about 0.2% of the City’s total LL 174-eligible procurement portfolio.
Table 61: FY25 LL 174-Eligible Contracts and POs
| Certification Status | # of Contracts | % Share of Contracts | Total Registered Contract Value | % Share of Contract Value |
|---|---|---|---|---|
| All Contracts and POs | 757 | 100.00% | $187,431,793 | 100.00% |
| M/WBE | 247 | 32.63% | $19,954,464 | 10.65% |
| Non-Certified | 510 | 67.37% | $167,477,329 | 89.35% |
| LL174 Contracts and POs | 699 | 100.00% | $41,555,789 | 100.00% |
| M/WBE | 241 | 34.48% | $16,923,253 | 40.72% |
| Non-Certified | 458 | 65.52% | $24,632,536 | 59.28% |
| LL174 Subcontracts | 16 | 100.00% | $4,179,546 | 100.00% |
| M/WBE | 7 | 43.75% | $2,142,046 | 51.25% |
| Non-Certified | 9 | 56.25% | $2,037,500 | 48.75% |
Chart 75: FY22-25 Value of LL 174-Eligible Prime Contracts and POs
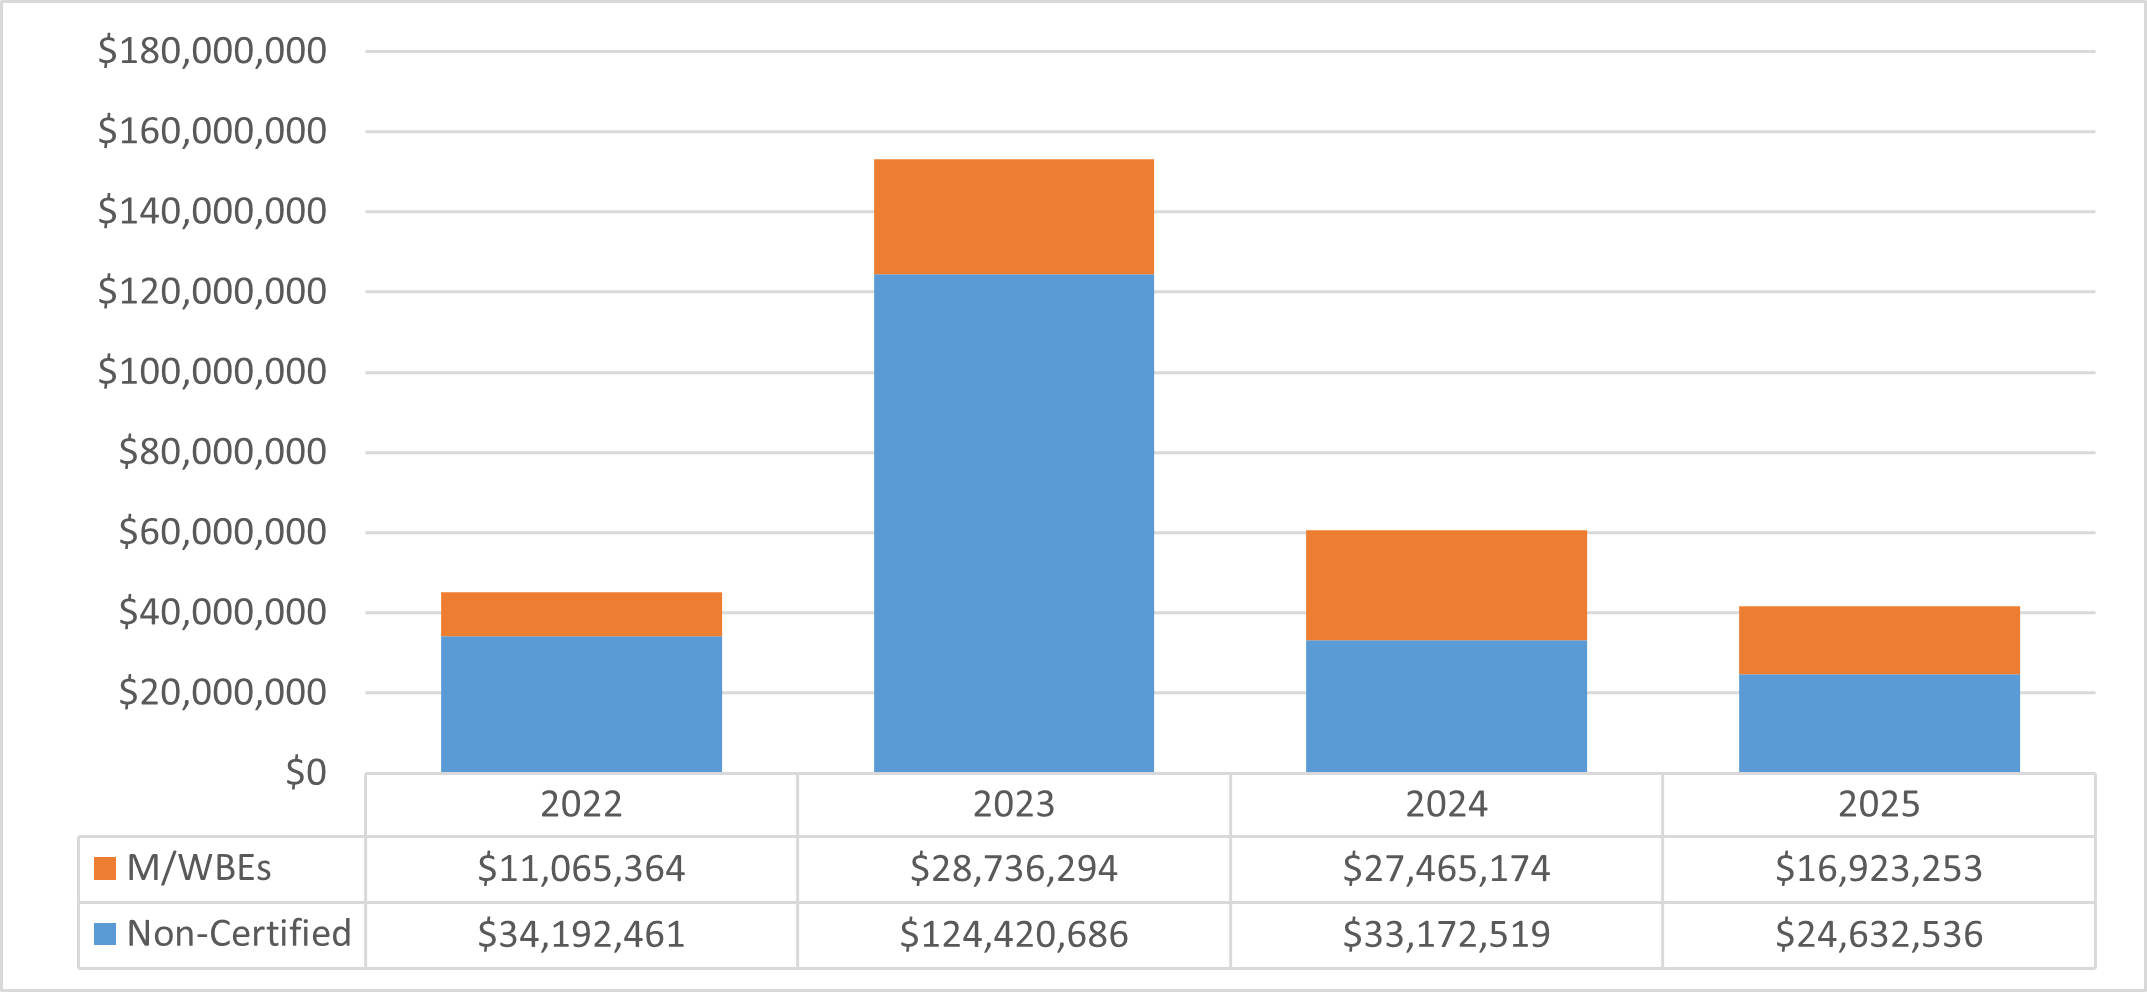
Chart 76: FY25 Value of LL 174-Eligible Contracts and POs, by Race and Gender
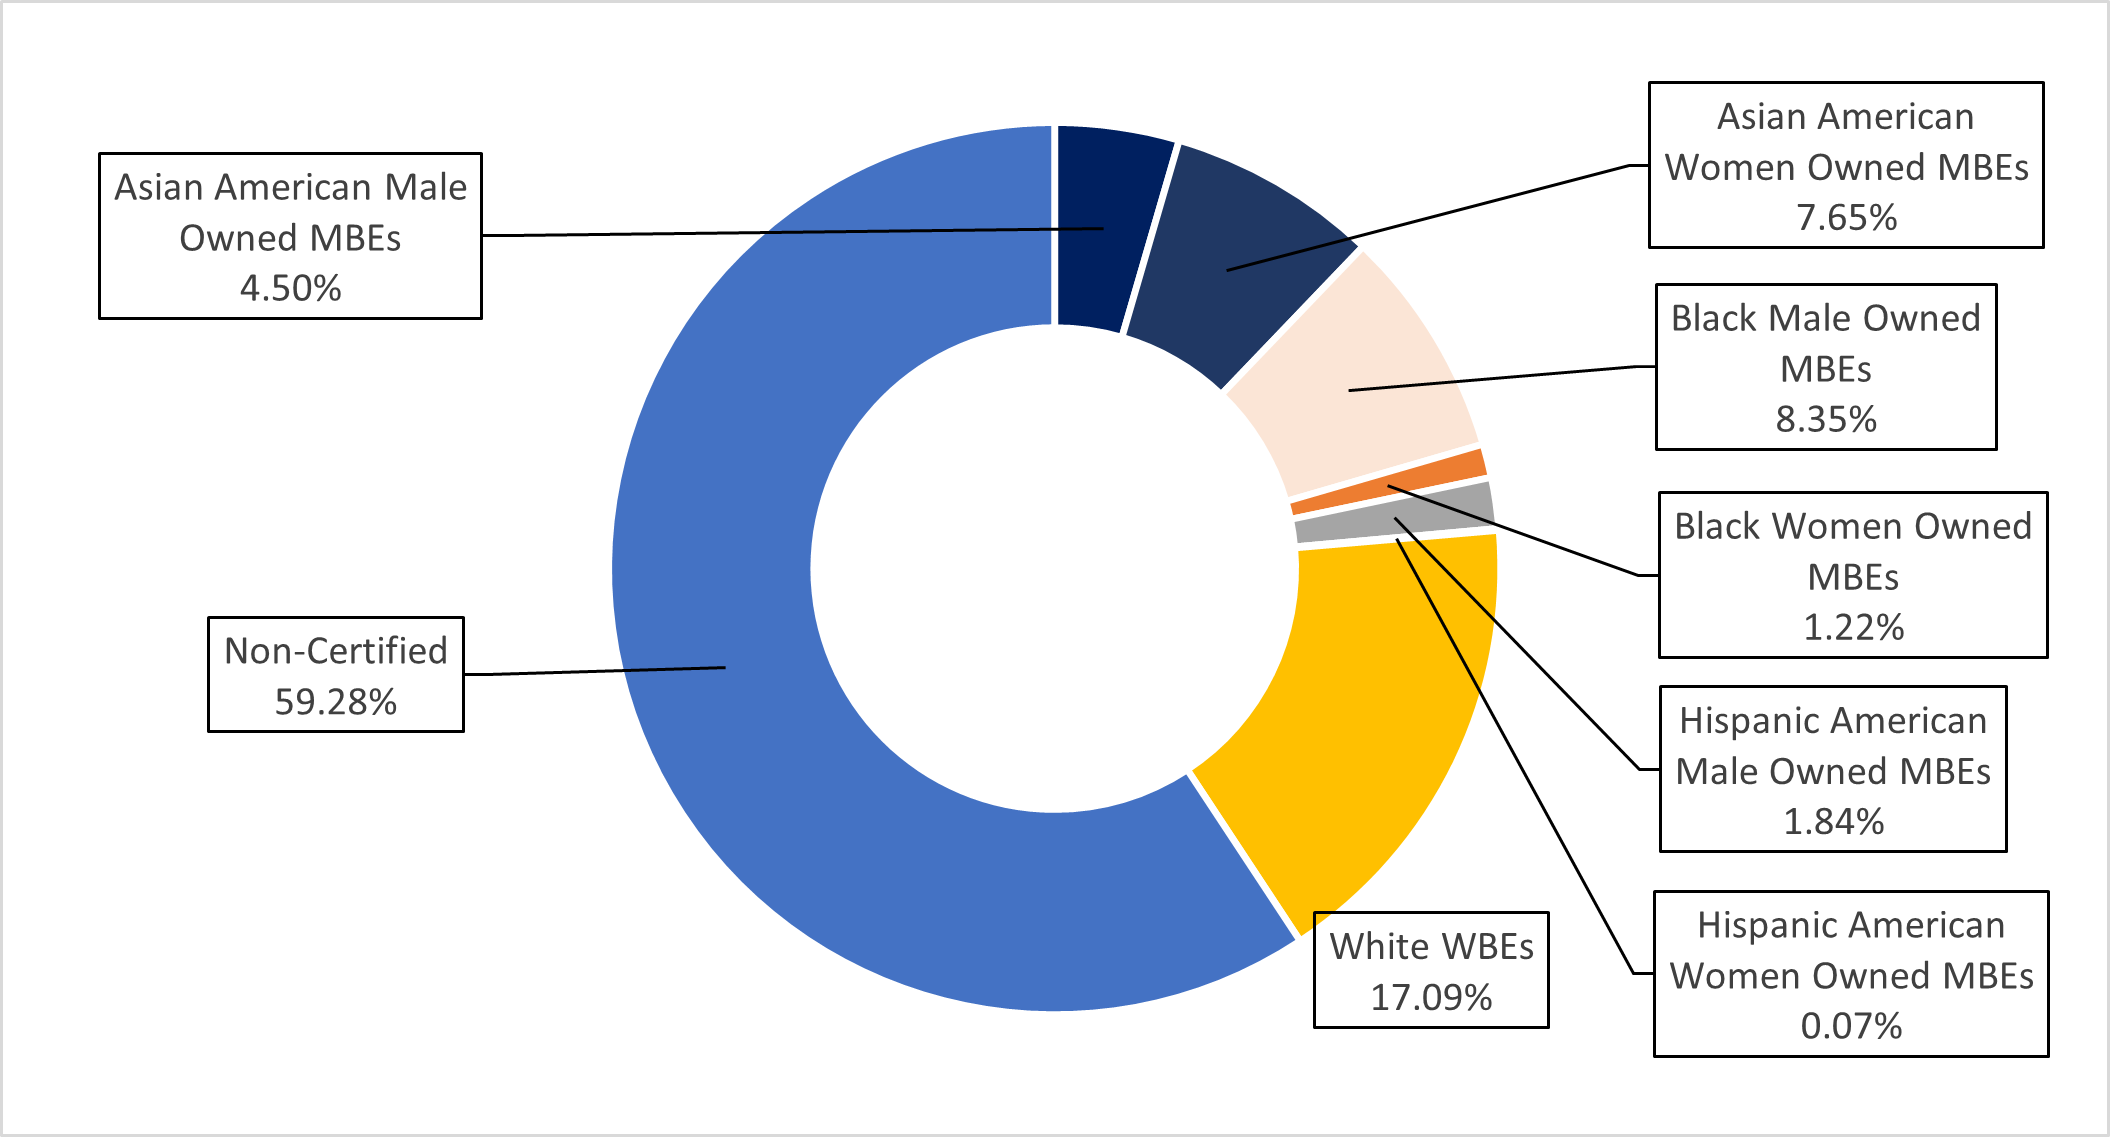
Chart 77: FY25 Share of LL 174-Eligible Contracts and PO Value, by M/WBE Category and Industry
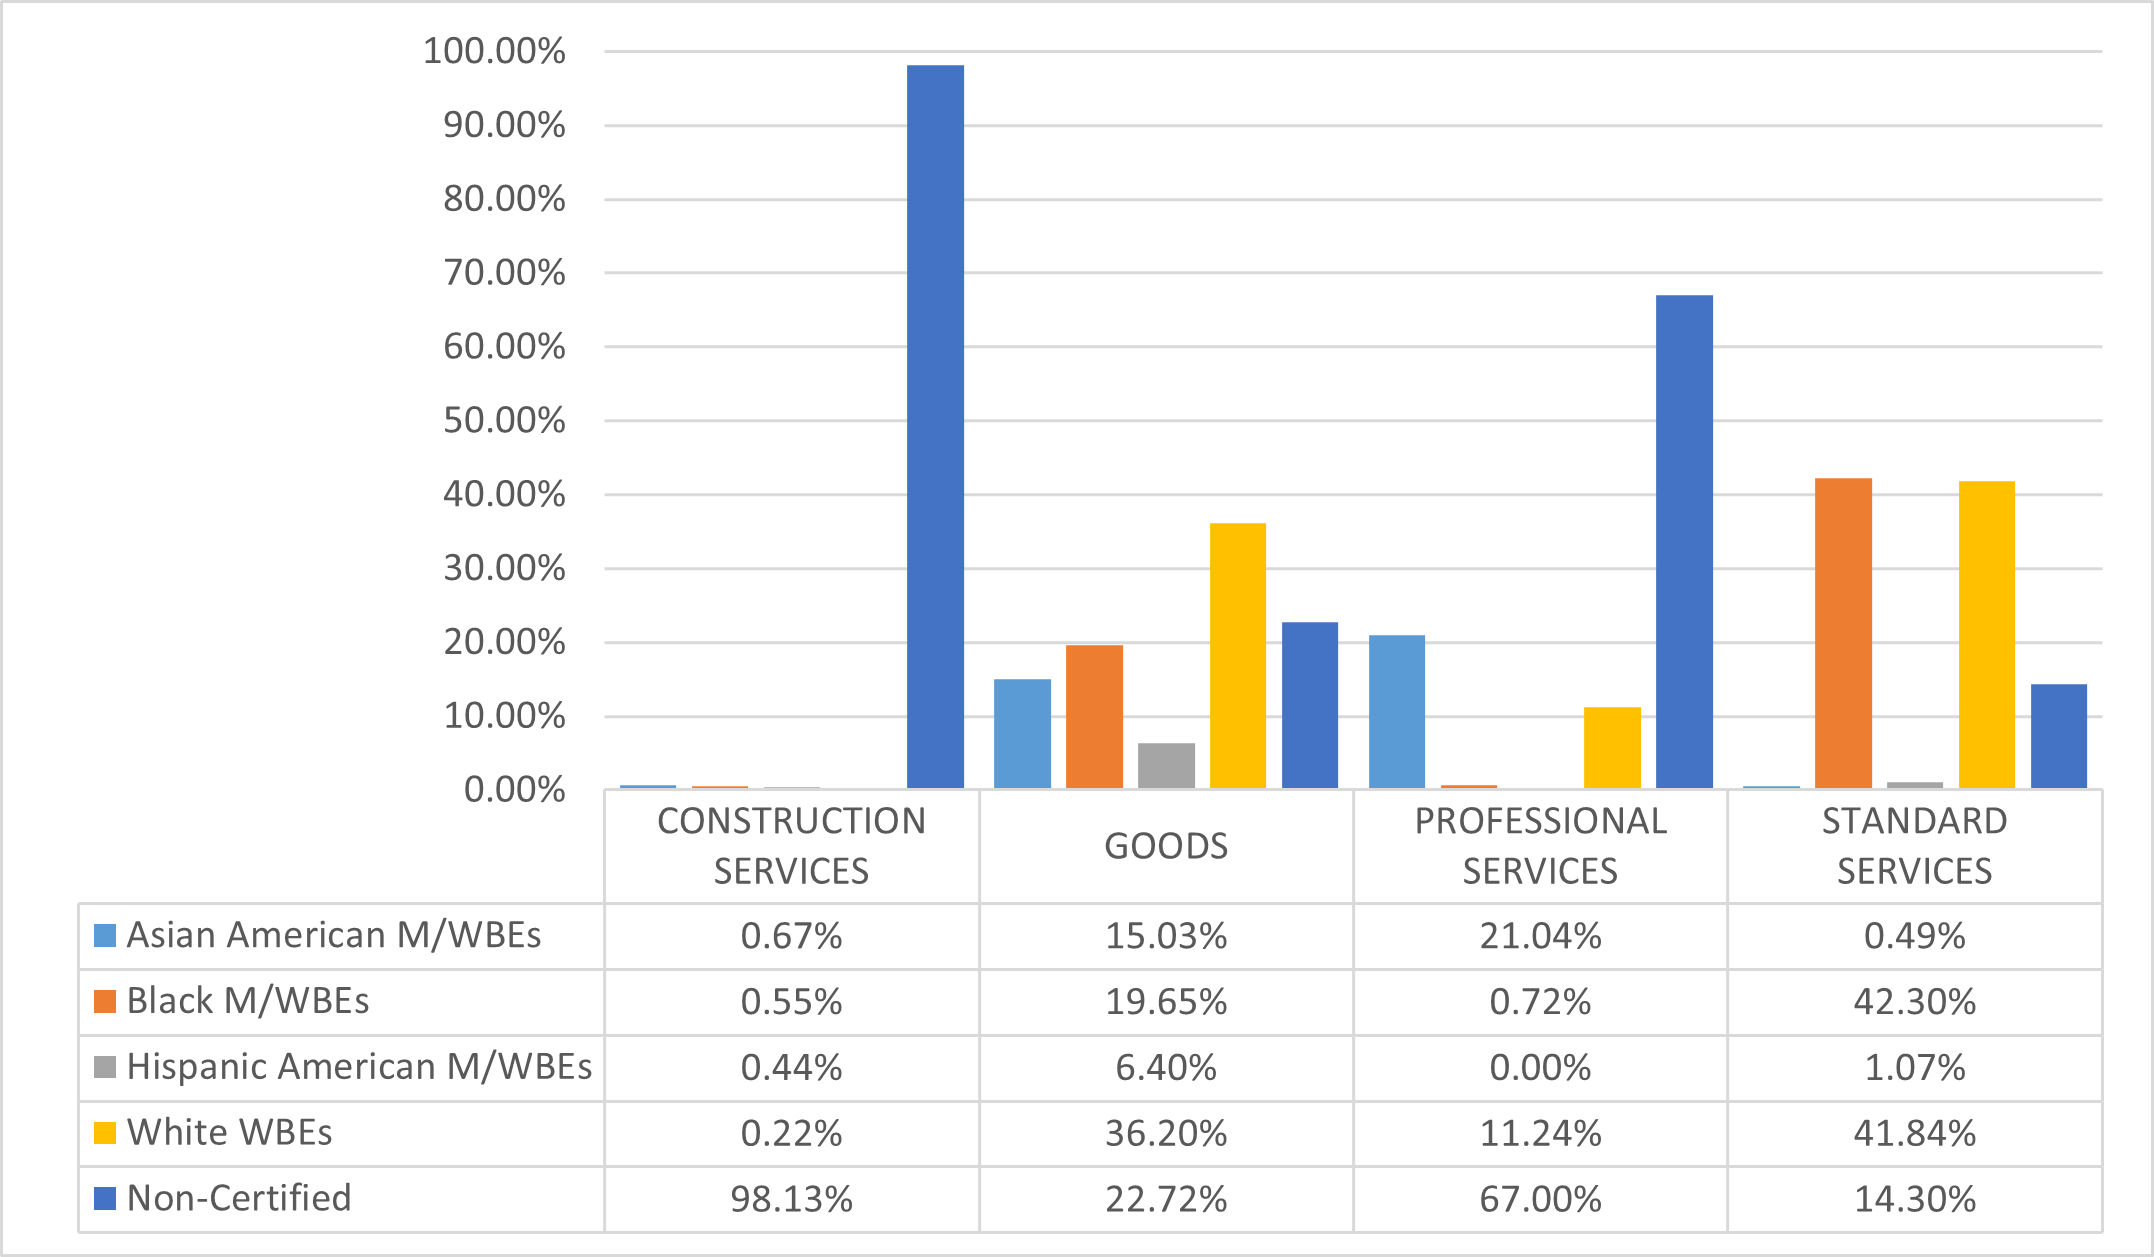
Department of Homeless Services (DSS/DHS)
The LL 174 totals below represent a very small share of DHS’ total procurement portfolio, as DHS predominantly contracts with vendors for human services, which are exempt from LL 174 participation goals. Its $18.7 million in LL 174-eligible value accounts for 1% of the City’s total LL 174-eligible portfolio.
Table 62: FY25 LL 174-Eligible Contracts and POs
| Certification Status | # of Contracts | % Share of Contracts | Total Registered Contract Value | % Share of Contract Value |
|---|---|---|---|---|
| All Contracts and POs | 204 | 100.00% | $5,328,573,239 | 100.00% |
| M/WBE | 49 | 24.02% | $50,008,963 | 0.94% |
| Non-Certified | 155 | 75.98% | $5,278,564,276 | 99.06% |
| LL174 Contracts and POs | 59 | 100.00% | $18,757,579 | 100.00% |
| M/WBE | 37 | 62.71% | $11,246,269 | 59.96% |
| Non-Certified | 22 | 37.29% | $7,511,310 | 40.04% |
| LL174 Subcontracts | 2 | 100.00% | $580,100 | 100.00% |
| M/WBE | 1 | 50.00% | $400,000 | 68.95% |
| Non-Certified | 1 | 50.00% | $180,100 | 31.05% |
Chart 78: FY22-25 Value of LL 174-Eligible Prime Contracts and POs
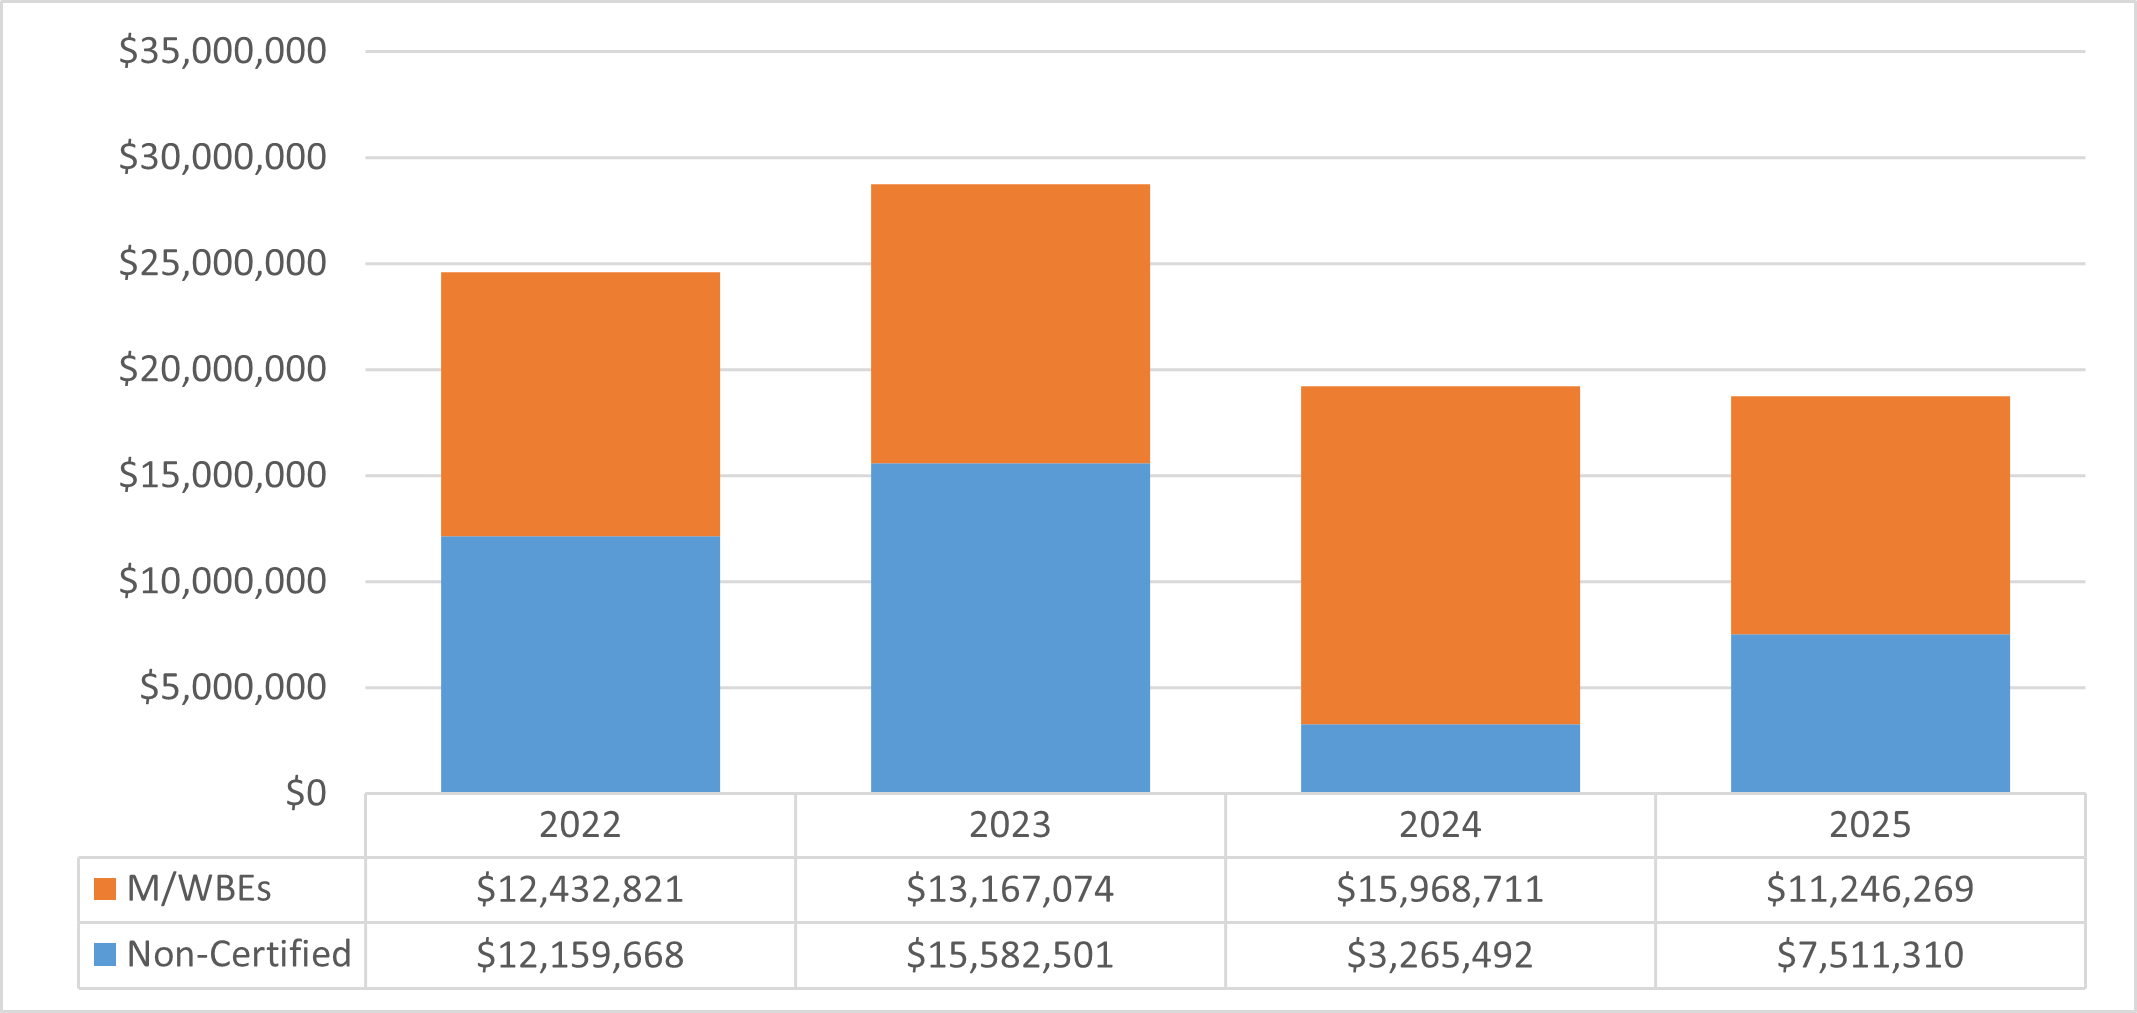
Chart 79: FY25 Value of LL 174-Eligible Contracts and POs, by Race and Gender
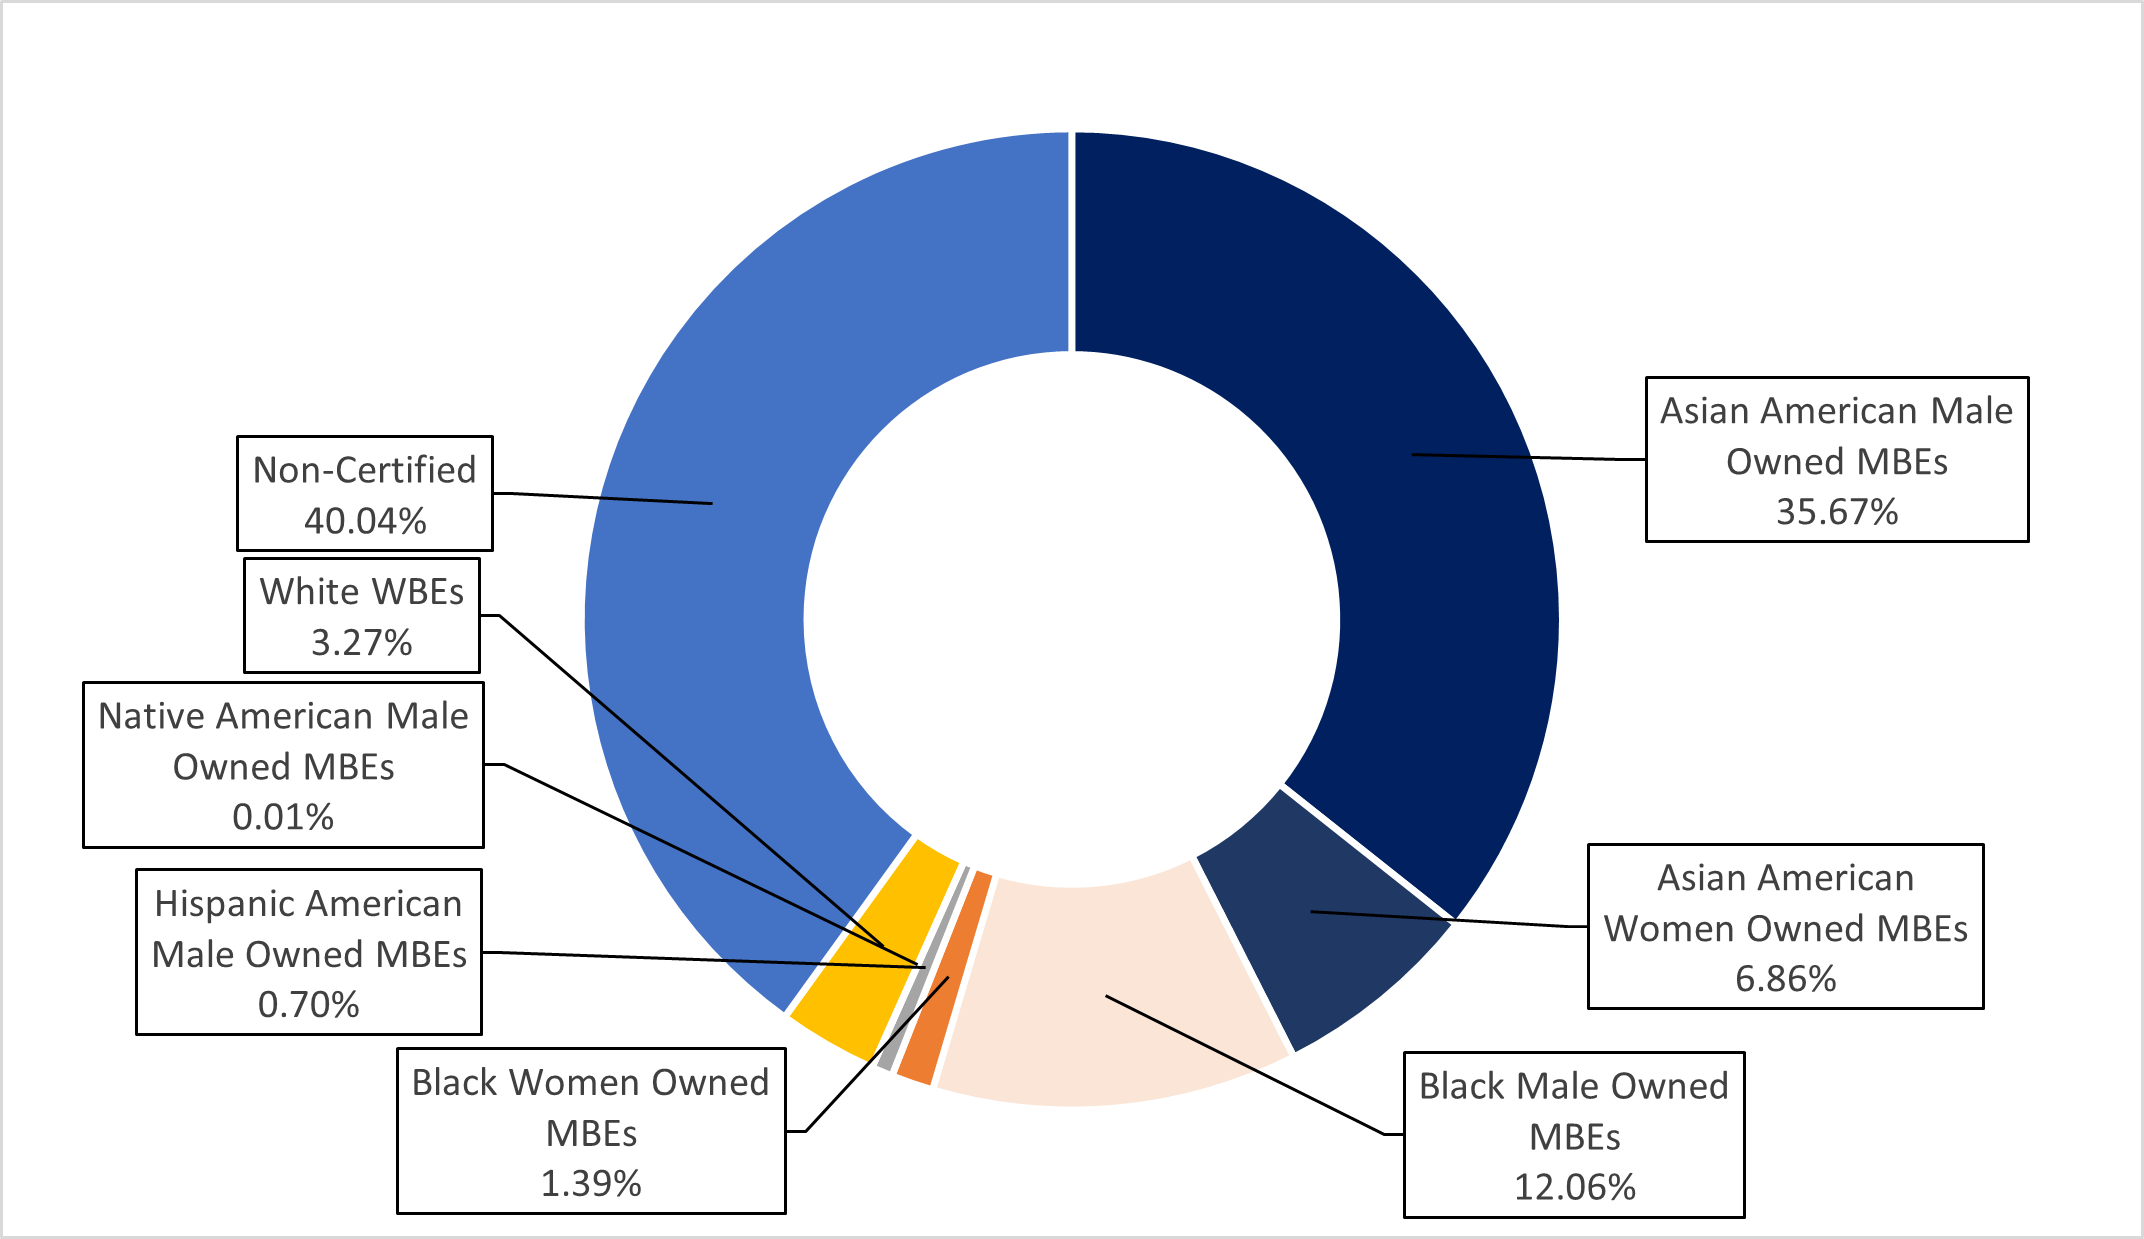
Chart 80: FY25 Share of LL 174-Eligible Contracts and PO Value, by M/WBE Category and Industry
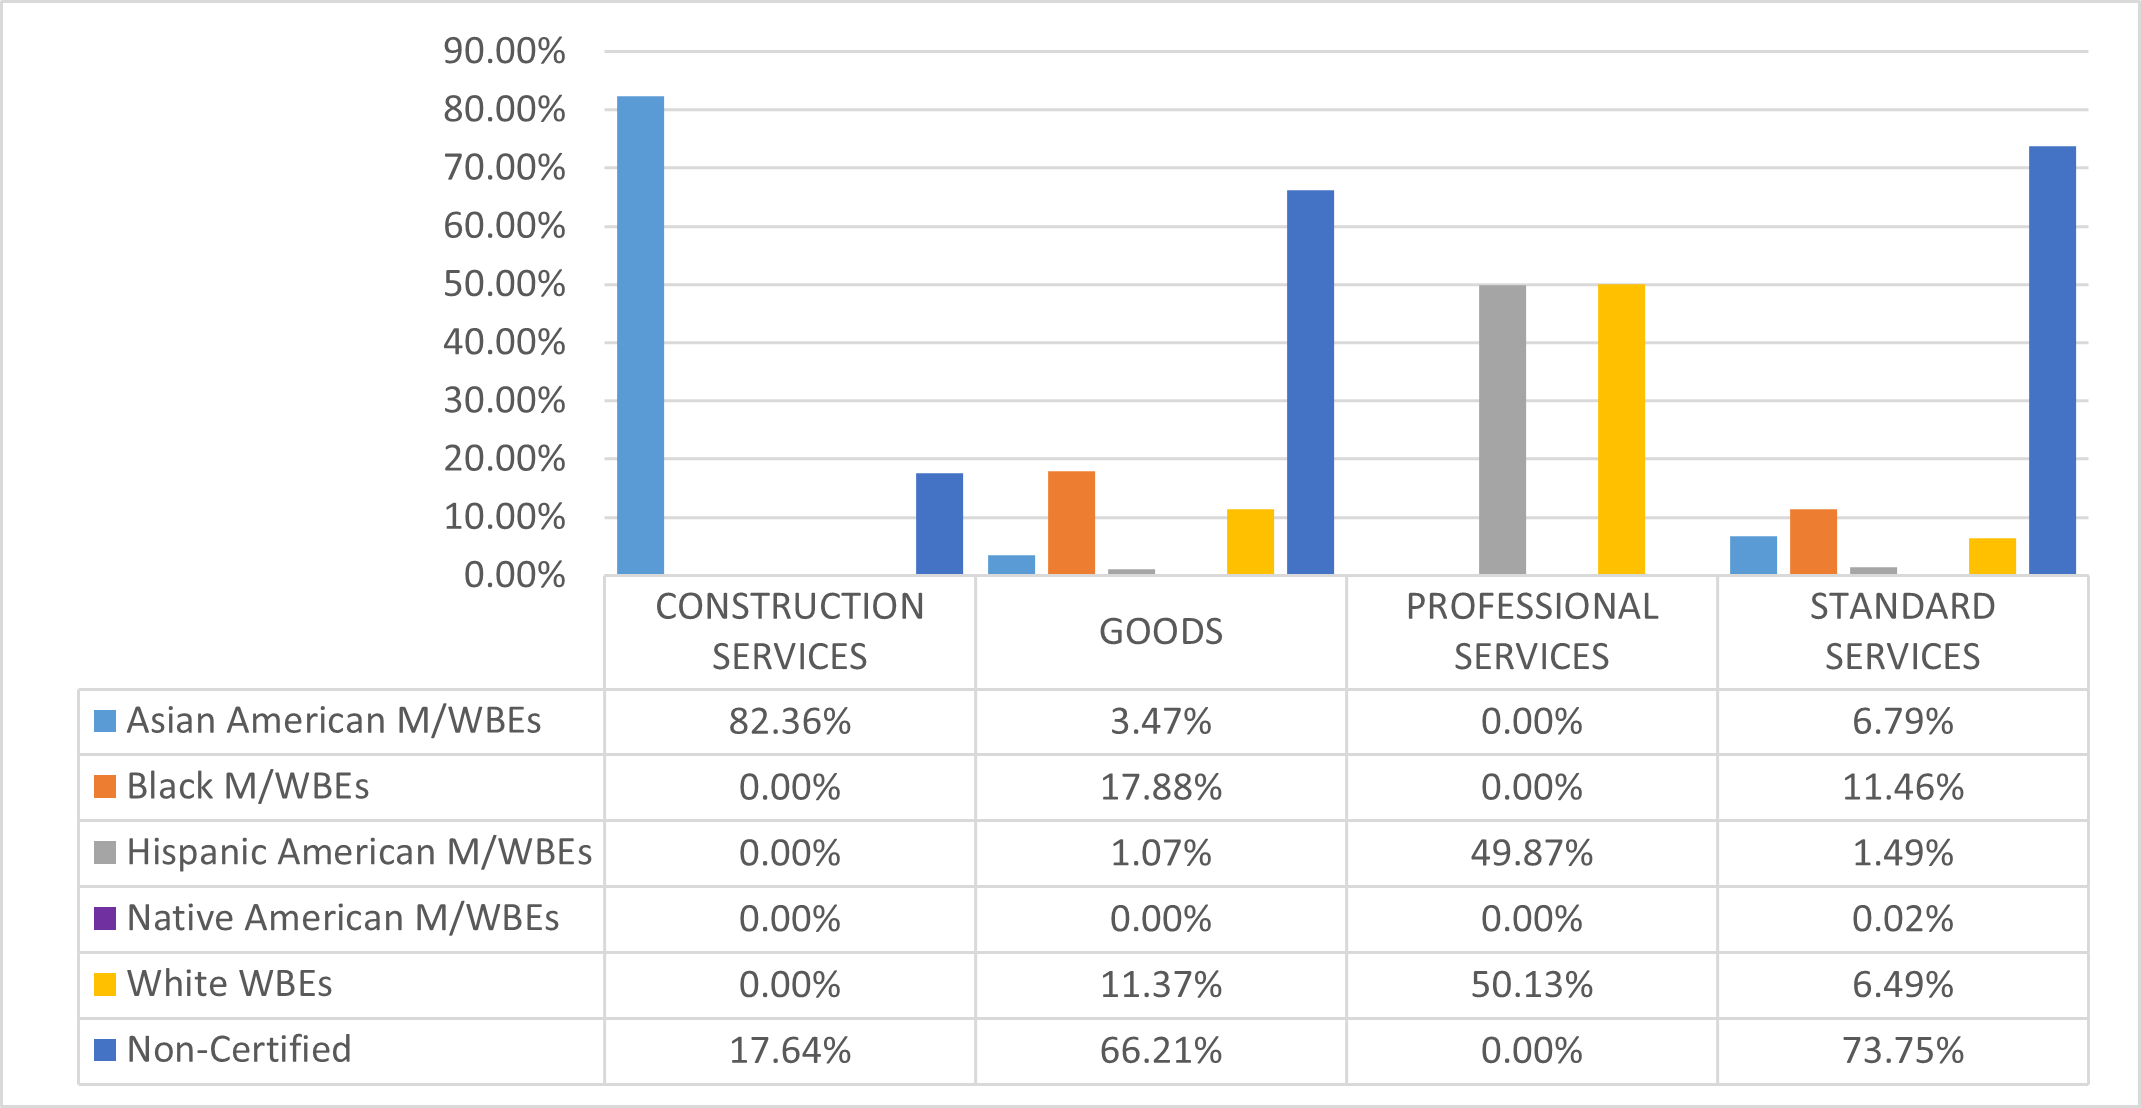
Human Resources Administration (DSS/HRA)
The LL 174 totals below represent a small share of HRA’s total procurement portfolio, as HRA predominantly contracts with vendors for human services, which are exempt from LL 174 participation goals. Its $13 million in LL 174-eligible value accounts for 0.07% of the City’s total LL 174-eligible contracting portfolio.
Table 63: FY25 LL 174-Eligible Contracts and POs
| Certification Status | # of Contracts | % Share of Contracts | Total Registered Contract Value | % Share of Contract Value |
|---|---|---|---|---|
| All Contracts and POs | 611 | 100.00% | $3,514,848,503 | 100.00% |
| M/WBE | 228 | 37.32% | $62,962,170 | 1.79% |
| Non-Certified | 383 | 62.68% | $3,451,886,333 | 98.21% |
| LL174 Contracts and POs | 260 | 100.00% | $13,049,523 | 100.00% |
| M/WBE | 183 | 70.38% | $12,219,692 | 93.64% |
| Non-Certified | 77 | 29.62% | $829,831 | 6.36% |
| LL174 Subcontracts | 0 | 0.00% | $0 | 0.00% |
| M/WBE | 0 | 0.00% | $0 | 0.00% |
| Non-Certified | 0 | 0.00% | $0 | 0.00% |
Chart 81: FY22-25 Value of LL 174-Eligible Prime Contracts and POs
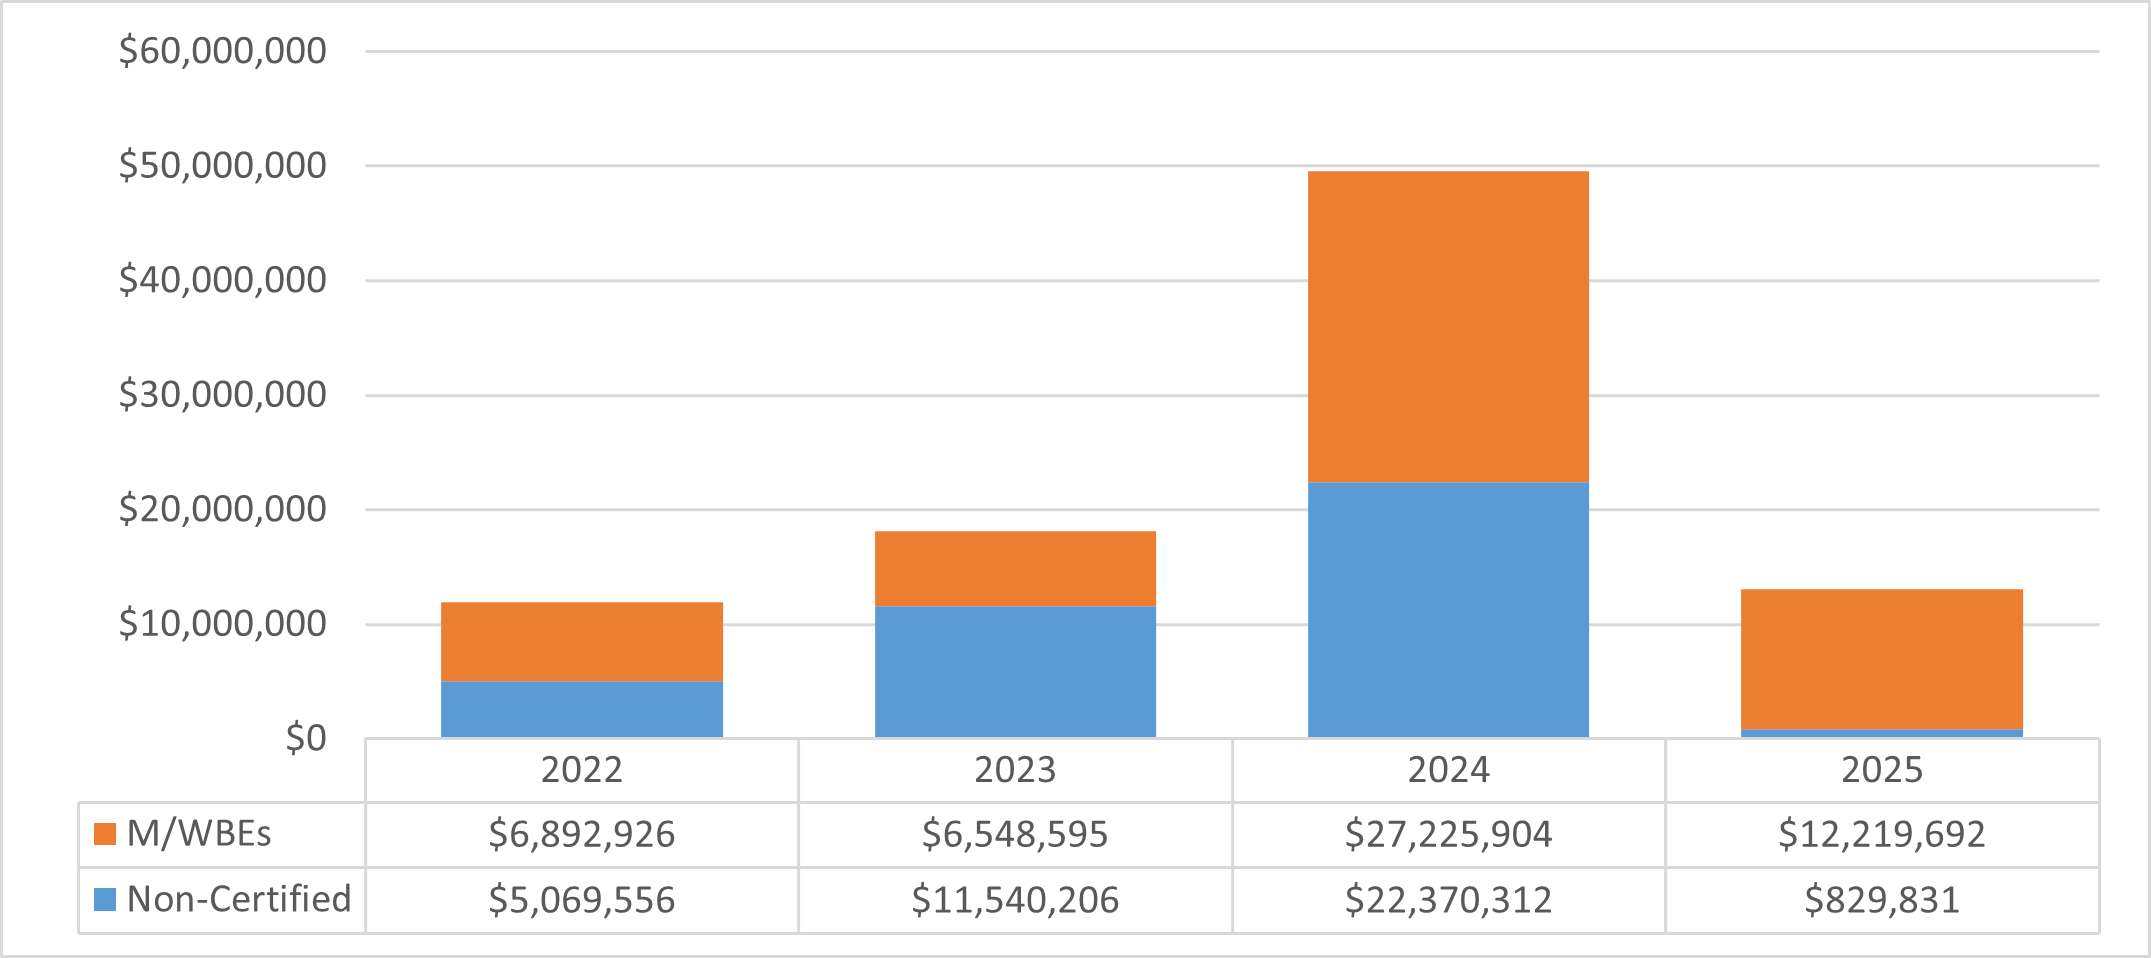
Chart 82: FY25 Value of LL 174-Eligible Contracts and POs, by Race and Gender
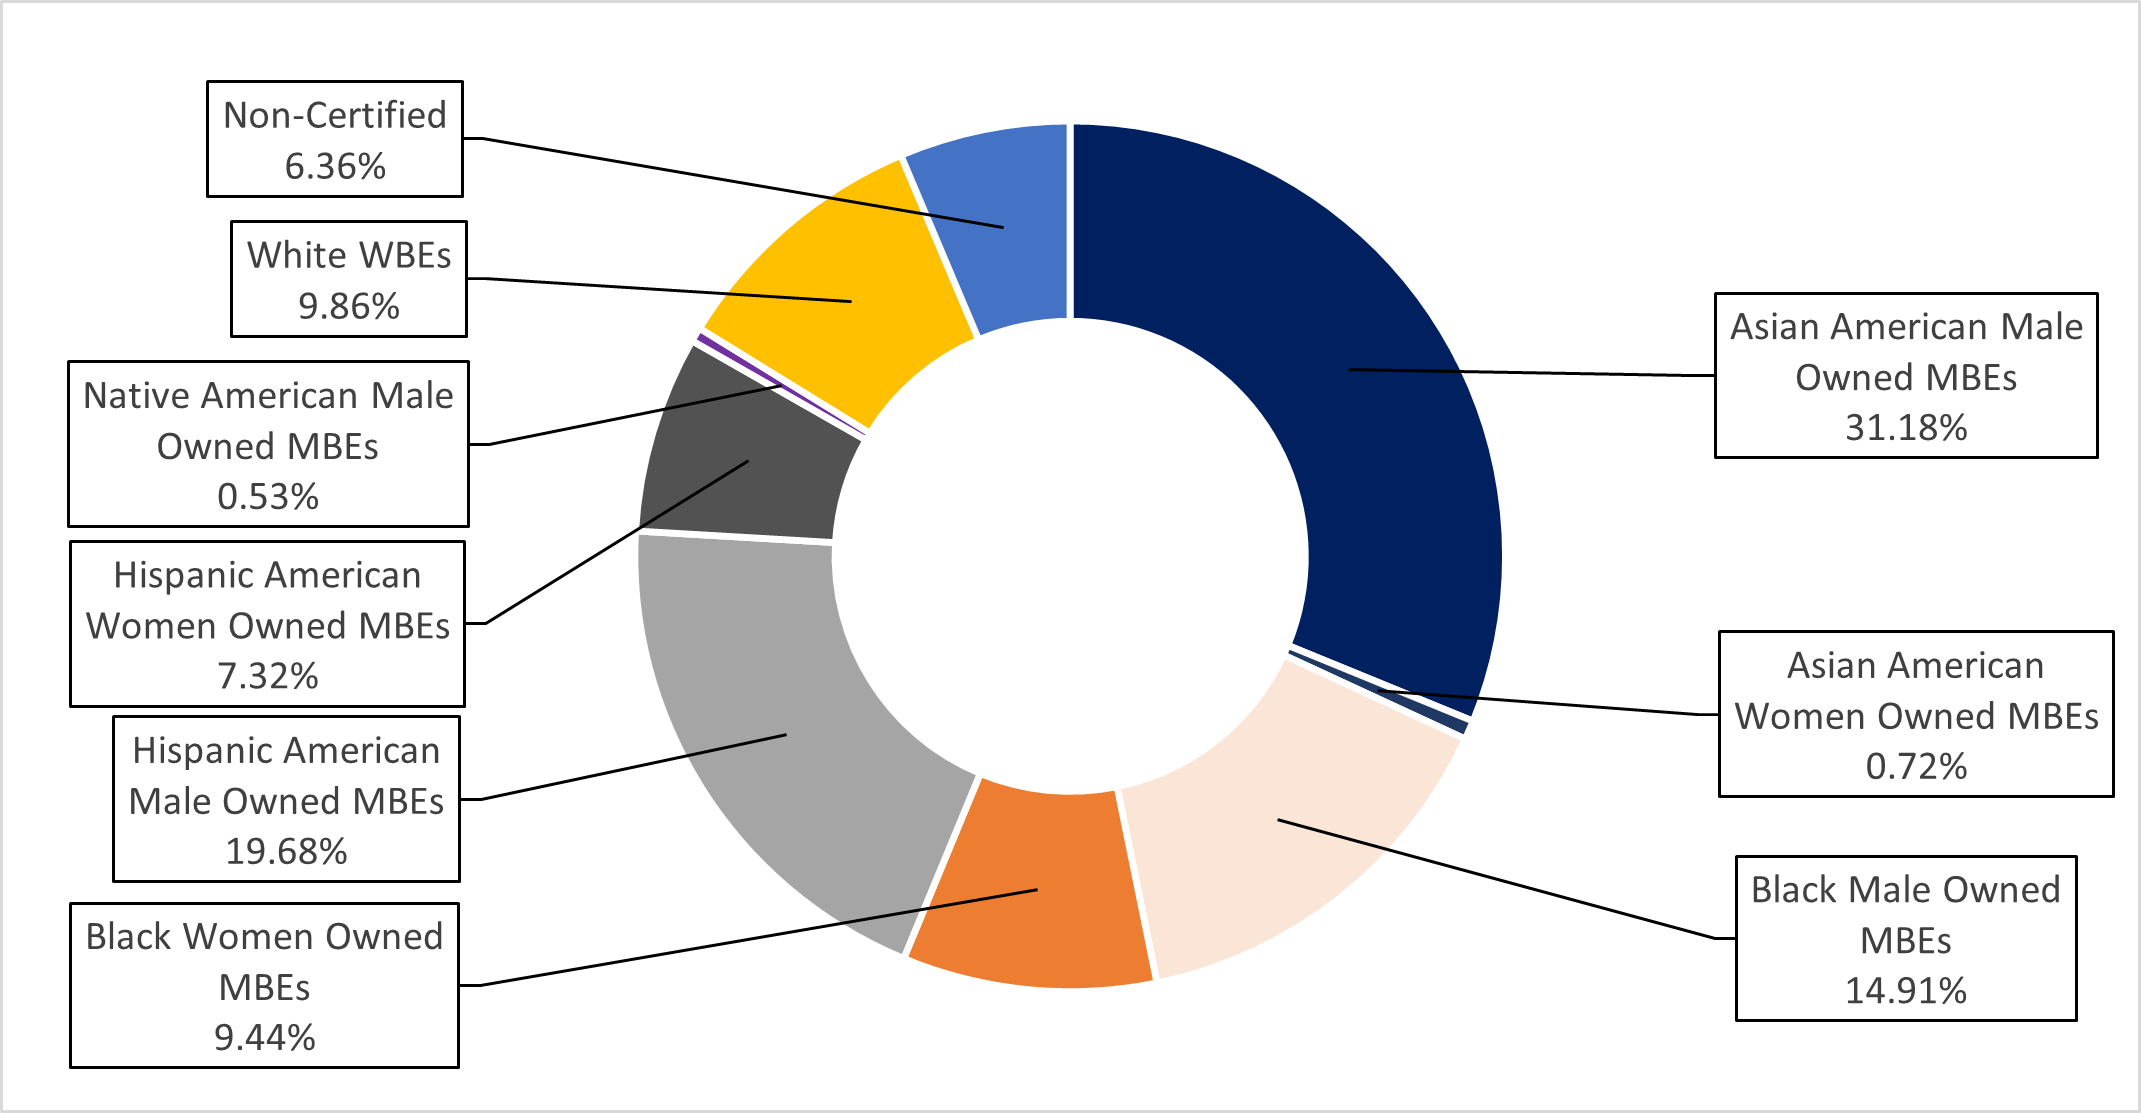
Chart 83: FY25 Share of LL 174-Eligible Contracts and PO Value, by M/WBE Category and Industry
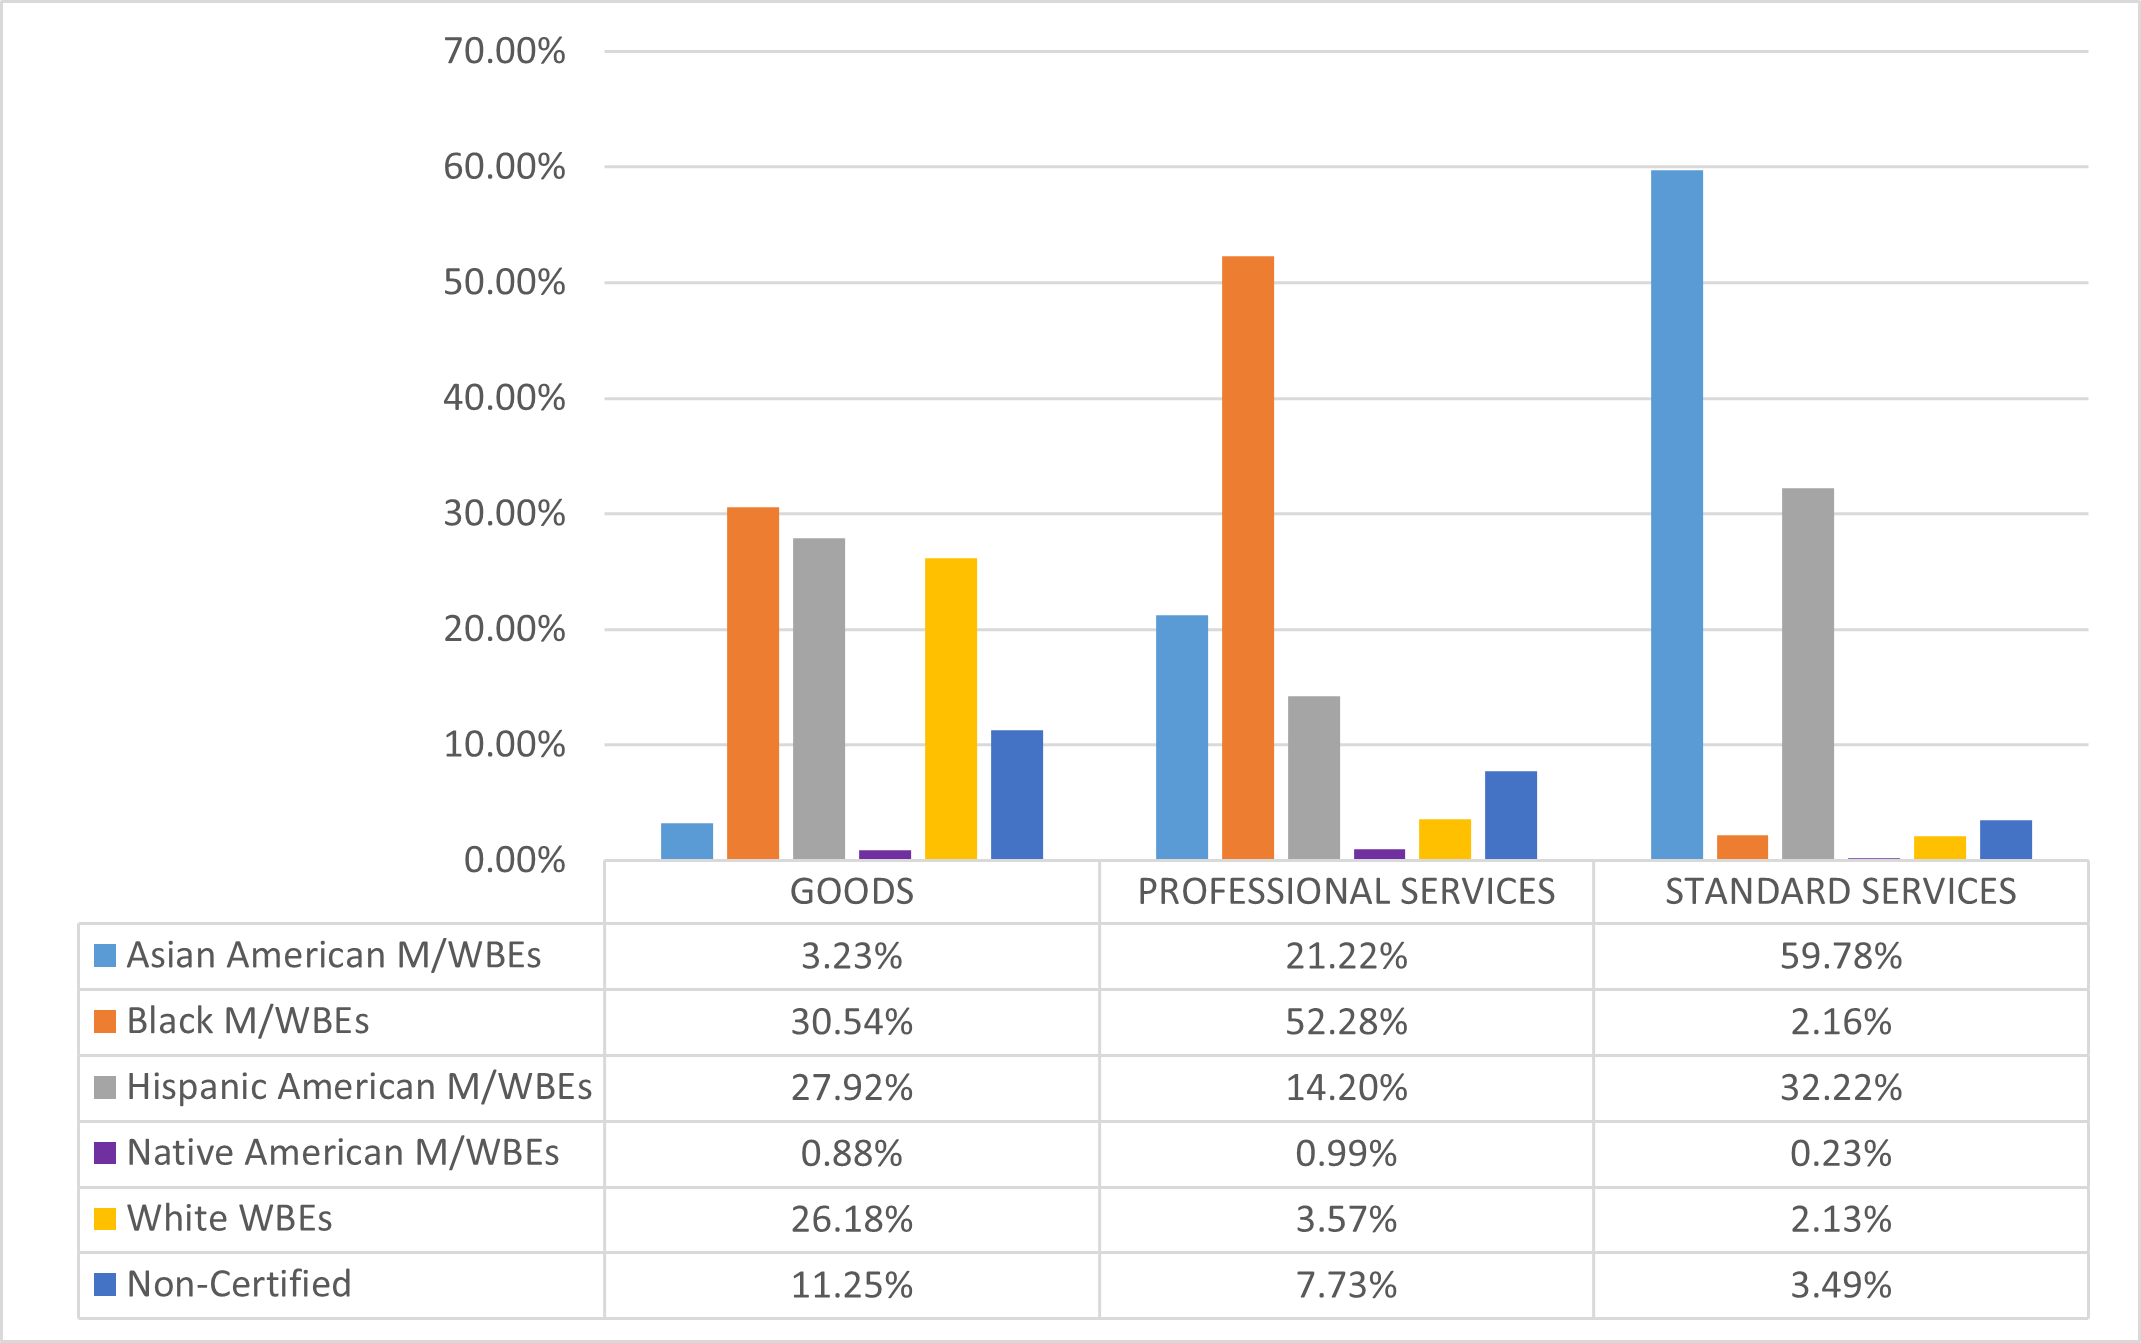
Department of Youth and Community Development (DYCD)
The LL 174 totals below represent a very small portion of DYCD’s total procurement portfolio, as DYCD predominantly contracts with vendors for human services, which are exempt from LL 174 participation goals. Its $9.7 million in LL 174-eligible value reflects 0.05% of the City’s total LL 174- eligible contracting portfolio.
Table 64: FY25 LL 174-Eligible Contracts and POs
| Certification Status | # of Contracts | % Share of Contracts | Total Registered Contract Value | % Share of Contract Value |
|---|---|---|---|---|
| All Contracts and POs | 1,925 | 100.00% | $2,127,559,374 | 100.00% |
| M/WBE | 293 | 15.22% | $12,715,576 | 0.60% |
| Non-Certified | 1,632 | 84.78% | $2,114,843,798 | 99.40% |
| LL174 Contracts and POs | 400 | 100.00% | $9,700,489 | 100.00% |
| M/WBE | 277 | 69.25% | $6,042,076 | 62.29% |
| Non-Certified | 123 | 30.75% | $3,658,413 | 37.71% |
| LL174 Subcontracts | 0 | 0.00% | $0 | 0.00% |
| M/WBE | 0 | 0.00% | $0 | 0.00% |
| Non-Certified | 0 | 0.00% | $0 | 0.00% |
Chart 84: FY22-25 Value of LL 174-Eligible Prime Contracts and POs
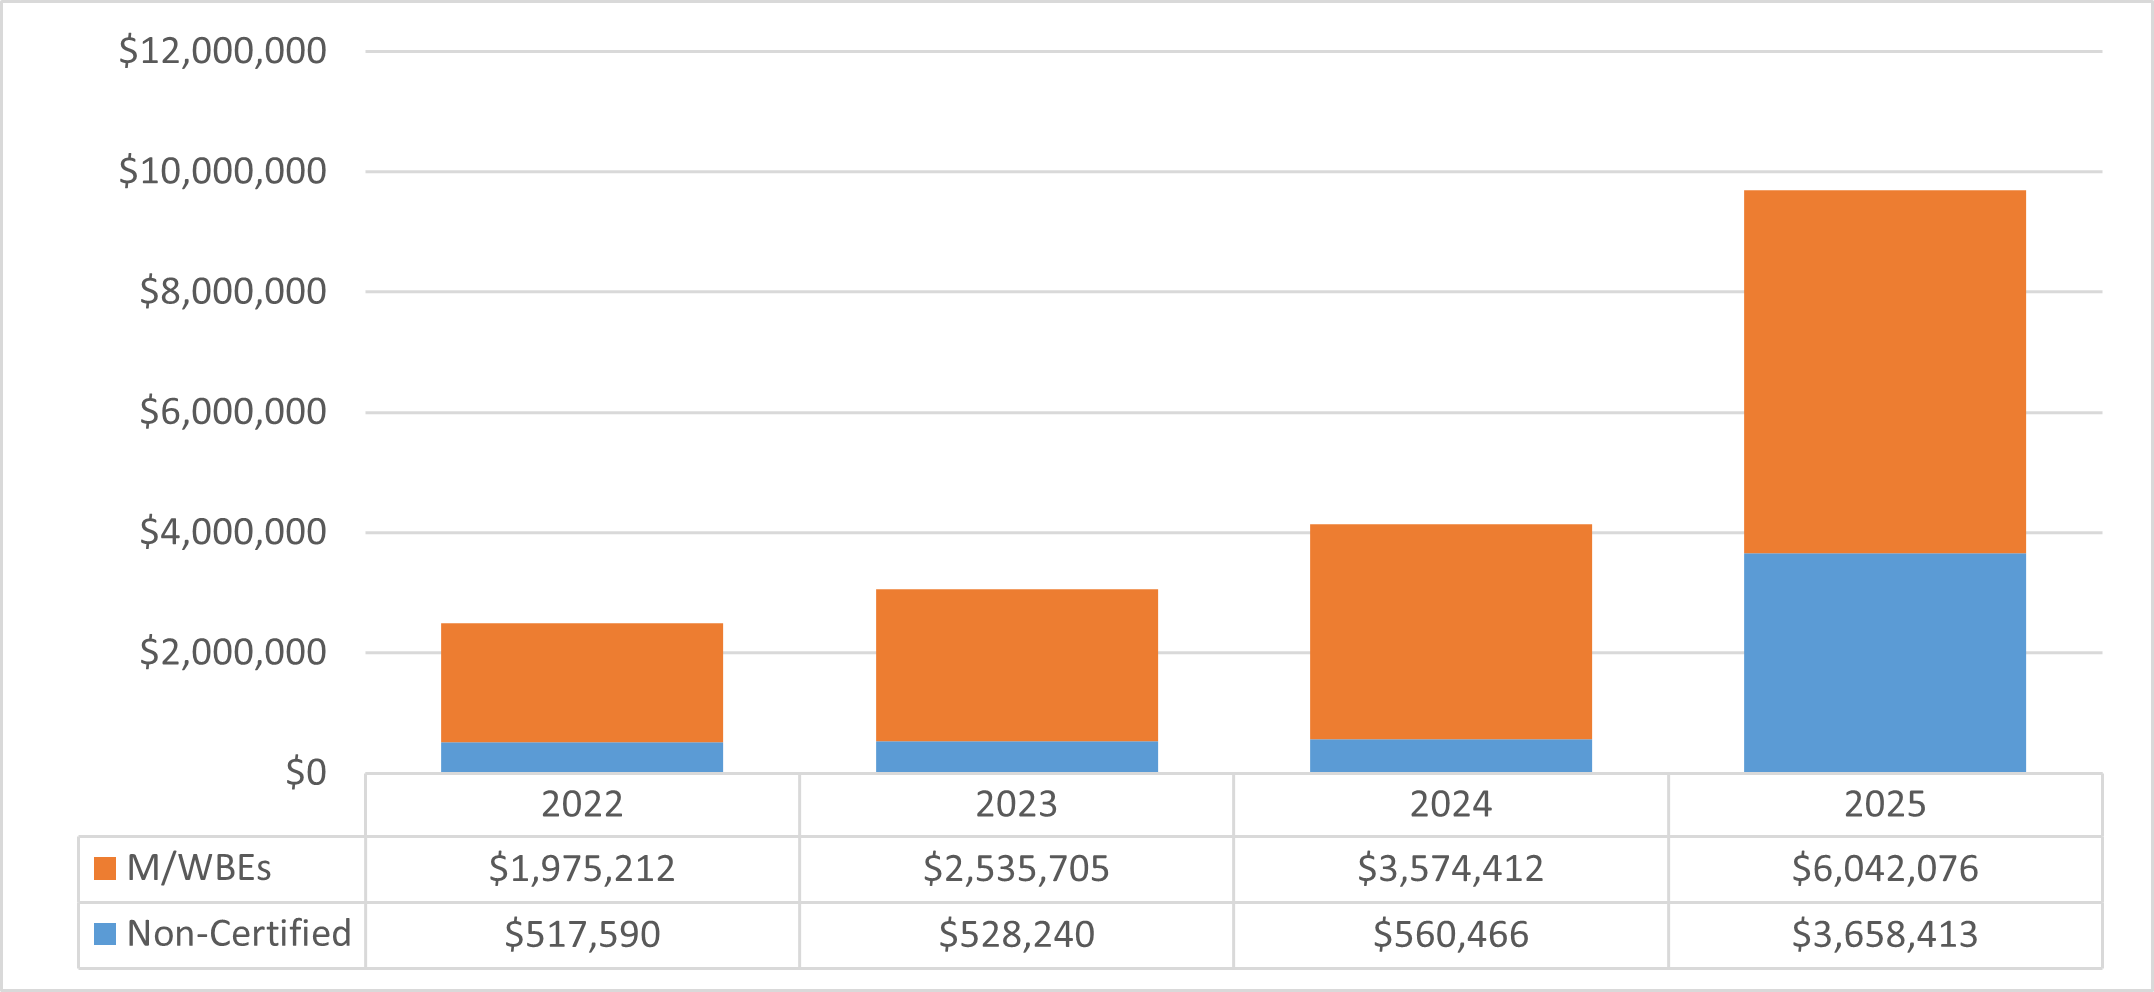
Chart 85: FY25 Value of LL 174-Eligible Contracts and POs, by Race and Gender
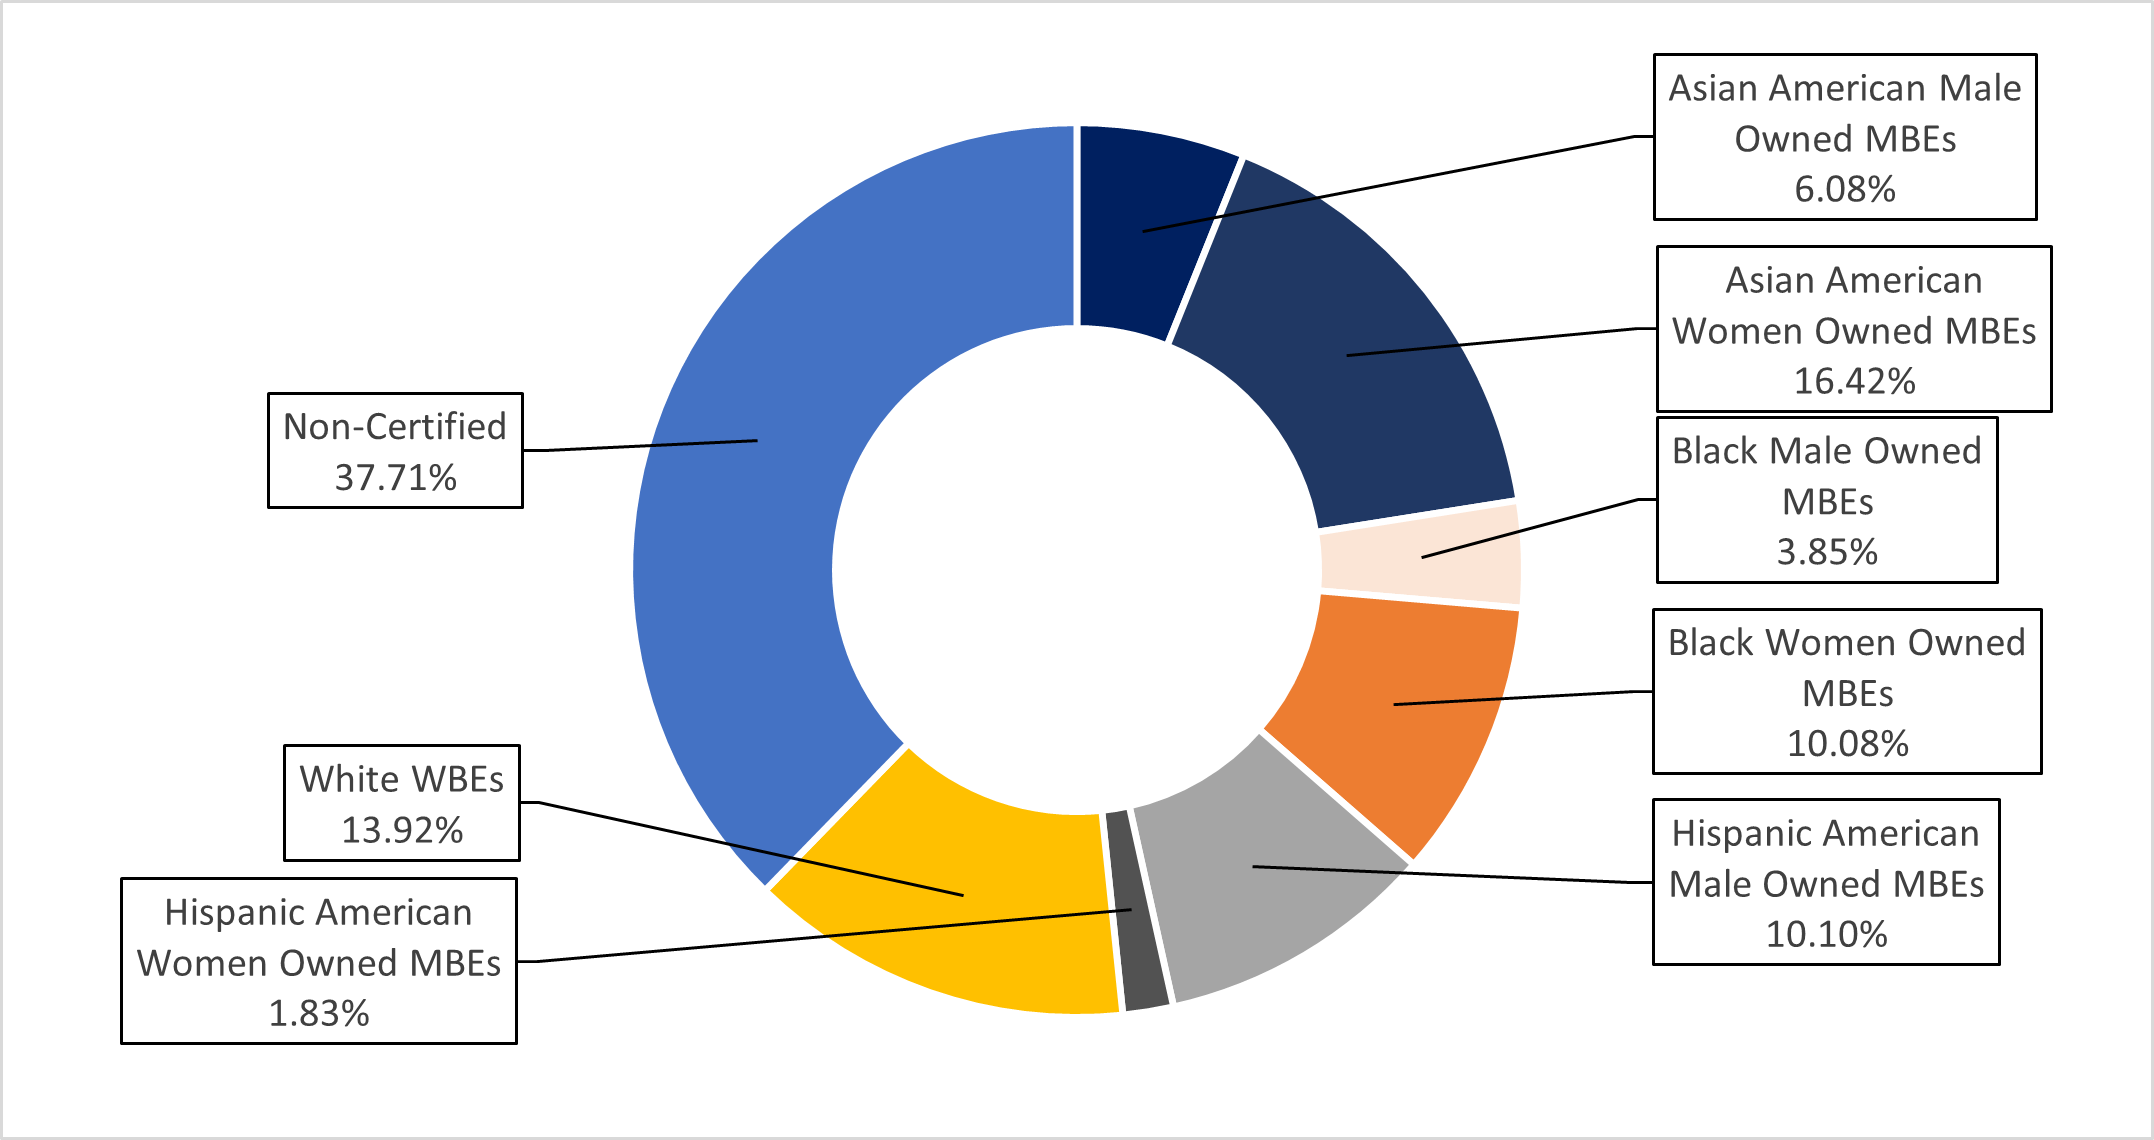
Chart 86: FY25 Share of LL 174-Eligible Contracts and PO Value, by M/WBE Category and Industry
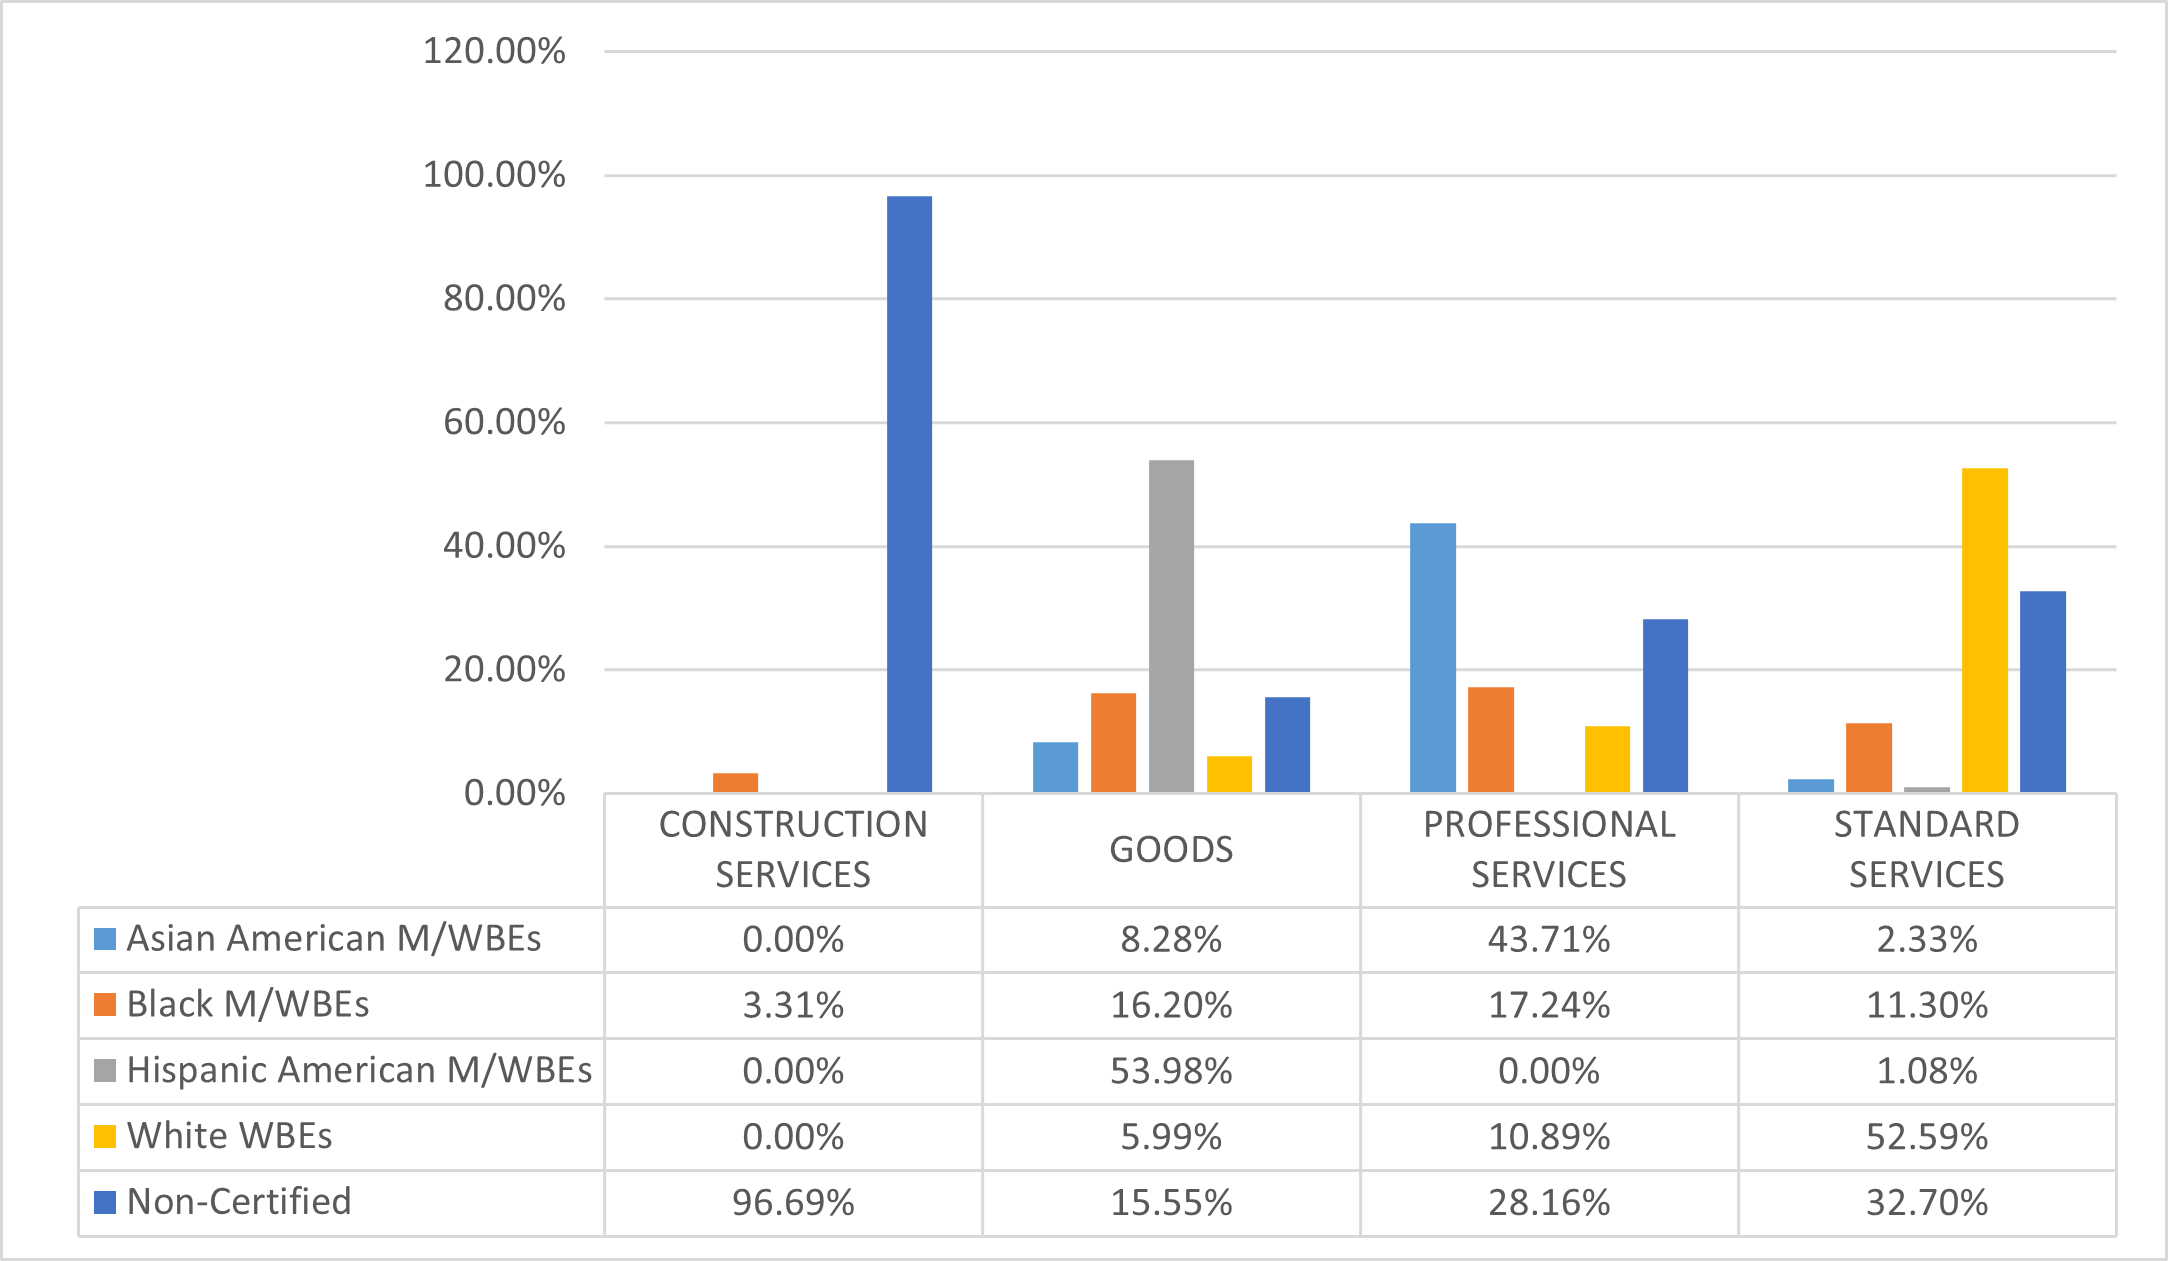
New York City Fire Department (FDNY)
Almost three quarters of FDNY’s procurement portfolio was subject to LL 174 participation goals in FY25. A large share of the excluded value was for contracts procured via Assignment, Emergency, and Intergovernmental procurement methods which are exempt from LL 174 participation goals. FDNY also procured valuable Renewals, which are excluded from this analysis. FDNY’s $108.8 million in LL 174-eligible contracts represents 0.6% of the City’s overall LL 174-eligible contracting portfolio.
Table 65: FY25 LL 174-Eligible Contracts and POs
| Certification Status | # of Contracts | % Share of Contracts | Total Registered Contract Value | % Share of Contract Value |
|---|---|---|---|---|
| All Contracts and POs | 267 | 100.00% | $148,802,818 | 100.00% |
| M/WBE | 104 | 38.95% | $62,080,580 | 41.72% |
| Non-Certified | 163 | 61.05% | $86,722,237 | 58.28% |
| LL174 Contracts and POs | 187 | 100.00% | $108,842,091 | 100.00% |
| M/WBE | 97 | 51.87% | $54,515,002 | 50.09% |
| Non-Certified | 90 | 48.13% | $54,327,089 | 49.91% |
| LL174 Subcontracts | 5 | 100.00% | $1,124,500 | 100.00% |
| M/WBE | 4 | 80.00% | $927,500 | 82.48% |
| Non-Certified | 1 | 20.00% | $197,000 | 17.52% |
Chart 87: FY22-25 Value of LL 174-Eligible Prime Contracts and POs
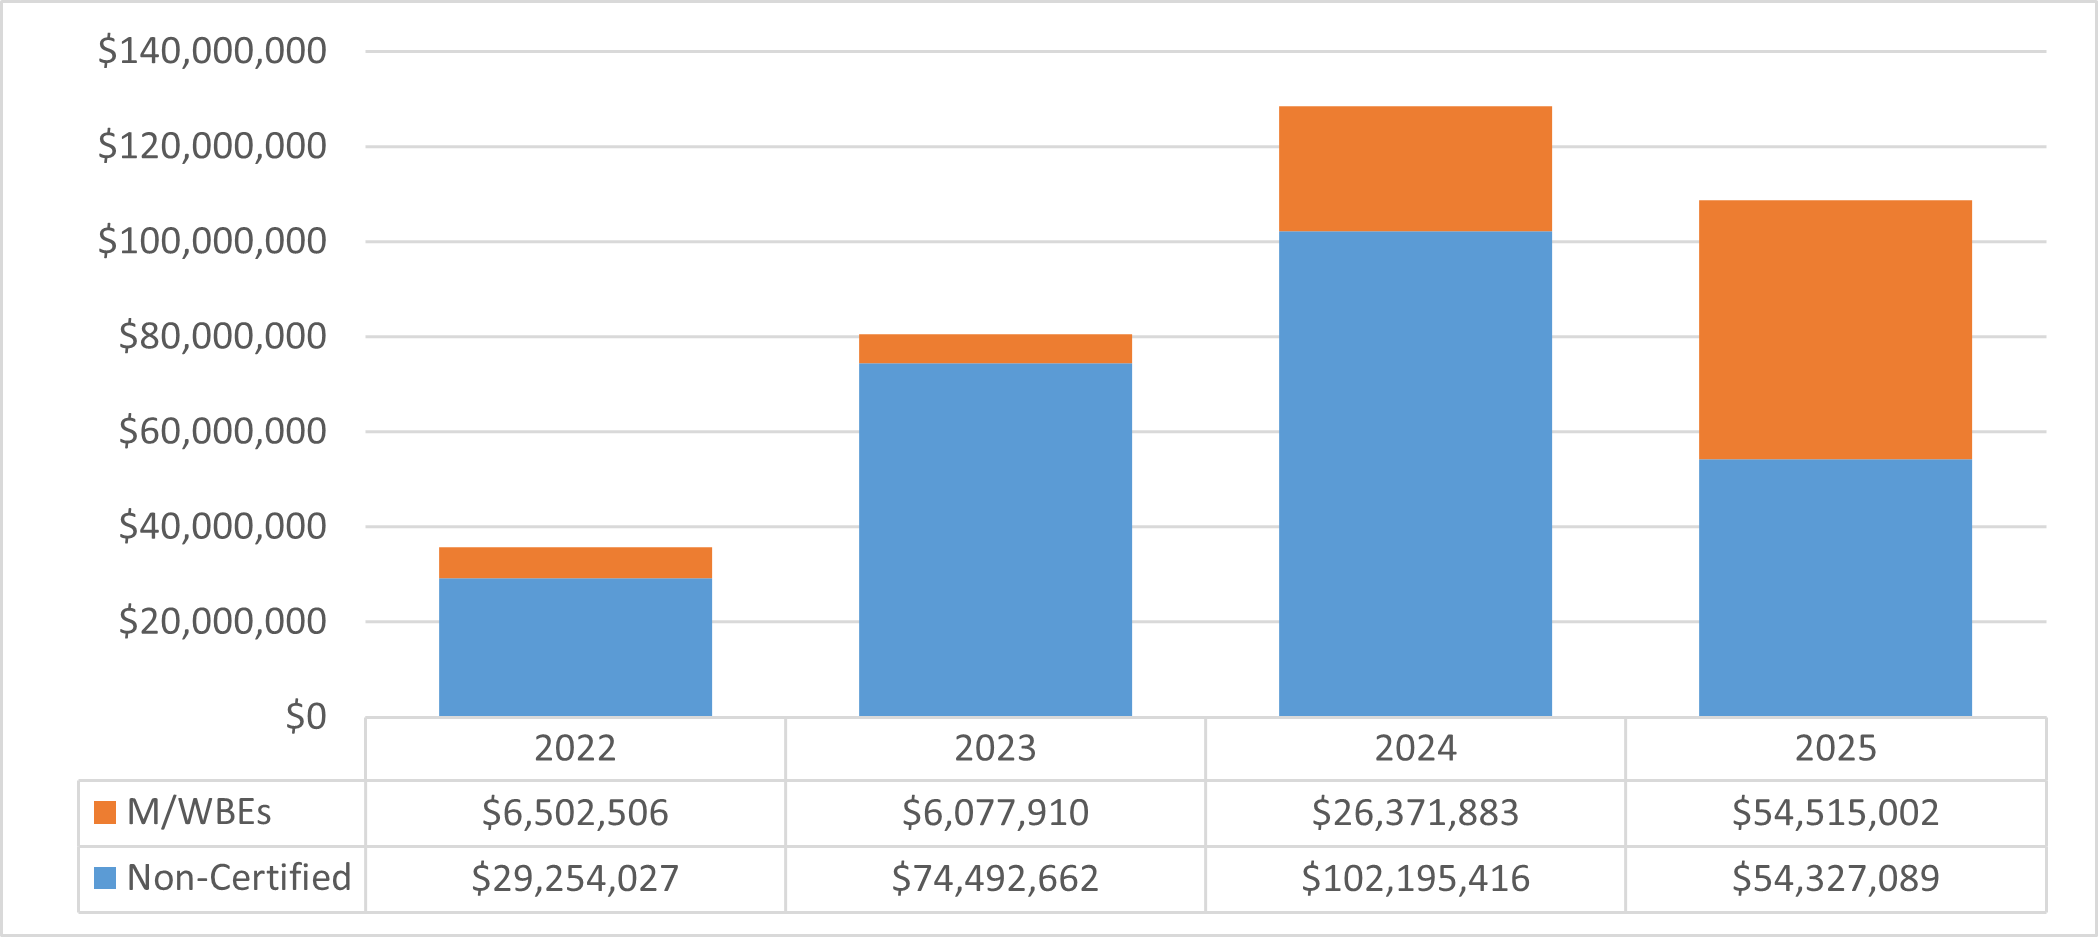
Chart 88: FY25 Value of LL 174-Eligible Contracts and POs, by Race and Gender
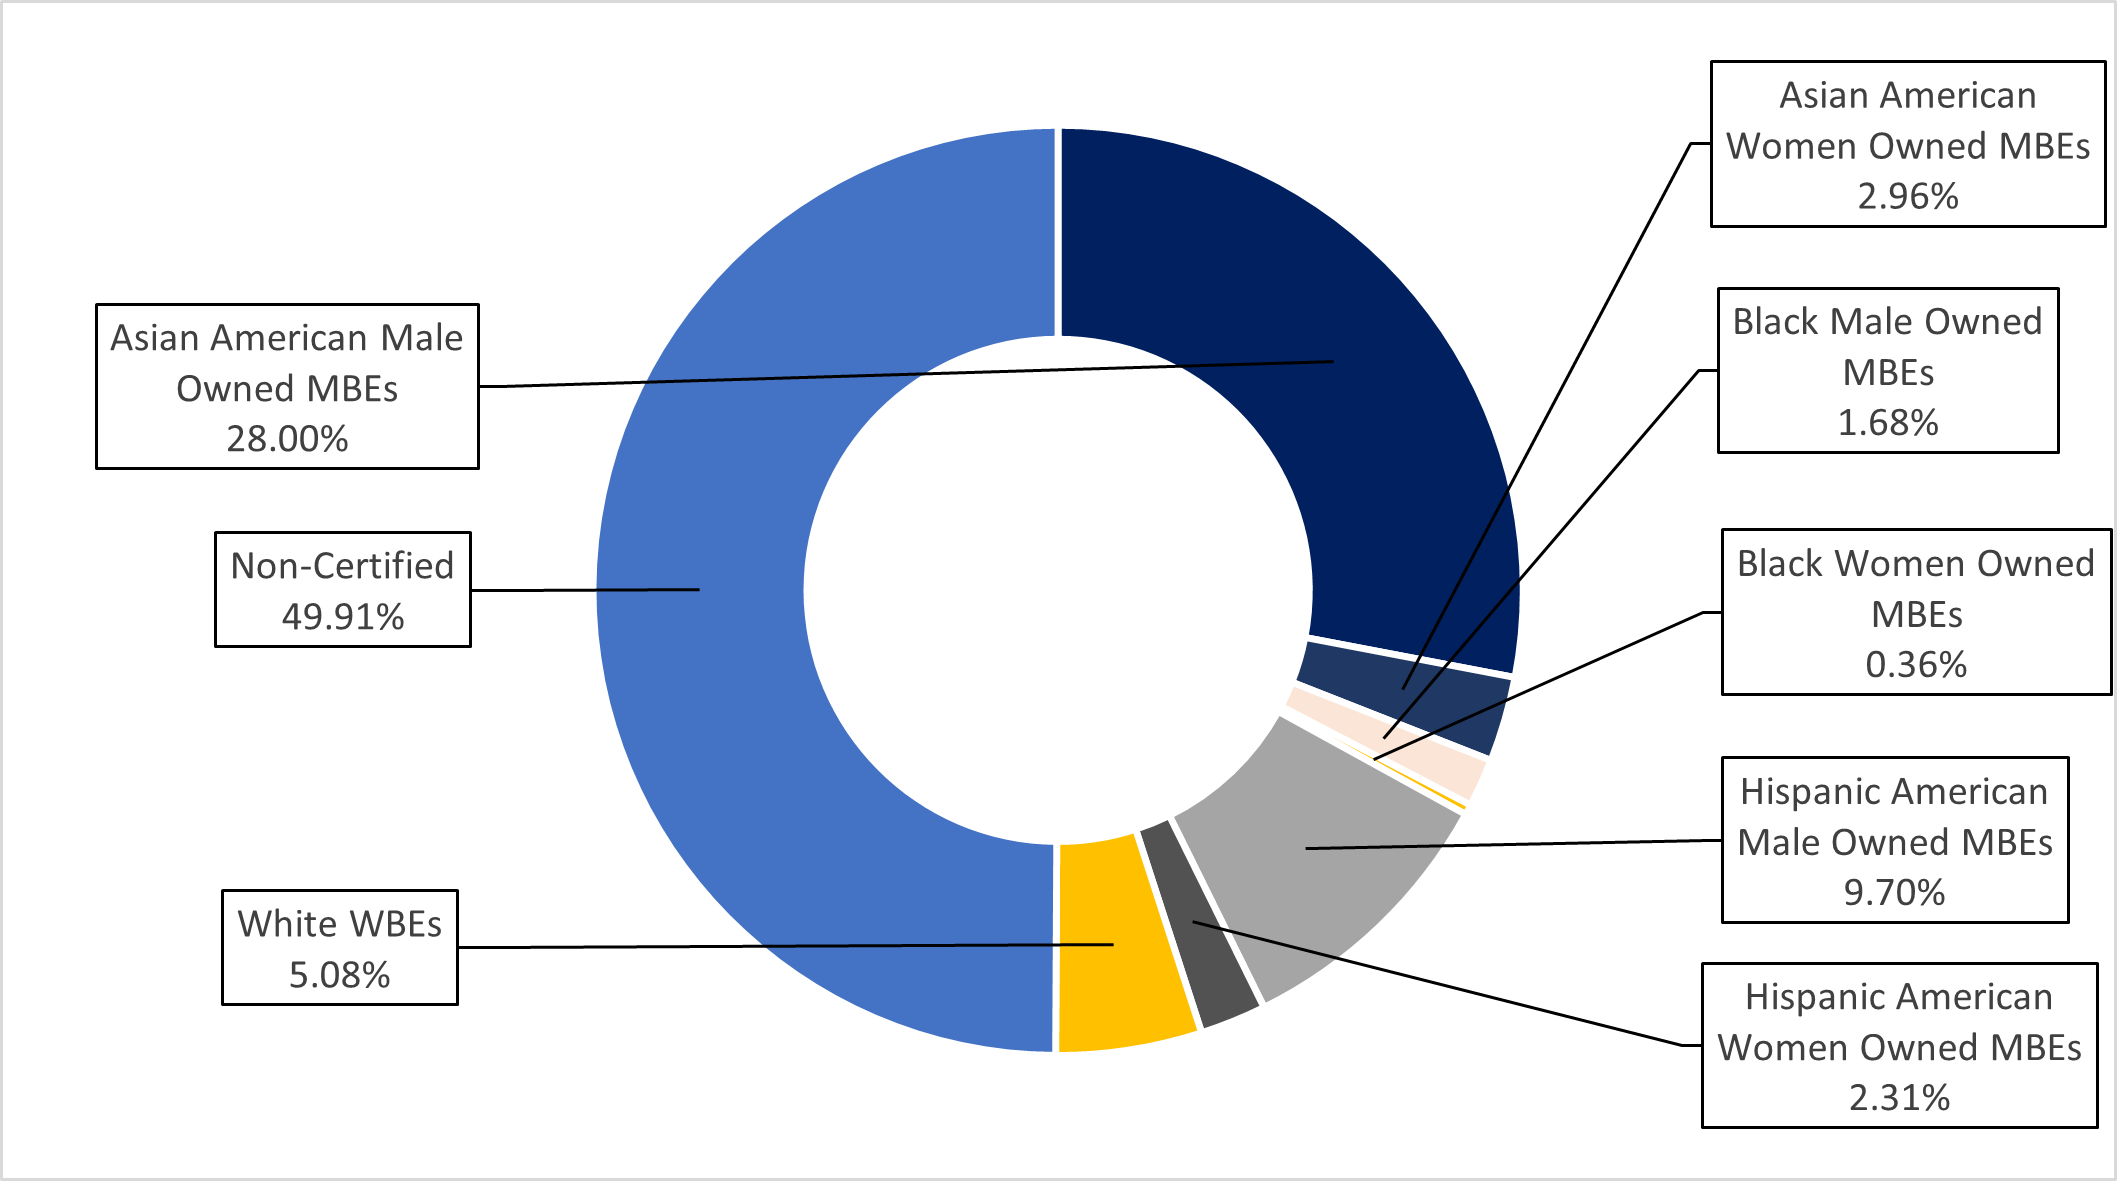
Chart 89: FY25 Share of LL 174-Eligible Contracts and PO Value, by M/WBE Category and Industry
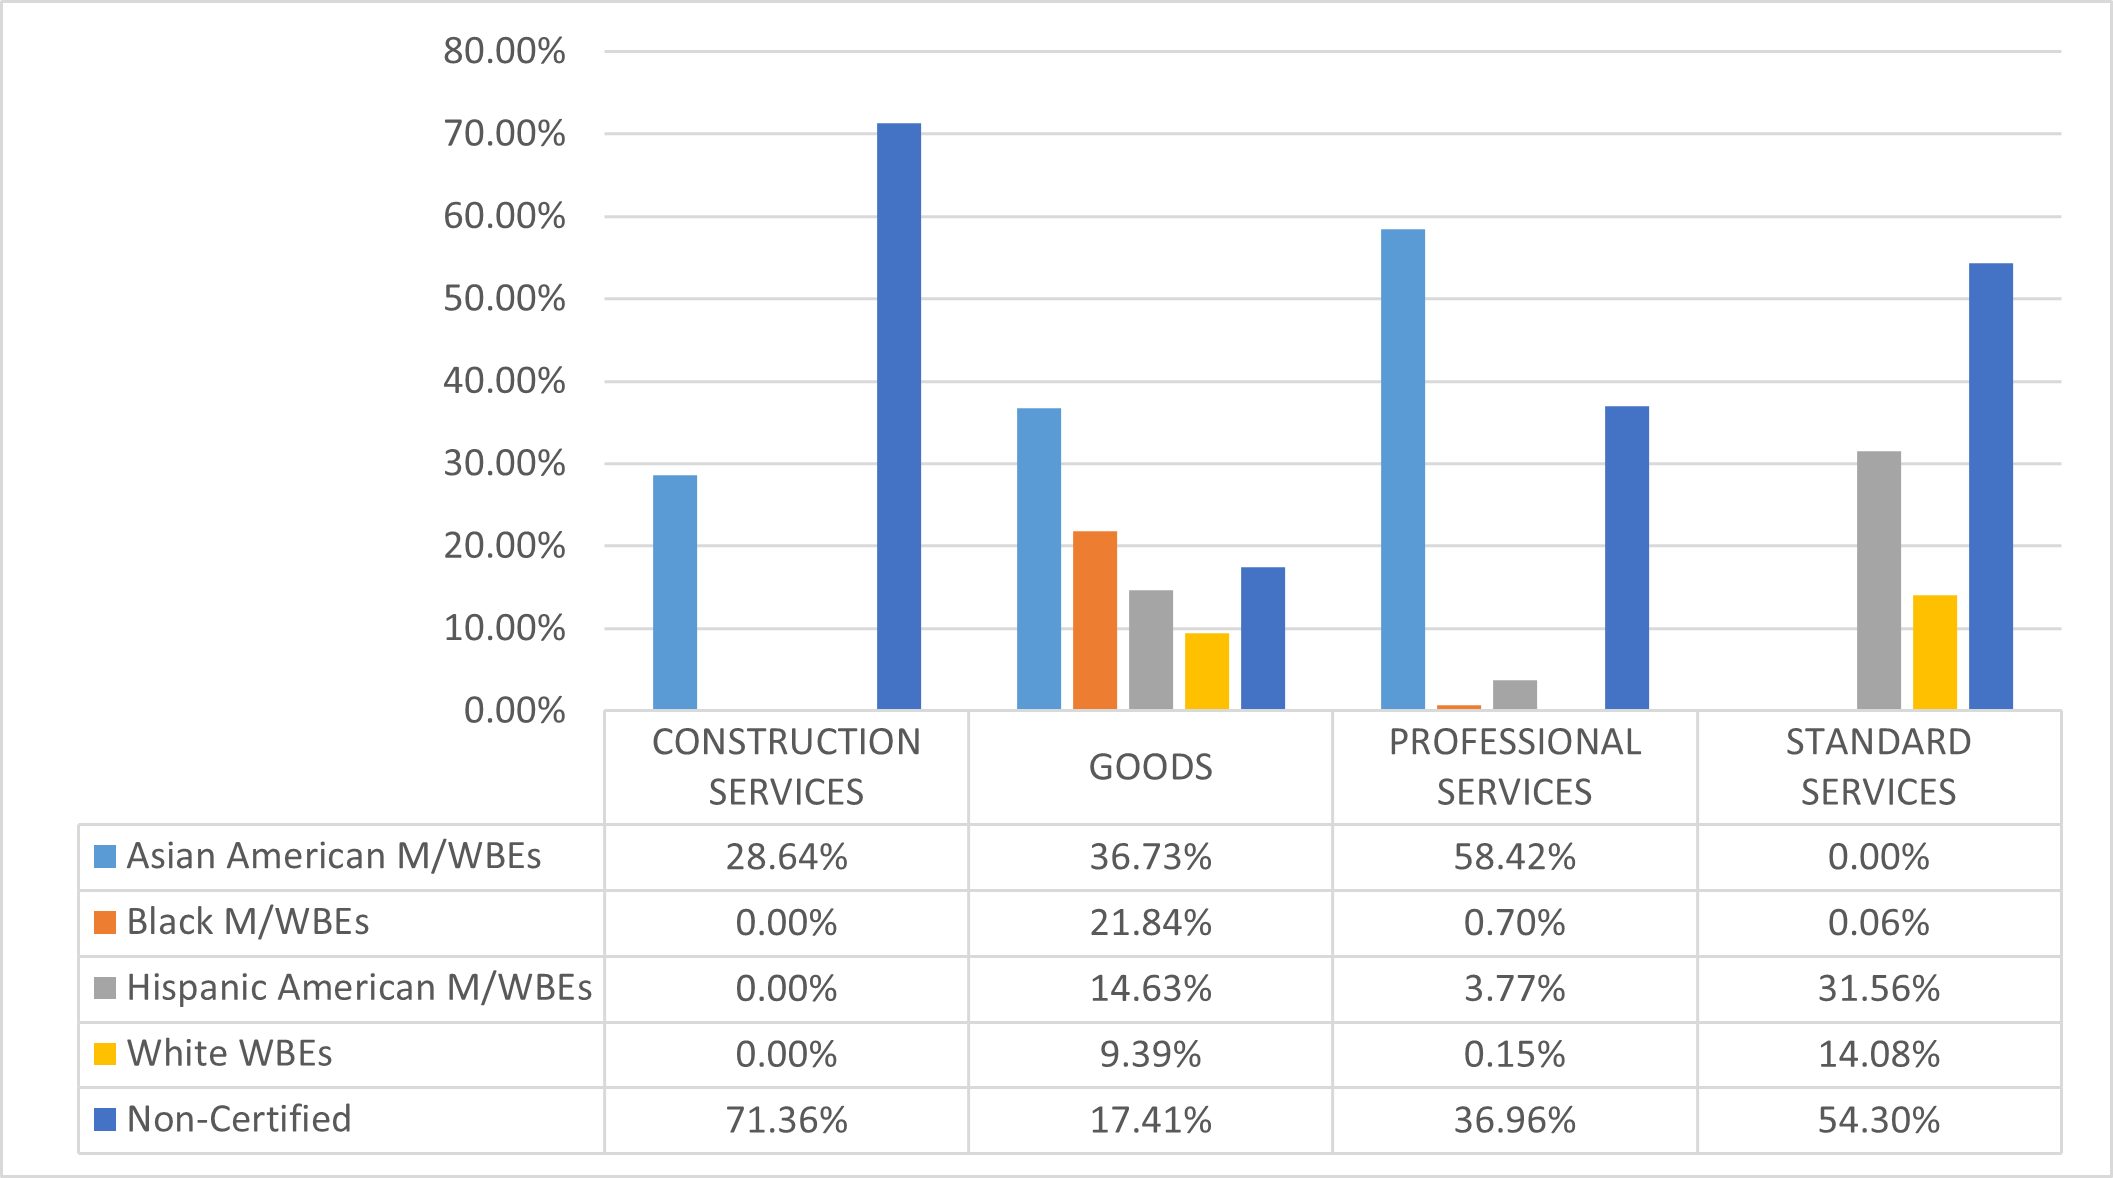
Department of Housing Preservation and Development (HPD)
The LL 174 totals below represent a small share of HPD’s total procurement portfolio, as HPD manages high-value emergency procurements and condemnations which are exempt from LL 174 participation goals. Notably, HPD’s total registered contract value includes $1.03 billion in contracts associated with the New York City Housing Authority (NYCHA), which are not included in this analysis. Its $39.5 million in LL 174-eligible value accounts for just 0.2% of the City’s total LL 174-eligible contracting portfolio.
Table 66: FY25 LL 174-Eligible Contracts and POs
| Certification Status | # of Contracts | % Share of Contracts | Total Registered Contract Value | % Share of Contract Value |
|---|---|---|---|---|
| All Contracts and POs | 17,654 | 100.00% | $3,111,939,541 | 100.00% |
| M/WBE | 13,703 | 77.62% | $82,785,266 | 2.66% |
| Non-Certified | 3,951 | 22.38% | $3,029,154,275 | 97.34% |
| LL174 Contracts and POs | 17,401 | 100.00% | $39,515,974 | 100.00% |
| M/WBE | 13,690 | 78.67% | $26,844,701 | 67.93% |
| Non-Certified | 3,711 | 21.33% | $12,671,273 | 32.07% |
| LL174 Subcontracts | 8 | 100.00% | $404,550 | 100.00% |
| M/WBE | 5 | 62.50% | $383,800 | 94.87% |
| Non-Certified | 3 | 37.50% | $20,750 | 5.13% |
Chart 90: FY22-25 Value of LL 174-Eligible Prime Contracts and POs
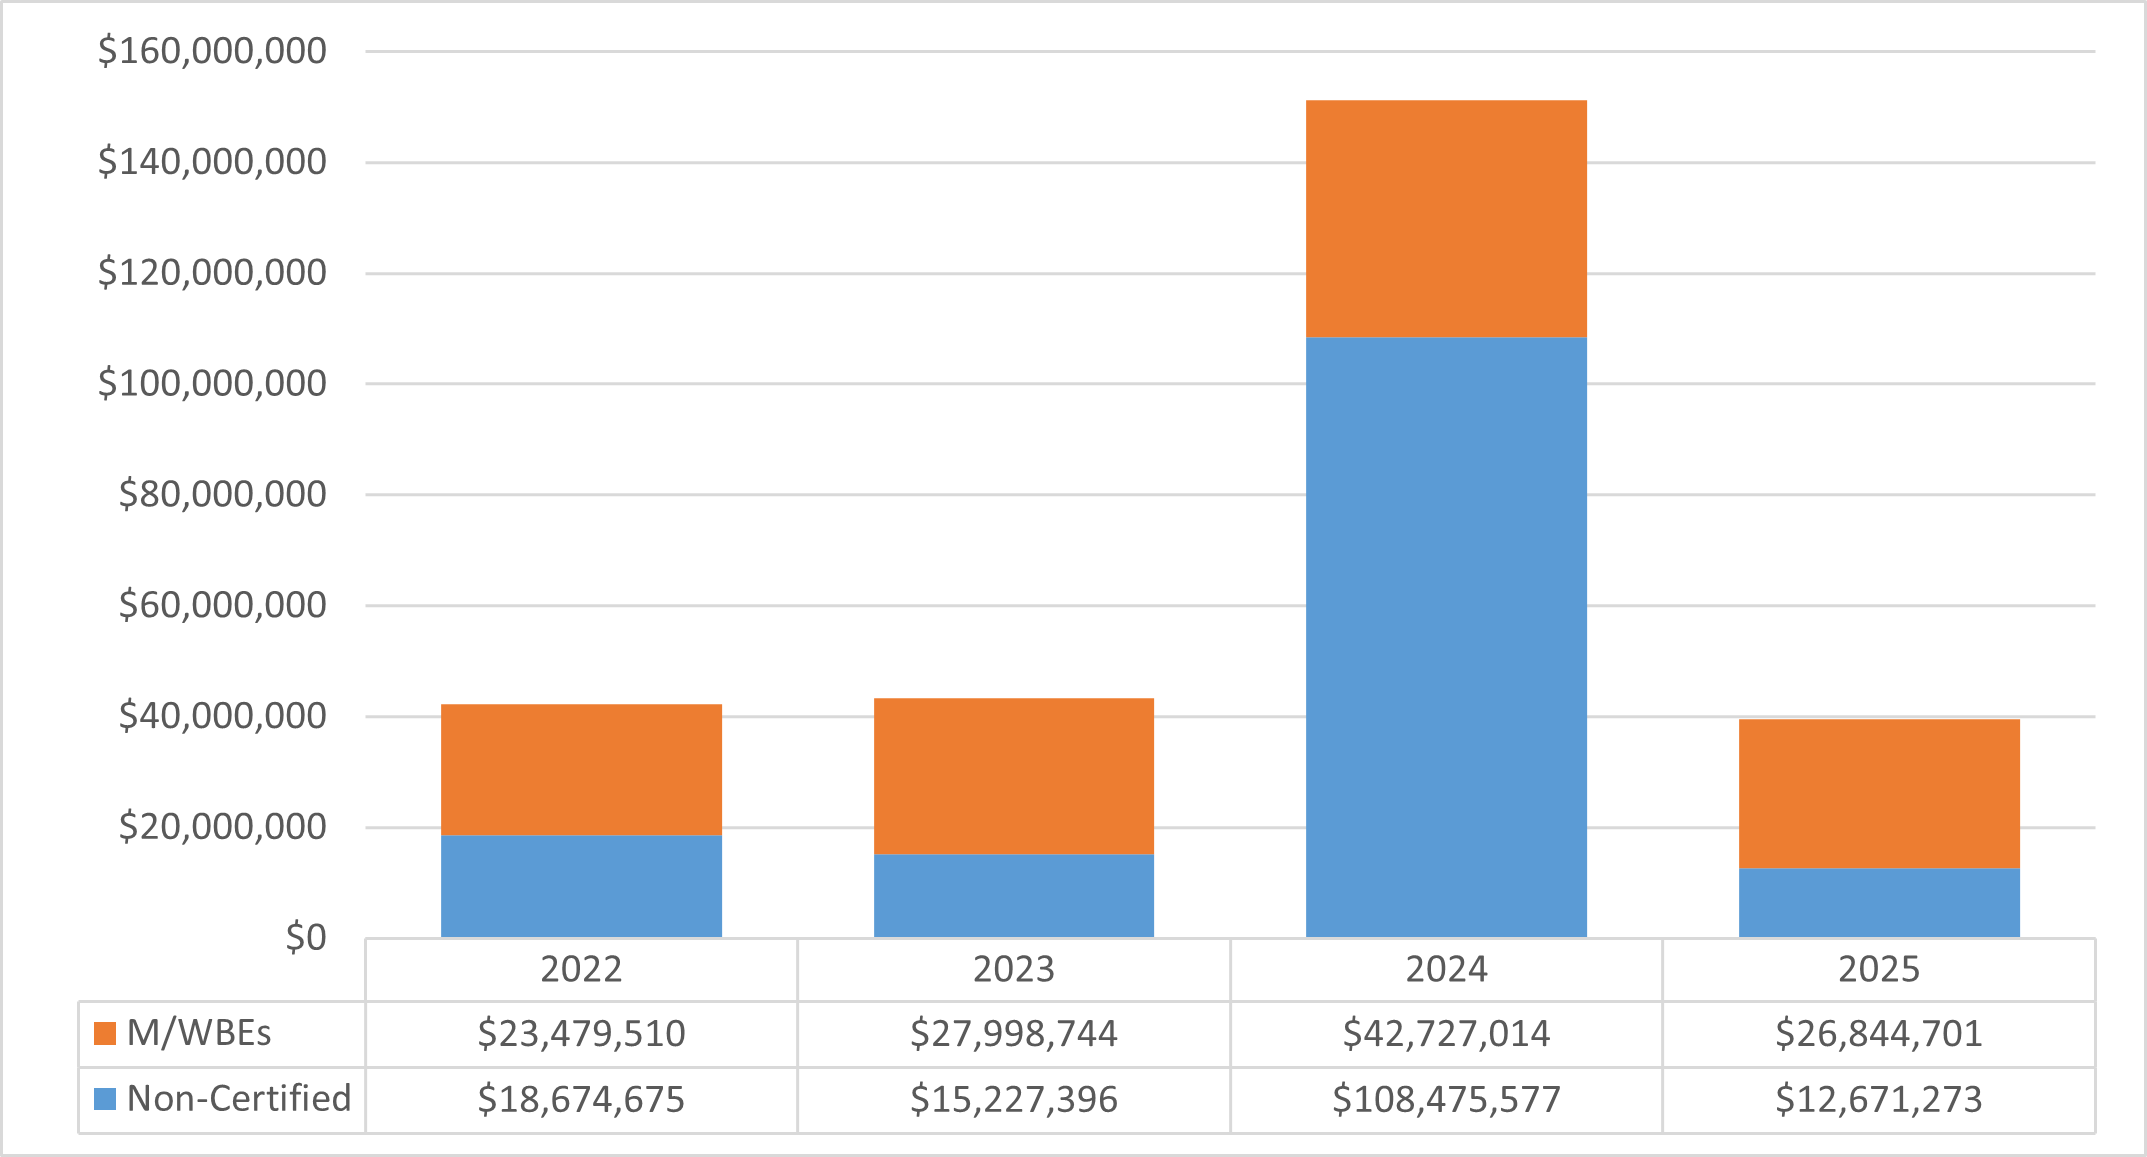
Chart 91: FY25 Value of LL 174-Eligible Contracts and POs, by Race and Gender
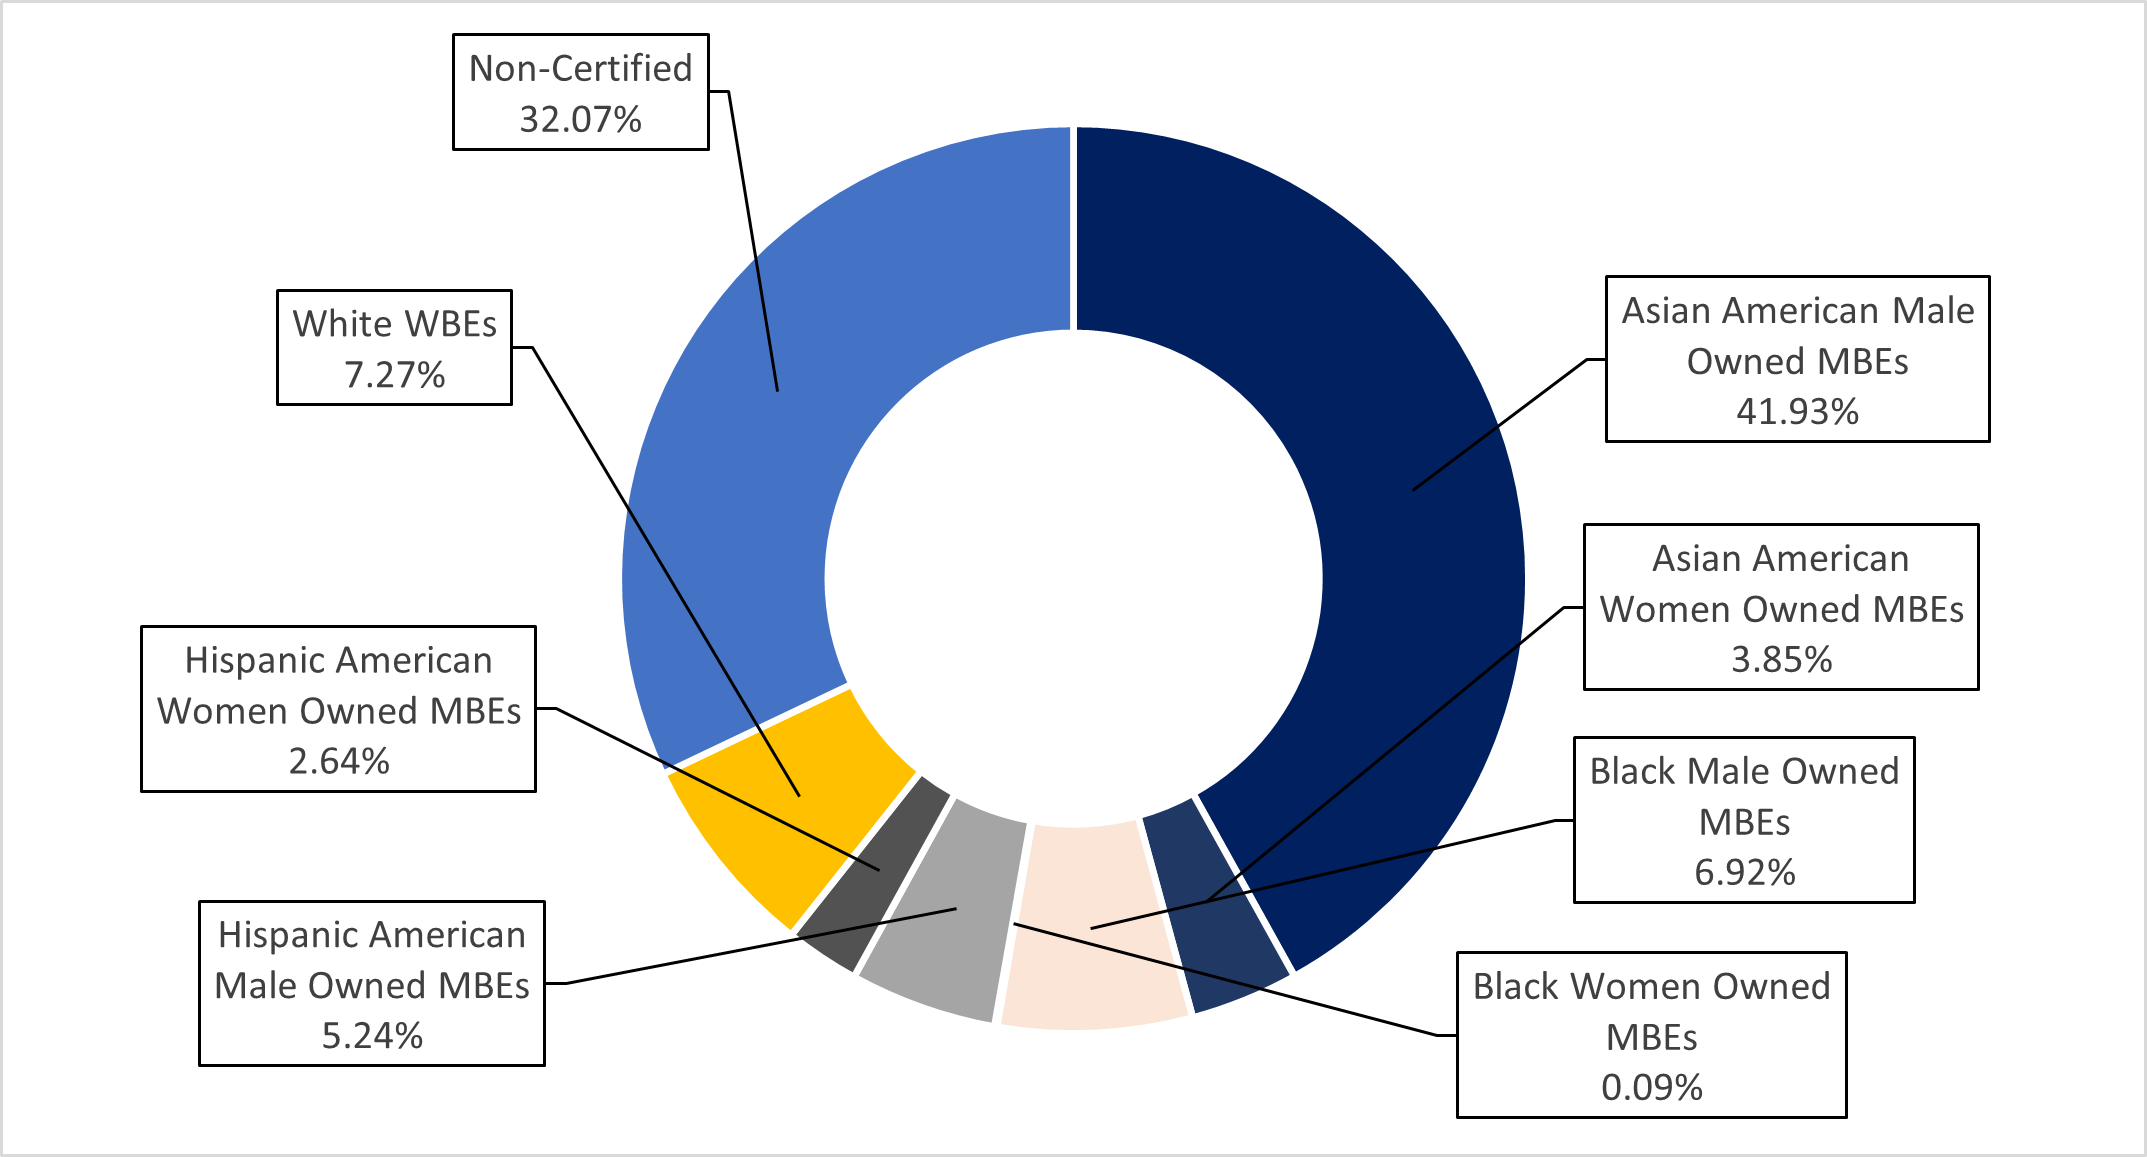
Chart 92: FY25 Share of LL 174-Eligible Contracts and PO Value, by M/WBE Category and Industry
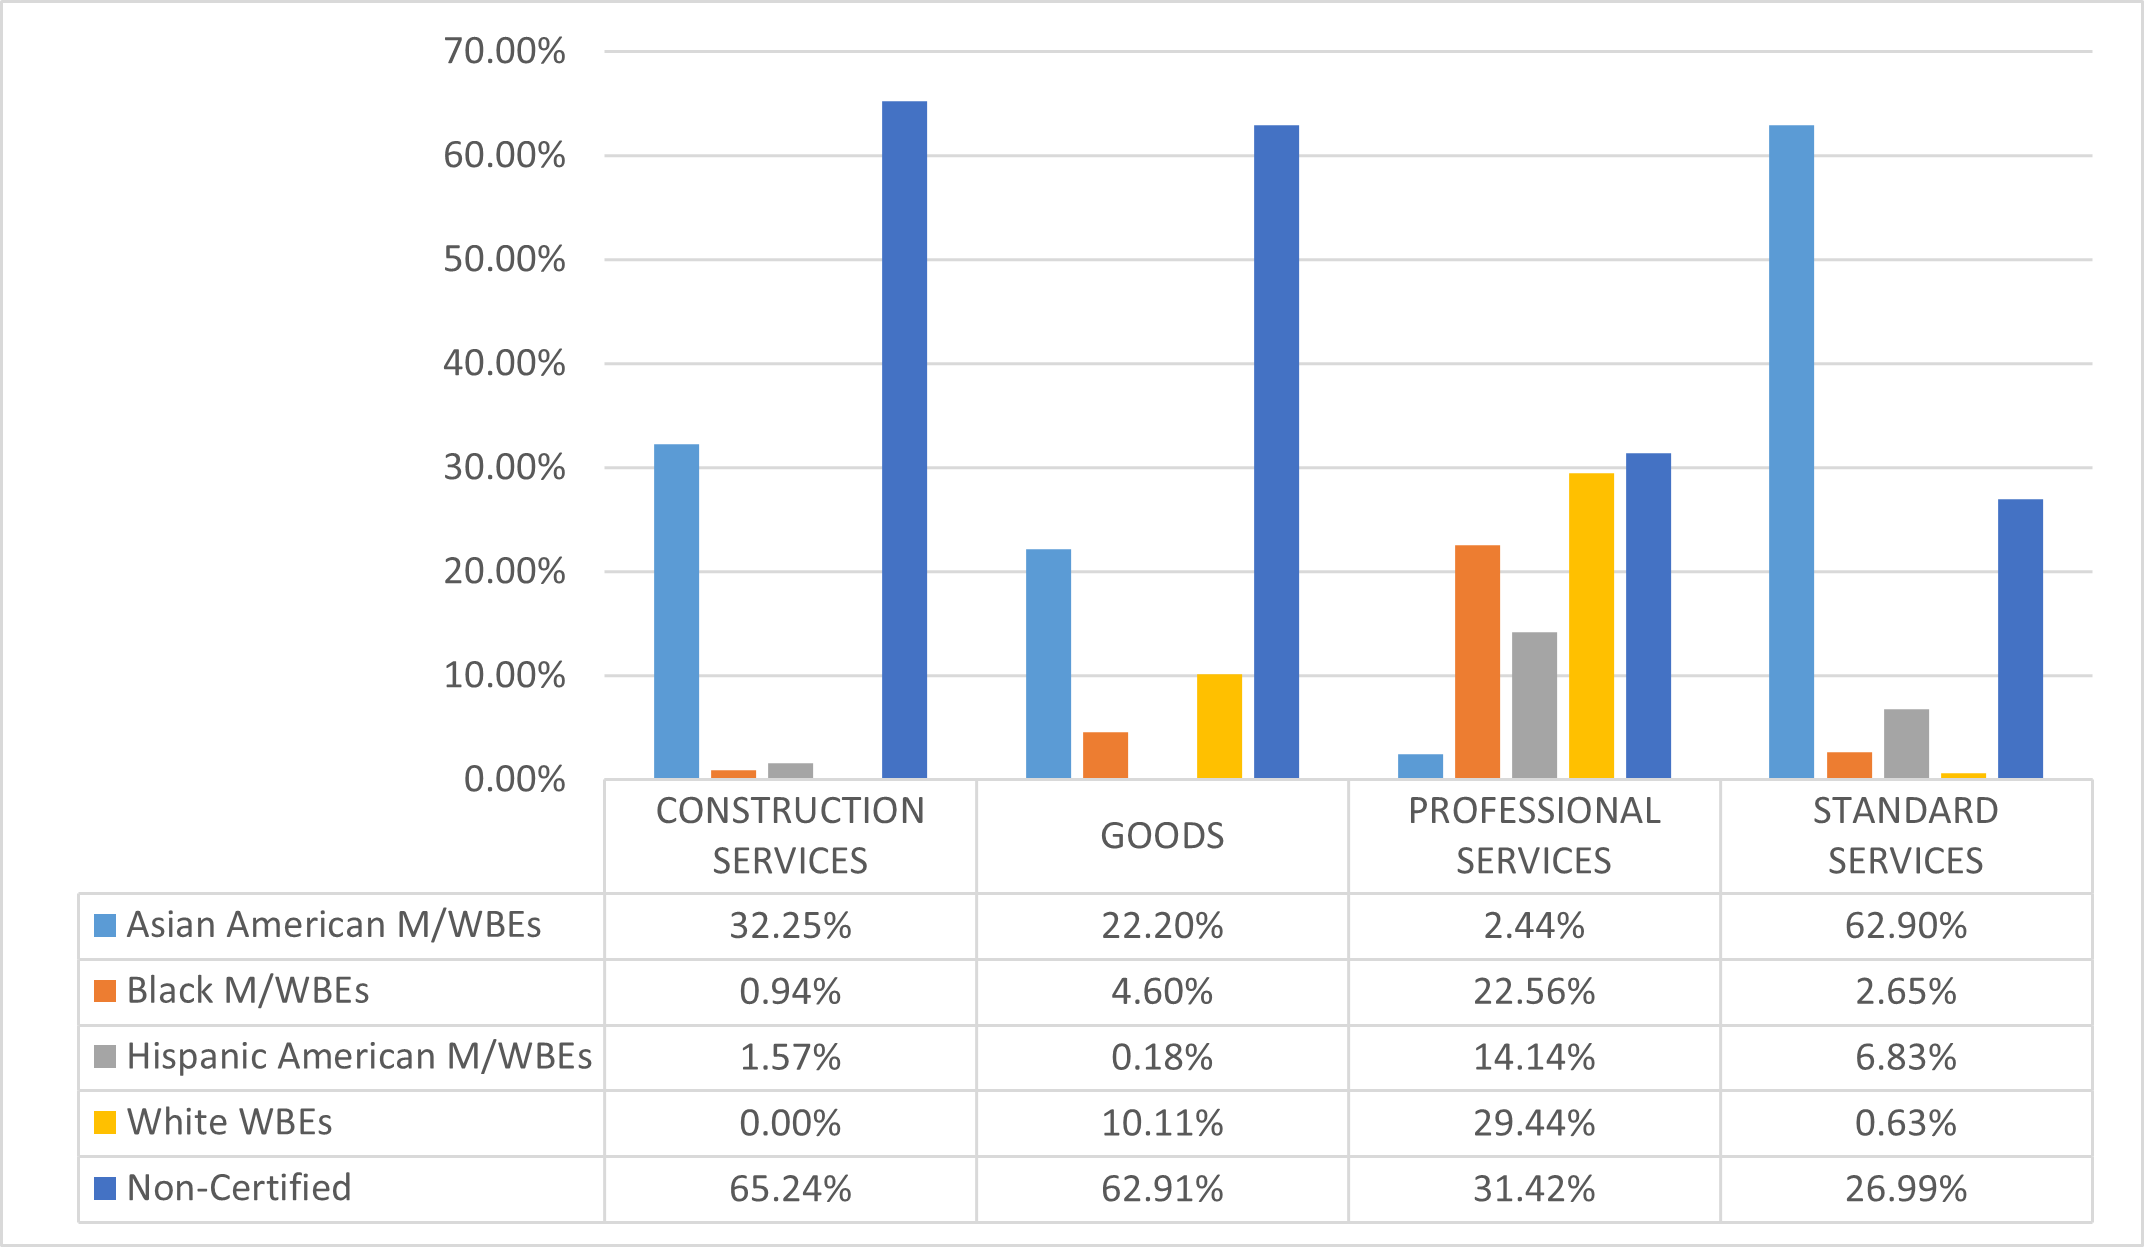
Law Department (LAW)
The majority of the Law Department’s FY25 procurement portfolio was subject to LL 174 participation goals. Its $63 million in LL 174-eligible value represents less than 0.3% of the City’s total LL 174-eligible contracting portfolio.
Table 67: FY25 LL 174-Eligible Contracts and POs
| Certification Status | # of Contracts | % Share of Contracts | Total Registered Contract Value | % Share of Contract Value |
|---|---|---|---|---|
| All Contracts and POs | 652 | 100.00% | $66,575,347 | 100.00% |
| M/WBE | 145 | 22.24% | $9,585,918 | 14.40% |
| Non-Certified | 507 | 77.76% | $56,989,429 | 85.60% |
| LL174 Contracts and POs | 618 | 100.00% | $63,060,241 | 100.00% |
| M/WBE | 144 | 23.30% | $9,234,852 | 14.64% |
| Non-Certified | 474 | 76.70% | $53,825,389 | 85.36% |
| LL174 Subcontracts | 0 | 0.00% | $0 | 0.00% |
| M/WBE | 0 | 0.00% | $0 | 0.00% |
| Non-Certified | 0 | 0.00% | $0 | 0.00% |
Chart 93: FY22-25 Value of LL 174-Eligible Prime Contracts and POs
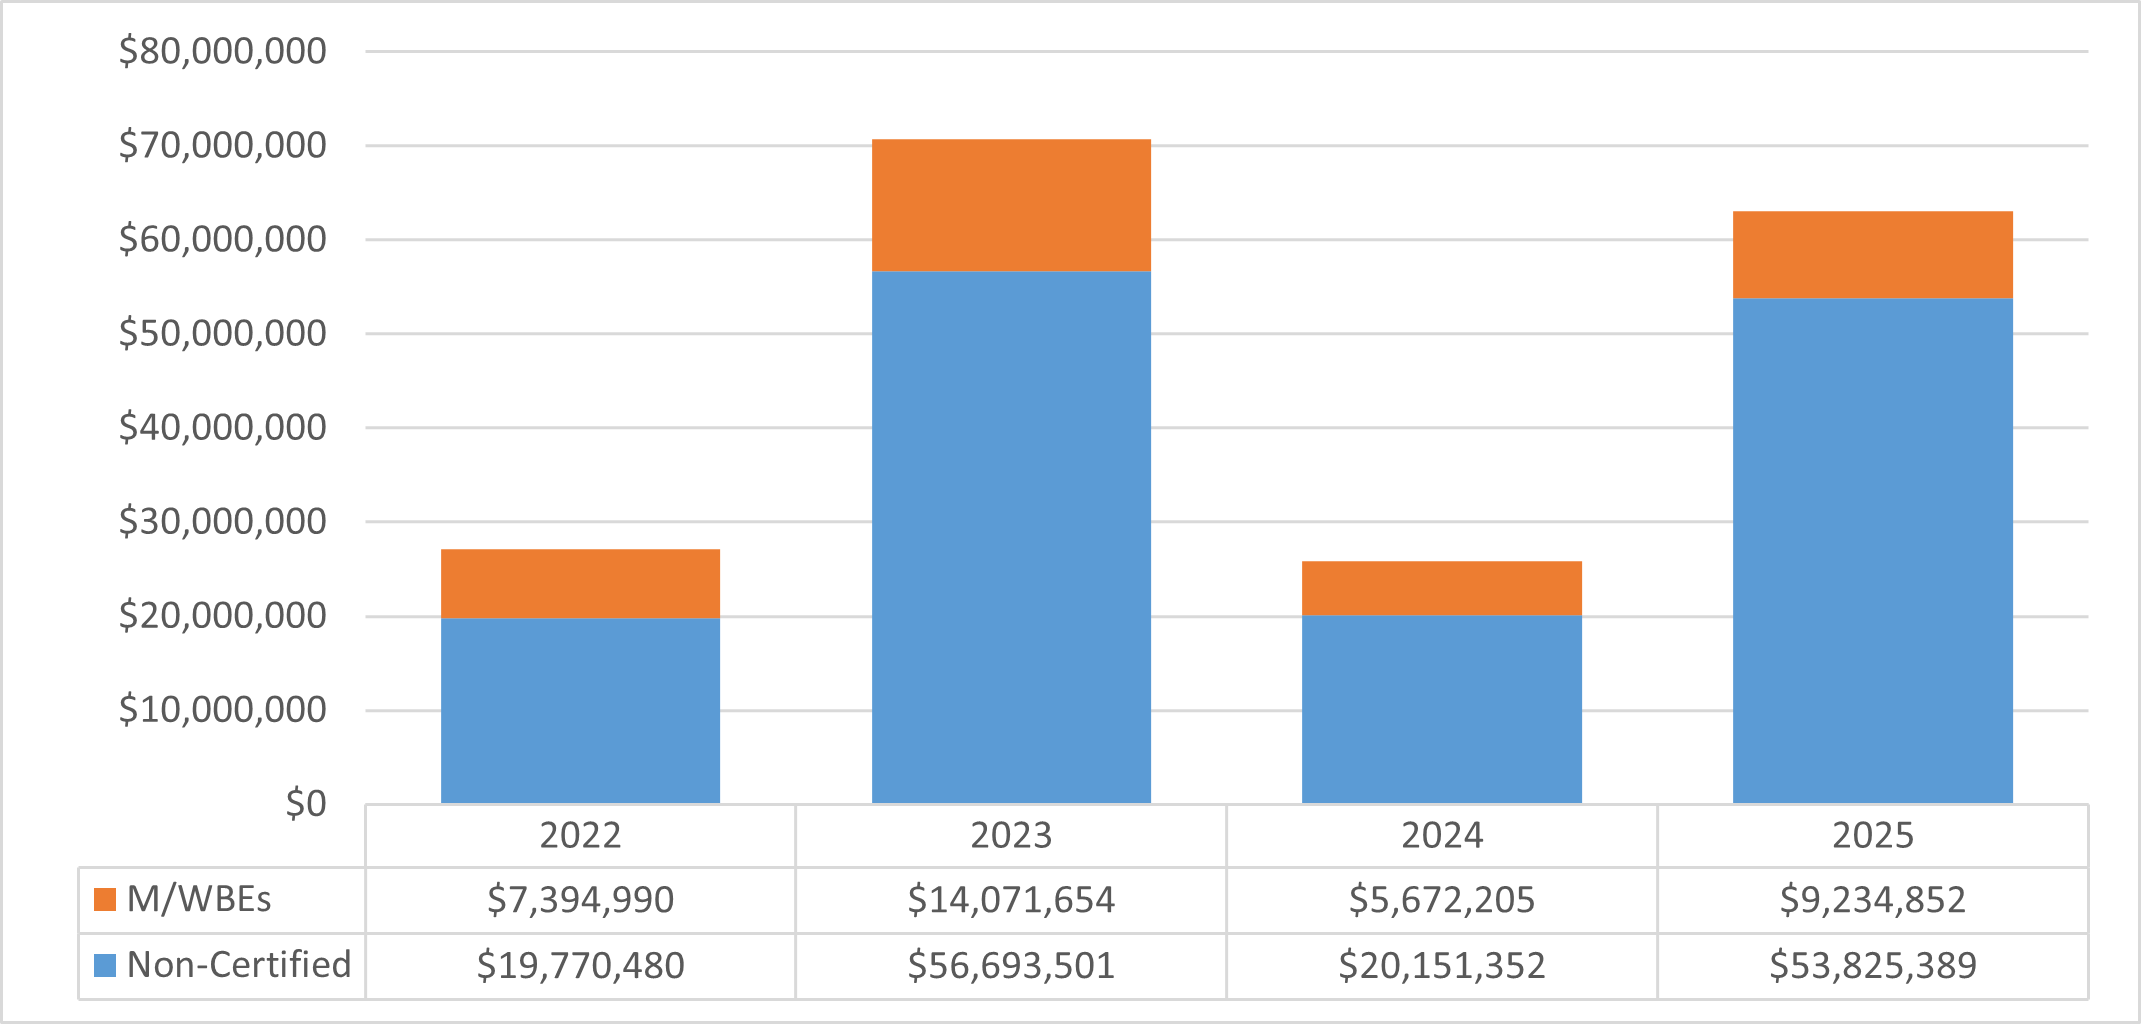
Chart 94: FY25 Value of LL 174-Eligible Contracts and POs, by Race and Gender
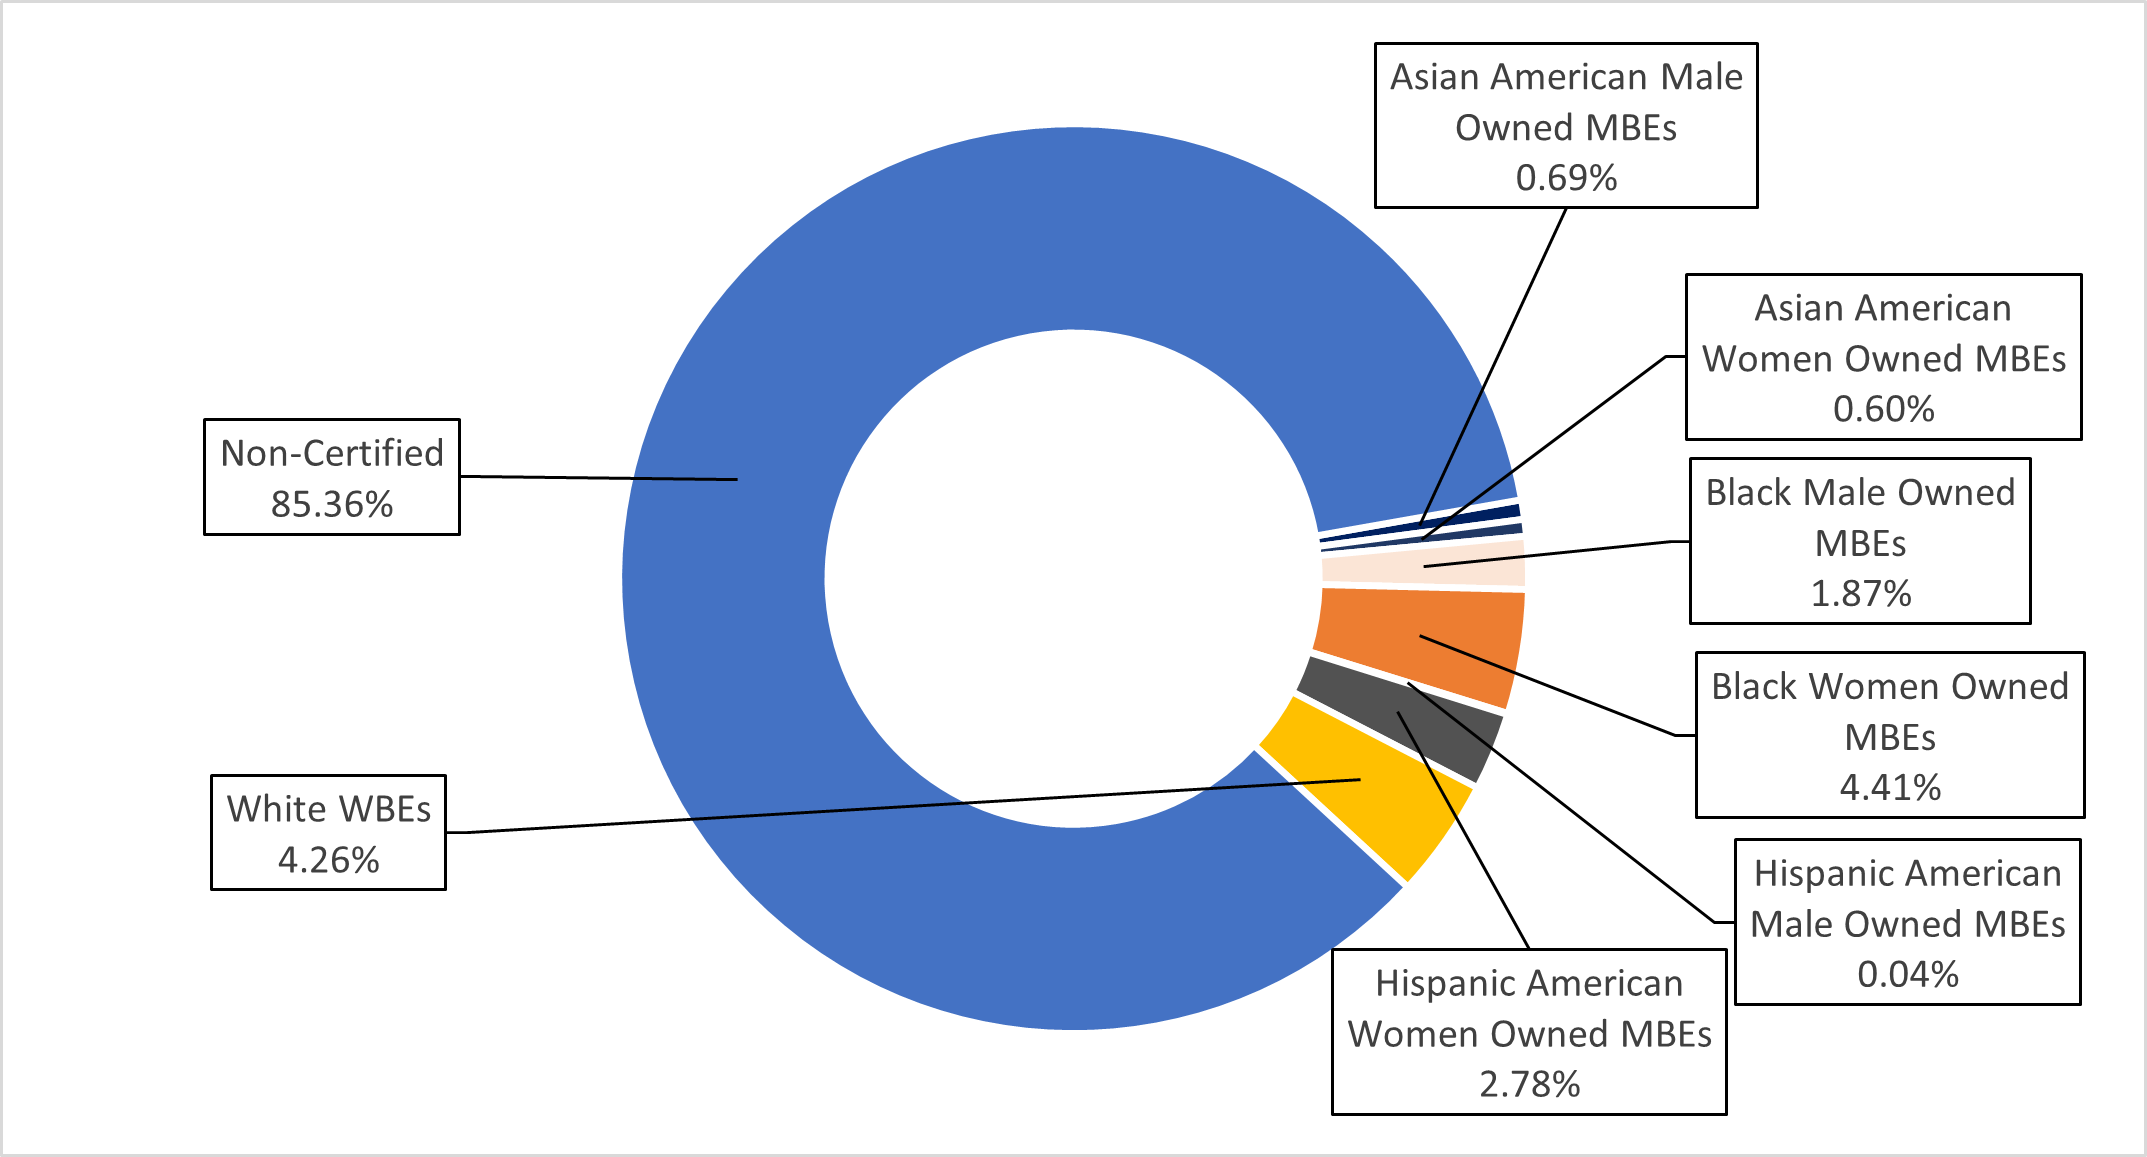
Chart 95: FY25 Share of LL 174-Eligible Contracts and PO Value, by M/WBE Category and Industry
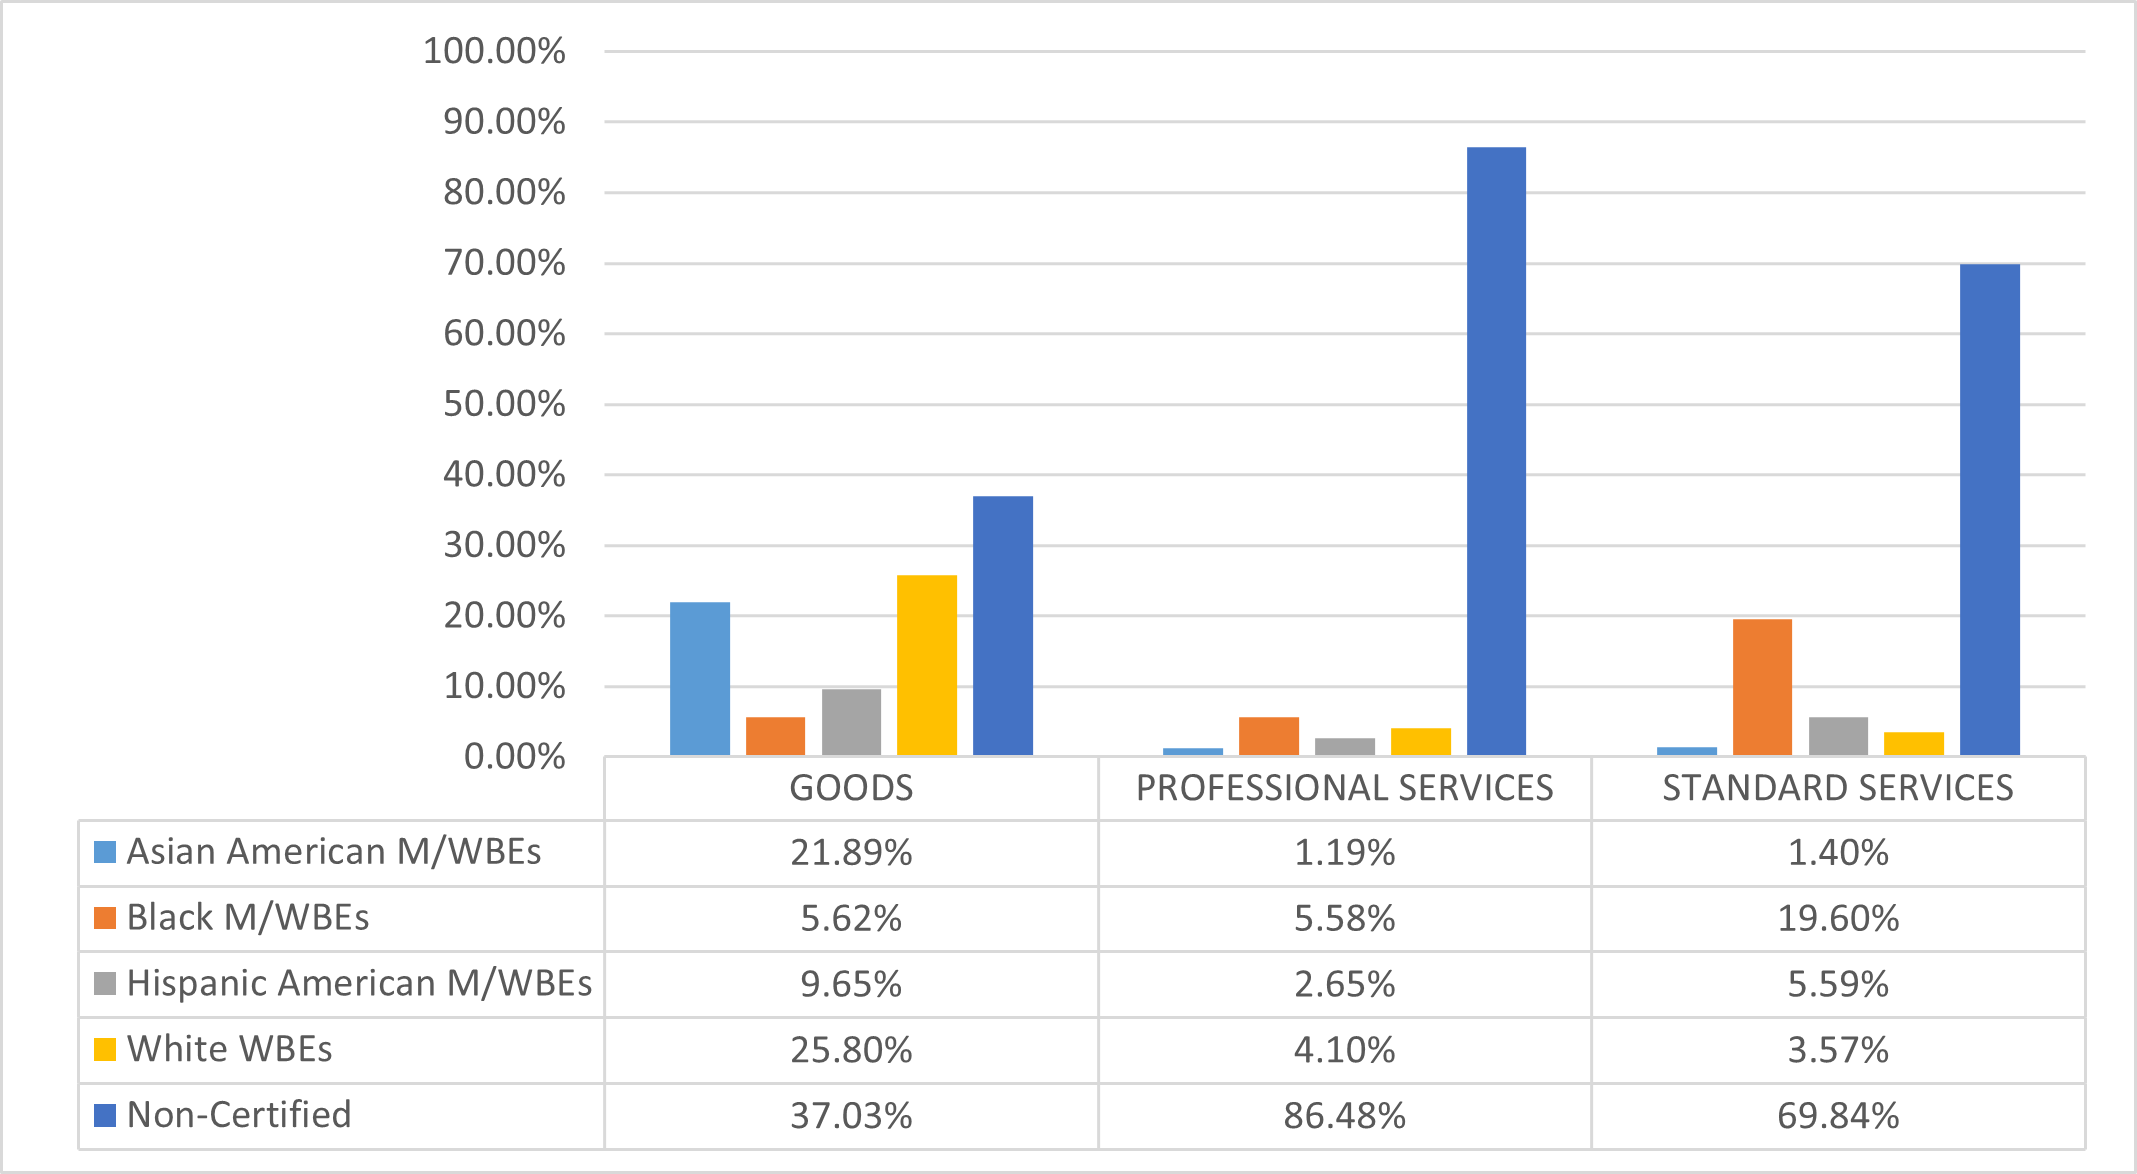
Landmarks Preservation Commission (LPC)
The vast majority of LPC’s FY25 procurement portfolio was subject to LL 174 participation goals. Its $596,770 in LL 174-eligible value represents 0.003% of the City’s total LL 174-eligible contracting portfolio.
Table 68: FY25 LL 174-Eligible Contracts and POs
| Certification Status | # of Contracts | % Share of Contracts | Total Registered Contract Value | % Share of Contract Value |
|---|---|---|---|---|
| All Contracts and POs | 64 | 100.00% | $608,970 | 100.00% |
| M/WBE | 21 | 32.81% | $206,248 | 33.87% |
| Non-Certified | 43 | 67.19% | $402,722 | 66.13% |
| LL174 Contracts and POs | 63 | 100.00% | $596,770 | 100.00% |
| M/WBE | 21 | 33.33% | $206,248 | 34.56% |
| Non-Certified | 42 | 66.67% | $390,522 | 65.44% |
| LL174 Subcontracts | 0 | 0.00% | $0 | 0.00% |
| M/WBE | 0 | 0.00% | $0 | 0.00% |
| Non-Certified | 0 | 0.00% | $0 | 0.00% |
Chart 96: FY22-25 Value of LL 174-Eligible Prime Contracts and POs
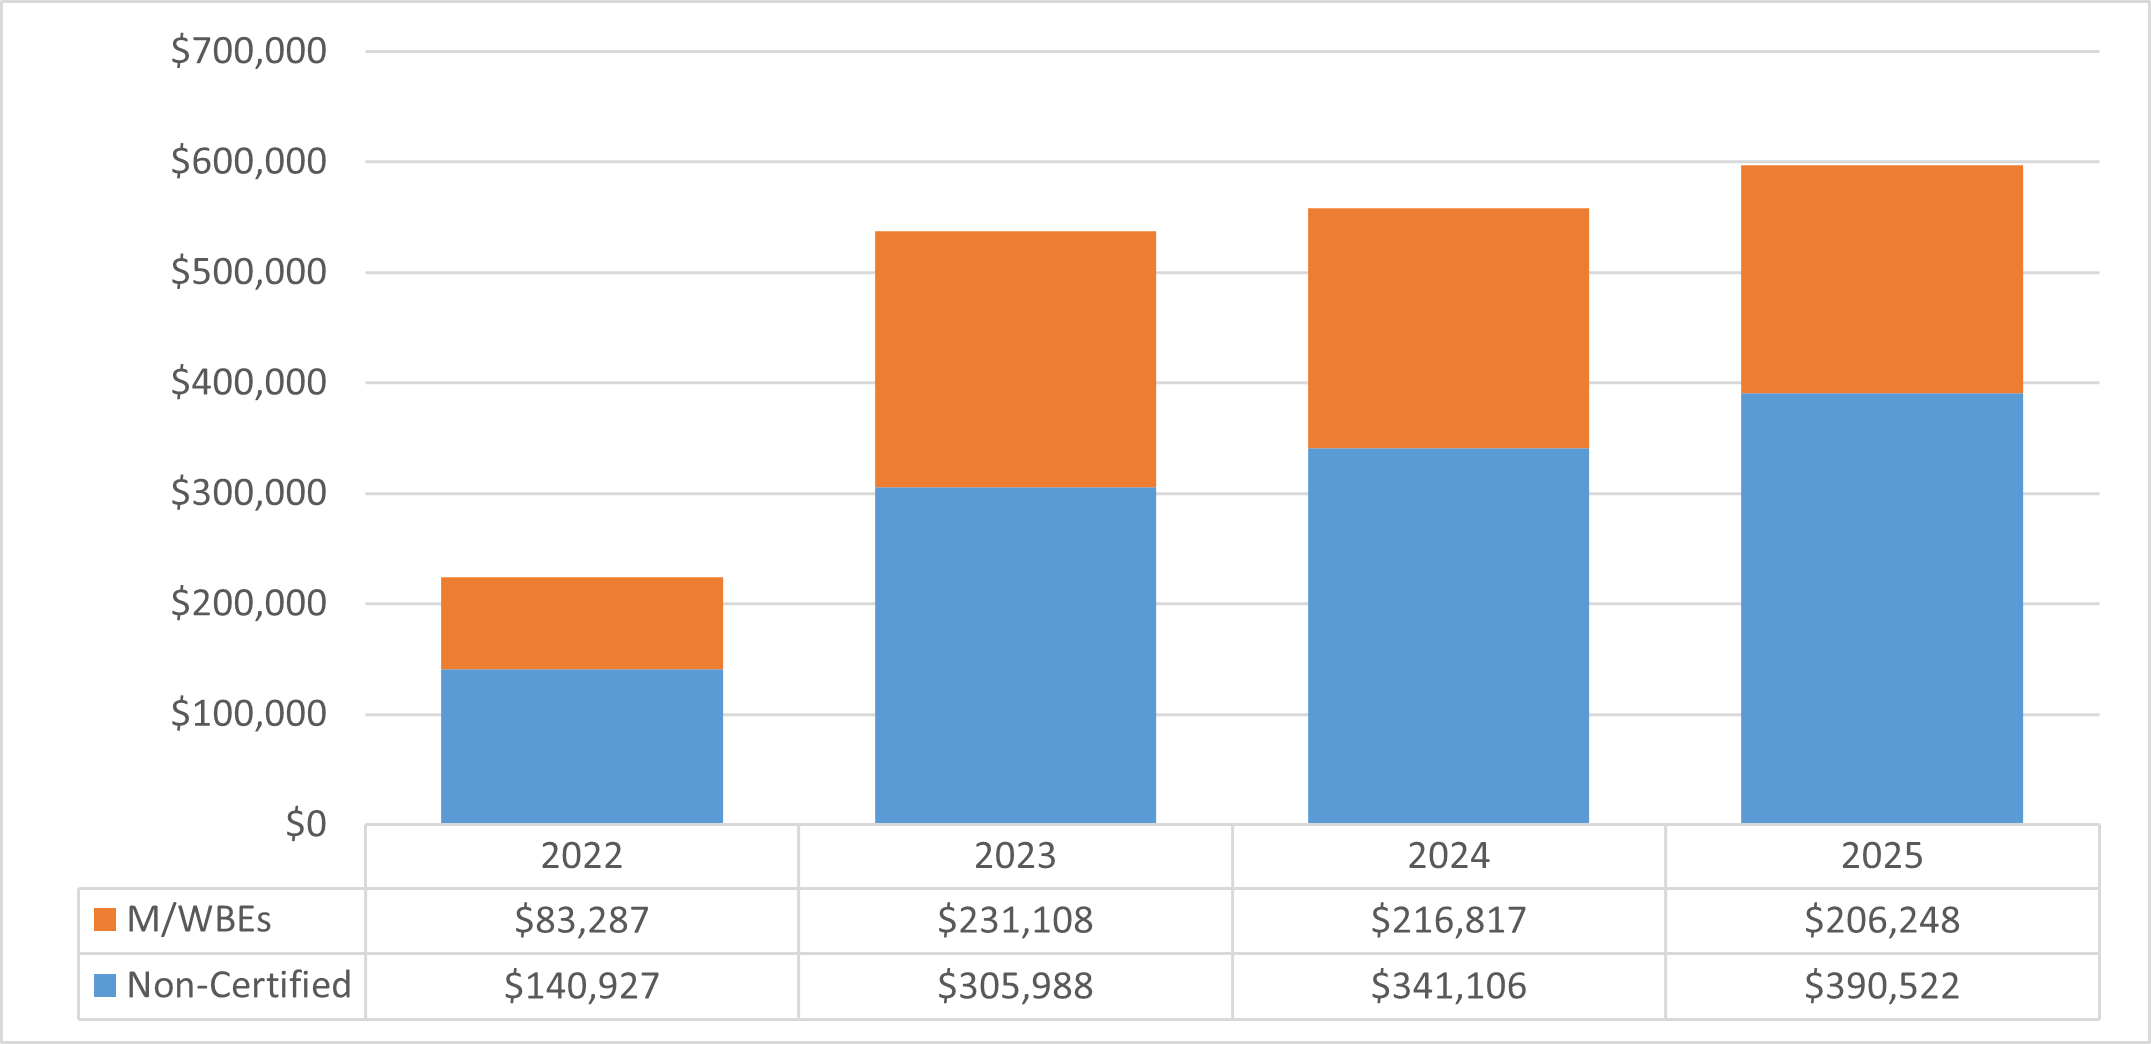
Chart 97: FY25 Value of LL 174-Eligible Contracts and POs, by Race and Gender
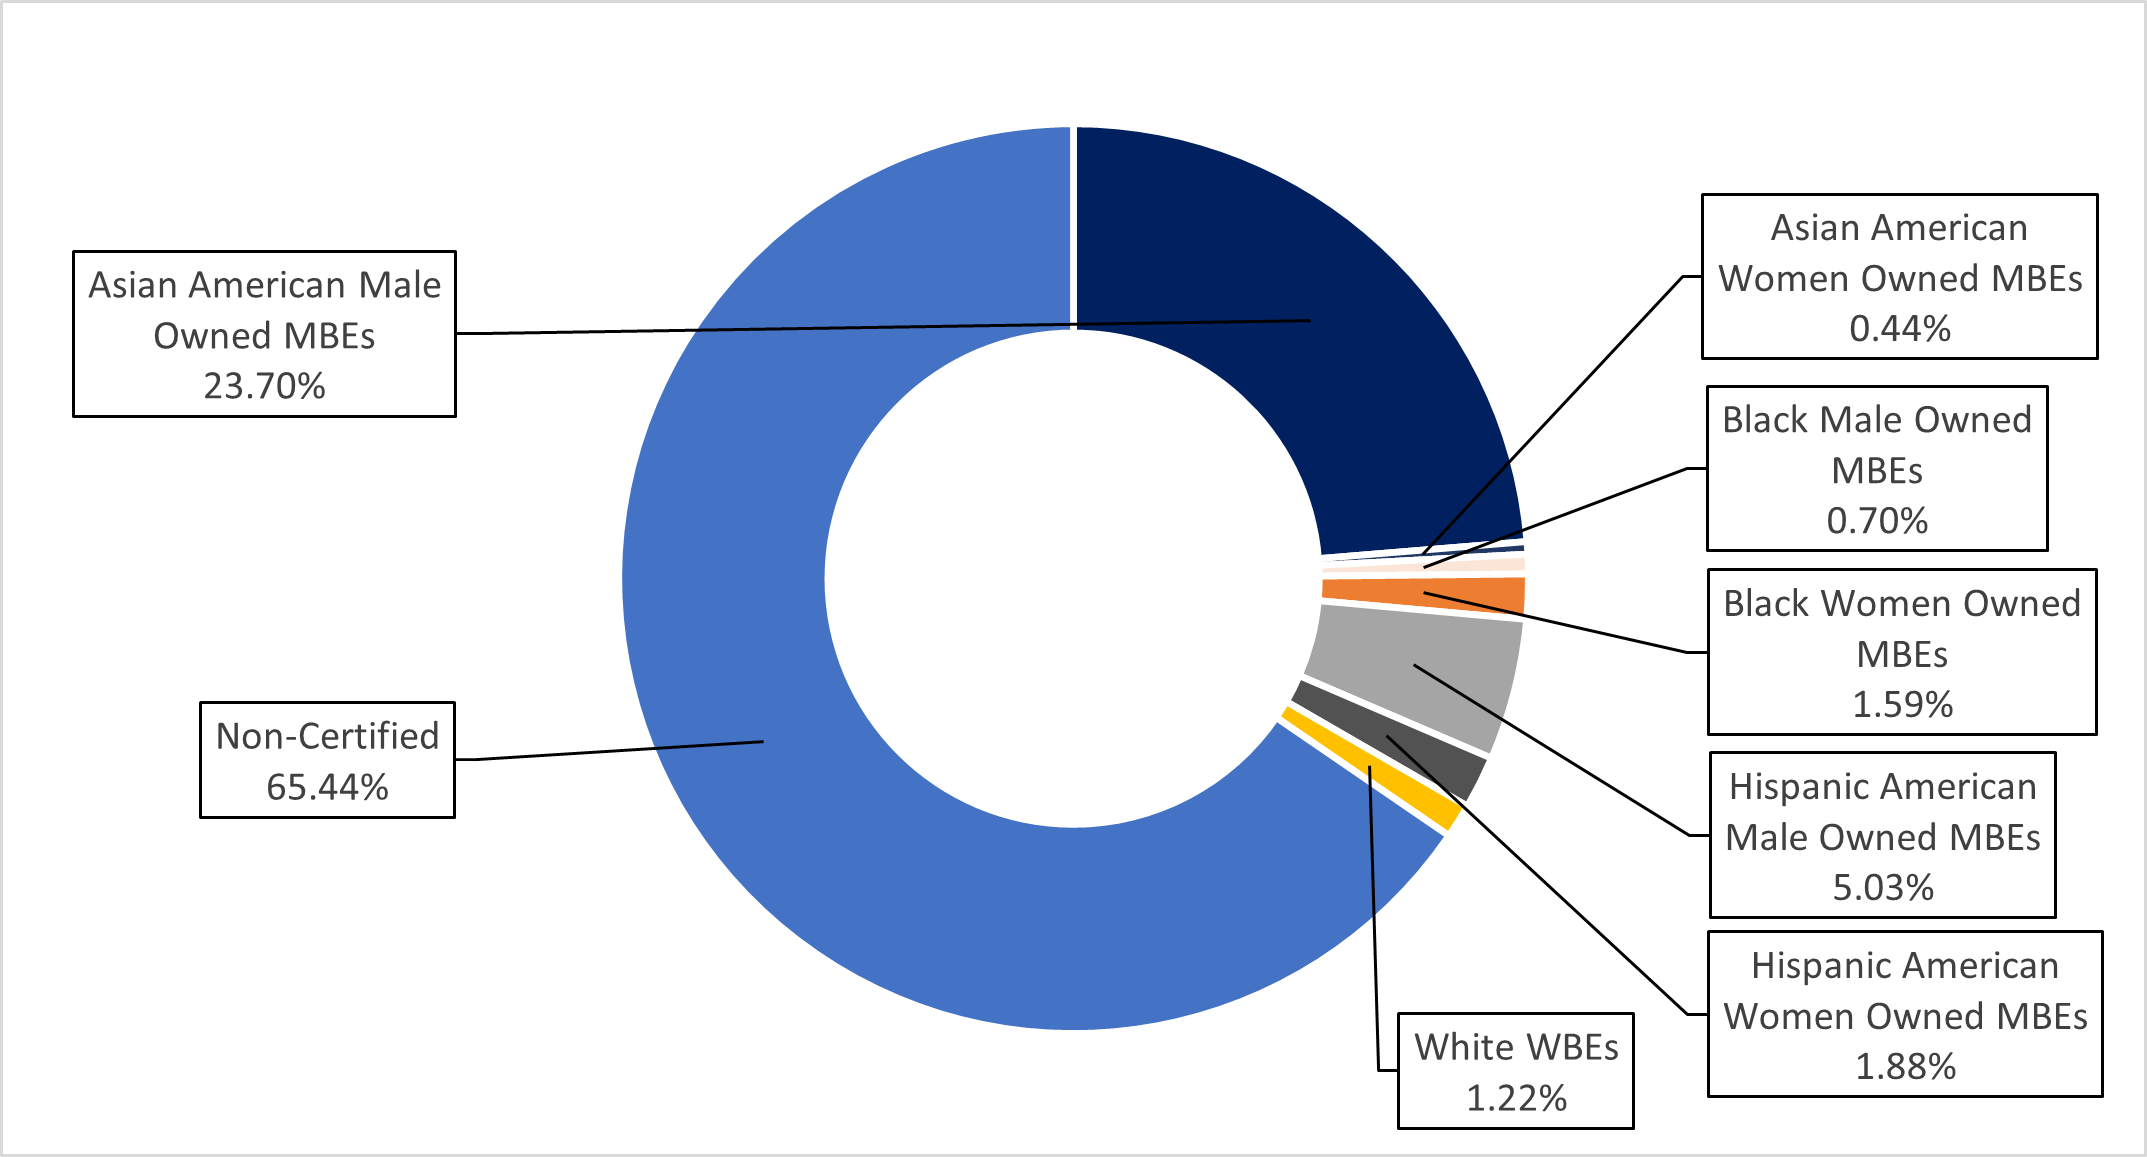
Chart 98: FY25 Share of LL 174-Eligible Contracts and PO Value, by M/WBE Category and Industry
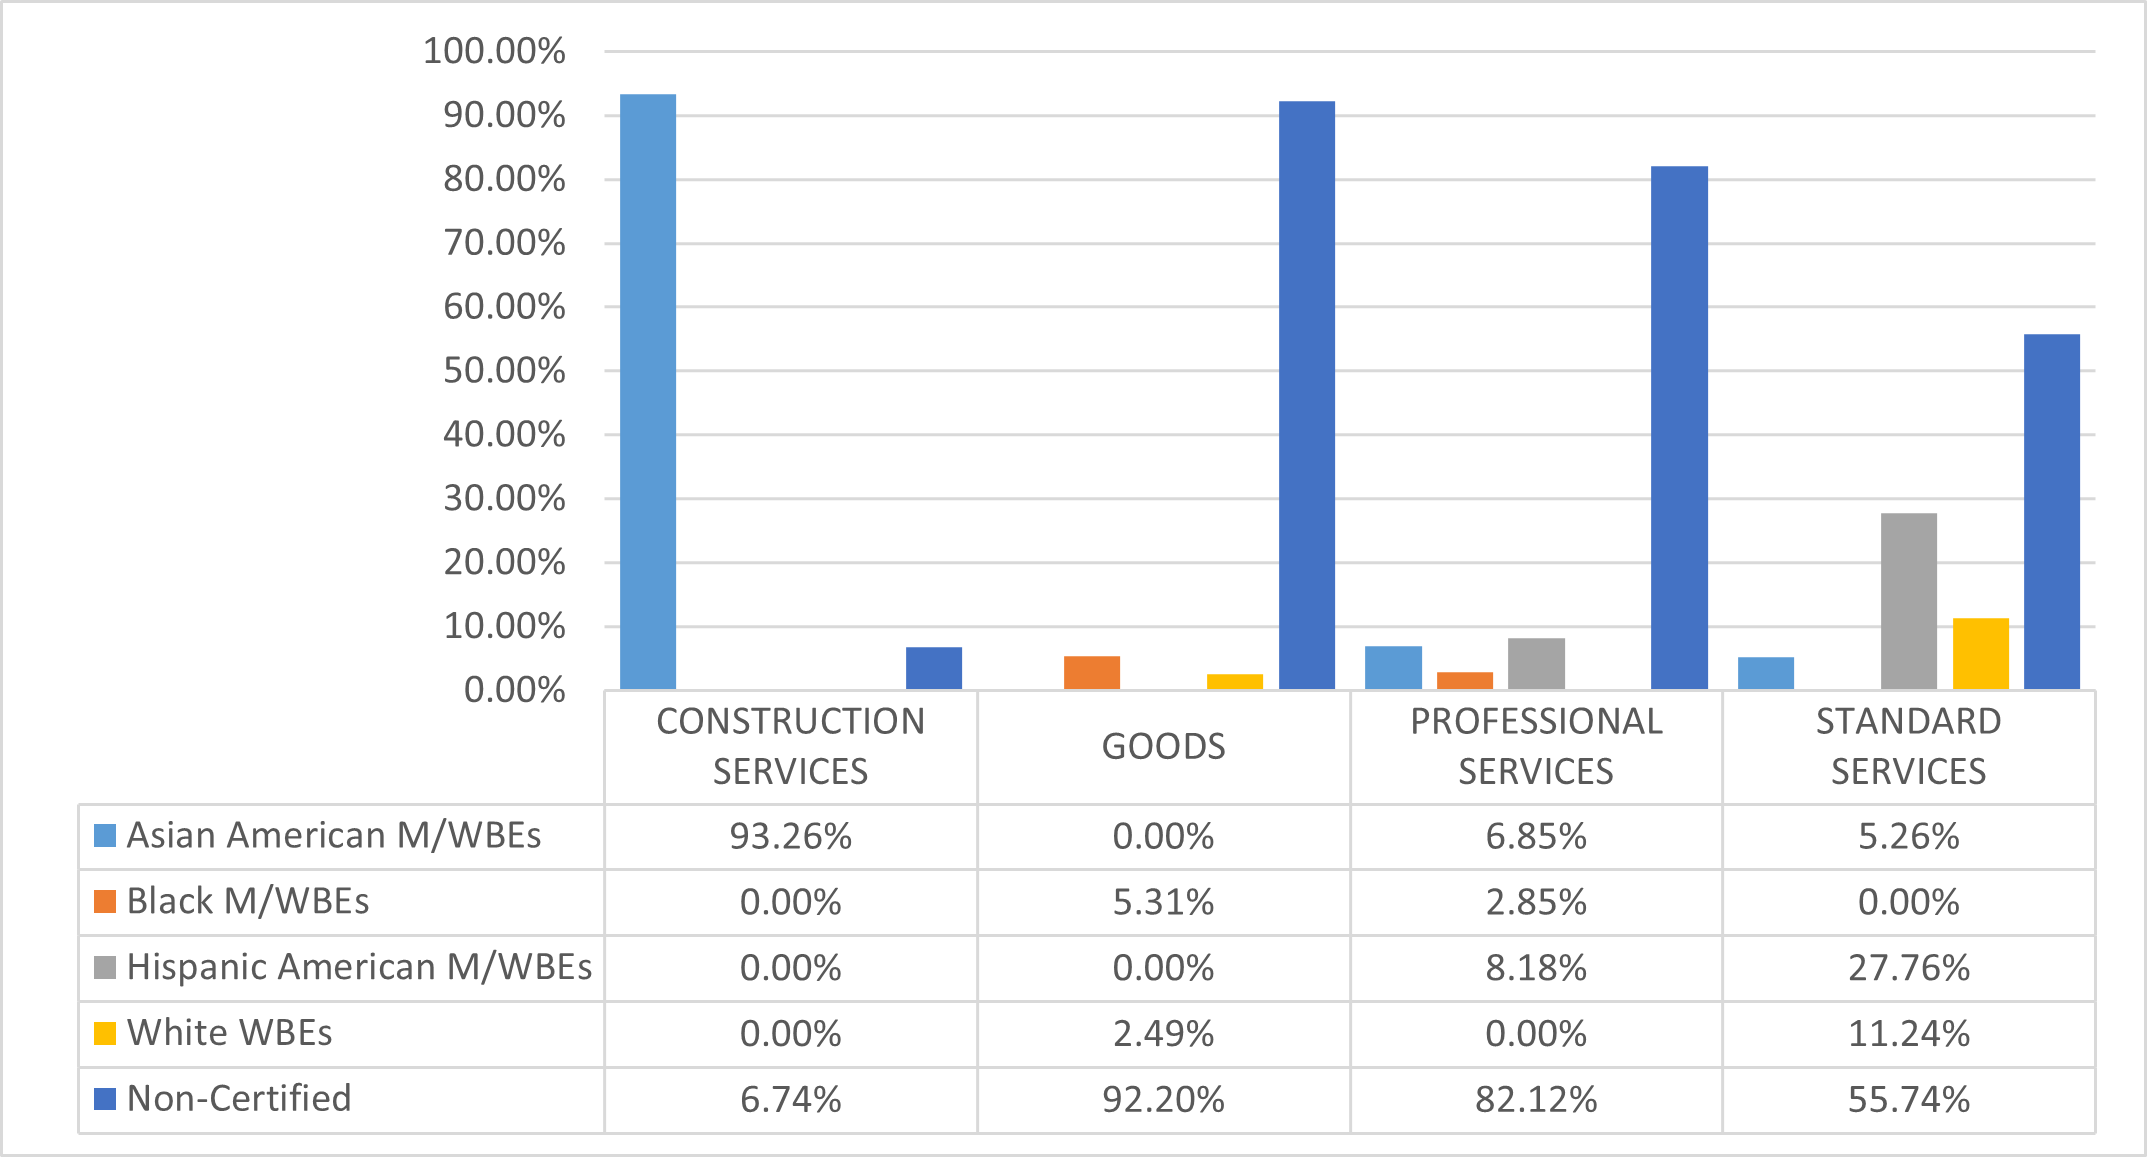
Mayoralty (MAYOR)
The LL 174 totals below represent about 40% of the Mayoralty’s total procurement portfolio, as it largely contracts with vendors for human services, which are exempt from LL 174 participation goals. Its $4.8 million in LL 174-eligible value accounts for almost 0.03% of the City’s total LL 174-eligible contracting portfolio.
Table 69: FY25 LL 174-Eligible Contracts and POs
| Certification Status | # of Contracts | % Share of Contracts | Total Registered Contract Value | % Share of Contract Value |
|---|---|---|---|---|
| All Contracts and POs | 422 | 100.00% | $13,046,157 | 100.00% |
| M/WBE | 139 | 32.94% | $3,735,968 | 28.64% |
| Non-Certified | 283 | 67.06% | $9,310,189 | 71.36% |
| LL174 Contracts and POs | 231 | 100.00% | $4,854,545 | 100.00% |
| M/WBE | 112 | 48.48% | $3,423,887 | 70.53% |
| Non-Certified | 119 | 51.52% | $1,430,658 | 29.47% |
| LL174 Subcontracts | 0 | 0.00% | $0 | 0.00% |
| M/WBE | 0 | 0.00% | $0 | 0.00% |
| Non-Certified | 0 | 0.00% | $0 | 0.00% |
Chart 99: FY22-25 Value of LL 174-Eligible Prime Contracts and POs
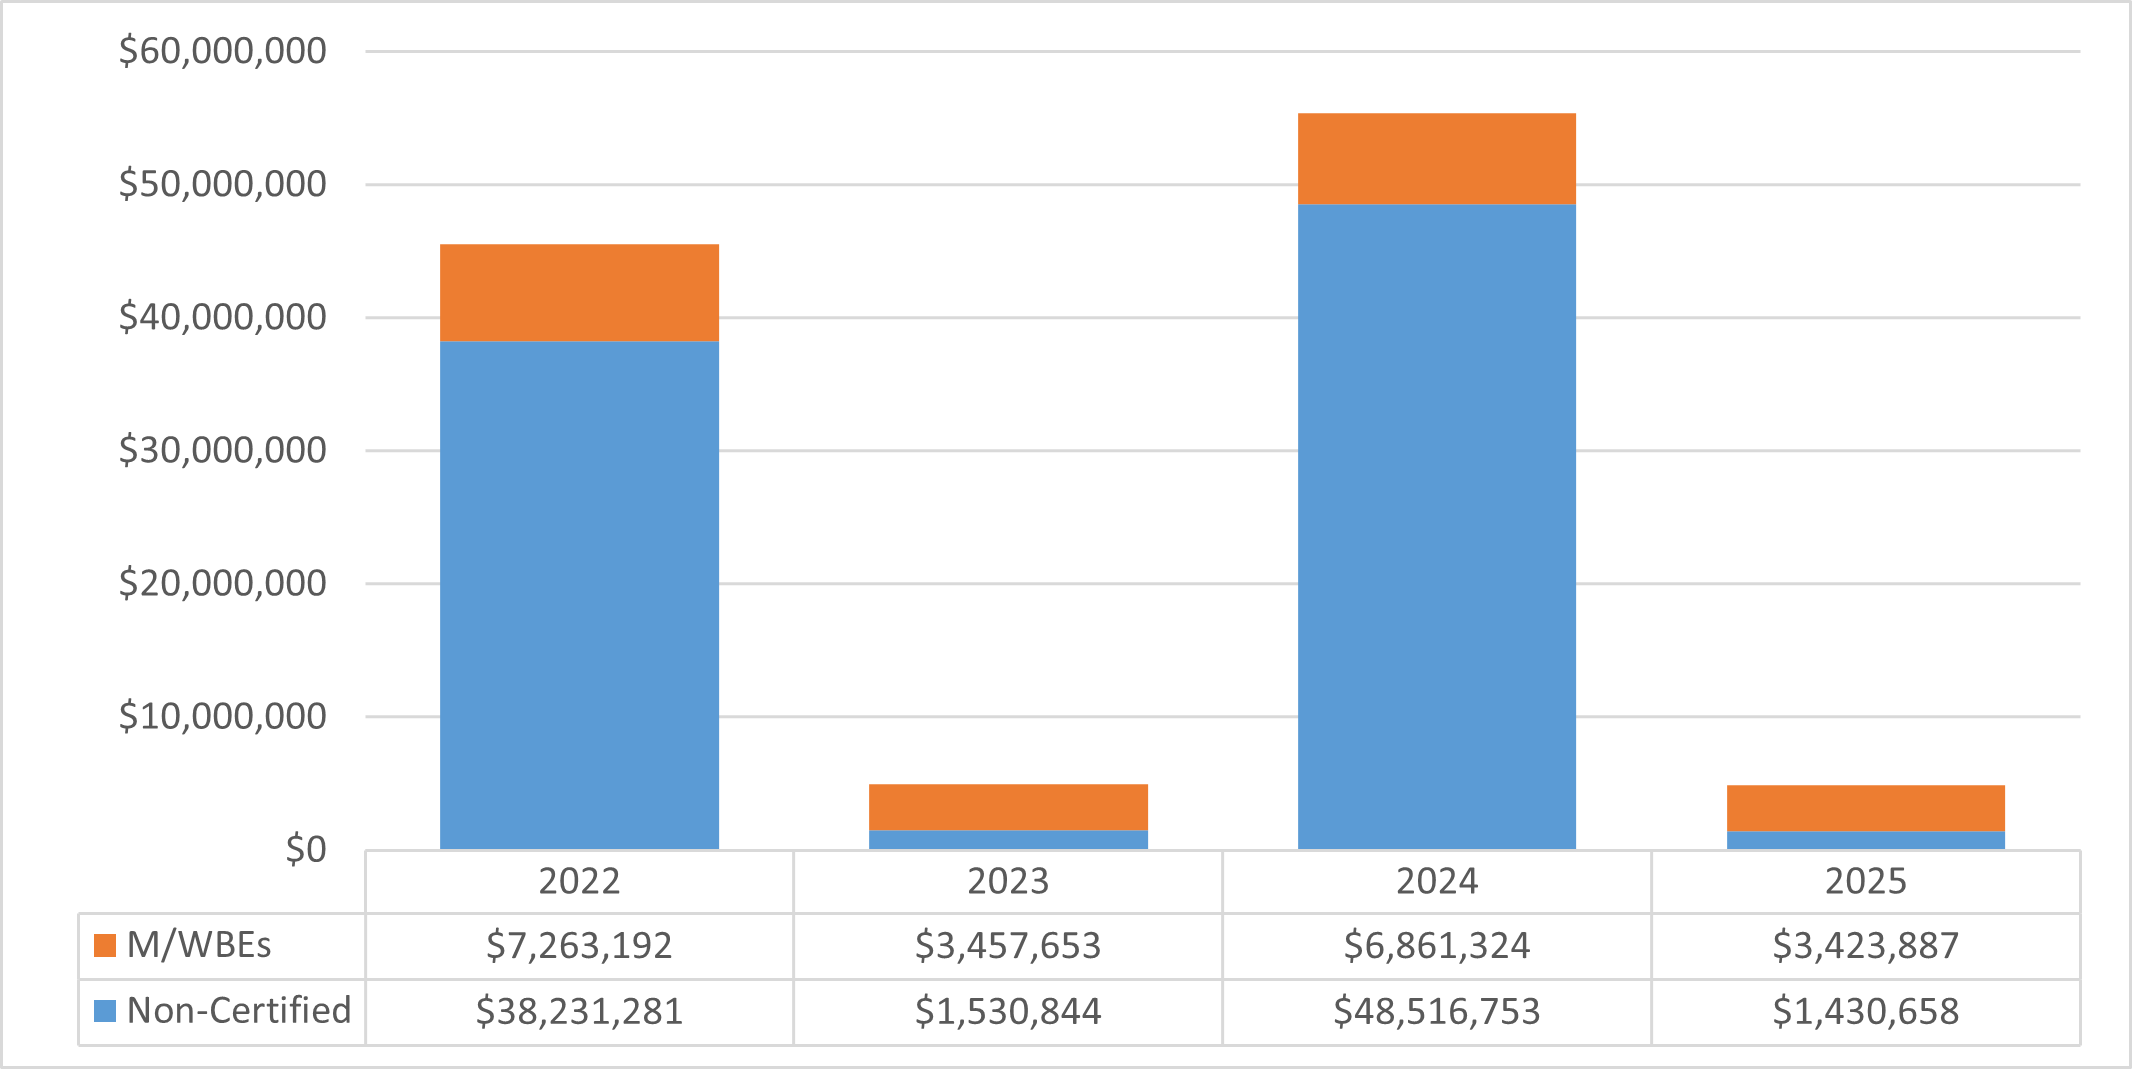
Chart 100: FY25 Value of LL 174-Eligible Contracts and POs, by Race and Gender
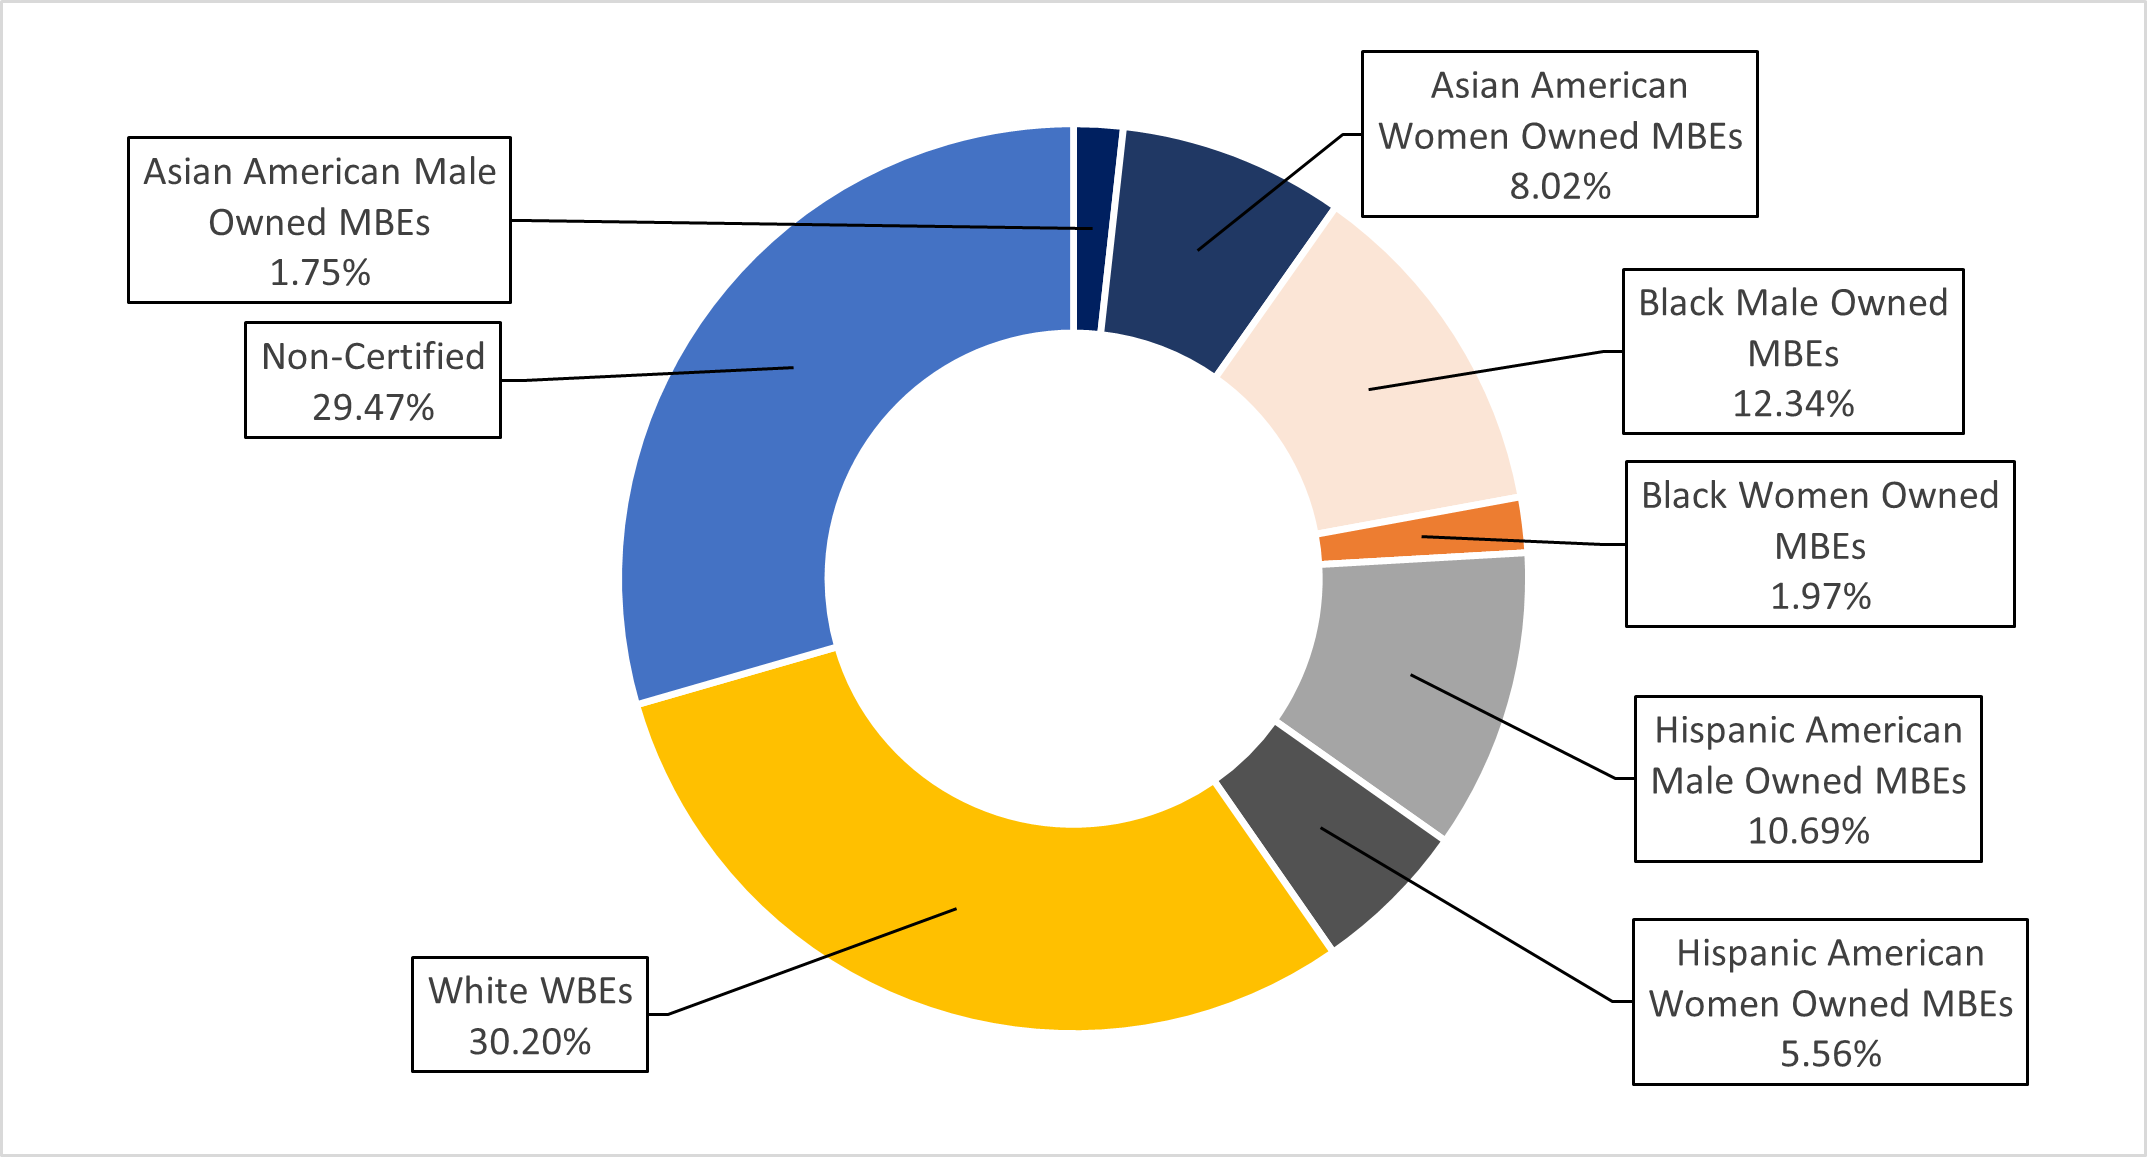
Chart 101: FY25 Share of LL 174-Eligible Contracts and PO Value, by M/WBE Category and Industry
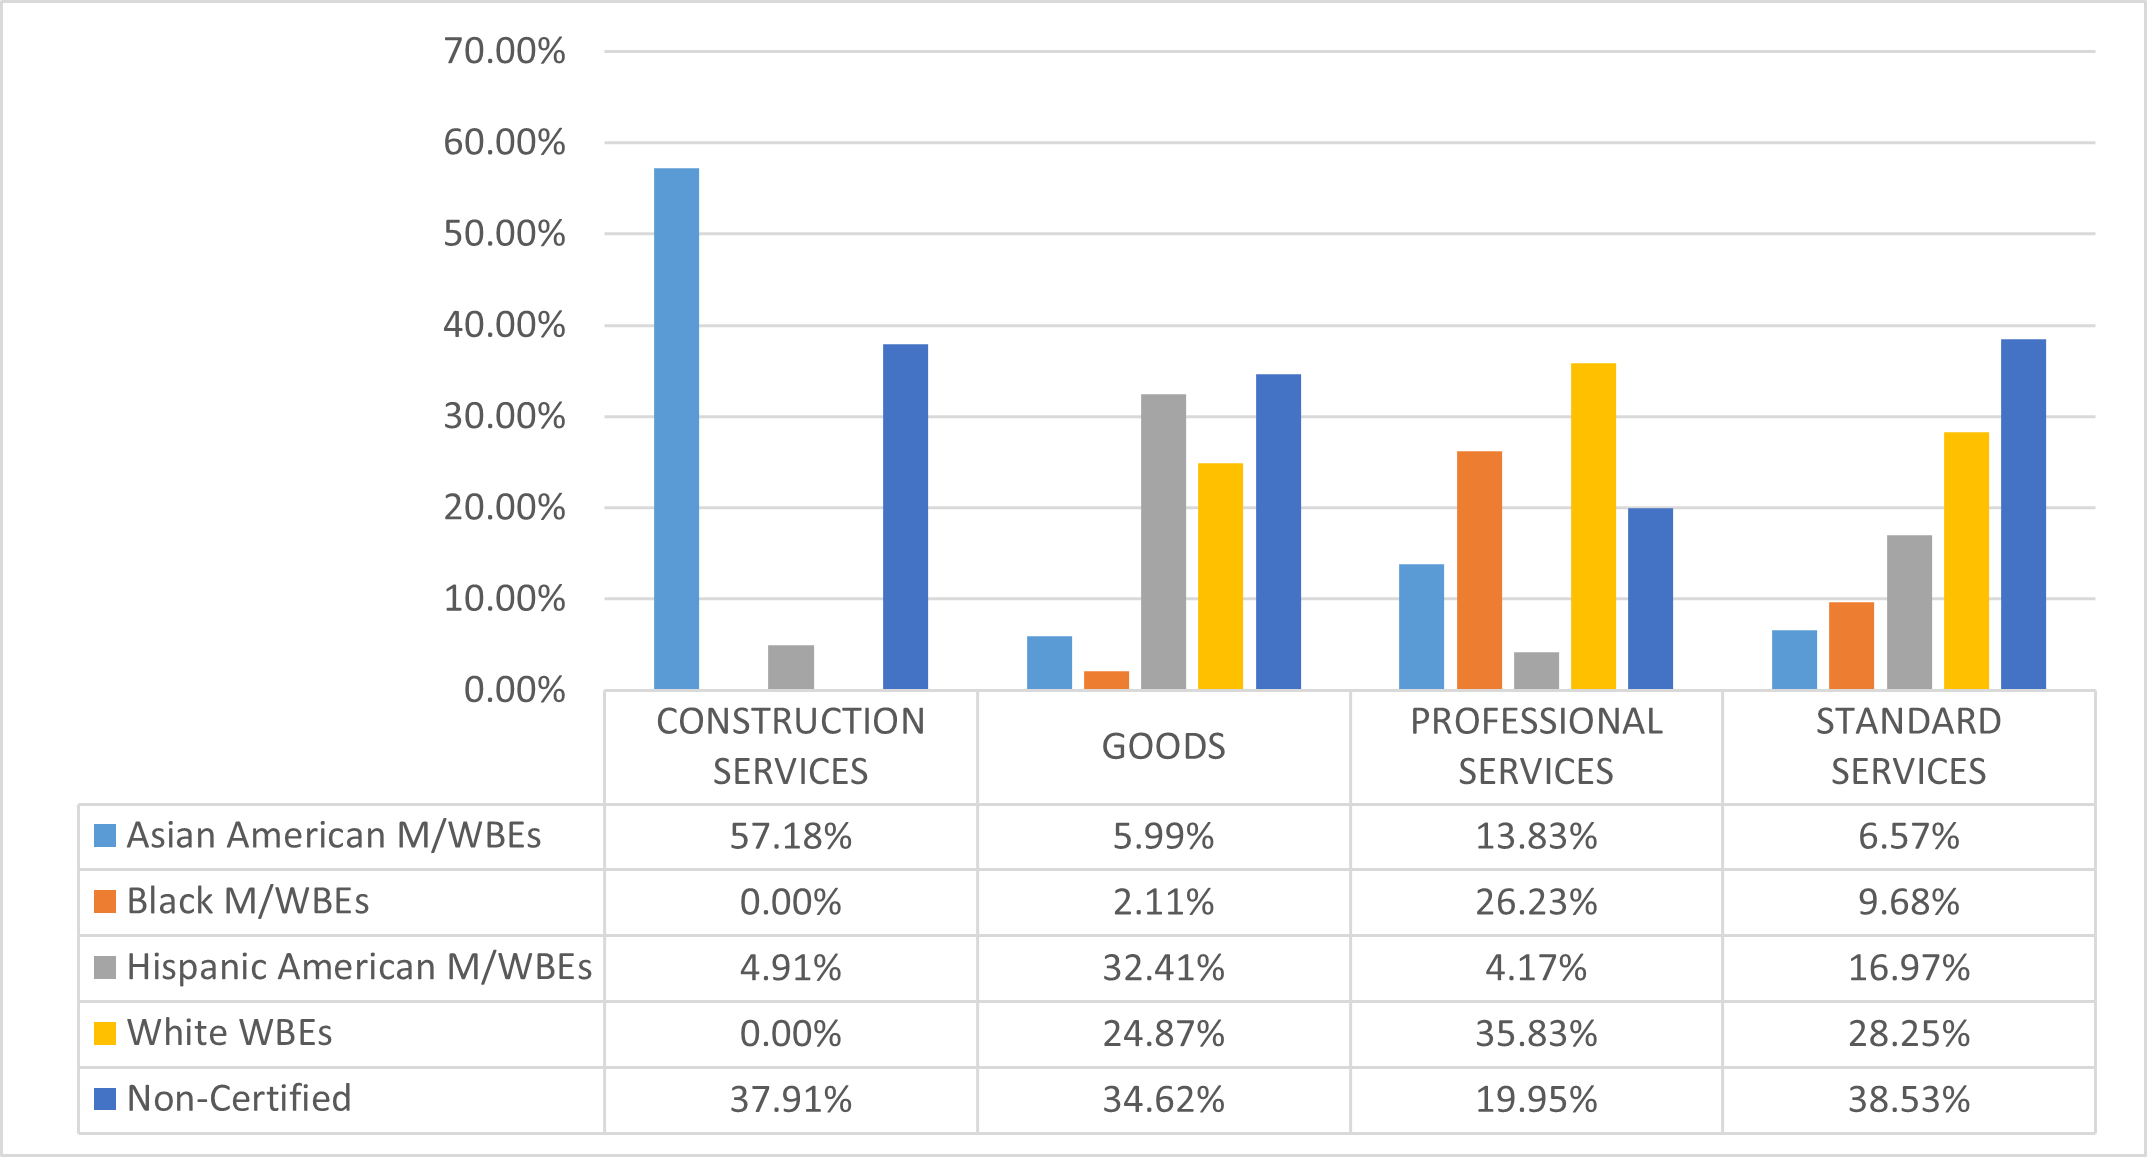
NYC Office of Emergency Management (NYCEM)
The LL 174 totals below here represent a relatively small share of NYCEM’s total procurement portfolio, as NYCEM manages high-value Emergency procurements which are exempt from LL 174 participation goals. Its $6.2 million in LL 174-eligible value accounts for 0.03% of the City’s total LL 174-eligible contracting portfolio.
Table 70: FY25 LL 174-Eligible Contracts and POs
| Certification Status | # of Contracts | % Share of Contracts | Total Registered Contract Value | % Share of Contract Value |
|---|---|---|---|---|
| All Contracts and POs | 365 | 100.00% | $213,974,234 | 100.00% |
| M/WBE | 138 | 37.81% | $19,102,338 | 8.93% |
| Non-Certified | 227 | 62.19% | $194,871,897 | 91.07% |
| LL174 Contracts and POs | 312 | 100.00% | $6,249,161 | 100.00% |
| M/WBE | 129 | 41.35% | $4,991,038 | 79.87% |
| Non-Certified | 183 | 58.65% | $1,258,124 | 20.13% |
| LL174 Subcontracts | 0 | 0.00% | $0 | 0.00% |
| M/WBE | 0 | 0.00% | $0 | 0.00% |
| Non-Certified | 0 | 0.00% | $0 | 0.00% |
Chart 102: FY22-25 Value of LL 174-Eligible Prime Contracts and POs
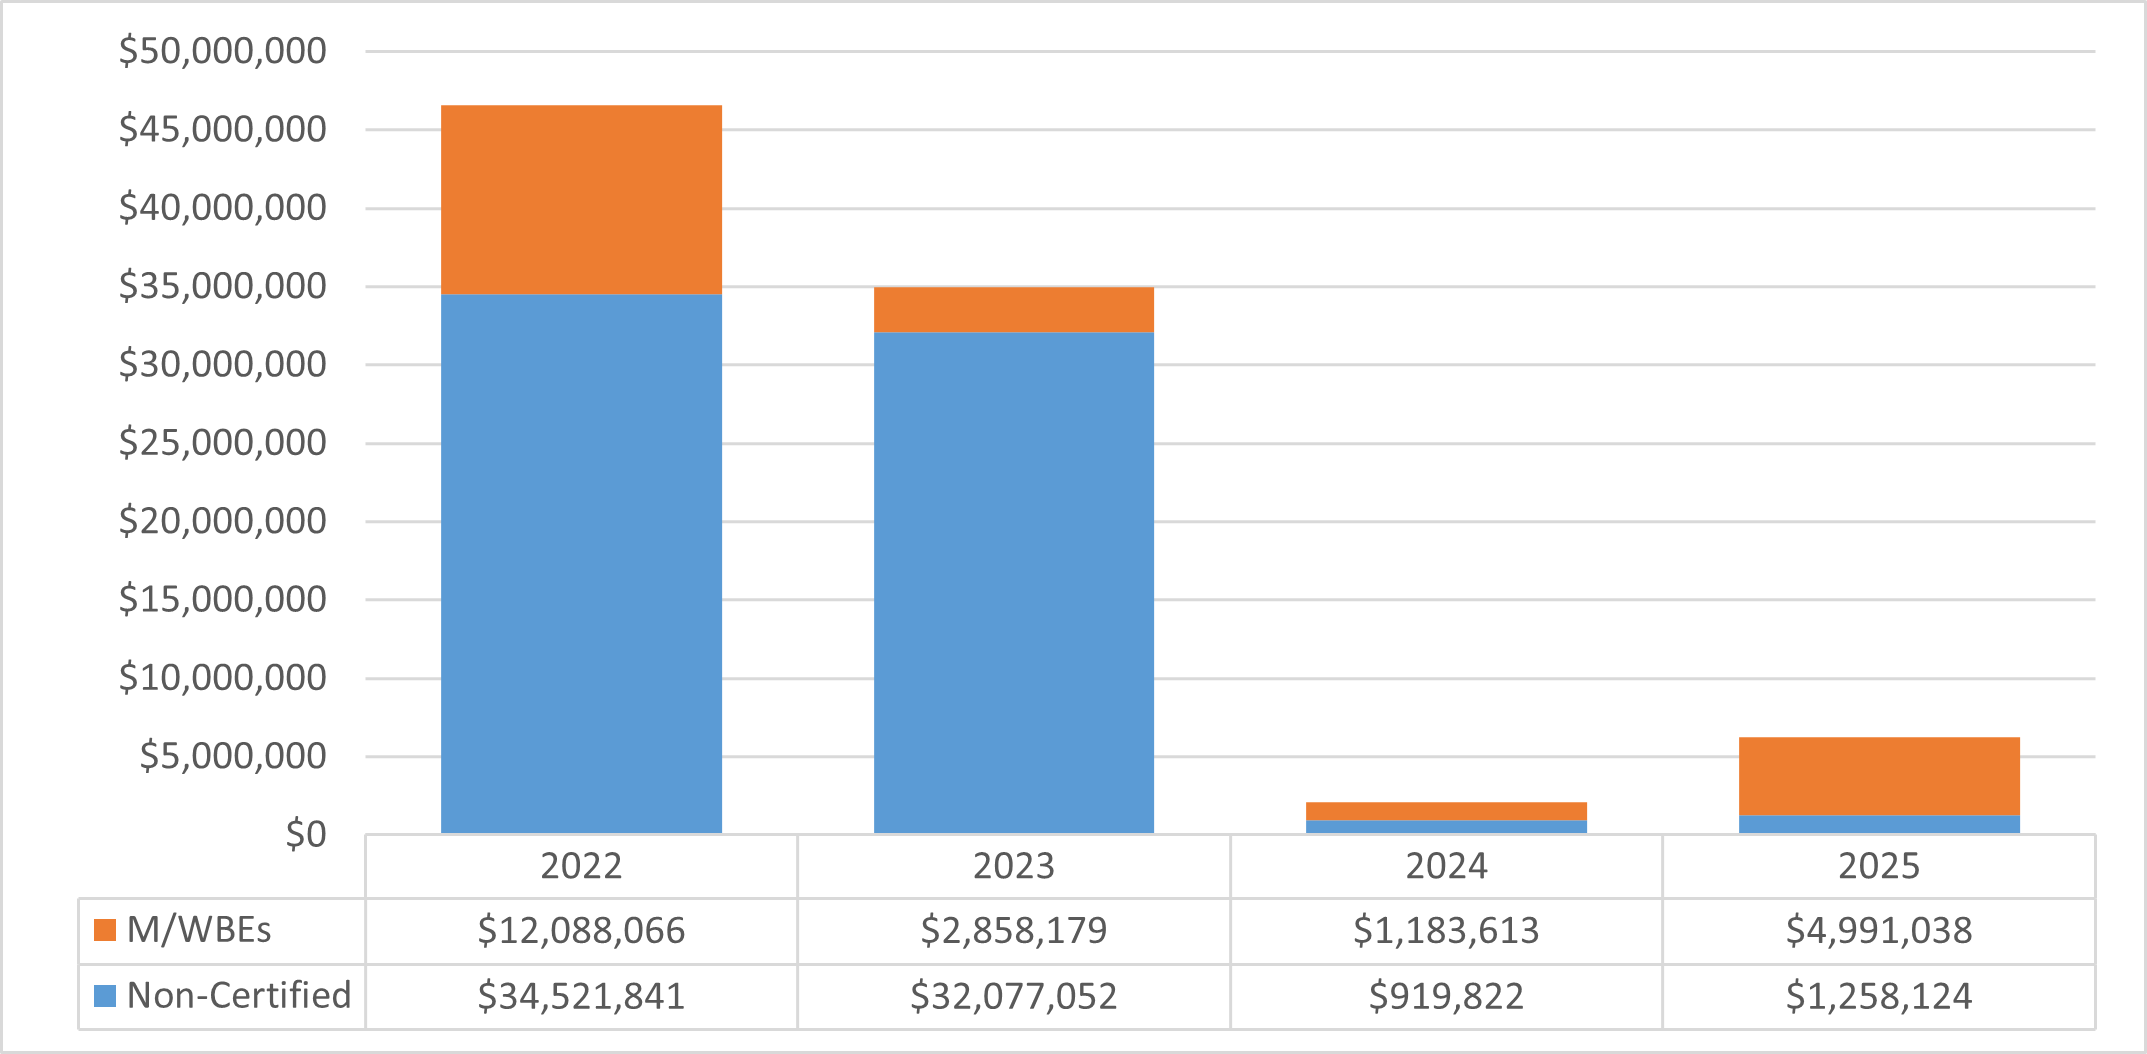
Chart 103: FY25 Value of LL 174-Eligible Contracts and POs, by Race and Gender
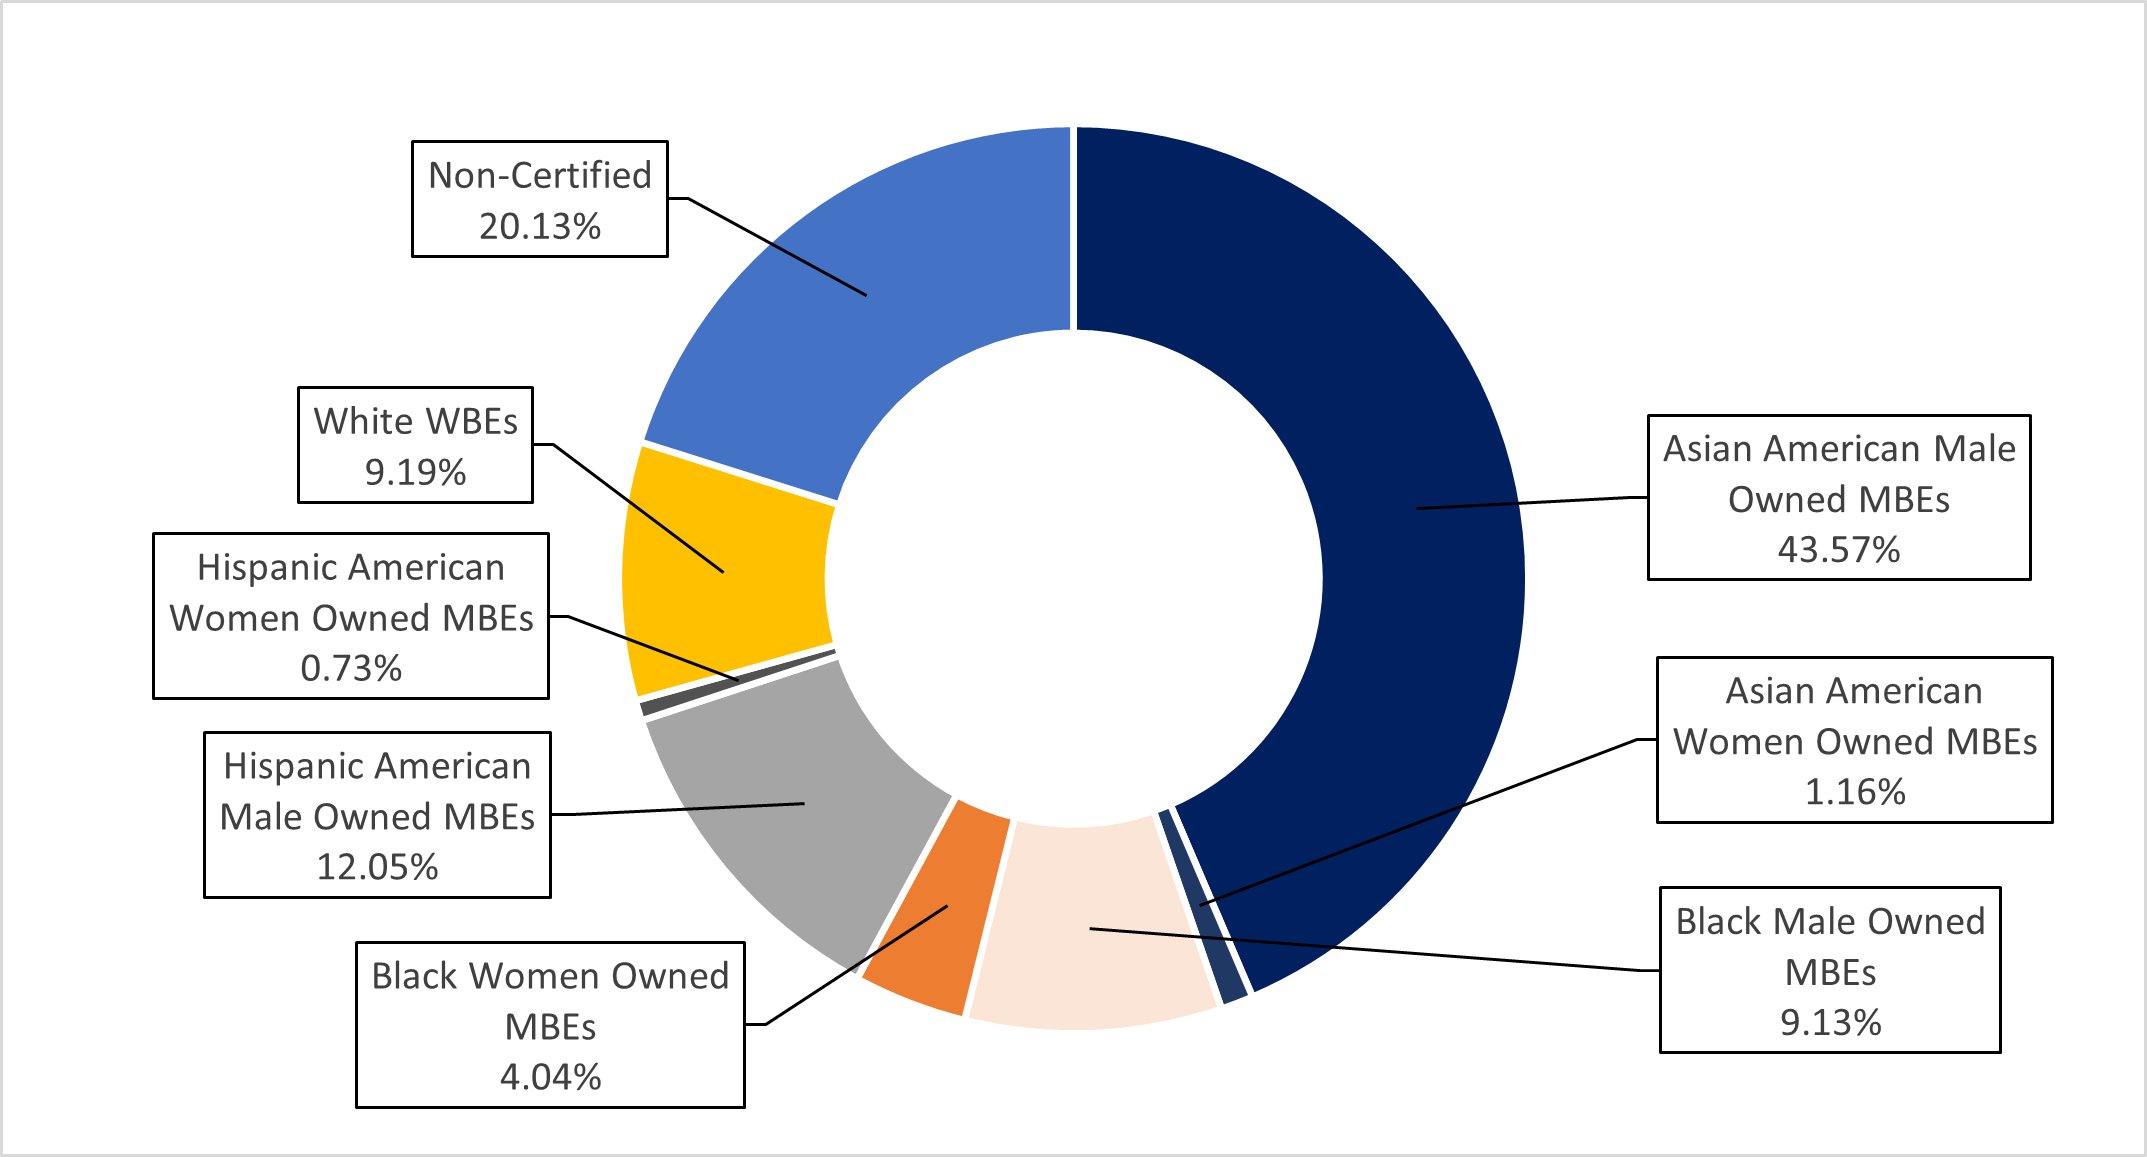
Chart 104: FY25 Share of LL 174-Eligible Contracts and PO Value, by M/WBE Category and Industry
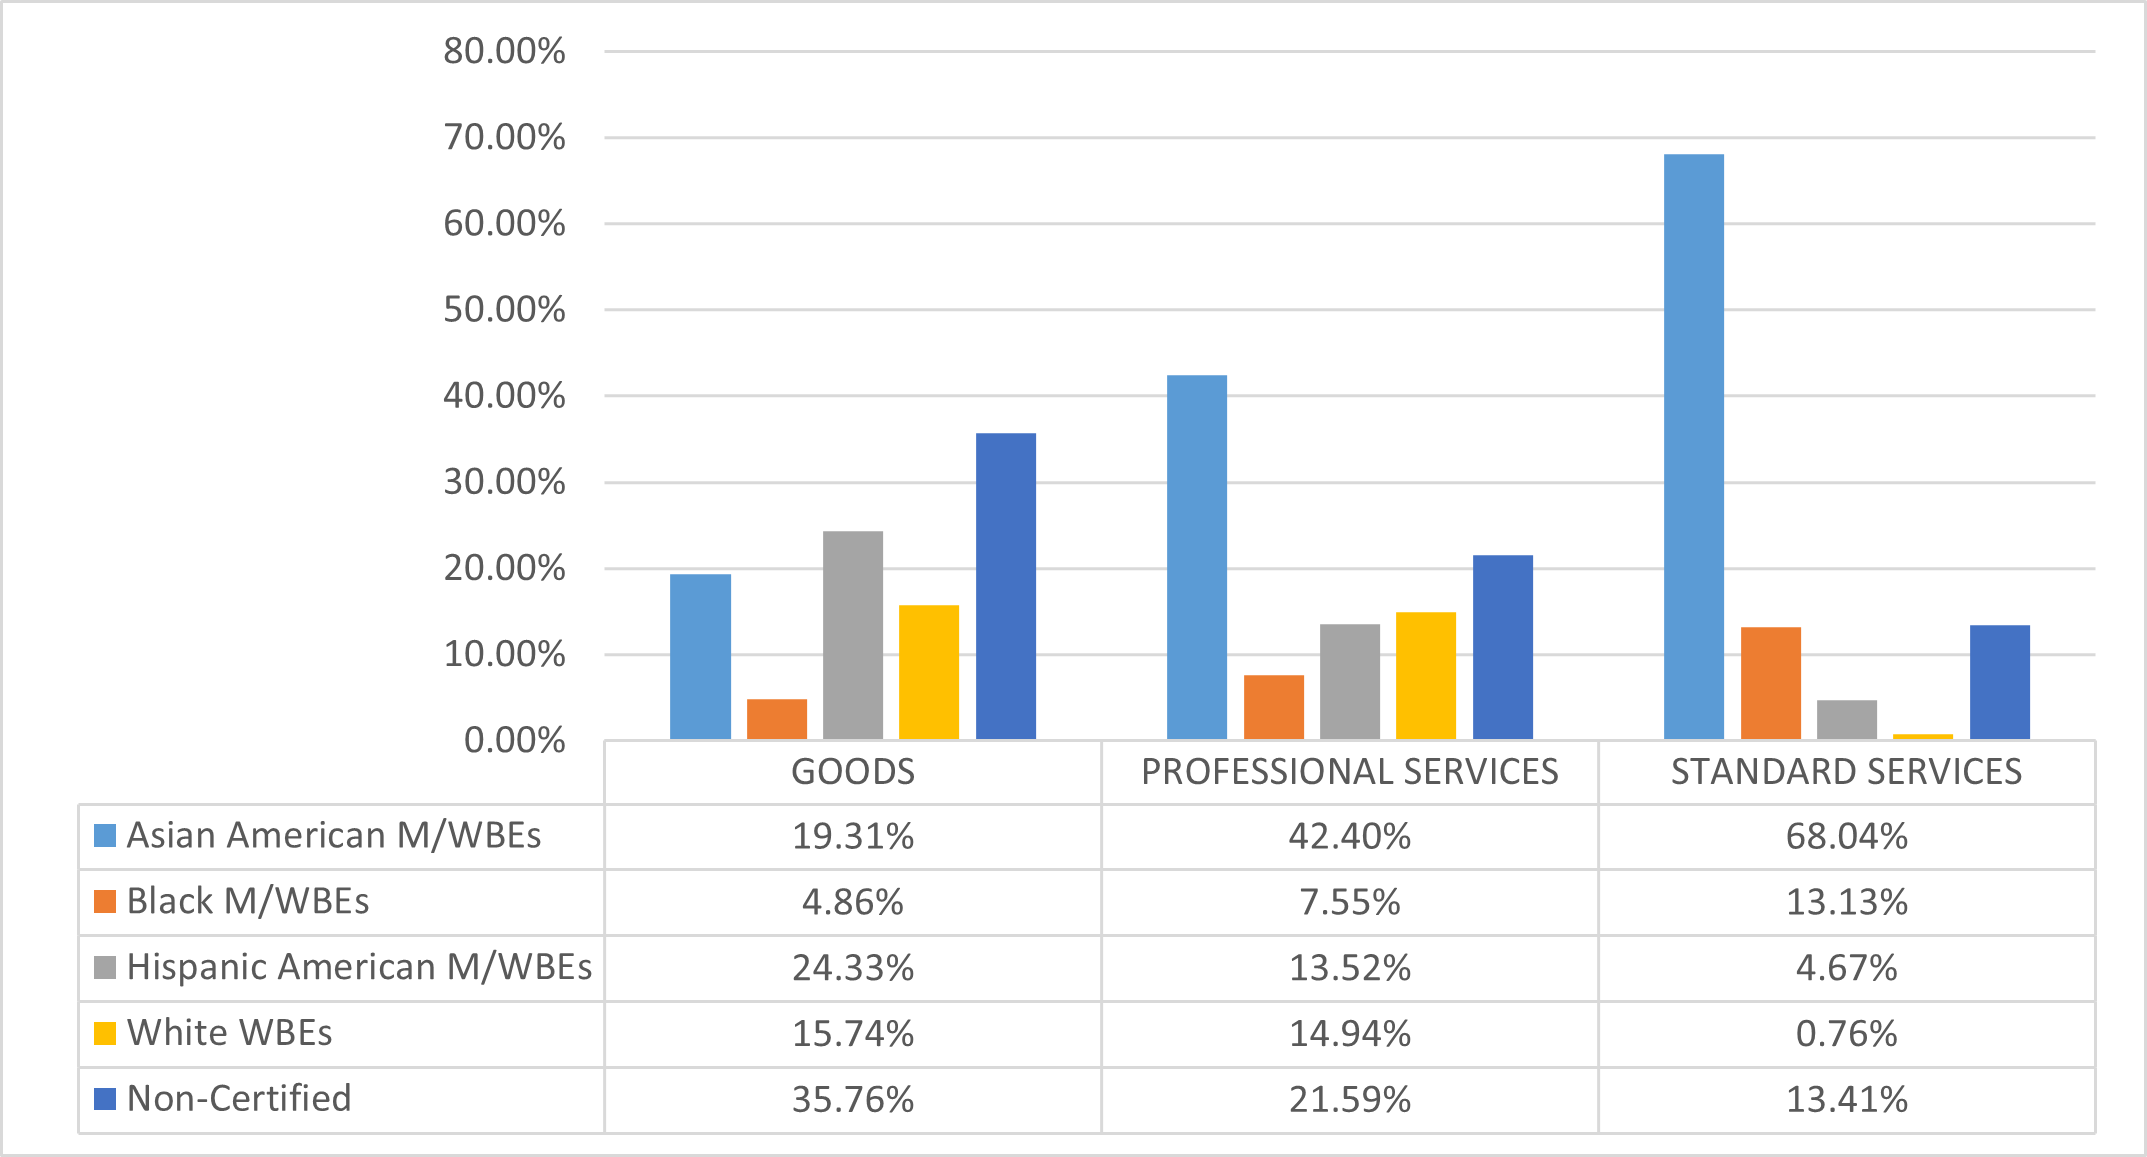
New York Police Department (NYPD)
Less than 20% of NYPD’s FY25 procurement portfolio was subject to LL 174 participation goals. The LL 174 data below does not include Renewals, which accounted for a large share of NYPD’s FY25 procurement portfolio. NYPD’s $30.4 million in LL 174-eligible value accounts for about 0.2% of the City’s total LL 174-eligible contracting portfolio.
Table 71: FY25 LL 174-Eligible Contracts and POs
| Certification Status | # of Contracts | % Share of Contracts | Total Registered Contract Value | % Share of Contract Value |
|---|---|---|---|---|
| All Contracts and POs | 3,009 | 100.00% | $175,825,788 | 100.00% |
| M/WBE | 1,014 | 33.70% | $28,385,846 | 16.14% |
| Non-Certified | 1,995 | 66.30% | $147,439,942 | 83.86% |
| LL174 Contracts and POs | 2,893 | 100.00% | $30,410,134 | 100.00% |
| M/WBE | 1,009 | 34.88% | $14,830,507 | 48.77% |
| Non-Certified | 1,884 | 65.12% | $15,579,627 | 51.23% |
| LL174 Subcontracts | 0 | 0.00% | $0 | 0.00% |
| M/WBE | 0 | 0.00% | $0 | 0.00% |
| Non-Certified | 0 | 0.00% | $0 | 0.00% |
Chart 105: FY22-25 Value of LL 174-Eligible Prime Contracts and POs
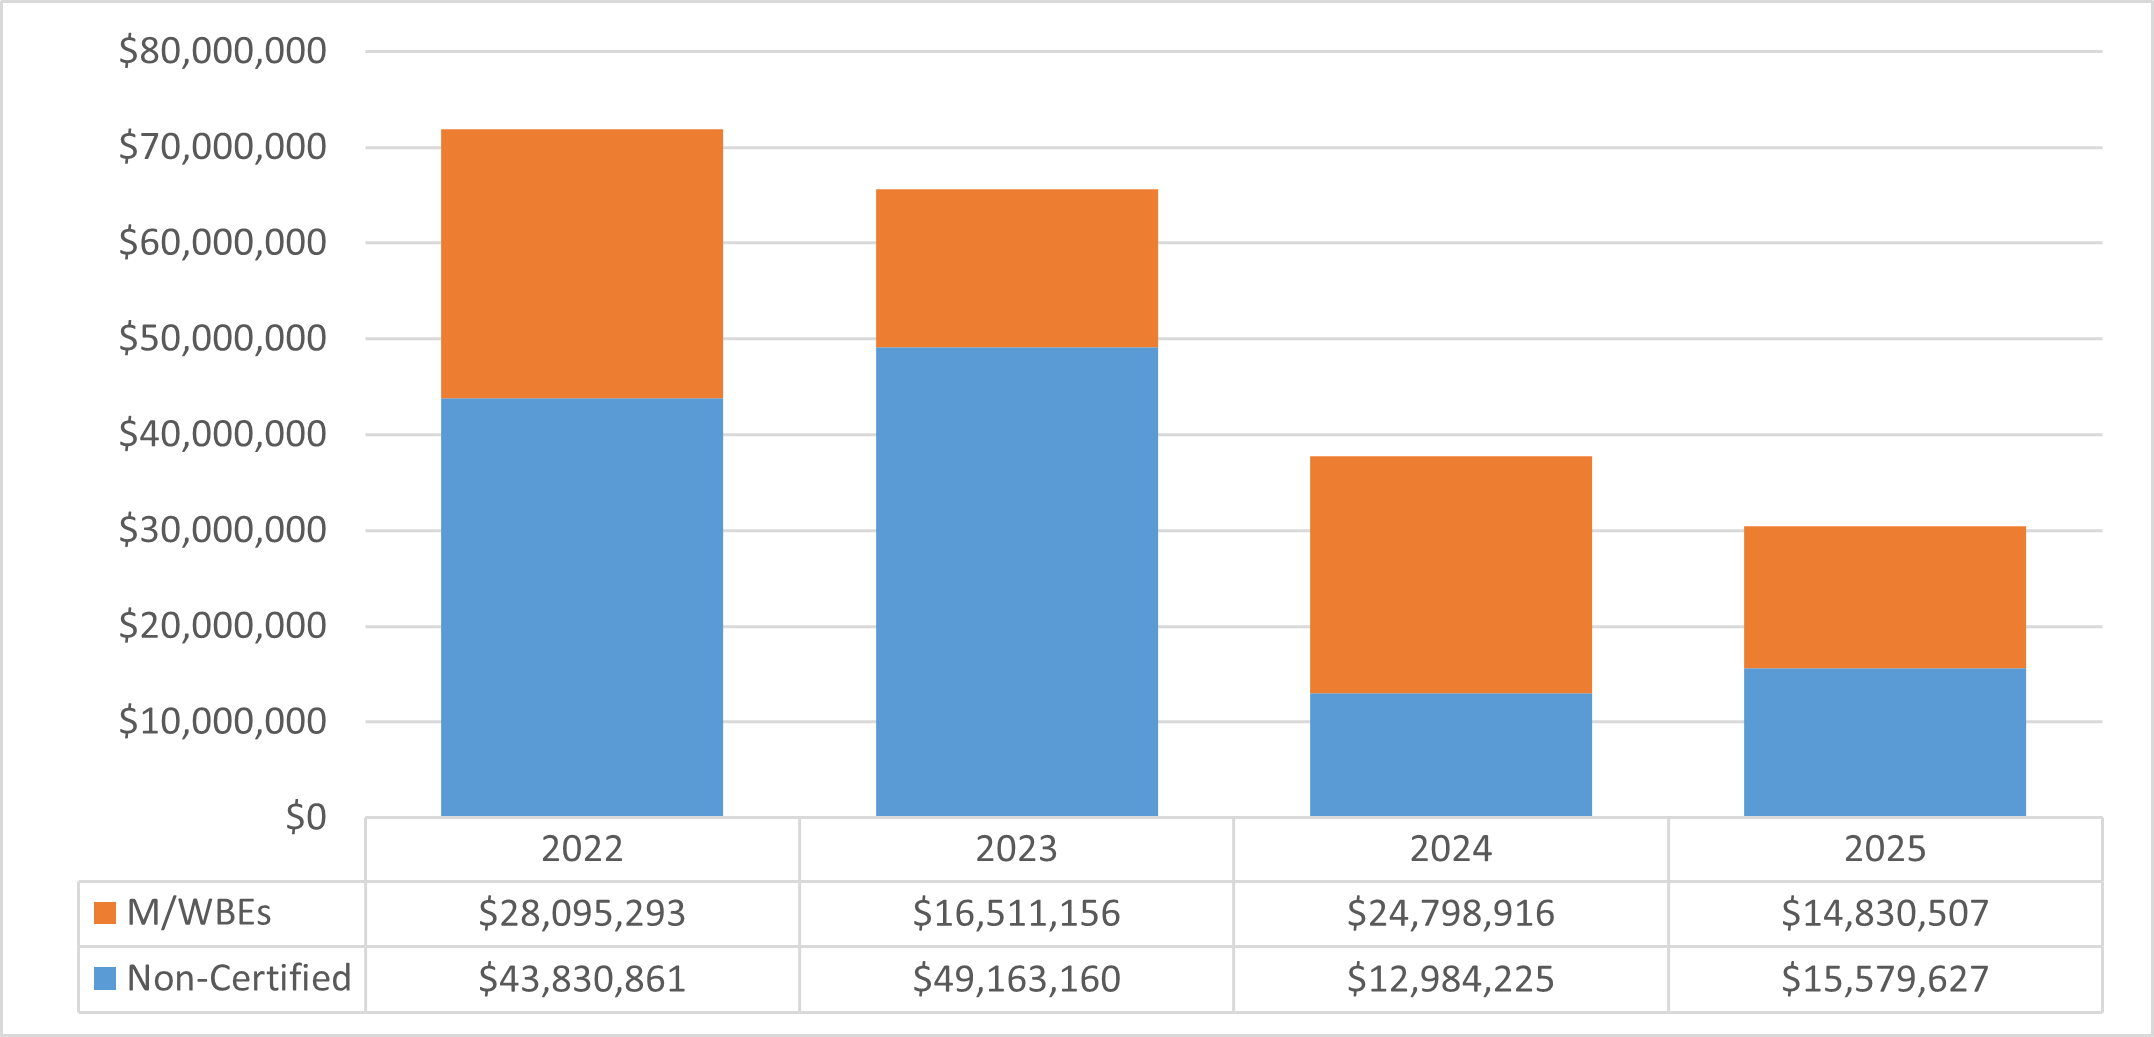
Chart 106: FY25 Value of LL 174-Eligible Contracts and POs, by Race and Gender
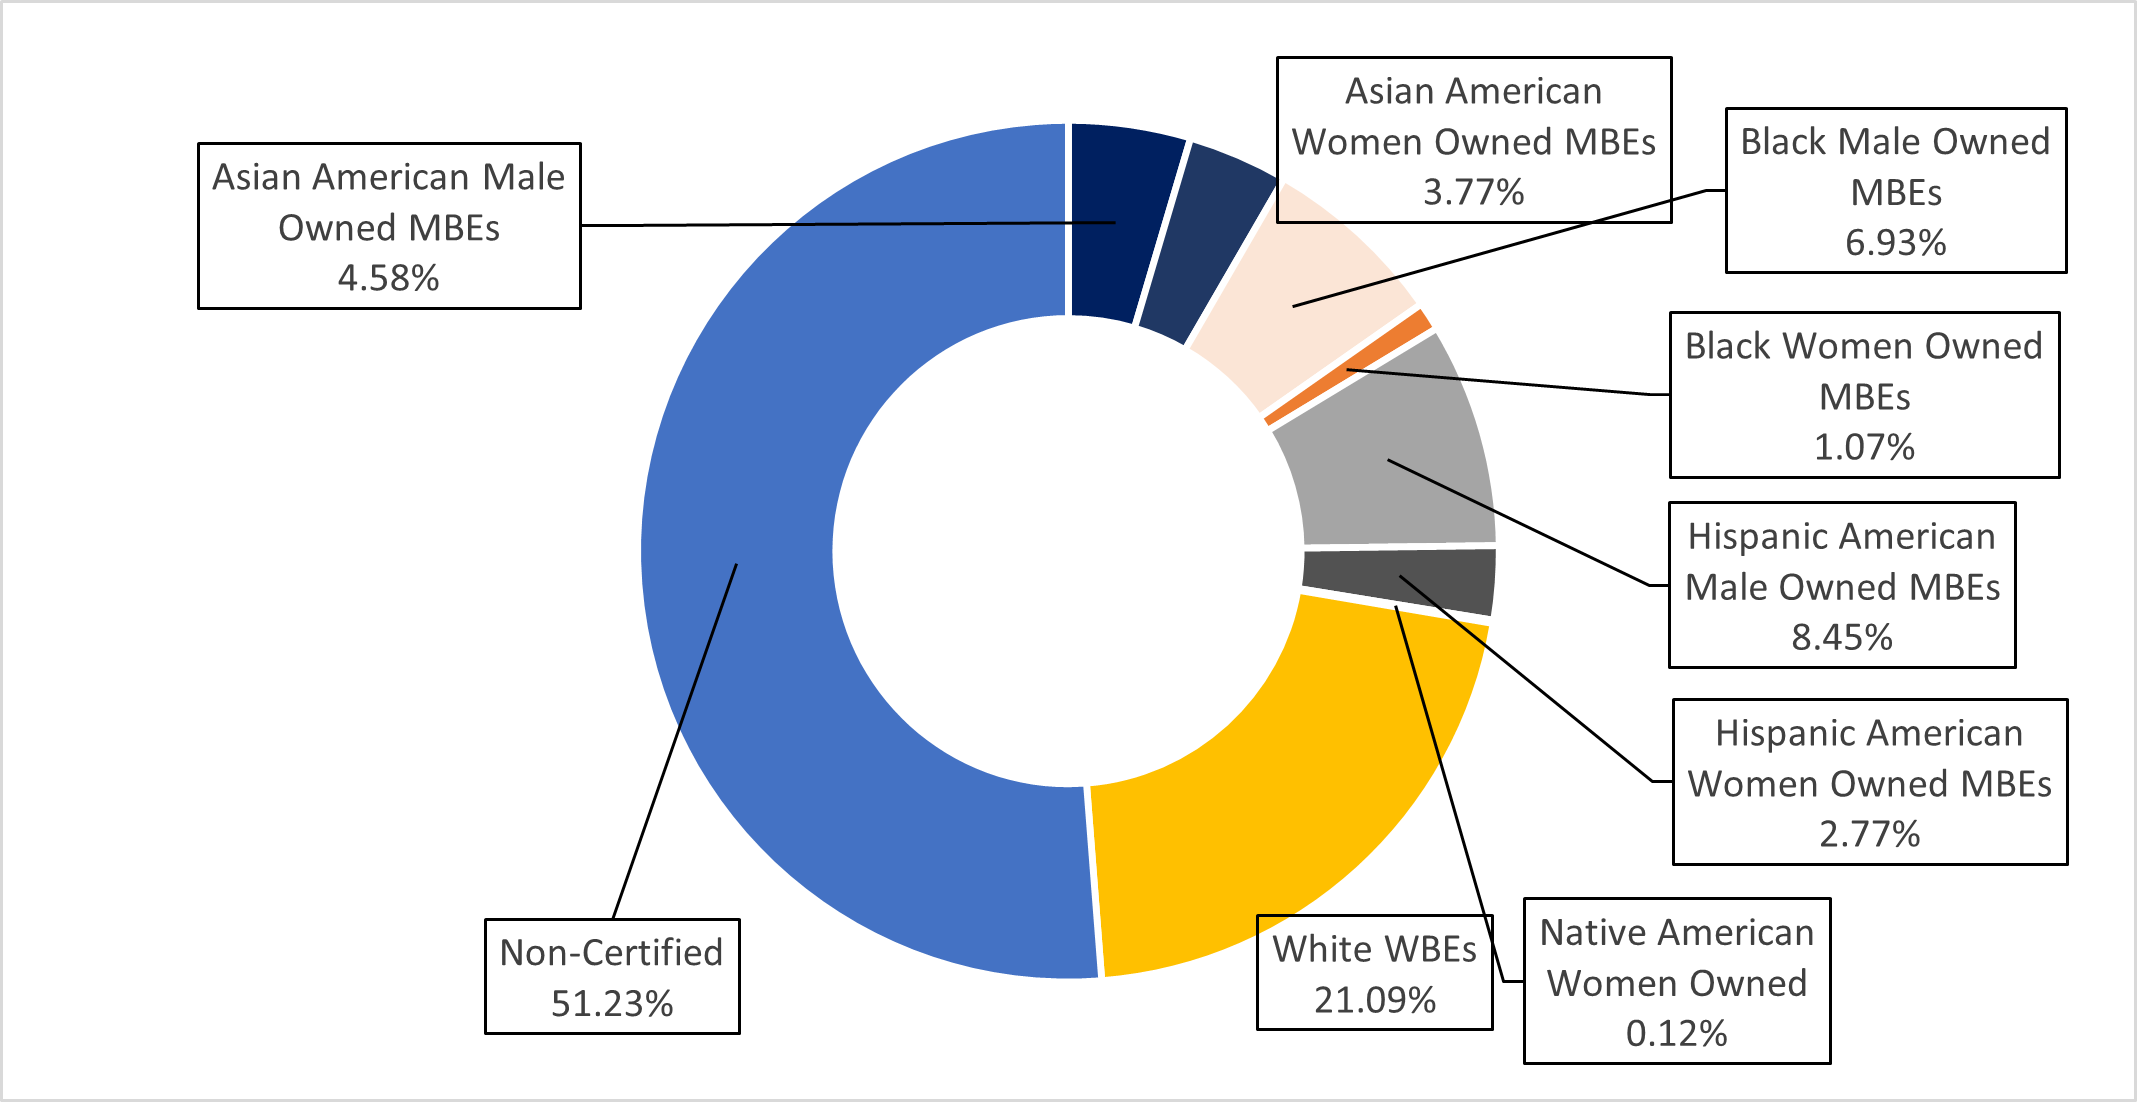
Chart 107: FY25 Share of LL 174-Eligible Contracts and PO Value by M/WBE Category and Industry
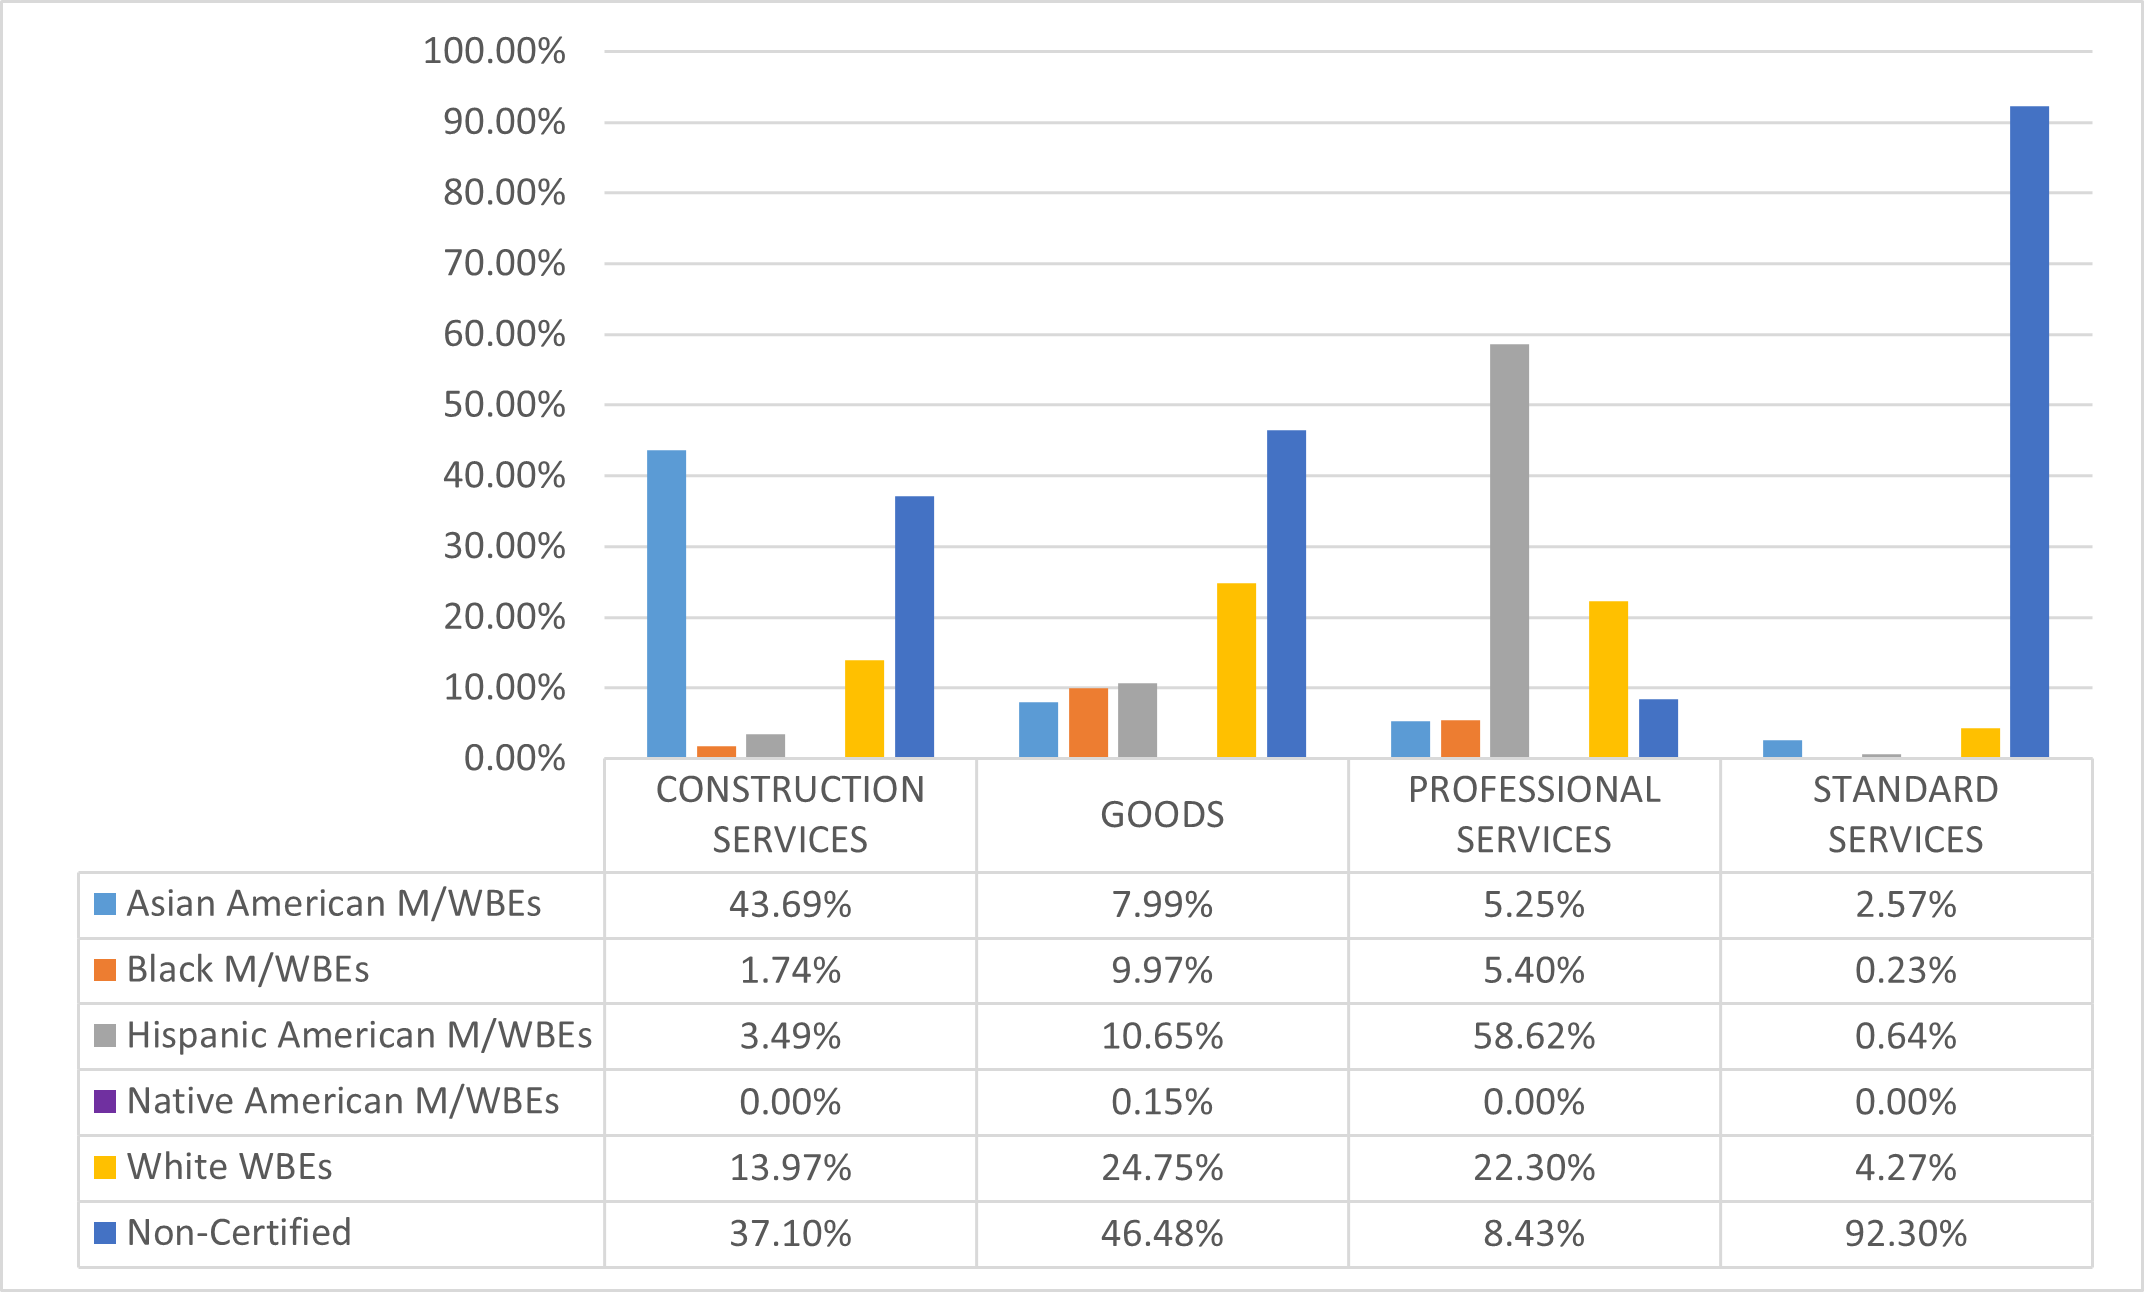
Office of Administrative Trials and Hearings (OATH)
About 10% of OATH’s procurement portfolio was subject to LL 174 participation goals in FY25. In FY25 OATH registered valuable contracts via the Intergovernmental procurement method, which are exempt from M/WBE participation goals. Its $783,843 in LL 174-eligible value represents 0.004% of the City’s total LL 174-eligible contracting portfolio.
Table 72: FY25 LL 174-Eligible Contracts and POs
| Certification Status | # of Contracts | % Share of Contracts | Total Registered Contract Value | % Share of Contract Value |
|---|---|---|---|---|
| All Contracts and POs | 83 | 100.00% | $6,432,723 | 100.00% |
| M/WBE | 51 | 61.45% | $944,078 | 14.68% |
| Non-Certified | 32 | 38.55% | $5,488,645 | 85.32% |
| LL174 Contracts and POs | 76 | 100.00% | $783,843 | 100.00% |
| M/WBE | 50 | 65.79% | $669,433 | 85.40% |
| Non-Certified | 26 | 34.21% | $114,410 | 14.60% |
| LL174 Subcontracts | 0 | 0.00% | $0 | 0.00% |
| M/WBE | 0 | 0.00% | $0 | 0.00% |
| Non-Certified | 0 | 0.00% | $0 | 0.00% |
Chart 108: FY22-25 Value of LL 174-Eligible Prime Contracts and POs
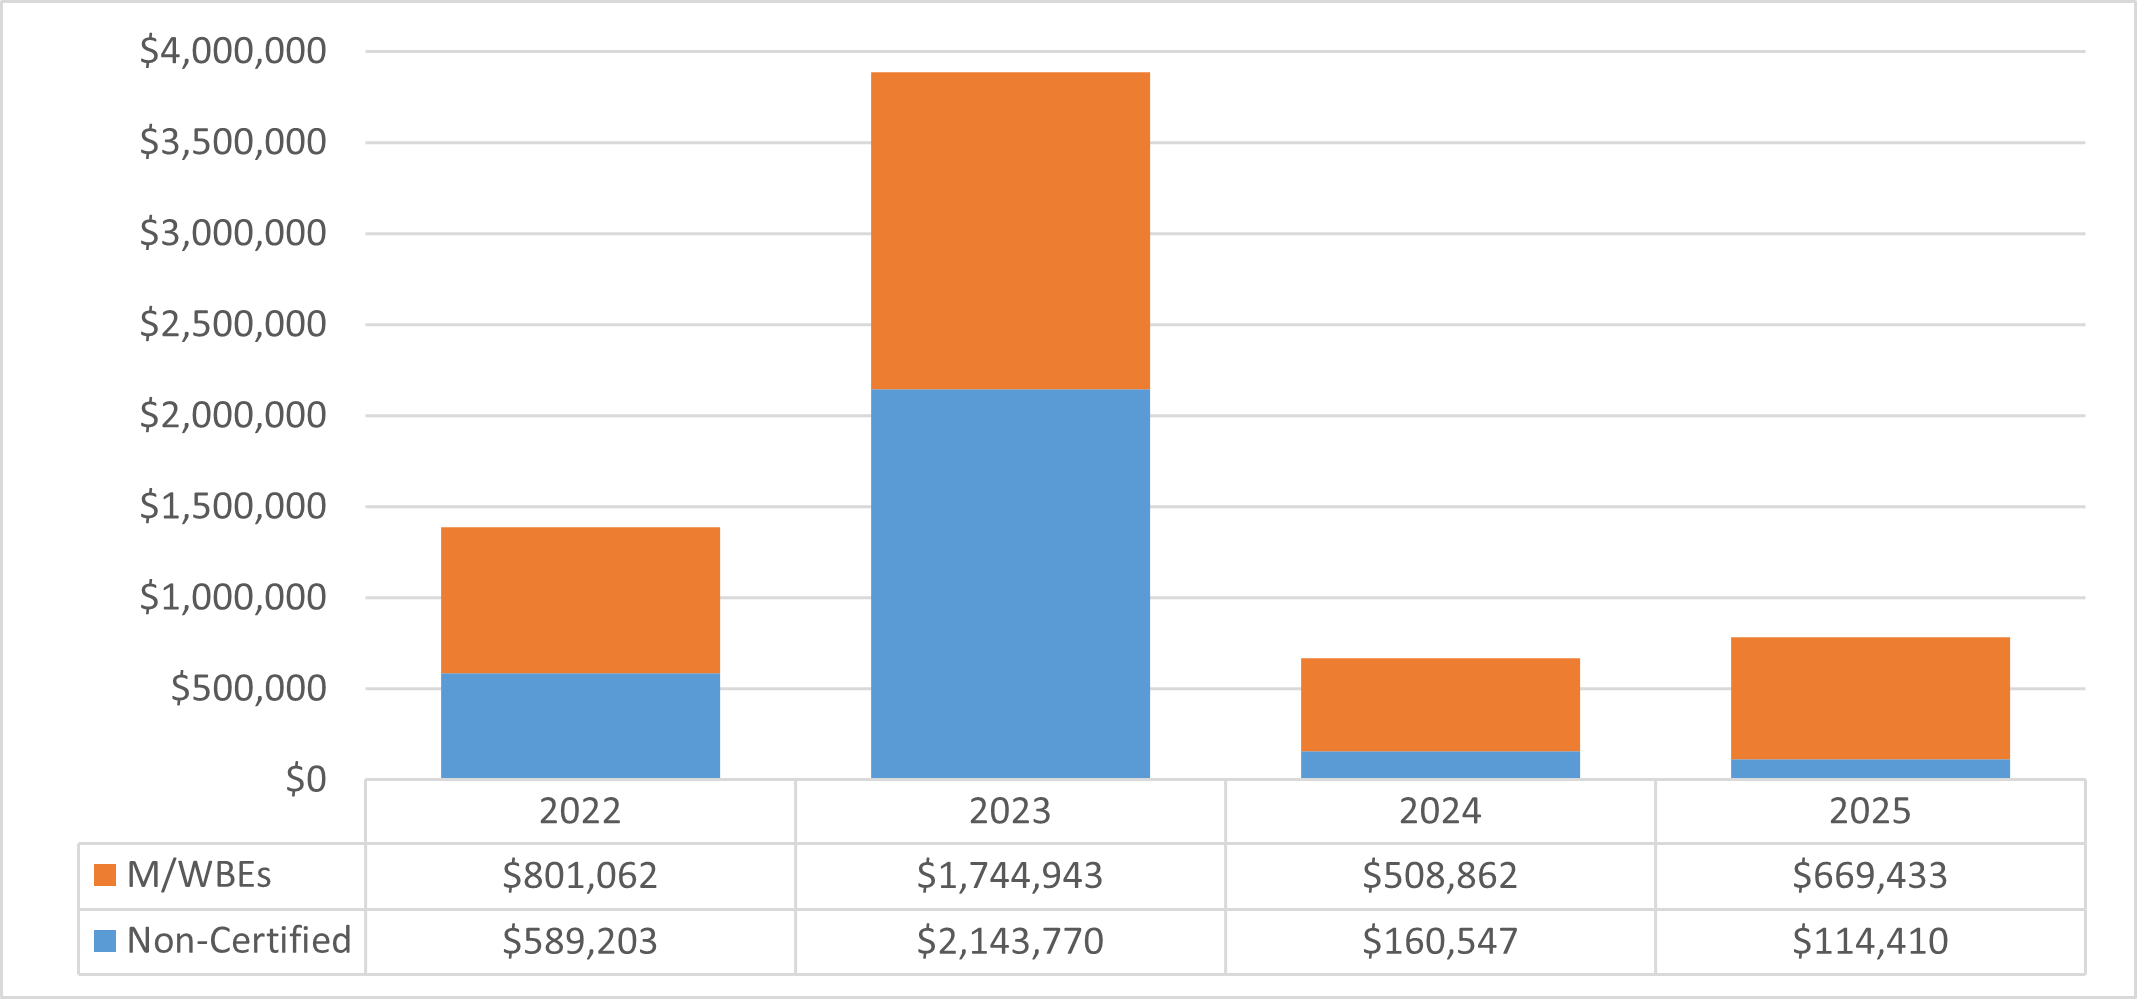
Chart 109: FY25 Value of LL 174-Eligible Contracts and POs, by Race and Gender
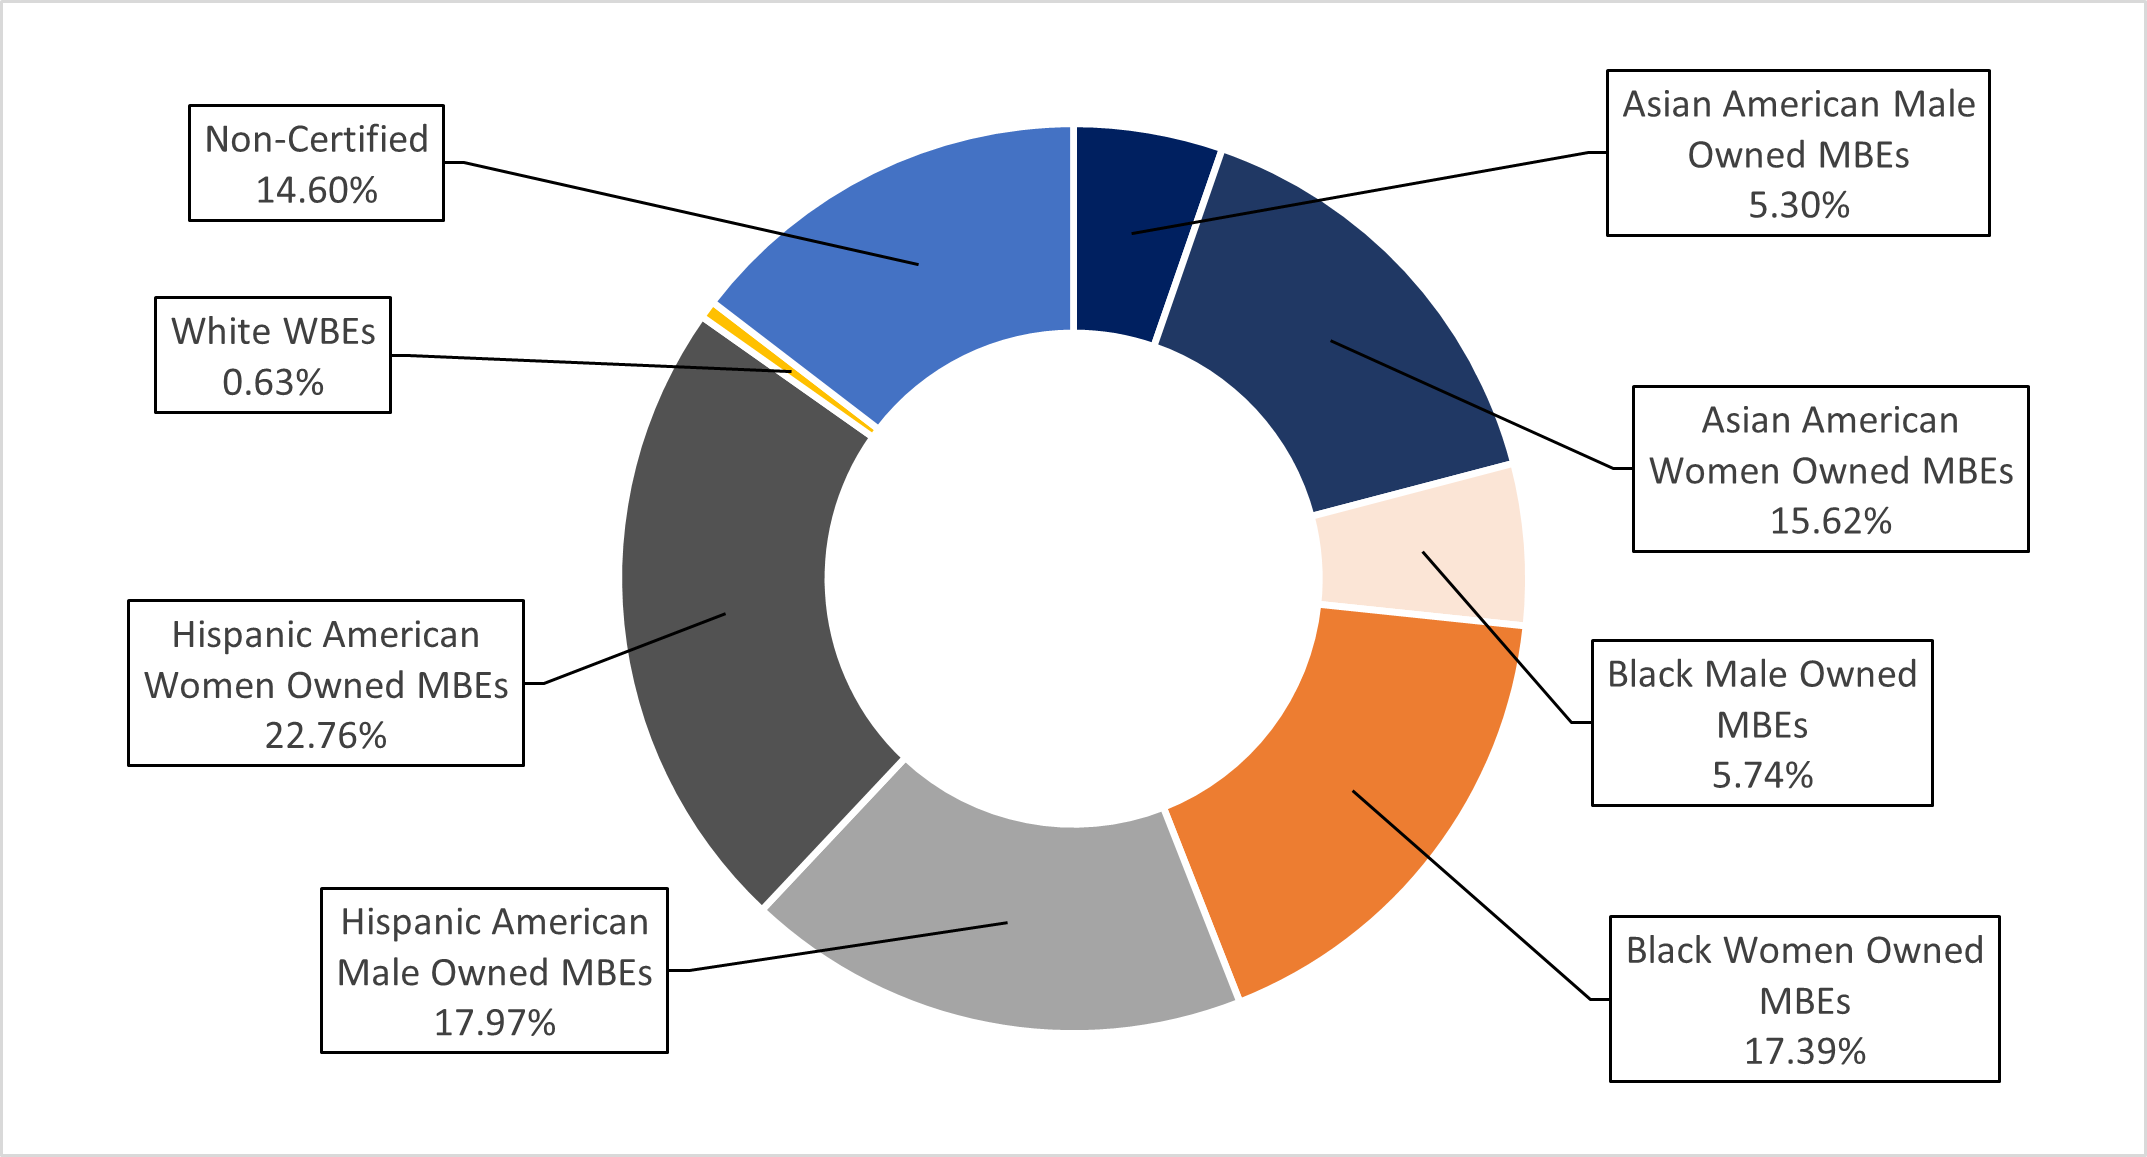
Chart 110: FY25 Share of LL 174-Eligible Contracts and PO Value, by M/WBE Category and Industry
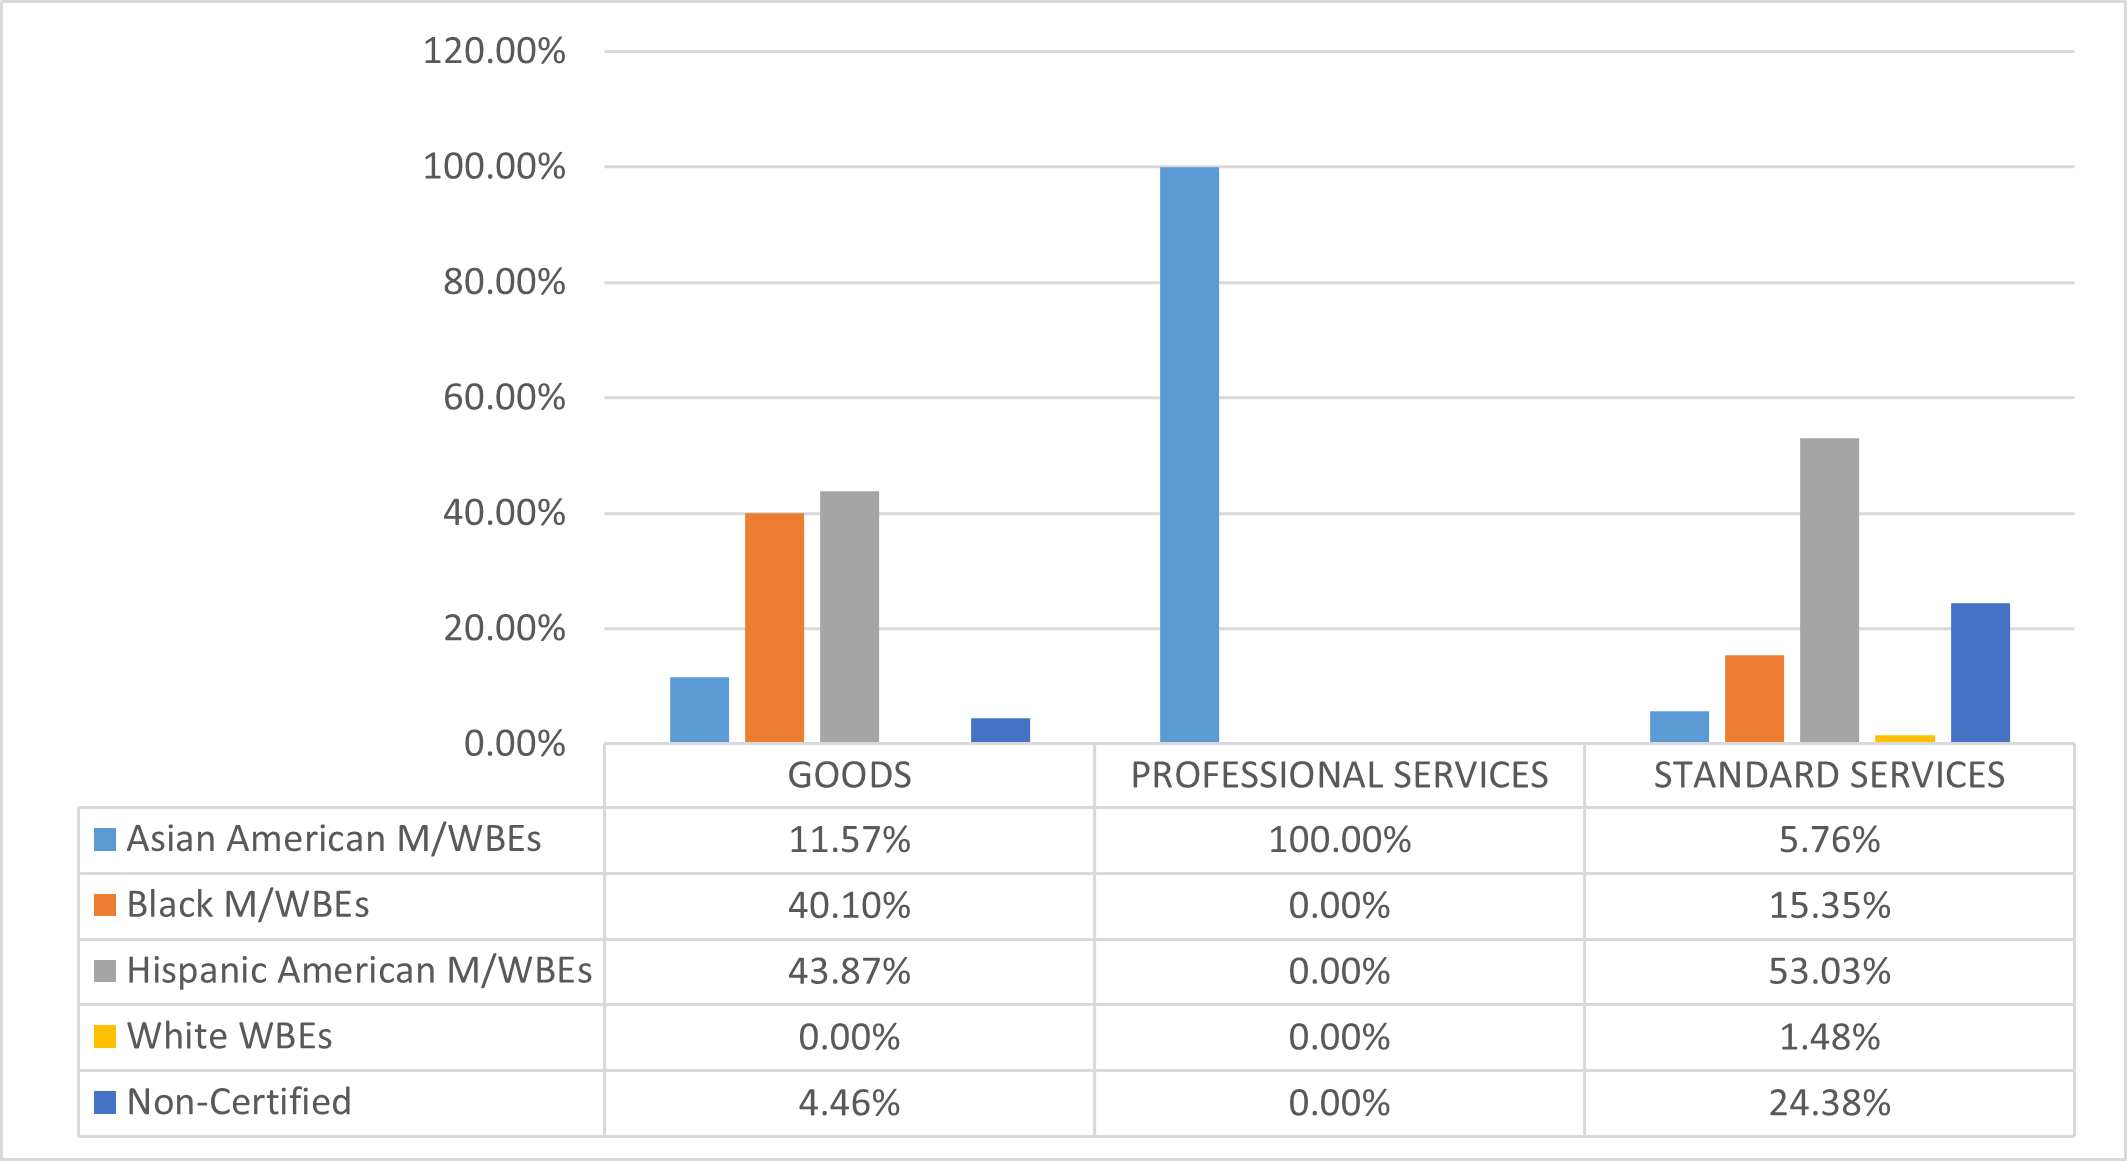
Office of Technology and Innovation (OTI)
OTI has a relatively large procurement portfolio, and the LL 174 data below represents about 71% of it. In FY25, OTI procured valuable Renewals that were excluded from this analysis. OTI’s $120 million in LL 174-eligible value represents almost 0.7% of the City’s total LL 174-eligible contracting portfolio.
Table 73: FY25 LL 174-Eligible Contracts and POs
| Certification Status | # of Contracts | % Share of Contracts | Total Registered Contract Value | % Share of Contract Value |
|---|---|---|---|---|
| All Contracts and POs | 479 | 100.00% | $169,582,408 | 100.00% |
| M/WBE | 268 | 55.95% | $111,251,123 | 65.60% |
| Non-Certified | 211 | 44.05% | $58,331,285 | 34.40% |
| LL174 Contracts and POs | 368 | 100.00% | $120,162,020 | 100.00% |
| M/WBE | 251 | 68.21% | $105,522,406 | 87.82% |
| Non-Certified | 117 | 31.79% | $14,639,614 | 12.18% |
| LL174 Subcontracts | 0 | 0.00% | $0 | 0.00% |
| M/WBE | 0 | 0.00% | $0 | 0.00% |
| Non-Certified | 0 | 0.00% | $0 | 0.00% |
Chart 111: FY22-25 Value of LL 174-Eligible Prime Contracts and POs
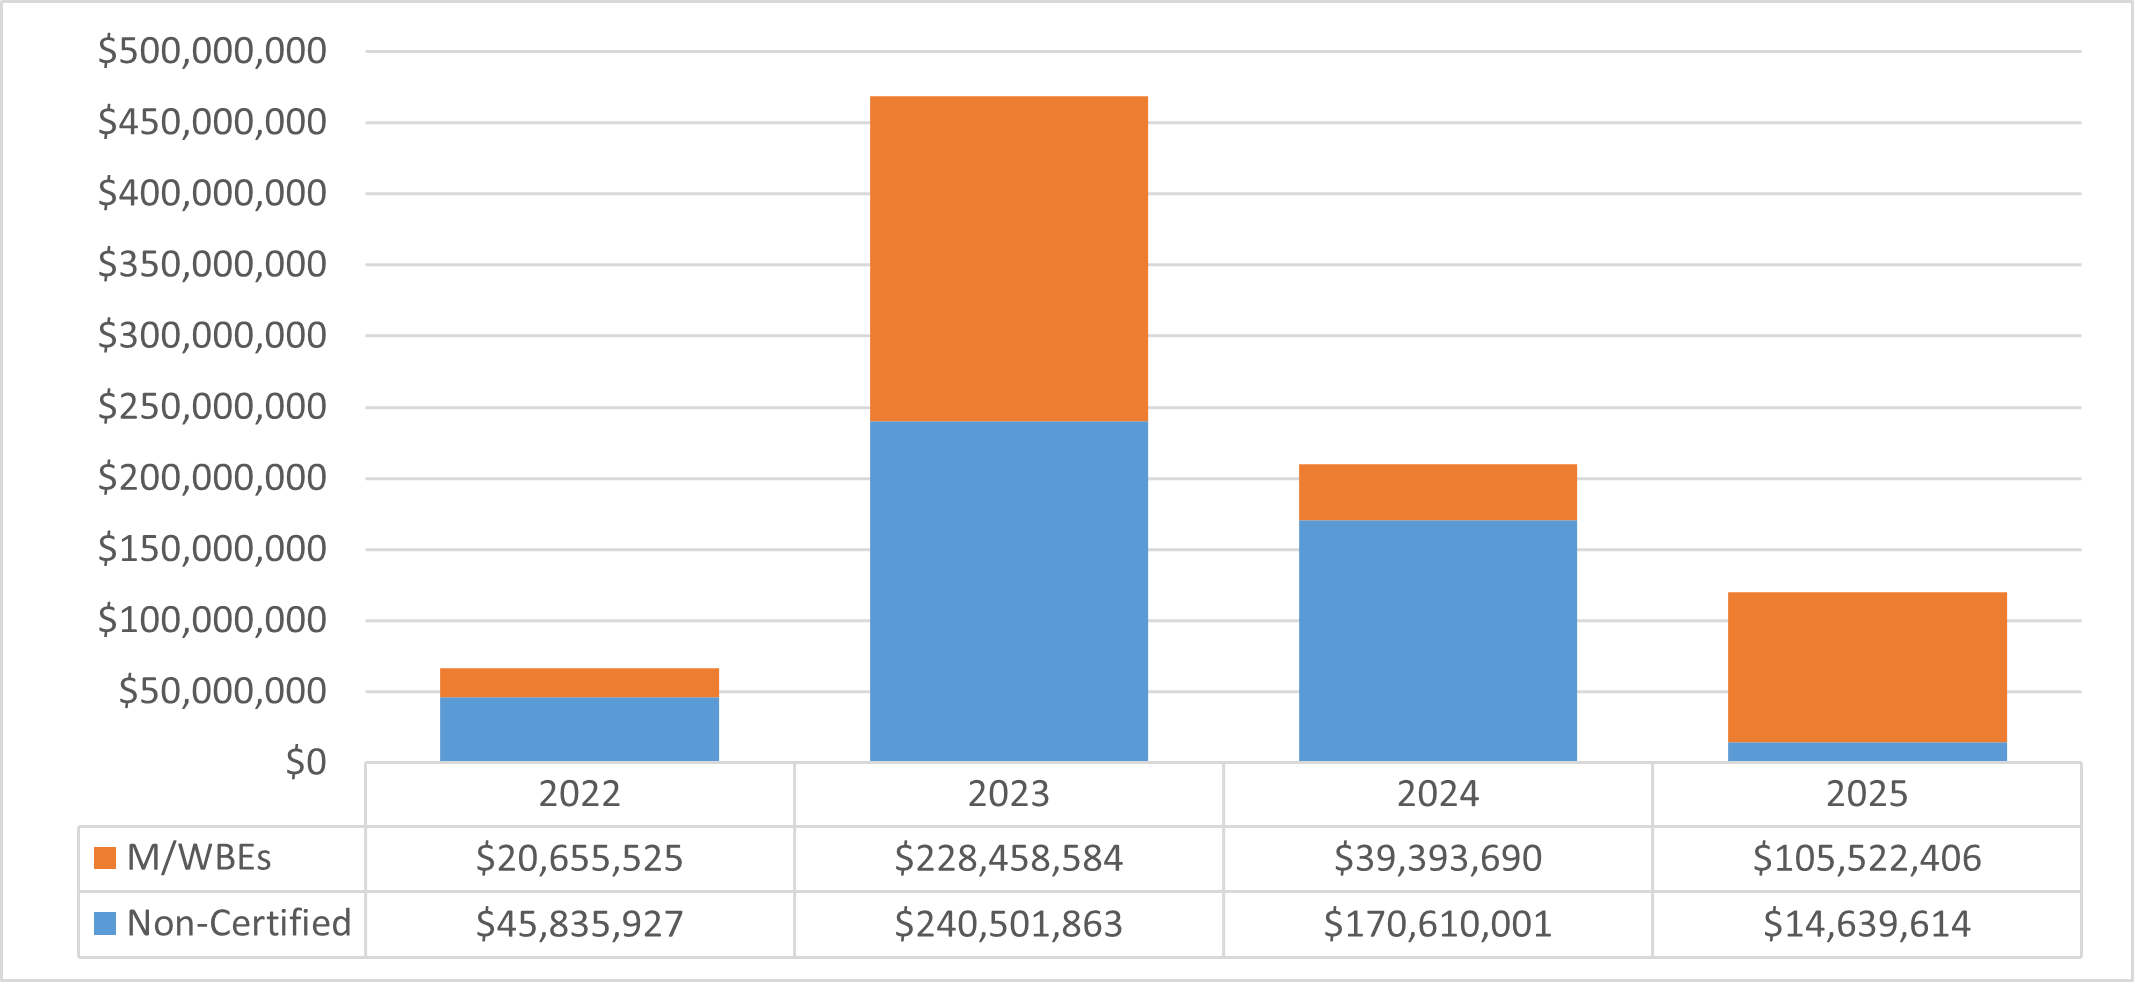
Chart 112: FY25 Value of LL 174-Eligible Contracts and POs, by Race and Gender
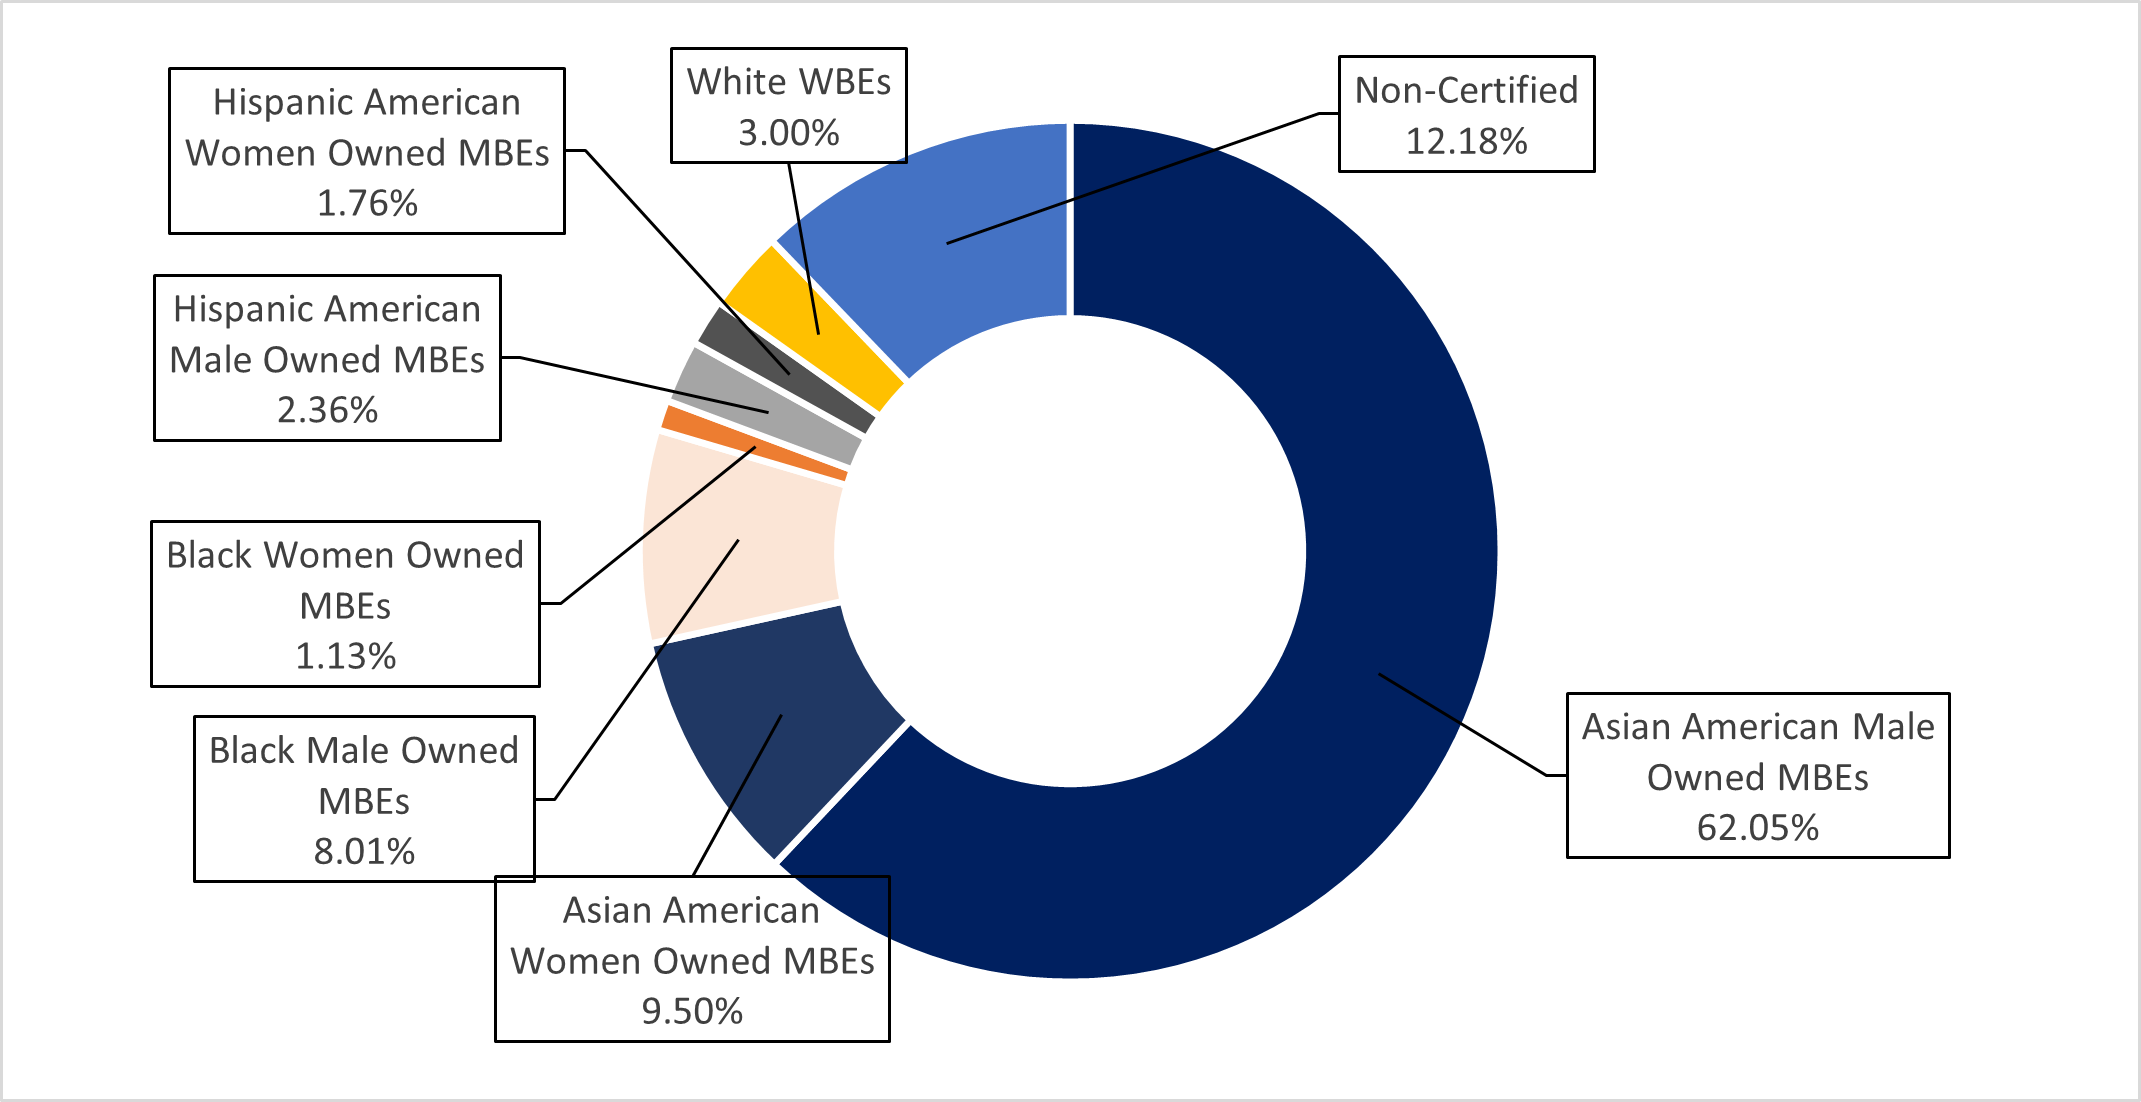
Chart 113: FY25 Share of LL 174-Eligible Contracts and PO Value, by M/WBE Category and Industry
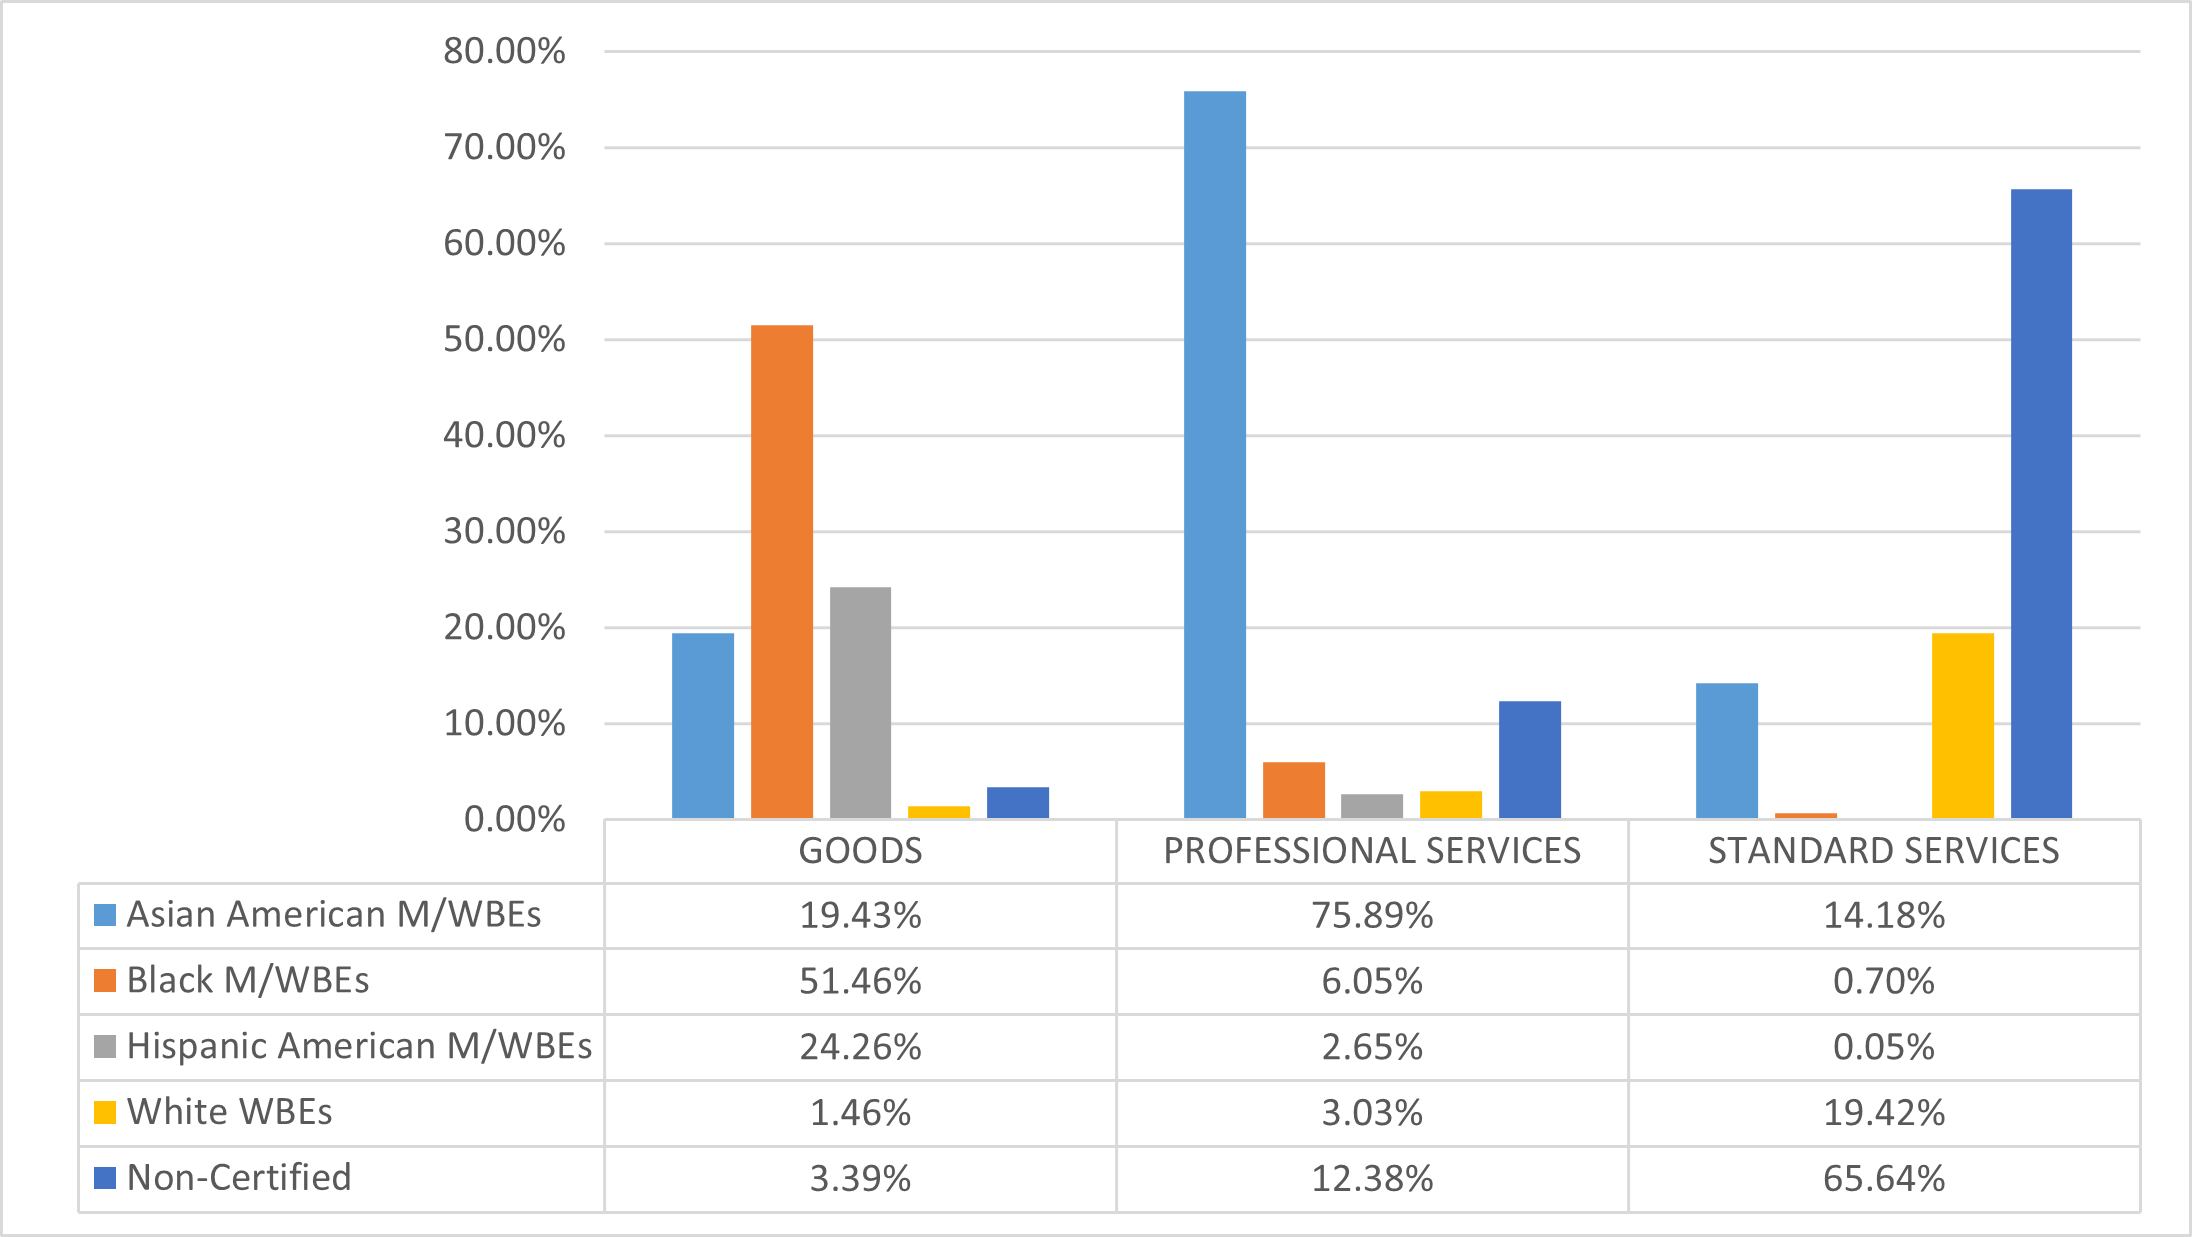
Small Business Services (SBS)
SBS has one of the City’s largest procurement portfolios by value due to high-dollar Sole Source agreements with the New York City Economic Development Corporation (NYCEDC) to function as a development consultant and provide economic development-related services on behalf of the City. NYCEDC is a nonprofit organization incorporated under the Not-for-Profit Corporation Law of the State of New York, and as such these contracts are not subject to LL 174 participation goals.[43] LL 174 contracts represent about 40% of SBS’ FY25 procurement portfolio. SBS’ $52.4 million in LL 174-eligible value represents about 0.3% of the City’s total LL 174-eligible contracting portfolio.
Table 74: FY25 LL 174-Eligible Contracts and POs
| Certification Status | # of Contracts | % Share of Contracts | Total Registered Contract Value | % Share of Contract Value |
|---|---|---|---|---|
| All Contracts and POs | 293 | 100.00% | $131,064,906 | 100.00% |
| M/WBE | 47 | 16.04% | $3,338,798 | 2.55% |
| Non-Certified | 246 | 83.96% | $127,726,109 | 97.45% |
| LL174 Contracts and POs | 118 | 100.00% | $52,427,186 | 100.00% |
| M/WBE | 44 | 37.29% | $2,466,502 | 4.70% |
| Non-Certified | 74 | 62.71% | $49,960,683 | 95.30% |
| LL174 Subcontracts | 0 | 0.00% | $0 | 0.00% |
| M/WBE | 0 | 0.00% | $0 | 0.00% |
| Non-Certified | 0 | 0.00% | $0 | 0.00% |
Chart 114: FY22-25 Value of LL 174-Eligible Prime Contracts and POs
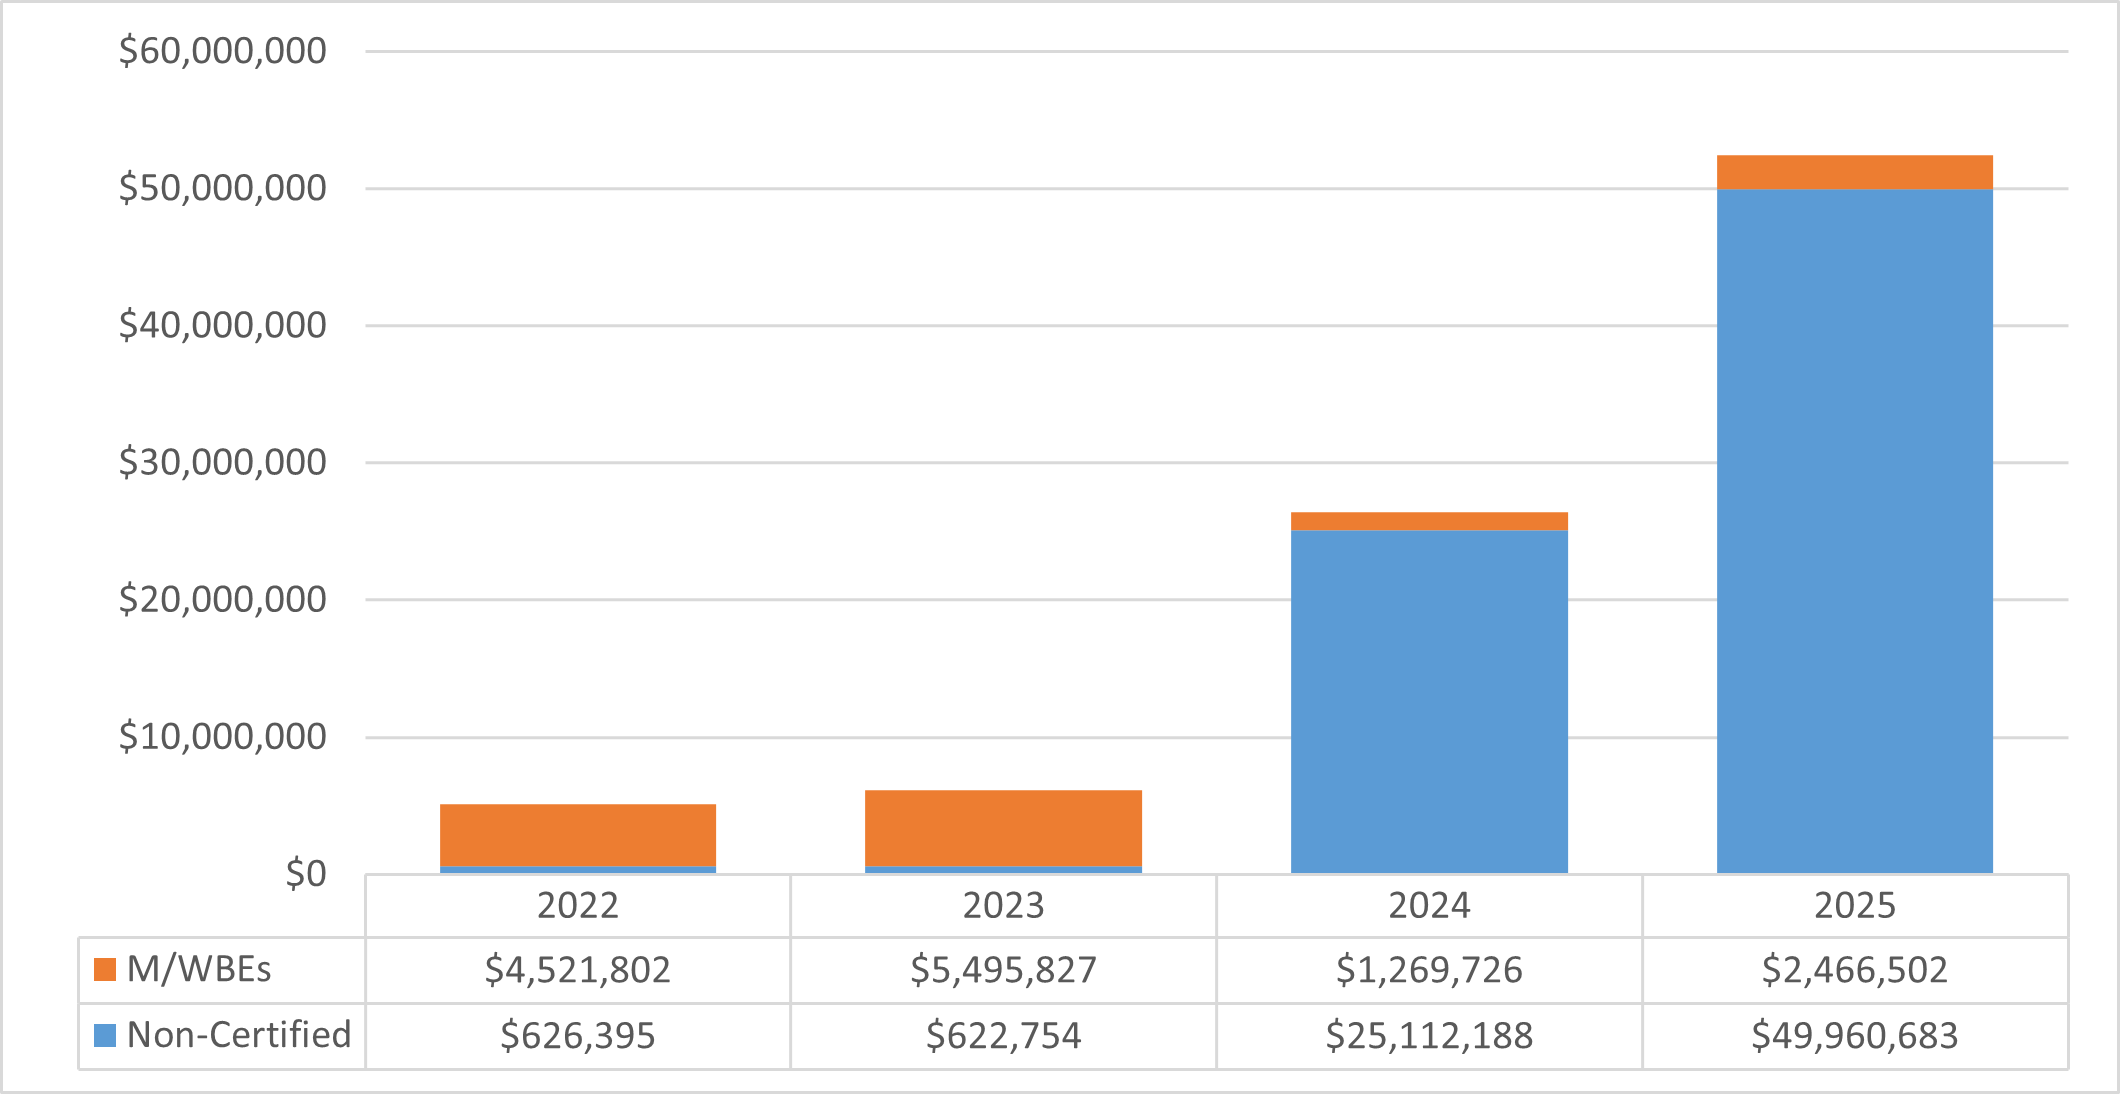
Chart 115: FY25 Value of LL 174-Eligible Contracts and POs, by Race and Gender
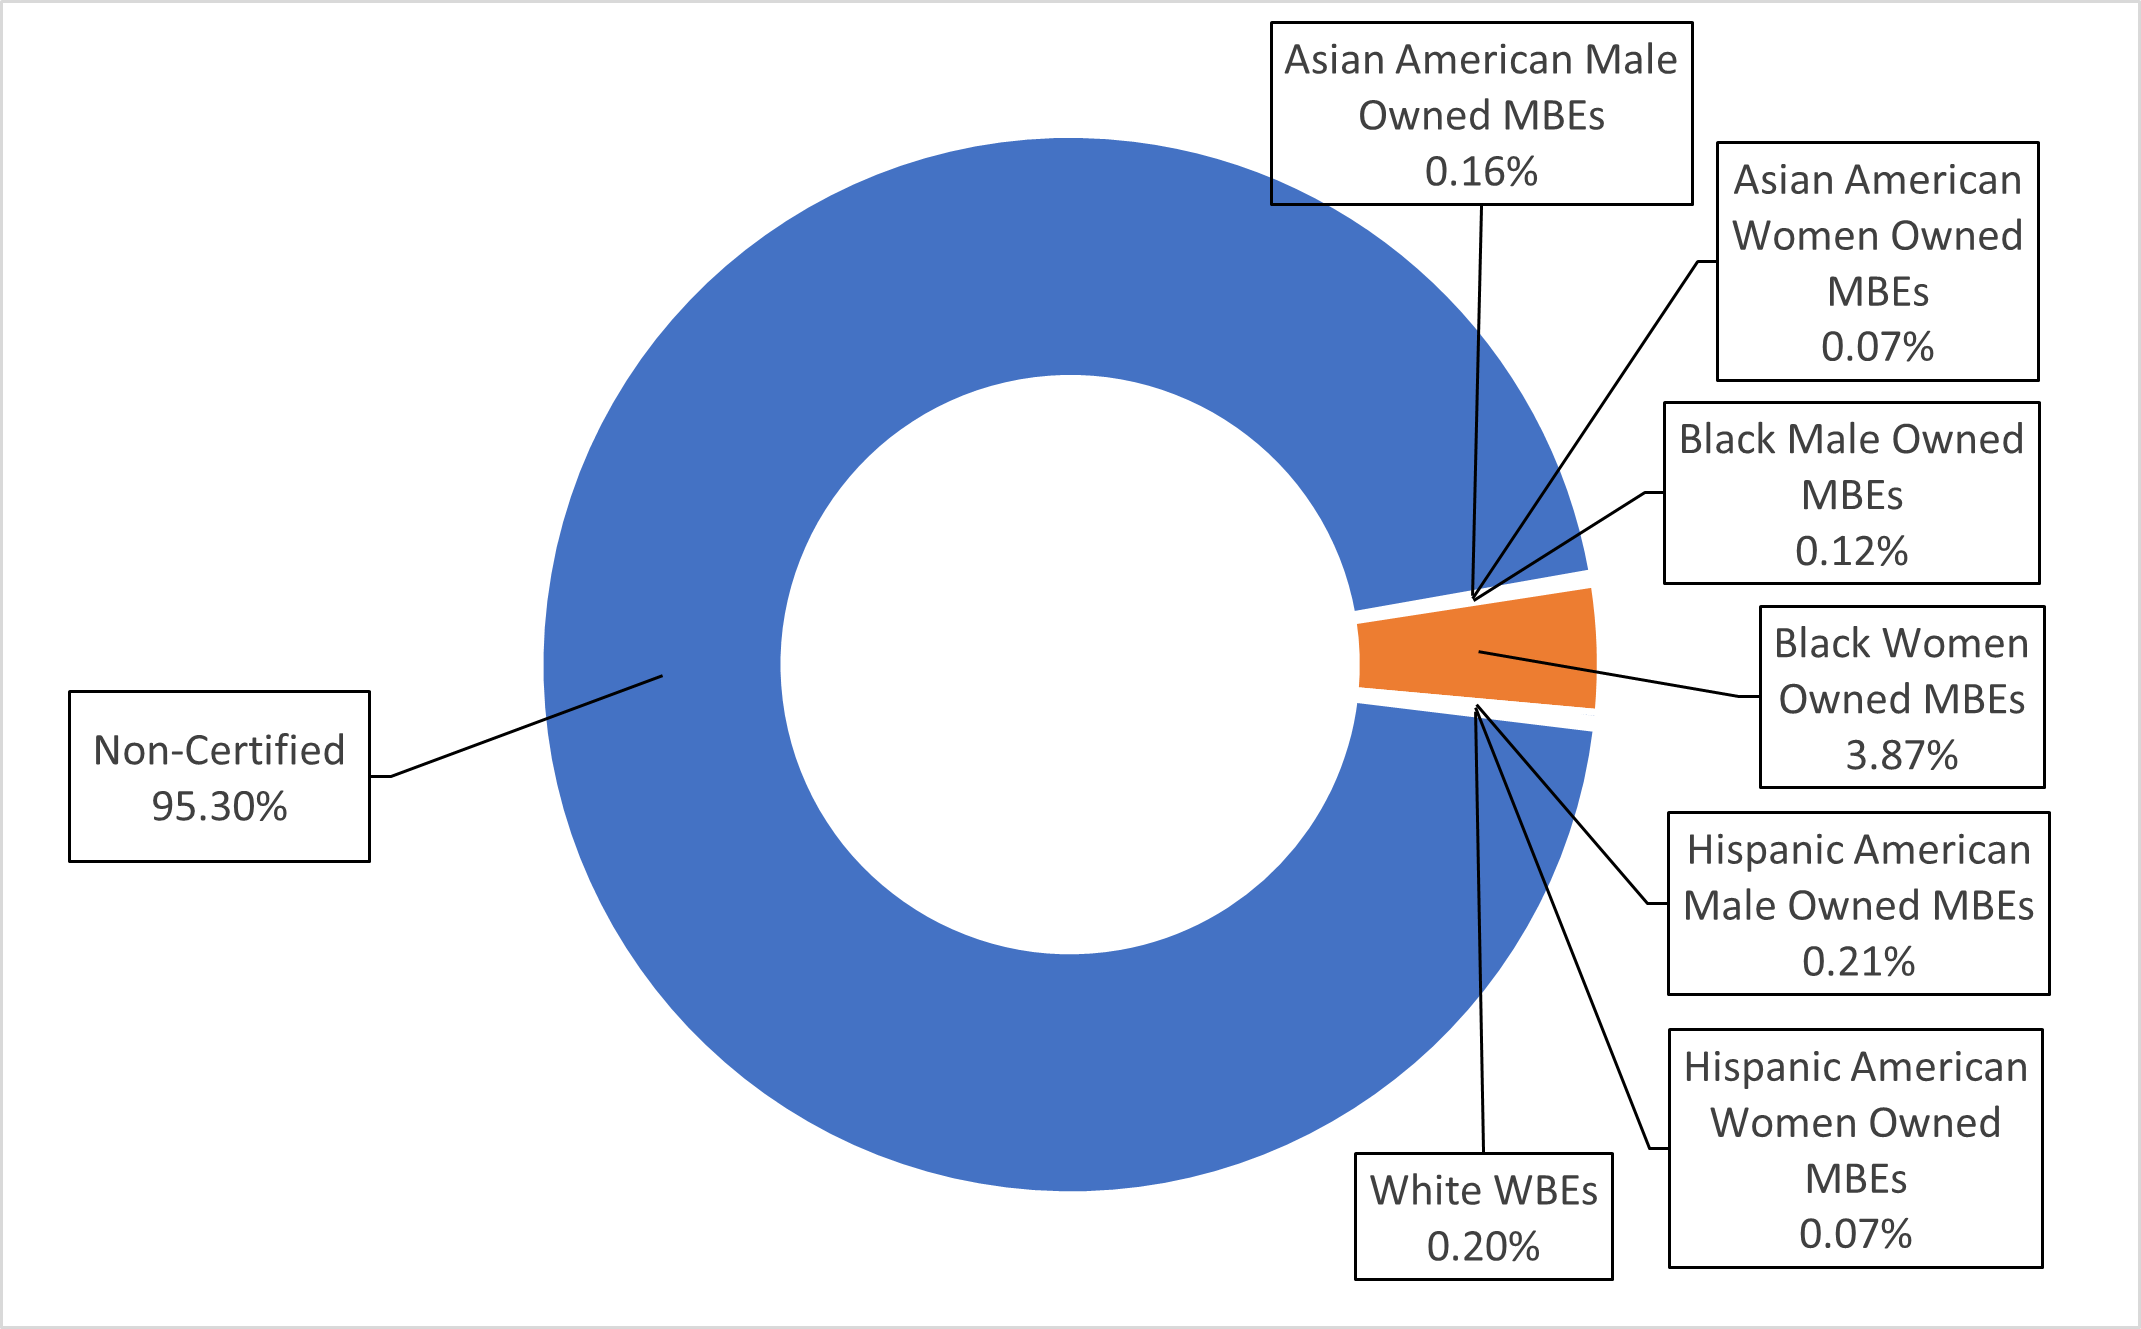
Chart 116: FY25 Share of LL 174-Eligible Contracts and PO Value, by M/WBE Category and Industry
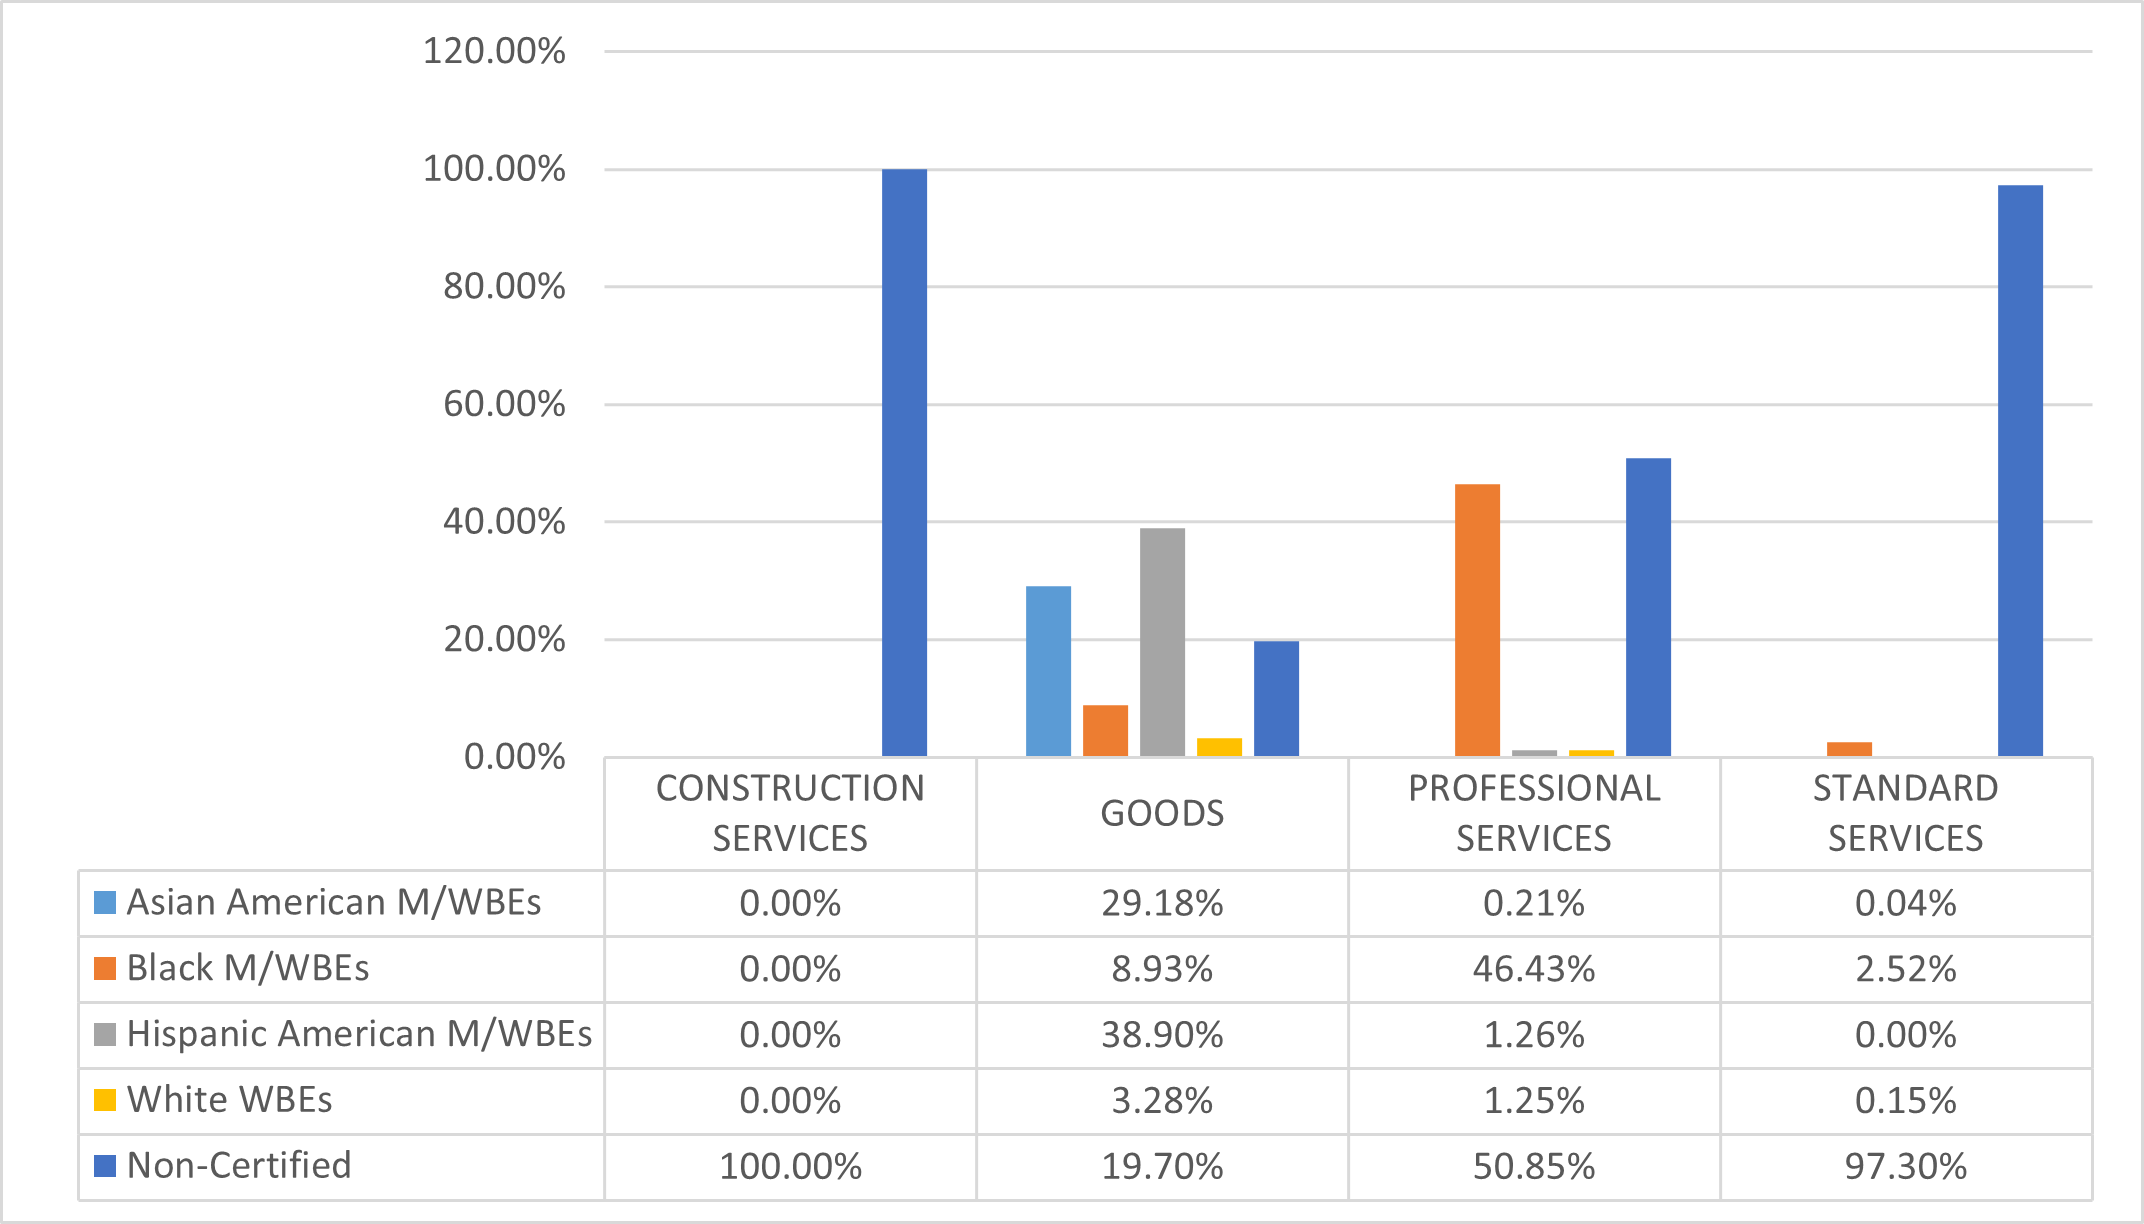
Taxi and Limousine Commission (TLC)
The vast majority of TLC’s FY25 procurement value was subject to LL 174 participation goals. TLC’s $1.96 million in LL 174-eligible value represents only 0.01% of the City’s total LL 174-eligible contracting portfolio.
Table 75: FY25 LL 174-Eligible Contracts and POs
| Certification Status | # of Contracts | % Share of Contracts | Total Registered Contract Value | % Share of Contract Value |
|---|---|---|---|---|
| All Contracts and POs | 112 | 100.00% | $2,388,883 | 100.00% |
| M/WBE | 38 | 33.93% | $1,390,067 | 58.19% |
| Non-Certified | 74 | 66.07% | $998,816 | 41.81% |
| LL174 Contracts and POs | 106 | 100.00% | $1,960,308 | 100.00% |
| M/WBE | 38 | 35.85% | $1,390,067 | 70.91% |
| Non-Certified | 68 | 64.15% | $570,240 | 29.09% |
| LL174 Subcontracts | 0 | 0.00% | $0 | 0.00% |
| M/WBE | 0 | 0.00% | $0 | 0.00% |
| Non-Certified | 0 | 0.00% | $0 | 0.00% |
Chart 117: FY22-25 Value of LL 174-Eligible Prime Contracts and POs
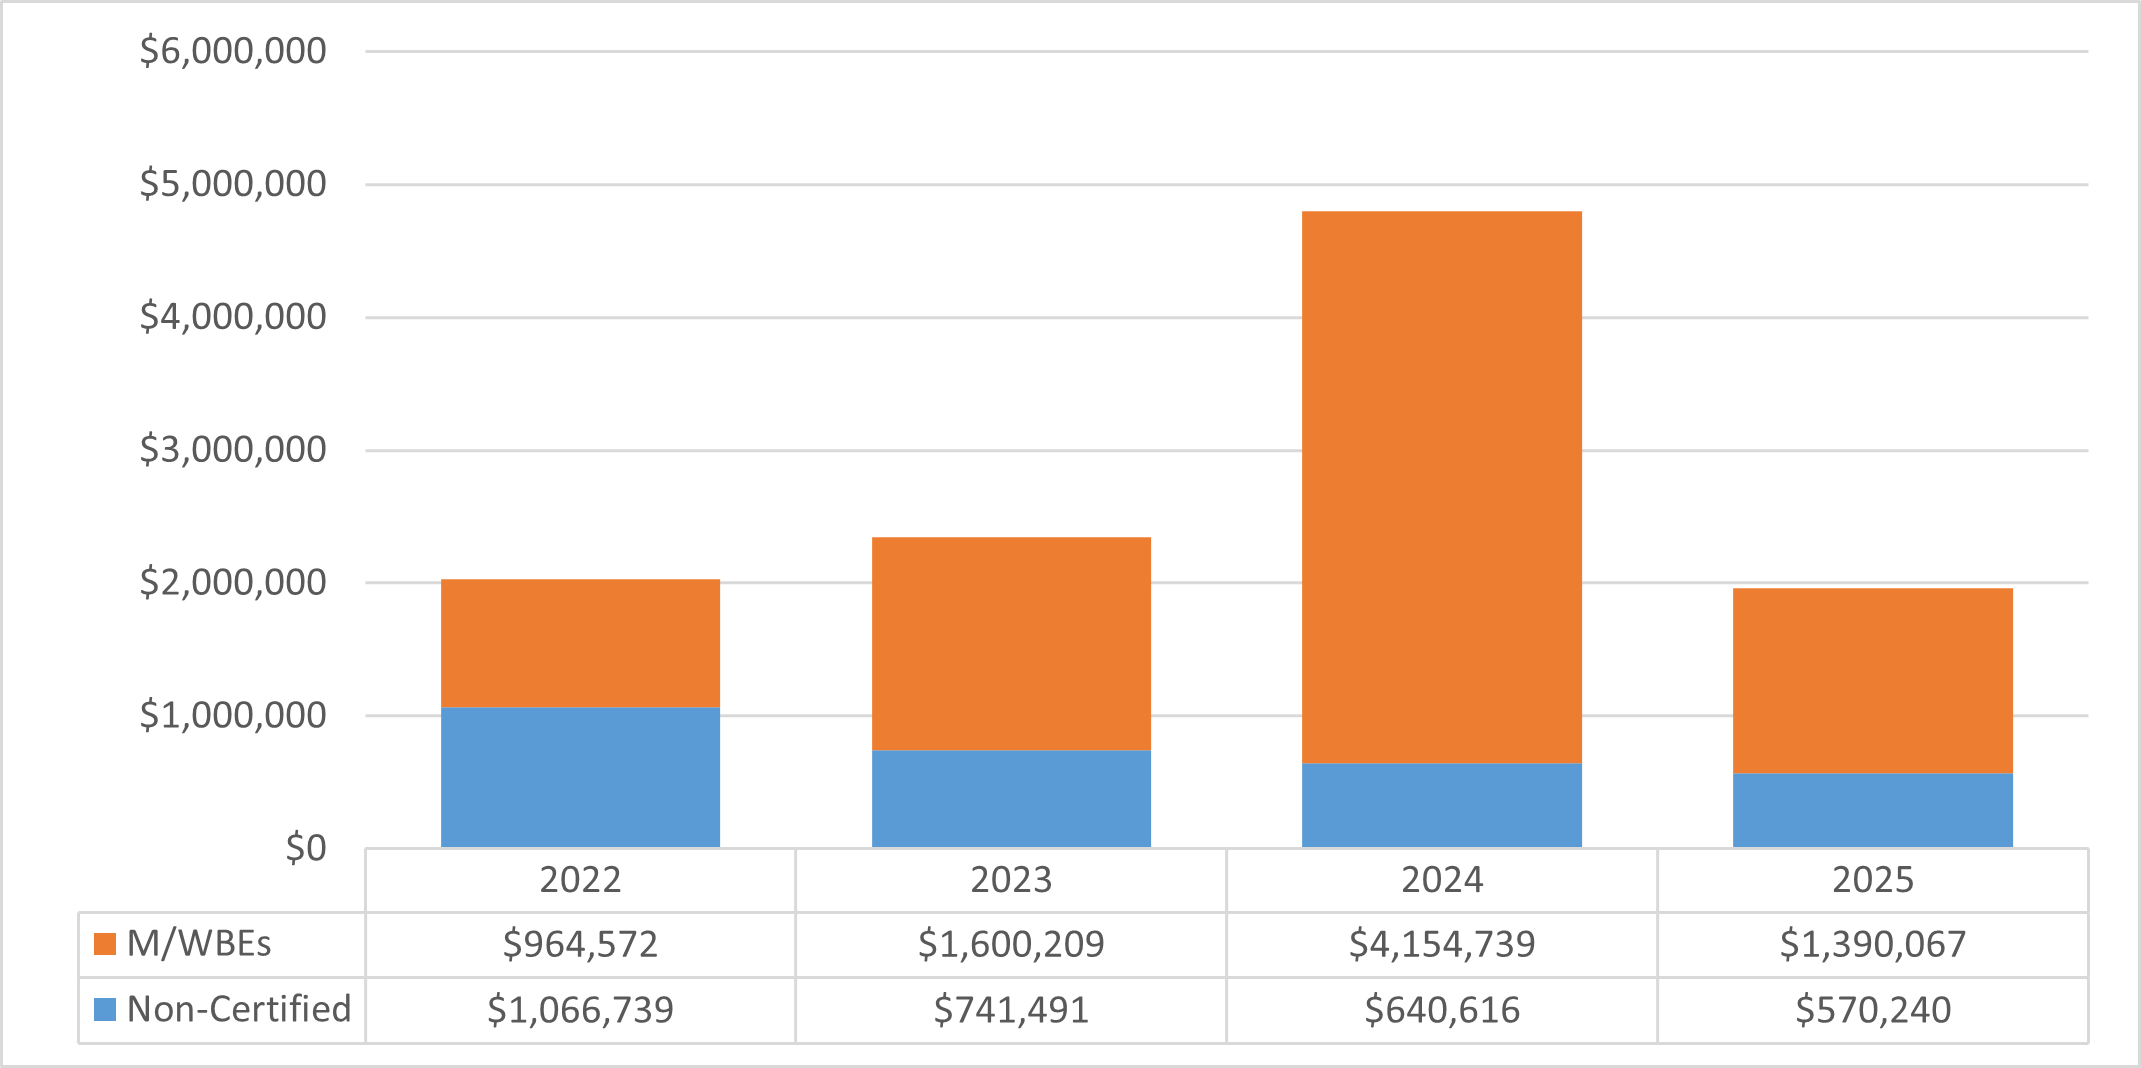
Chart 118: FY25 Value of LL 174-Eligible Contracts and POs, by Race and Gender
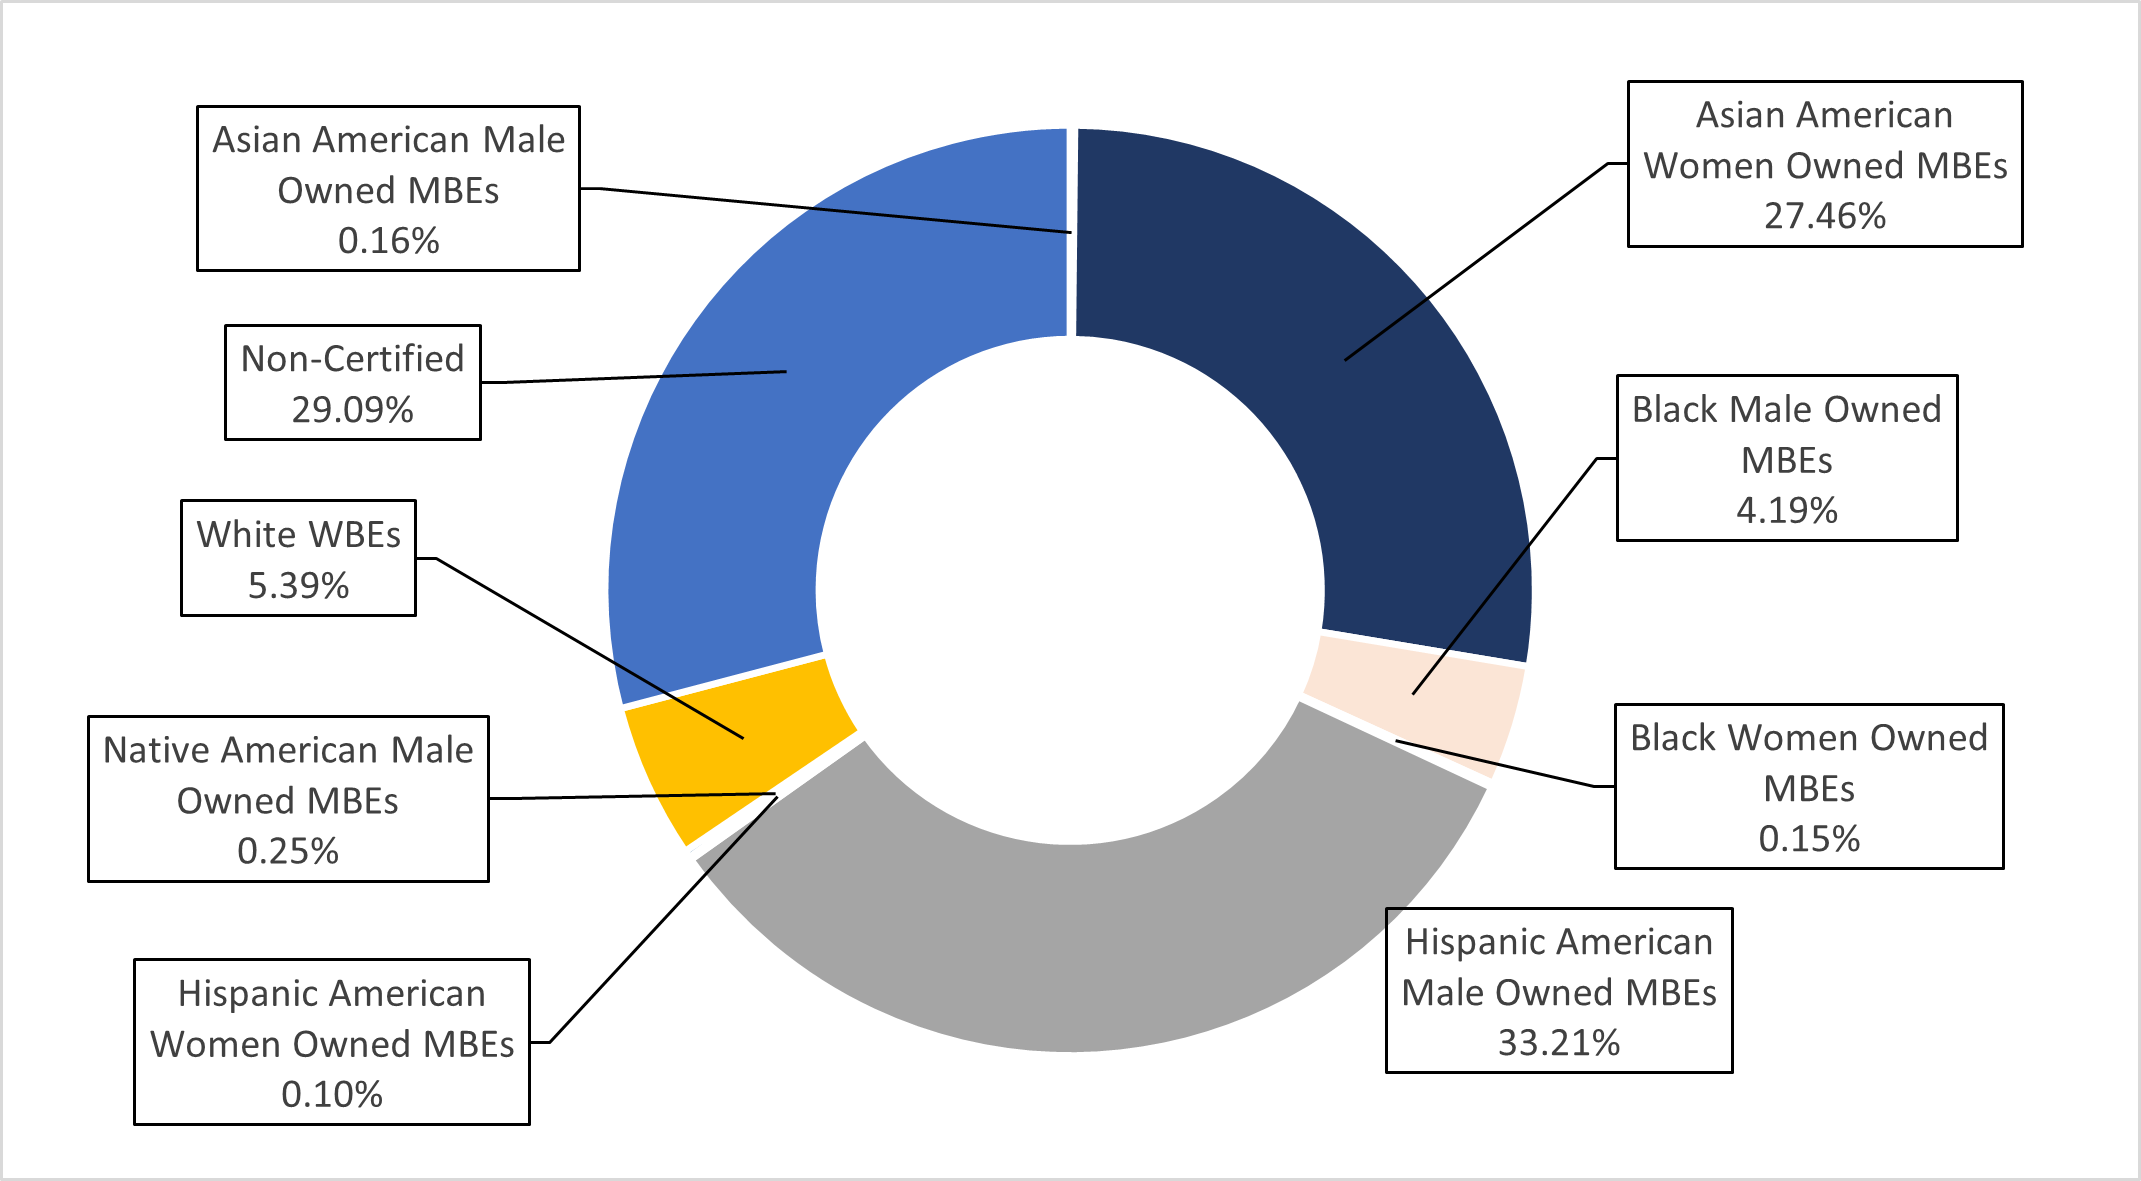
Chart 119: FY25 Share of LL 174-Eligible Contracts and PO Value, by M/WBE Category and Industry
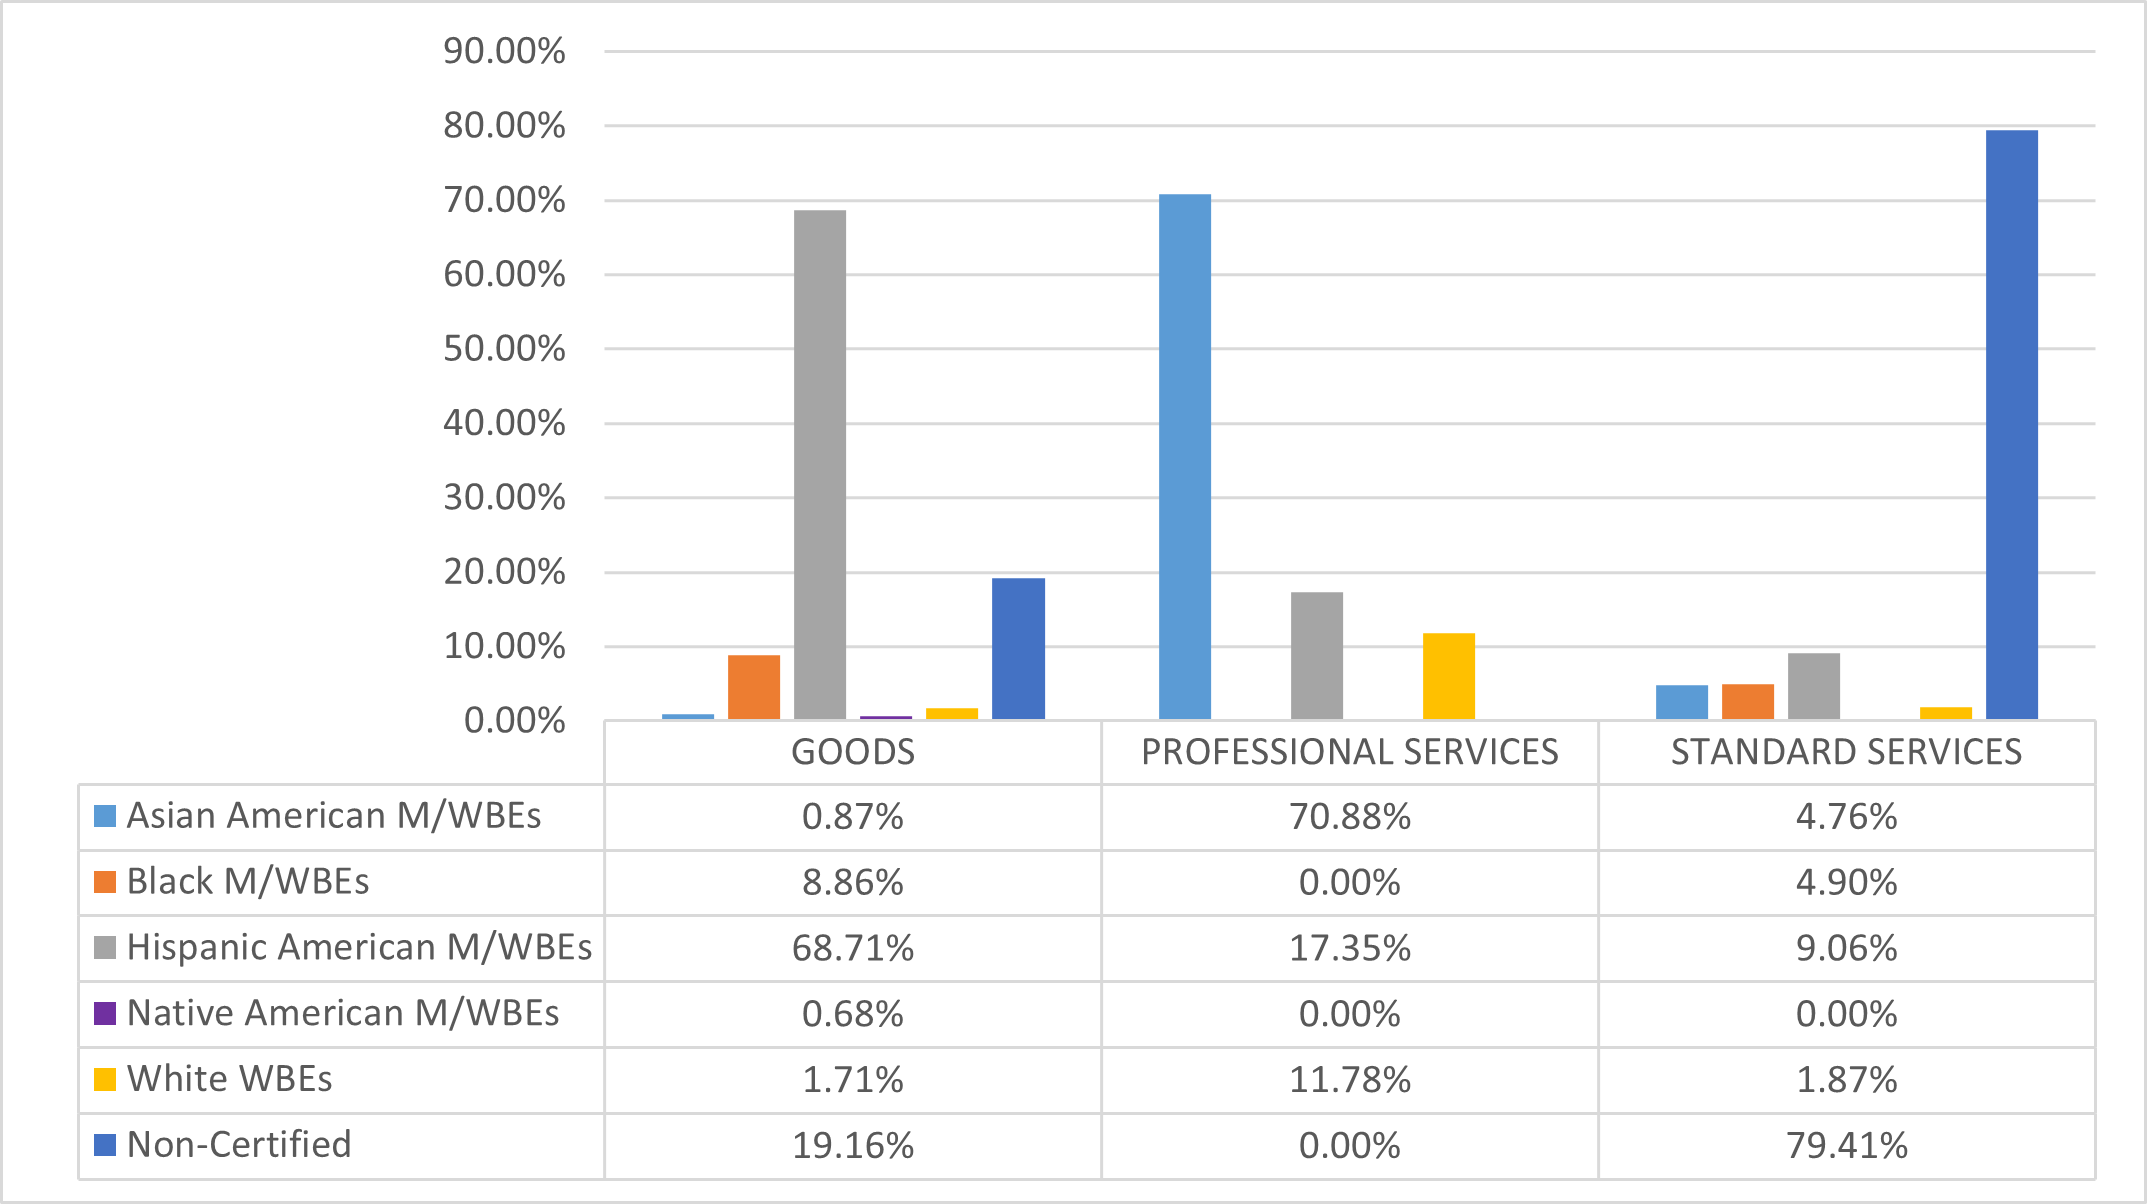
Department of Education
Though it is not a mayoral agency, this section of this Report includes Department of Education (“DOE”) utilization data, given the size and value of its contracting portfolio. Furthermore, the DOE implemented its own M/WBE participation goals program in FY23. As in last year’s report, this Office was not able to fully assess the DOE’s compliance with M/WBE goals, as DOE failed to record any approved subcontract records at the time data for this Report was pulled.
Many of DOE’s contracts are funded, at least in part, by non-City sources, which are excluded from the local law. City procurement systems are limited and do not include the necessary data to confirm if a contract is in fact funded by State or Federal funds. Due to these limitations, LL 174-eligible data in this Report includes some contracts that may actually be excluded from LL 174.
The LL 174 totals below represent a fifth of the DOE’s total procurement portfolio. The DOE has one of the largest procurement portfolios in the City. In FY25, DOE registered $2.25 billion in procurement value, only $458 million of which was LL 174-eligible. DOE represents 2.6% of the City’s total LL 174-eligible contracting portfolio (acknowledging that this total may include some excluded contracts).
Table 76: Volume of DOE Contracts and POs Subject to LL 174 Participation Goals, FY23-25
| FY23 | FY24 | FY25 | ||||
|---|---|---|---|---|---|---|
| Certification Type | # of Contracts | % Share of Contracts | # of Contracts | % Share of Contracts | # of Contracts | % Share of Contracts |
| M/WBE | 10,568 | 11.25% | 16,288 | 15.60% | 27,870 | 19.32% |
| Non-Certified | 83,391 | 88.75% | 88,128 | 84.40% | 116,379 | 80.68% |
| Grand Total | 93,959 | 100.00% | 104,416 | 100.00% | 144,249 | 100.00% |
19.3% of DOE contracts subject to LL 174 participation goals were registered to M/WBEs. Interestingly, these contracts represent 30% of the value of eligible contract registrations. This is unique – on average, Citywide, the M/WBE share of the count of contracts is typically larger than the relative M/WBE share of contracted value. This may be because 61.5% of the DOE LL 174-eligible value in FY25 (for both M/WBEs and Non-Certified vendors) was from master agreements (“MA1s”).
Table 77: Value of DOE Contracts and POs Subject to LL 174 Participation Goals, FY23-25
| FY23 | FY24 | FY25 | ||||
|---|---|---|---|---|---|---|
| Certification Type | Total Registered Value | % Share of Value | Total Registered Value | % Share of Value | Total Registered Value | % Share of Value |
| M/WBE | $130,339,436 | 22.83% | $272,388,787 | 24.39% | $139,680,966 | 30.46% |
| Non-Certified | $440,541,894 | 77.17% | $844,312,134 | 75.61% | $318,878,228 | 69.54% |
| Grand Total | $570,881,330 | 100.00% | $1,116,700,922 | 100.00% | $458,559,194 | 100.00% |
Chart 120: FY22-25 Value of LL 174-Eligible Prime Contracts and POs
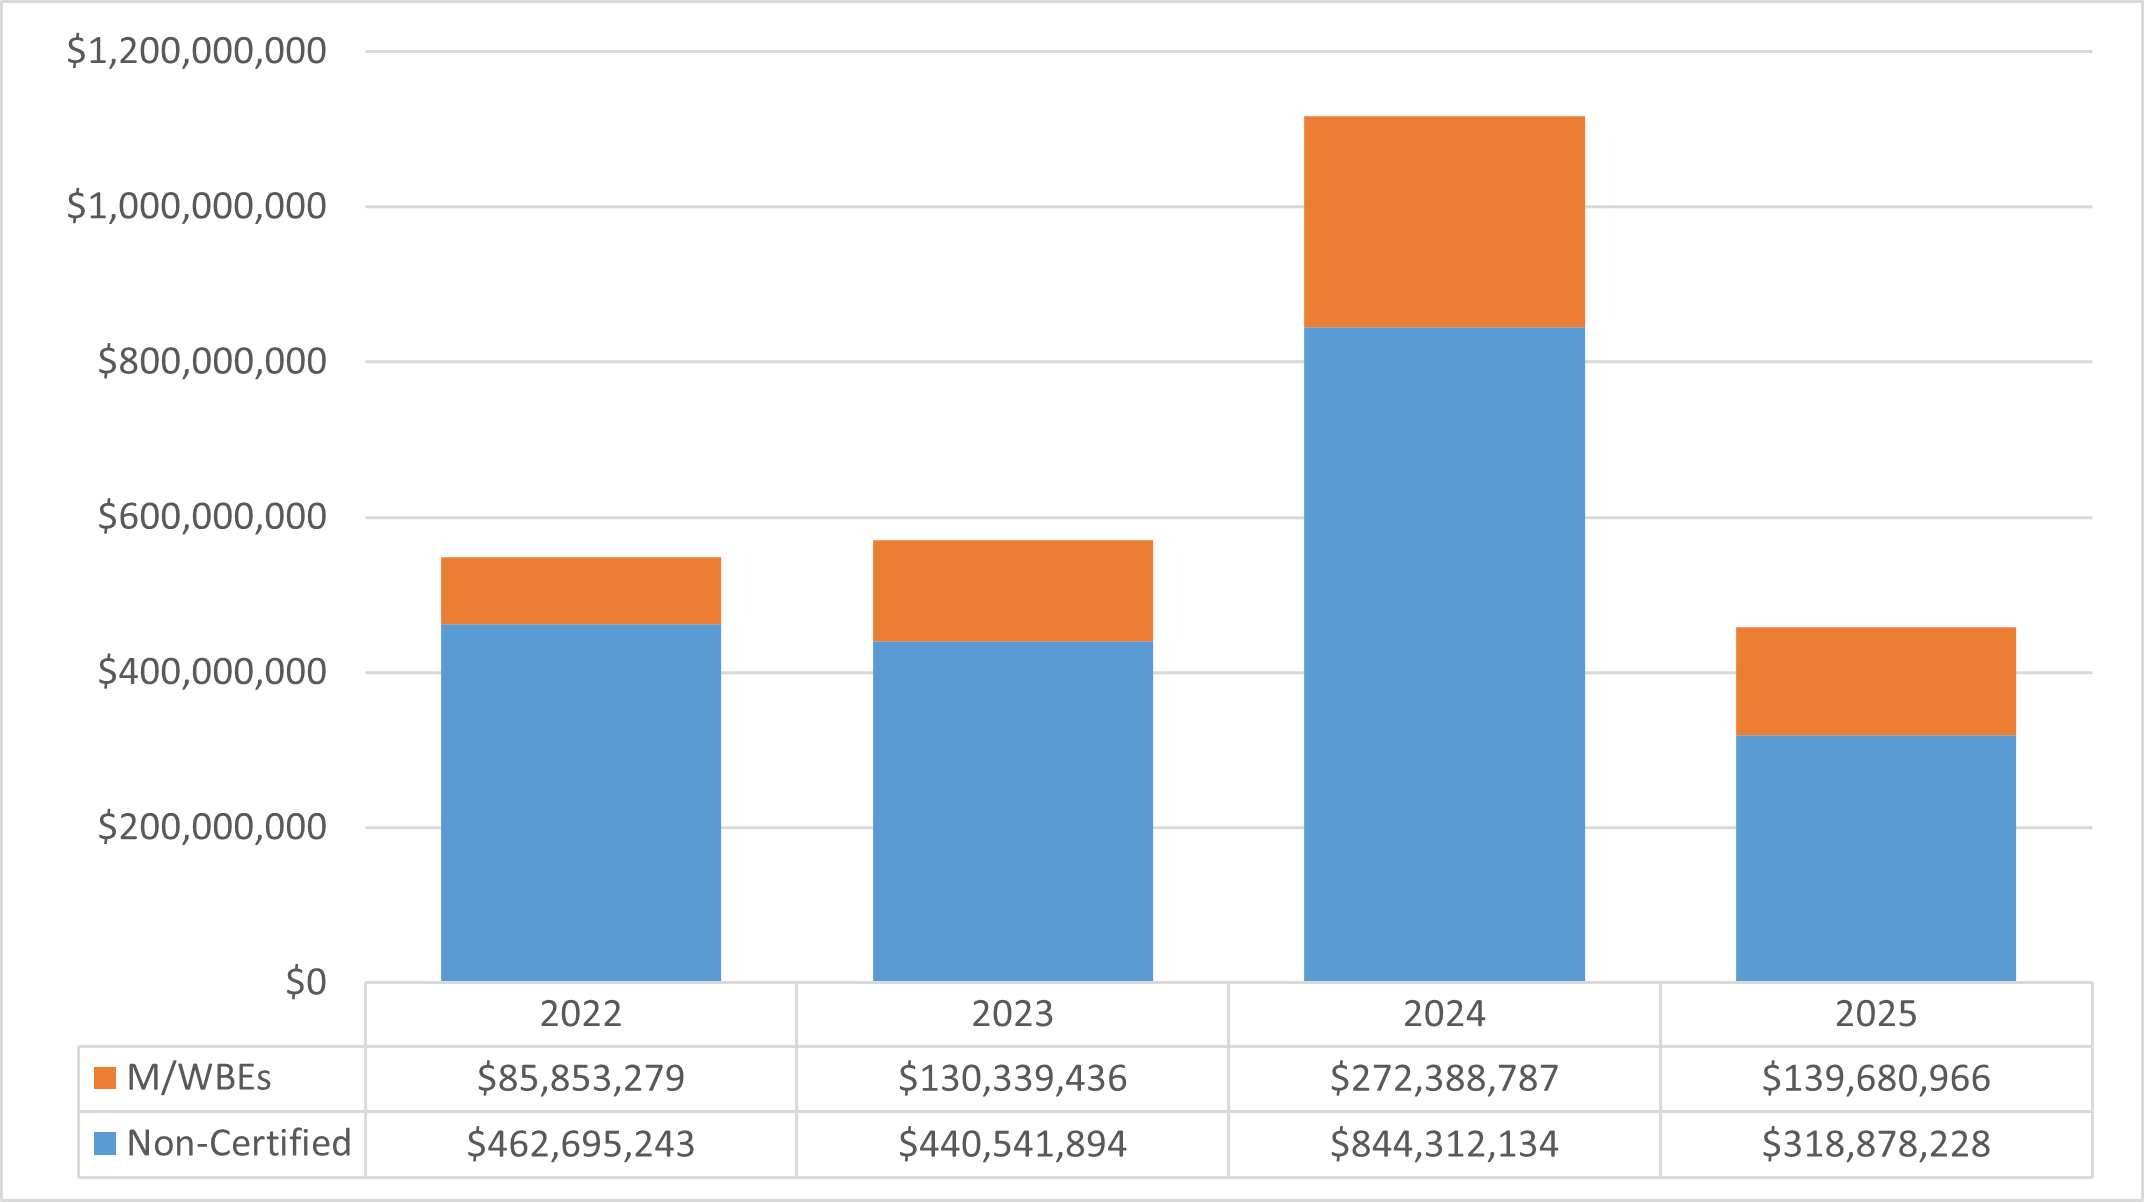
Chart 121: FY25 Value of LL 174-Eligible Contracts and POs, by Race and Gender
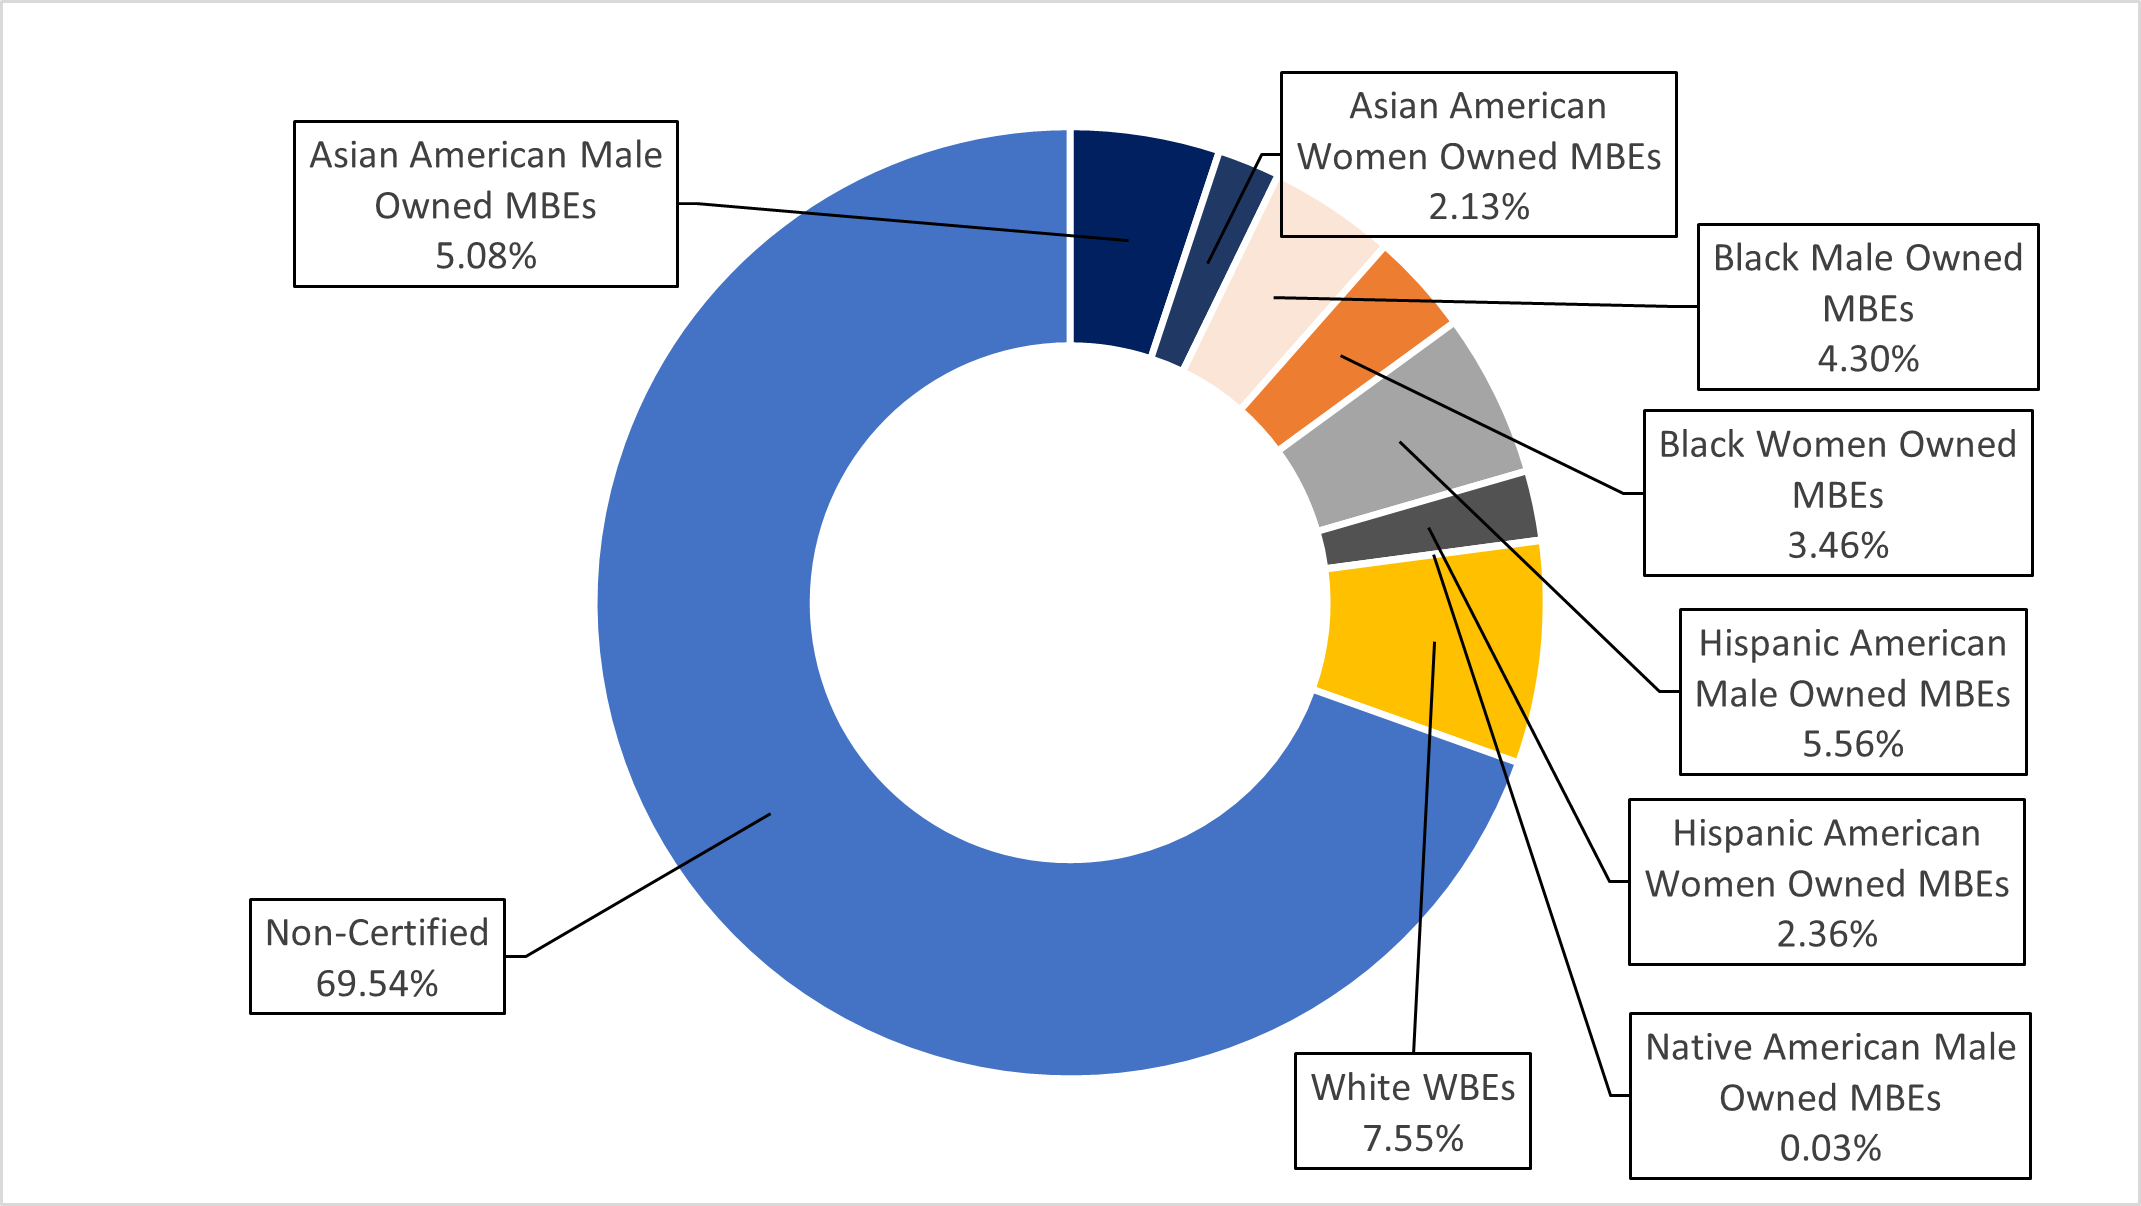
Chart 122: FY25 Share of LL 174-Eligible Contracts and PO Value, by M/WBE Category and Industry
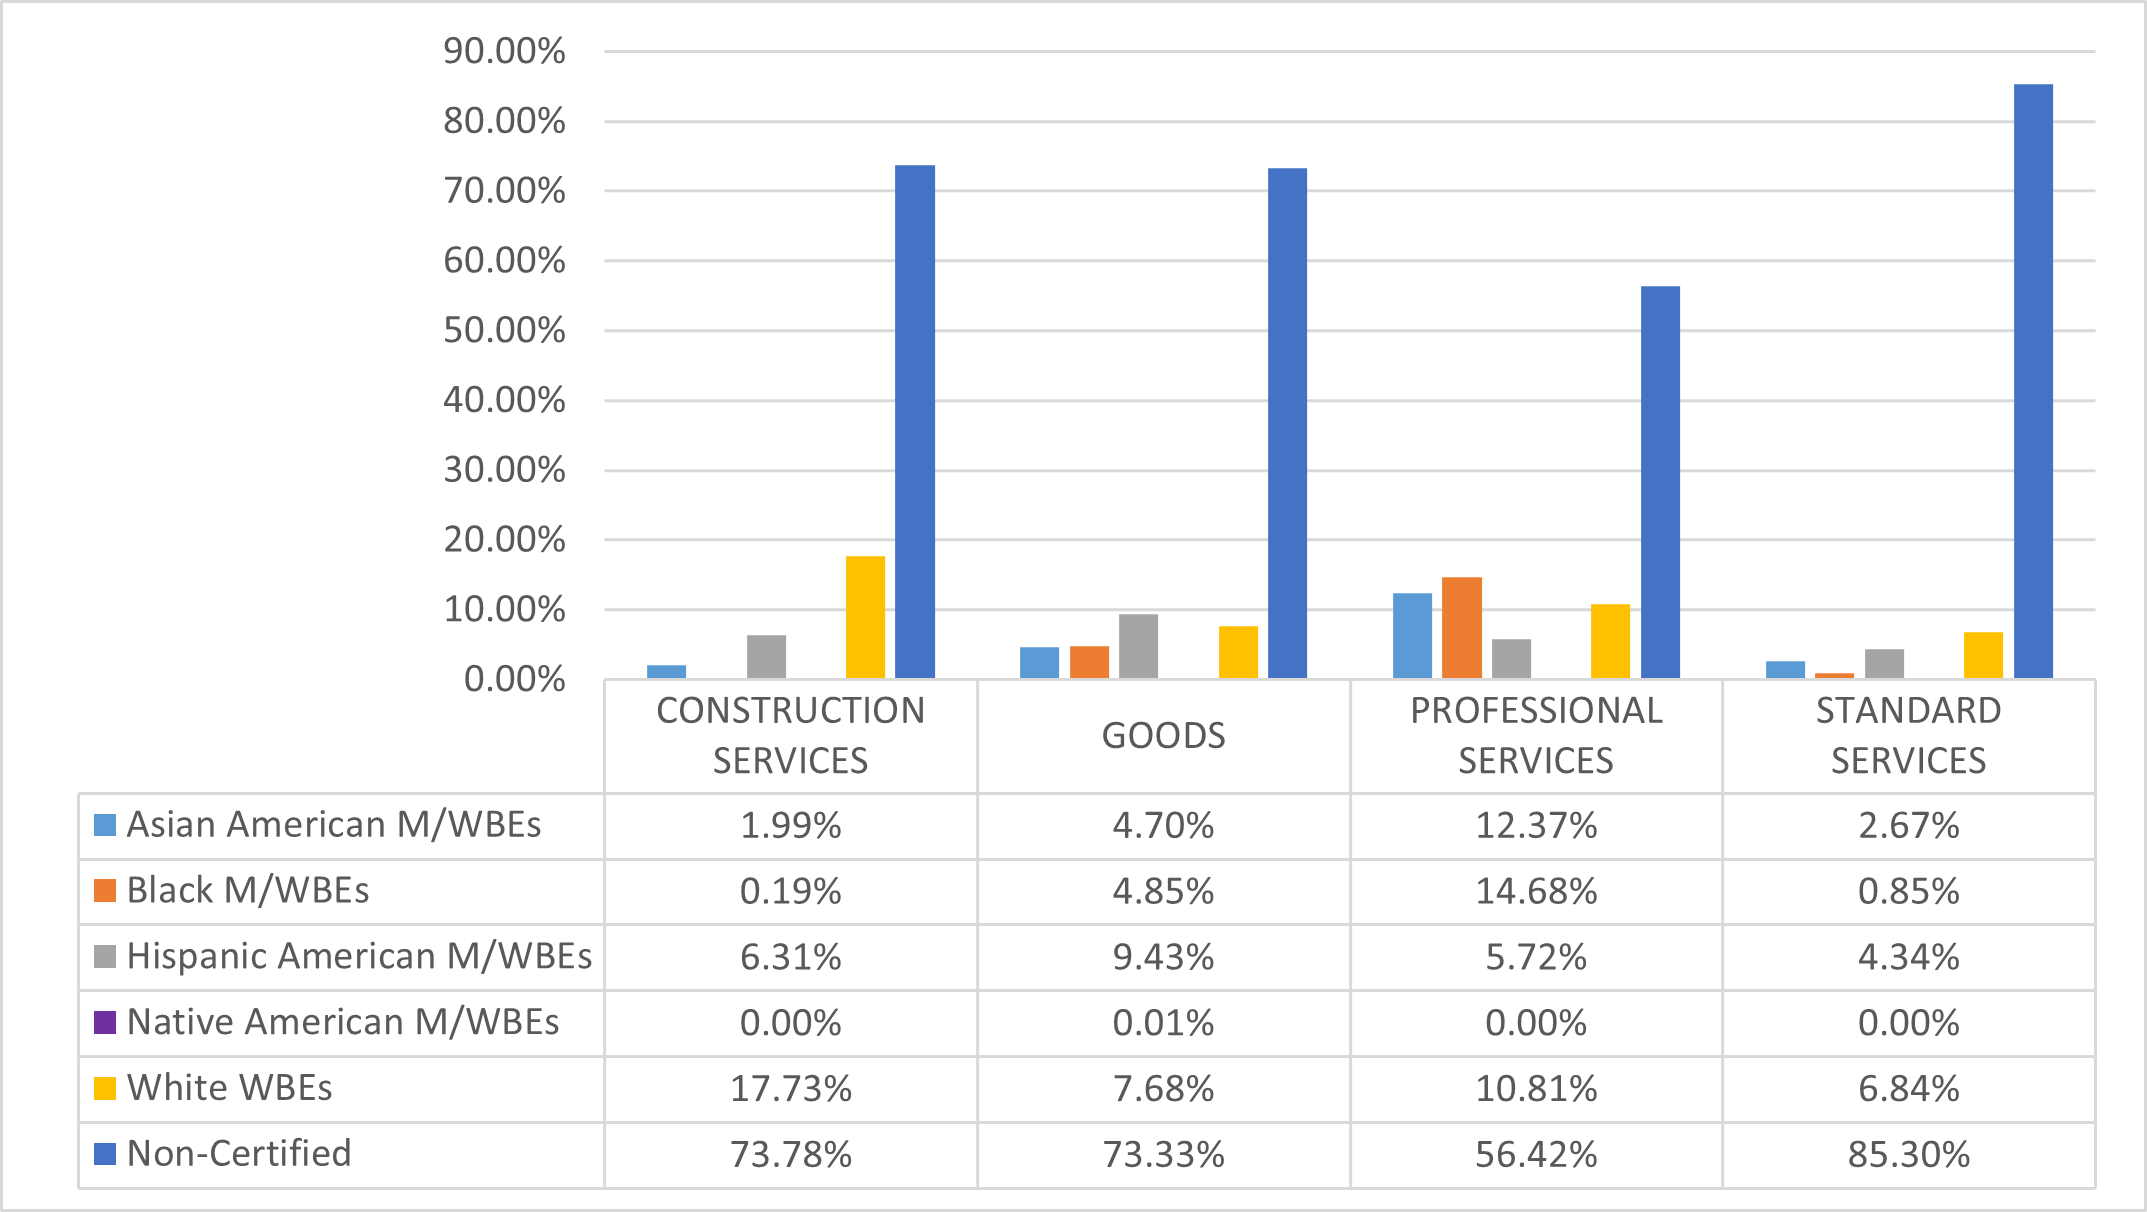
The Comptroller’s Office
The LL 174 data below represent a small share of the Comptroller’s Office’s total procurement portfolio, which includes Corpus Funded Agreements (which function as a mechanism to finance investment management services related to the City’s five pension funds), which are exempt from LL 174 participation goals. Its $50.7 million in LL 174-eligible value represents less than 0.3% of the City’s total LL 174-eligible contracting portfolio.
The M/WBE and Emerging Manager Pension Investments Report released by the Comptroller’s Office in November 2025 (included as Appendix B of this Report) showed that the New York City Retirement Systems had a total of $23.08 billion in investments with or committed to M/WBE managers as of June 30, 2025. Those investments amount to 13.3% of U.S.-based actively managed assets, or approximately 8% of the total assets under management.
Table 78: FY25 LL 174-Eligible Contracts and POs
| Certification Status | # of Contracts | % Share of Contracts | Total Registered Contract Value | % Share of Contract Value |
|---|---|---|---|---|
| All Contracts and POs | 558 | 100.00% | $499,223,929 | 100.00% |
| M/WBE | 180 | 32.26% | $9,413,055 | 1.89% |
| Non-Certified | 378 | 67.74% | $489,810,873 | 98.11% |
| LL174 Contracts and POs | 288 | 100.00% | $50,704,580 | 100.00% |
| M/WBE | 177 | 61.46% | $2,408,555 | 4.75% |
| Non-Certified | 111 | 38.54% | $48,296,025 | 95.25% |
| LL174 Subcontracts | 0 | 0.00% | $0 | 0.00% |
| M/WBE | 0 | 0.00% | $0 | 0.00% |
| Non-Certified | 0 | 0.00% | $0 | 0.00% |
Chart 123: FY25 Value of LL 174-Eligible Prime Contracts and POs
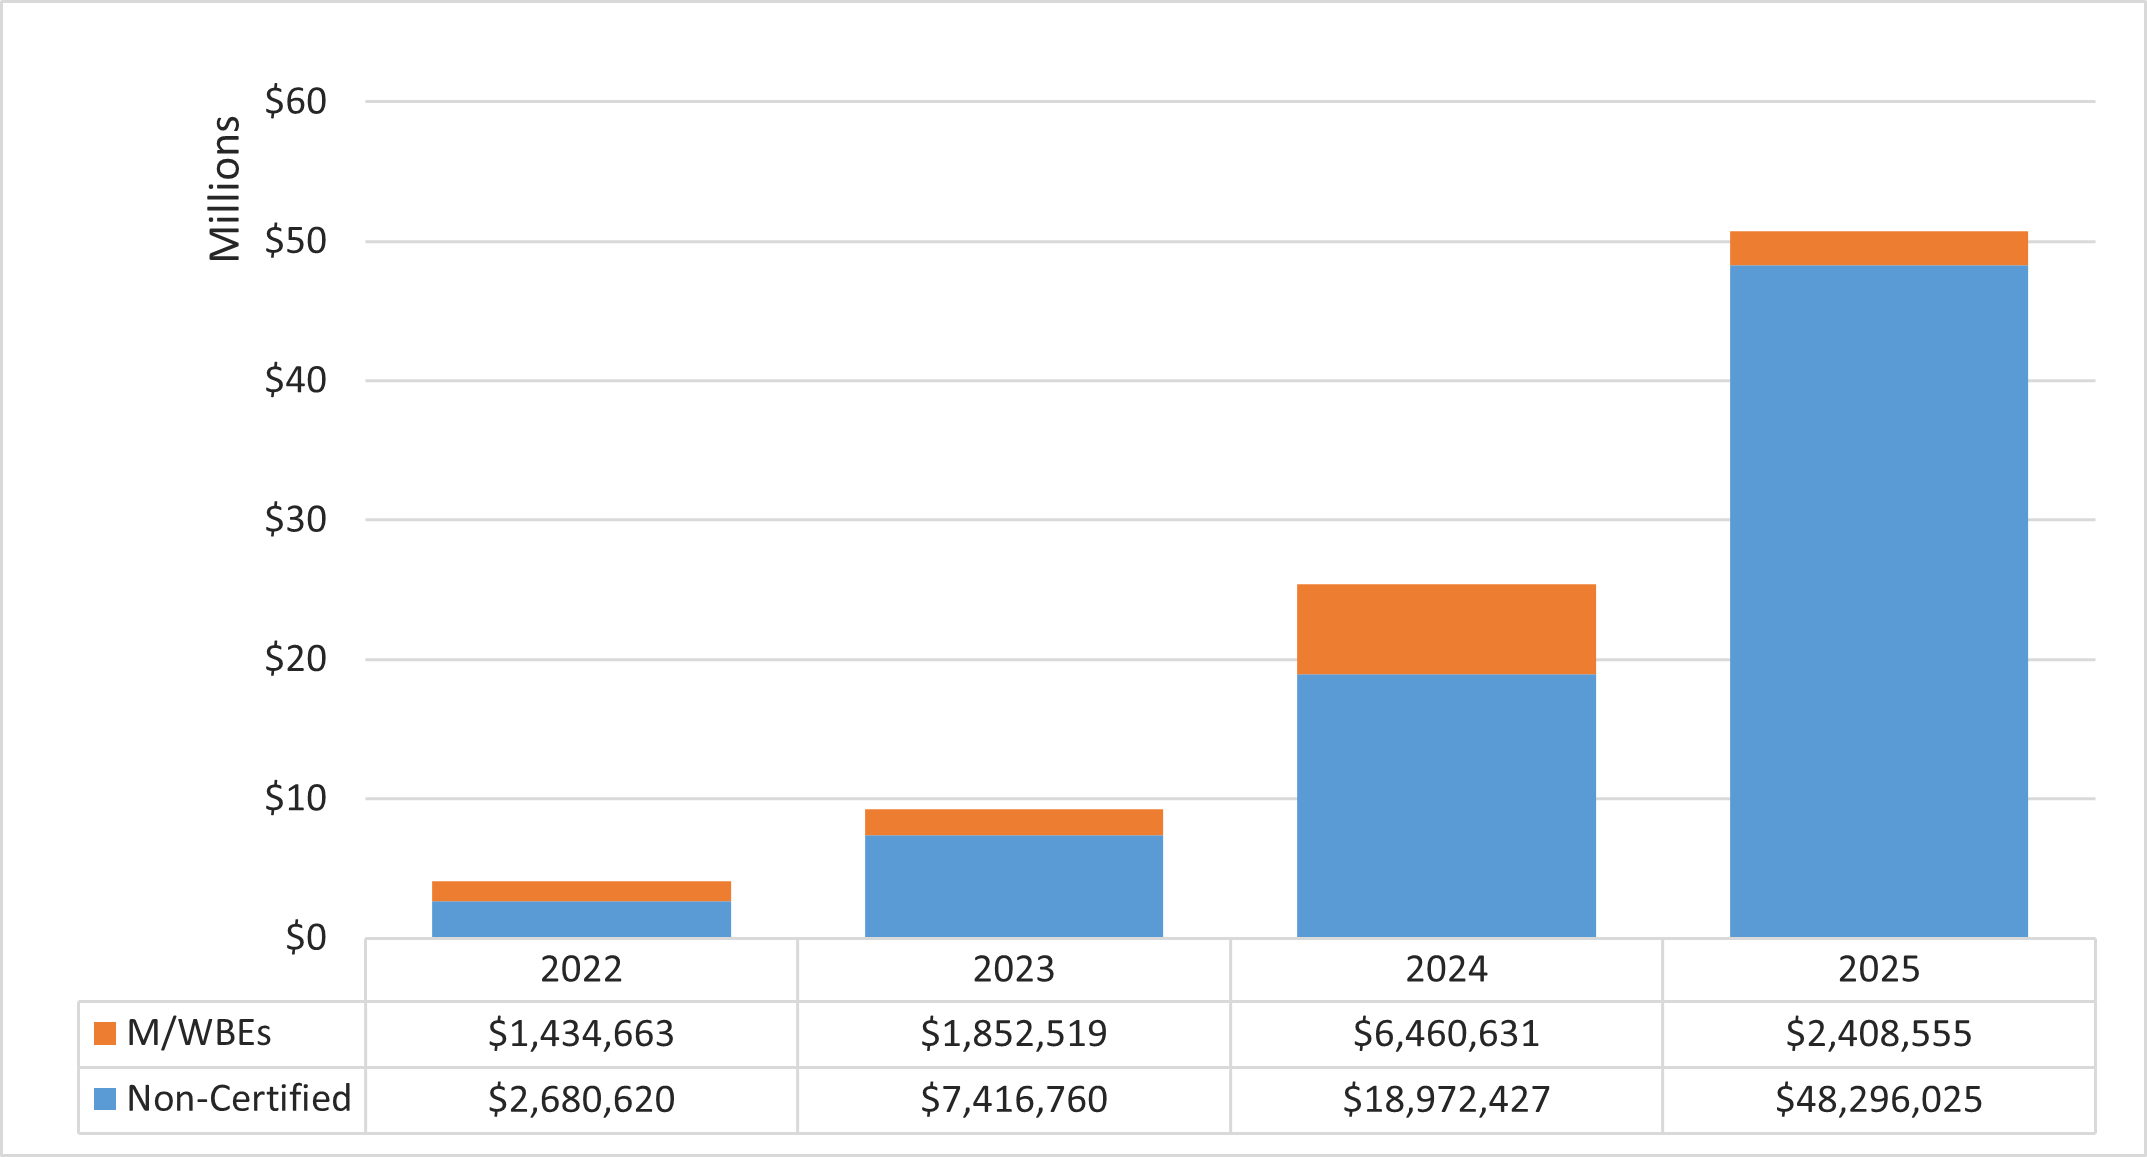
Chart 124: FY25 Value of LL 174-Eligible Contracts and POs, by Race and Gender
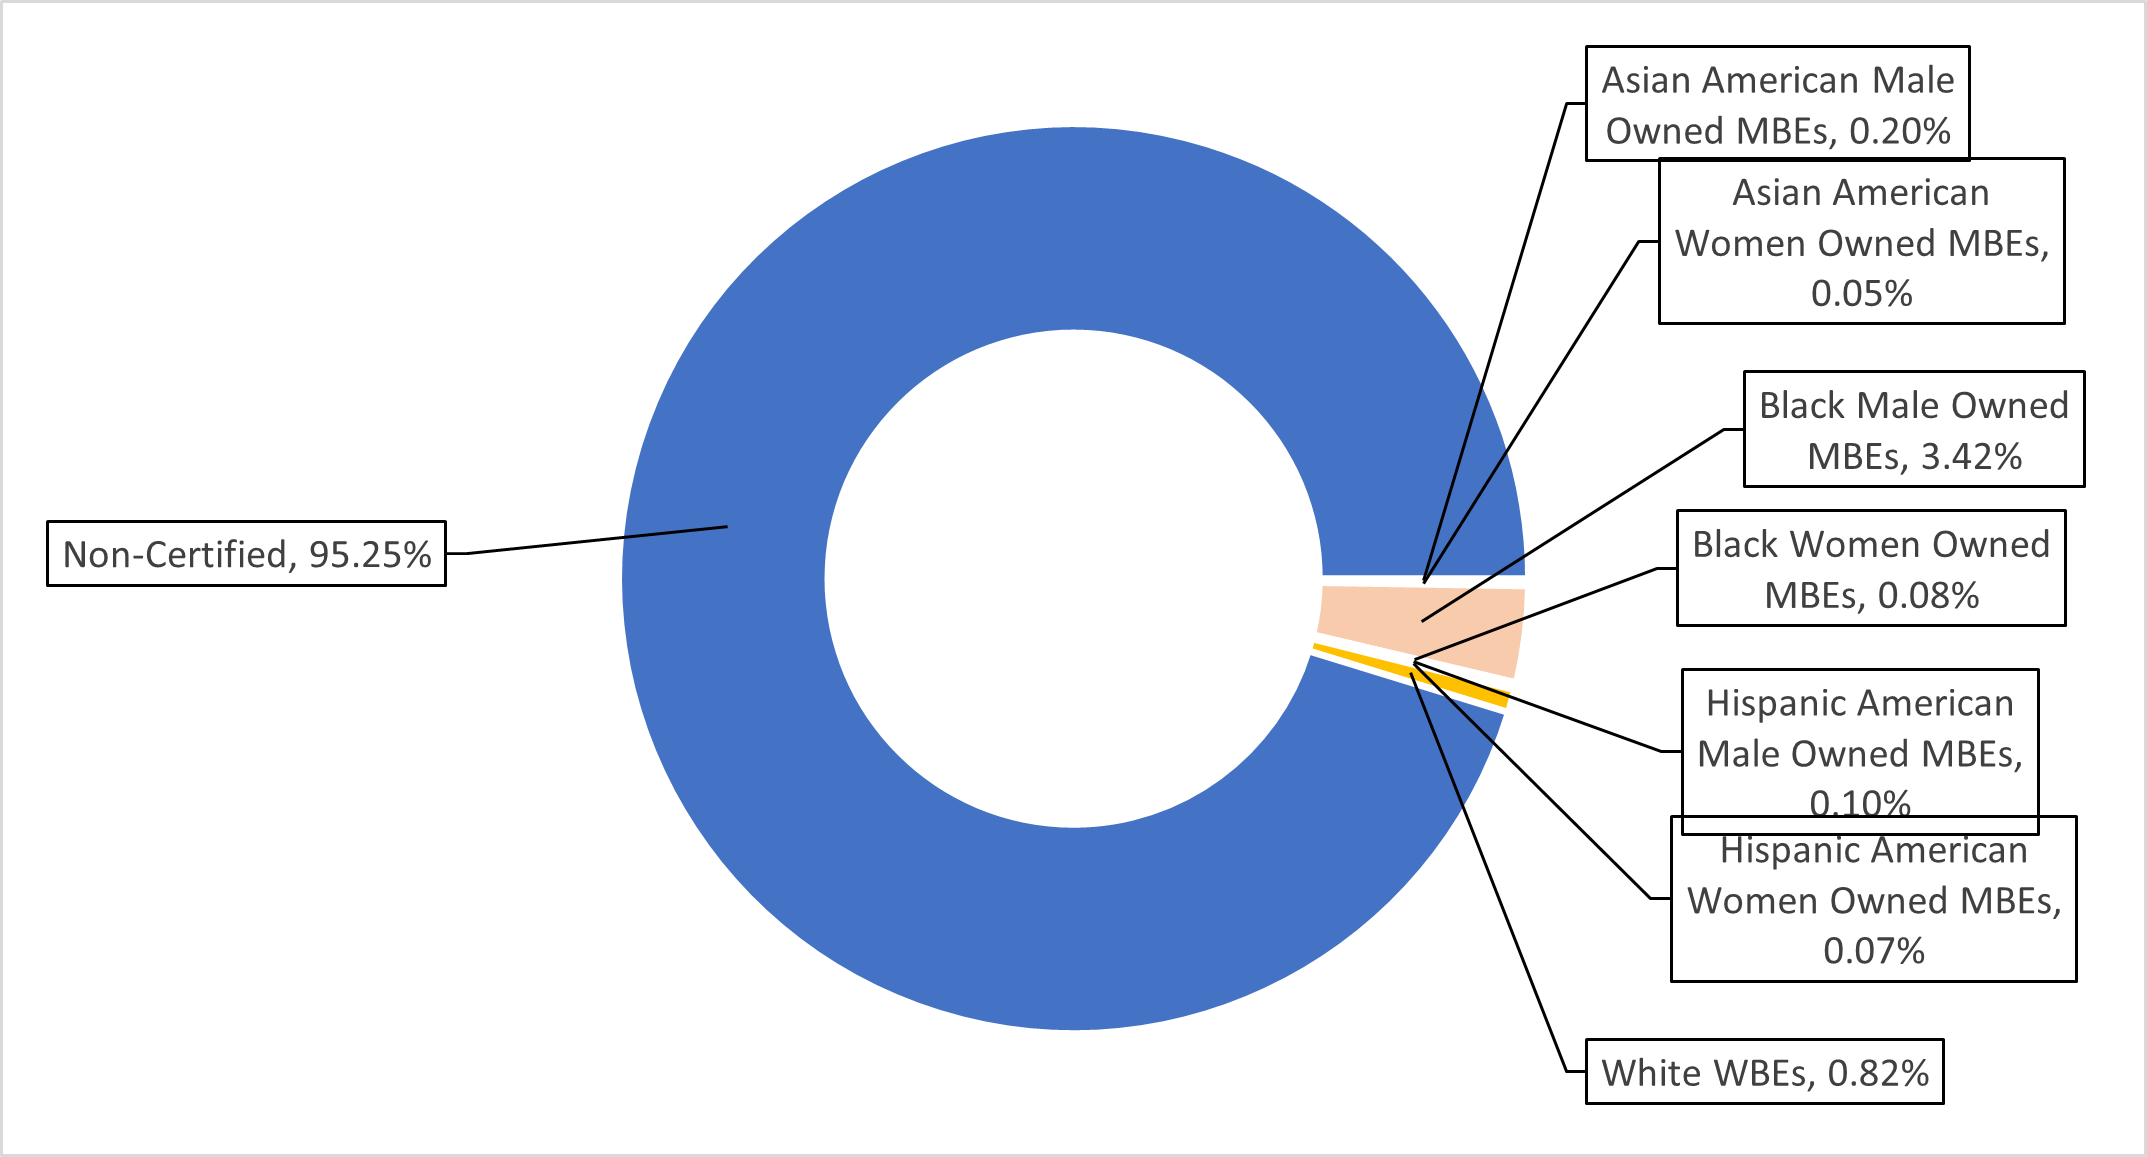
Chart 125: FY25 Share of LL 174-Eligible Contracts and PO Value, by M/WBE Category and Industry
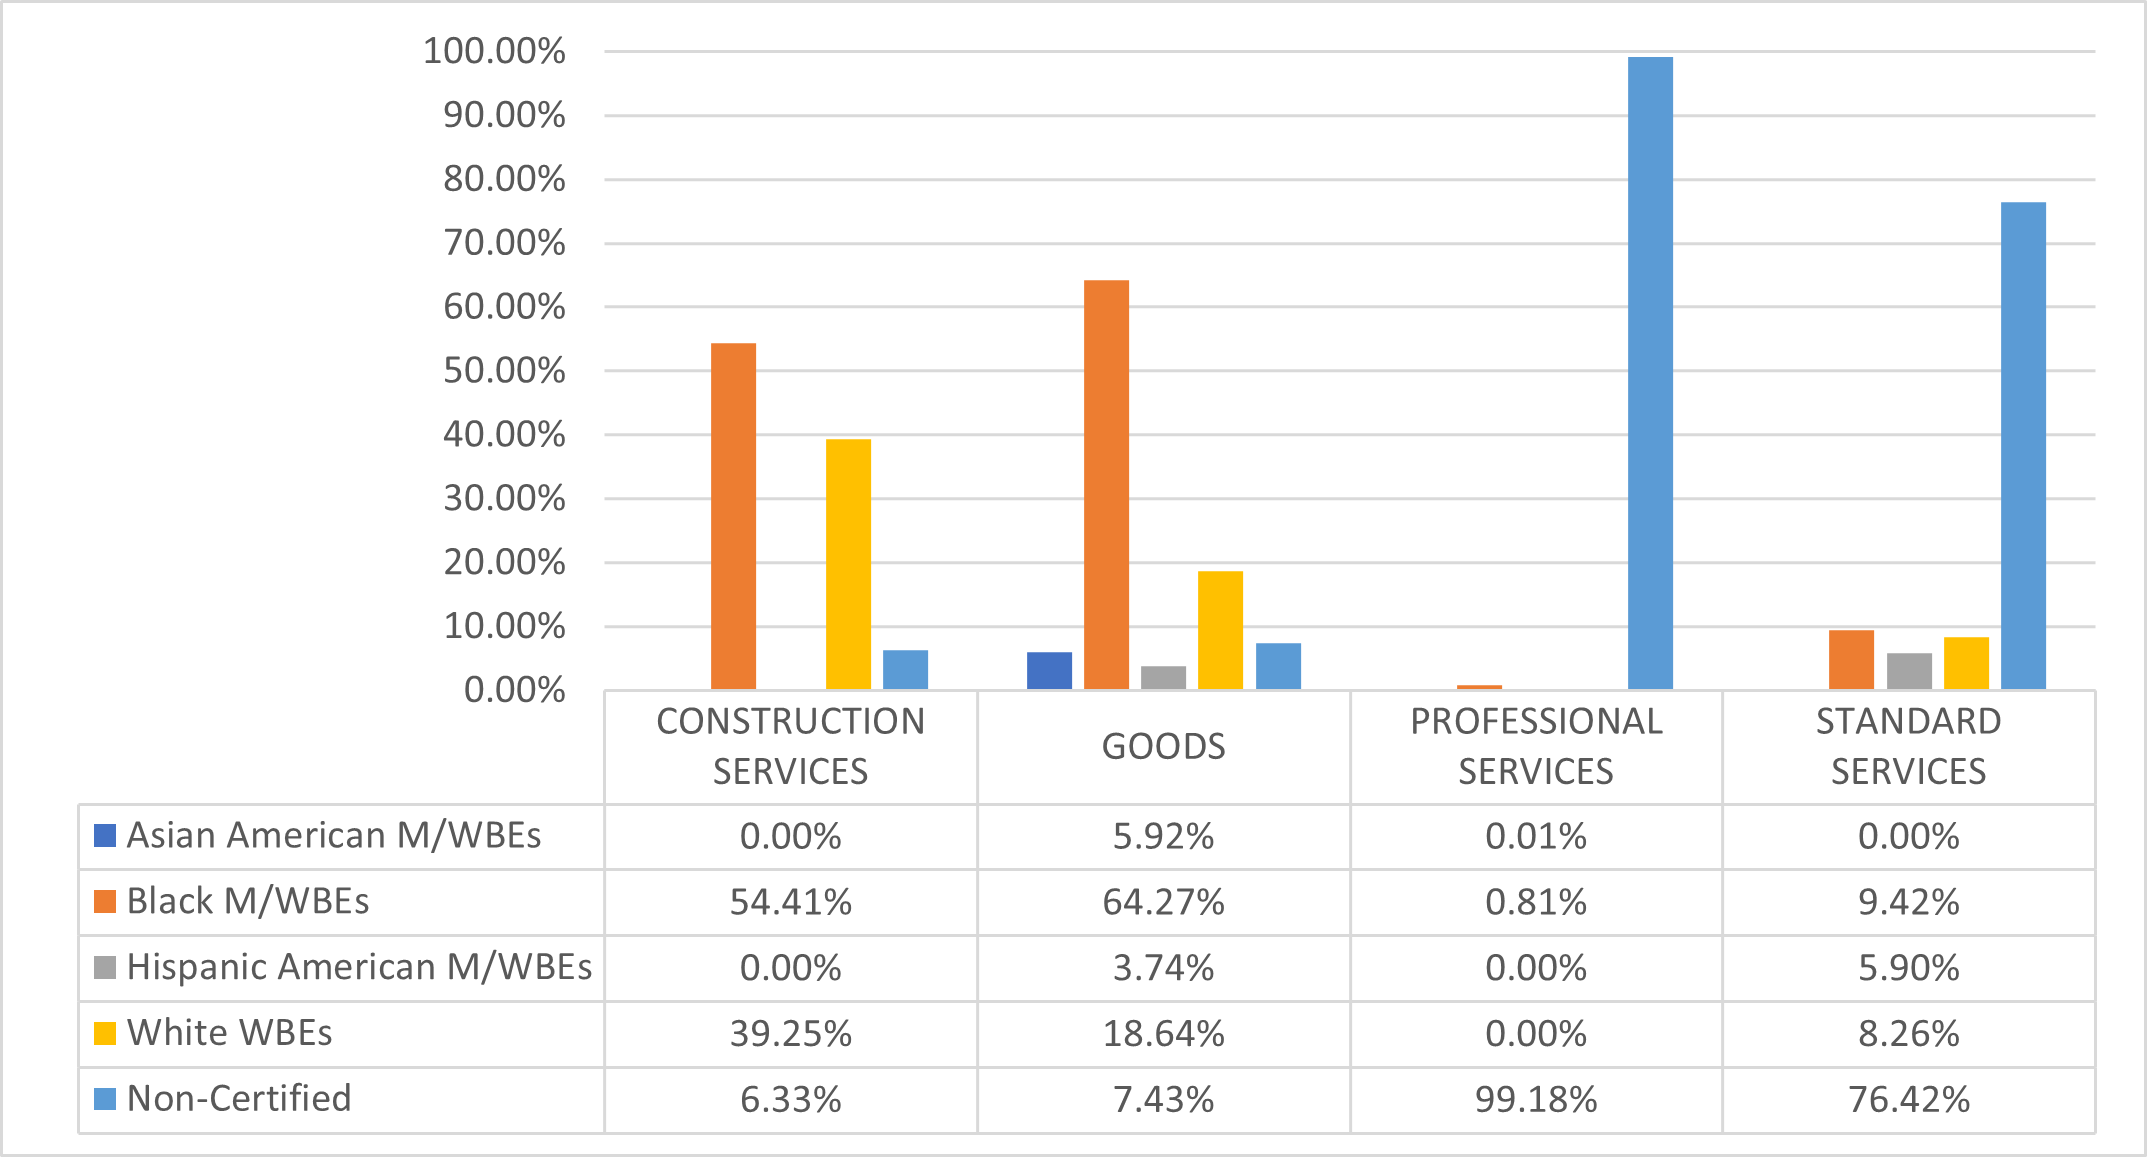
Independently Elected Officials
The Offices of independently elected officials are also subject to LL 174 participation goals. Generally speaking, these Offices manage relatively small procurement portfolios. Table 79 and Chart 126 examine registration data across each Independently Elected Official in FY25.
Table 79: FY25 Volume and Value of Contracts and POs Subject to LL 174 Participation Goals, by Independently Elected Official
| Agency | M/WBE | Non-Certified | ||
|---|---|---|---|---|
| # of Contracts and POs | Value of Contracts and POs | # of Contracts and POs | Value of Contracts and POs | |
| Brooklyn Borough President (BKBP) | 15 | $62,837 | 93 | $495,282 |
| Bronx Borough President (BXBP) | 62 | $93,648 | 300 | $363,133 |
| Manhattan Borough President (MBP) | 21 | $215,563 | 85 | $339,547 |
| Queens Borough President (QBP) | 6 | $33,448 | 56 | $223,077 |
| Staten Island Borough President (SIBP) | 27 | $15,356 | 59 | $82,079 |
| CLERK | 0 | $0 | 0 | $0 |
| City Council | 417 | $2,463,579 | 989 | $3,274,655 |
| Bronx District Attorney (DABX) | 71 | $3,008,221 | 283 | $2,119,773 |
| Brooklyn District Attorney (DAKINGS) | 88 | $1,929,347 | 263 | $1,267,473 |
| New York District Attorney (DANY) | 90 | $3,067,864 | 309 | $1,049,214 |
| Queens District Attorney (DAQ) | 52 | $2,050,958 | 361 | $1,819,964 |
| Staten Island District Attorney (DARICH) | 16 | $726,260 | 96 | $973,620 |
| Public Advocate | 3 | $32,265 | 57 | $344,007 |
Chart 126: FY25 Value of Contracts and POs Subject to LL 174 Participation Goals, by Independently Elected Official
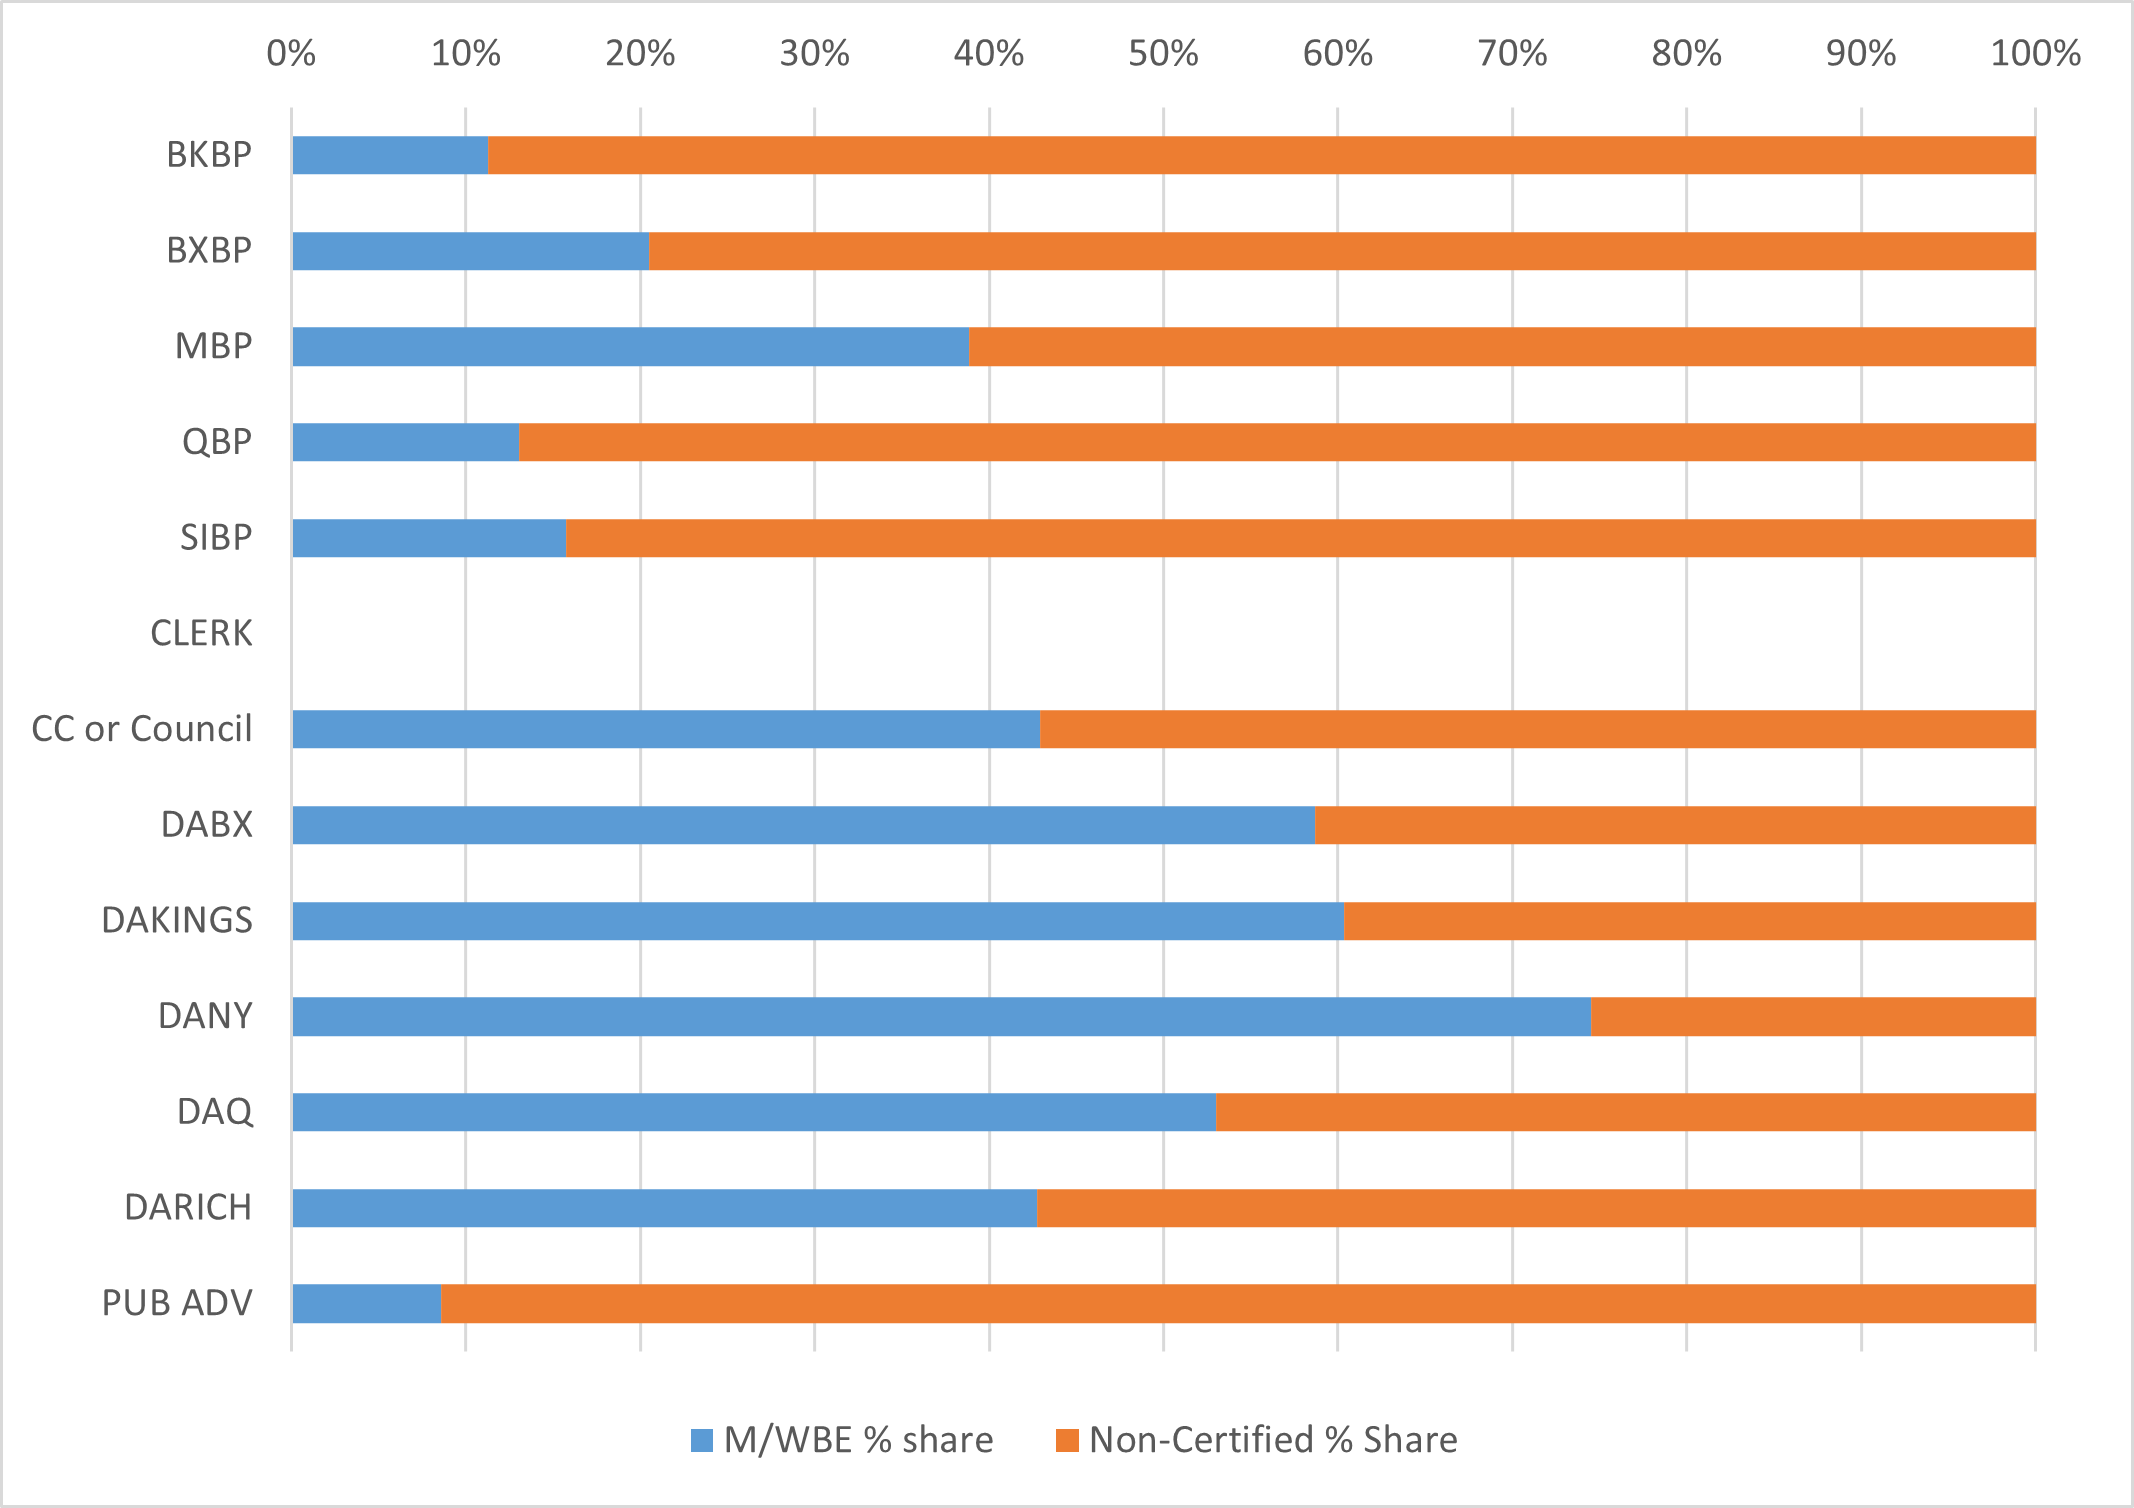
Table 80 examines the retroactivity of contracts registered to M/WBEs by Independently Elected Officials. As discussed earlier in this Report, 73% of all M/WBE contracts Citywide were registered after the contract start date. Of the Independently Elected Officials, only two registered half of their contracts prior to the contract start date.
Table 80: FY25 Volume of Retroactive M/WBE Contracts, by Elected Independently Elected Official[44]
| Agency | Registered on Time or Early | Retroactive Registrations | ||
|---|---|---|---|---|
| # of Contracts | % Share of Contracts | # of Contracts | % Share of Contracts | |
| Brooklyn Borough President (BKBP) | 0 | N/A | 0 | N/A |
| Bronx Borough President (BXBP) | 0 | N/A | 0 | N/A |
| Manhattan Borough President (MBP) | 0 | N/A | 3 | 100.00% |
| Queens Borough President (QBP) | 0 | N/A | 0 | N/A |
| Staten Island Borough President (SIBP) | 0 | N/A | 0 | N/A |
| CLERK | 0 | N/A | 0 | N/A |
| City Council | 10 | 52.63% | 9 | 47.37% |
| Bronx District Attorney (DABX) | 11 | 55.00% | 9 | 45.00% |
| Brooklyn District Attorney (DAKINGS) | 5 | 33.33% | 10 | 66.67% |
| New York District Attorney (DANY) | 6 | 35.29% | 11 | 64.71% |
| Queens District Attorney (DAQ) | 6 | 27.27% | 16 | 72.73% |
| Staten Island District Attorney (DARICH) | 0 | N/A | 4 | 100.00% |
| Public Advocate | 0 | N/A | 0 | N/A |
As is the case Citywide, Independently Elected Officials tend to use the M/WBE Small Purchase method for contracts that are far below the maximum threshold of $1,500,000.
Table 81: Volume and Average Value of M/WBE Small Purchase Method Registrations by Independently Elected Official, FY23-25
| Agency | FY23 | FY24 | FY25 | |||
|---|---|---|---|---|---|---|
| # of Contracts | Avg Value | # of Contracts | Avg Value | # of Contracts | Avg Value | |
| All Agencies | 42 | $67,457 | 98 | $99,718 | 89 | $125,047 |
| Brooklyn Borough President (BKBP) | 0 | $0 | 0 | $0 | 0 | $0 |
| Bronx Borough President (BXBP) | 0 | $0 | 0 | $0 | 0 | $0 |
| Manhattan Borough President (MBP) | 2 | $20,663 | 5 | $44,503 | 3 | $44,629 |
| Queens Borough President (QBP) | 0 | $0 | 0 | $0 | 0 | $0 |
| Staten Island Borough President (SIBP) | 0 | $0 | 0 | $0 | 0 | $0 |
| CLERK | 0 | $0 | 0 | $0 | 0 | $0 |
| City Council | 5 | $20,000 | 8 | $29,882 | 14 | $46,575 |
| Bronx District Attorney (DABX) | 8 | $138,079 | 18 | $89,254 | 20 | $147,407 |
| Brooklyn District Attorney (DAKINGS) | 3 | $44,909 | 21 | $138,603 | 15 | $105,093 |
| New York District Attorney (DANY) | 13 | $67,907 | 20 | $103,413 | 12 | $230,189 |
| Queens District Attorney (DAQ) | 6 | $53,588 | 22 | $76,541 | 22 | $107,635 |
| Staten Island District Attorney (DARICH) | 5 | $49,633 | 4 | $260,352 | 3 | $229,482 |
| Public Advocate | 0 | $0 | 0 | $0 | 0 | $0 |
Table 82 shows how each Independently Elected Official’s M/WBE Small Purchase Method contracts were distributed across unique vendors.
Table 82: Unique M/WBEs with Contracts Registered via M/WBE Small Purchase Method by Independently Elected Officials, FY23-25
| Agencies | FY23 # of Unique Vendors | FY24 # of Unique Vendors | FY25 # of Unique Vendors |
|---|---|---|---|
| All Elected Agencies | 20 | 39 | 33 |
| Brooklyn Borough President (BKBP) | 0 | 0 | 0 |
| Bronx Borough President (BXBP) | 0 | 0 | 0 |
| Manhattan Borough President (MBP) | 2 | 4 | 2 |
| Queens Borough President (QBP) | 0 | 0 | 0 |
| Staten Island Borough President (SIBP) | 0 | 0 | 0 |
| CLERK | 0 | 0 | 0 |
| City Council | 2 | 6 | 6 |
| Bronx District Attorney (DABX) | 4 | 8 | 8 |
| Brooklyn District Attorney (DAKINGS) | 2 | 11 | 10 |
| New York District Attorney (DANY) | 8 | 11 | 8 |
| Queens District Attorney (DAQ) | 3 | 9 | 9 |
| Staten Island District Attorney (DARICH) | 4 | 4 | 2 |
| Public Advocate | 0 | 0 | 0 |
M/WBE Utilization by Industry
M/WBE utilization varies across different industries. M/WBEs receive the highest volume and relative share of contracts and POs in standard services procurements, followed by goods. This is consistent with prior fiscal years.
Table 83: FY25 Volume of Contracts and POs Subject to LL 174 Participation Goals, by Industry
| M/WBE | Non-Certified | |||
|---|---|---|---|---|
| Industry | # of Contracts | % of Industry Contracts | # of Contracts | % of Industry Contracts |
| Construction | 197 | 43.88% | 252 | 56.12% |
| Goods | 5,079 | 56.55% | 3,902 | 43.45% |
| Professional Services | 575 | 43.89% | 735 | 56.11% |
| Standard Services | 14,331 | 71.92% | 5,595 | 28.08% |
| Grand Total | 20,182 | 65.81% | 10,484 | 34.19% |
Industry-specific analyses match broader trends – even where a large share of contracts is registered to M/WBEs, the relative value share remains low. This is likely because M/WBE contracts are for low-dollar-value items. This contrast is particularly stark for standard services, where M/WBEs represent over 70% of the contract volume but only about 24% of the contract value, and construction services, where M/WBEs represent nearly 44% of contract volume but less than 11% of the value.
Table 84: FY25 Value of Contracts and POs Subject to LL 174 Participation Goals, by Industry[45]
| M/WBE | Non-Certified | |||
|---|---|---|---|---|
| Industry | Total Value | % Share of Value | Total Value | % Share of Value |
| Construction | $435,084,107 | 10.11% | $3,867,132,869 | 89.89% |
| Goods | $117,643,981 | 68.12% | $55,055,280 | 31.88% |
| Professional Services | $772,748,956 | 45.28% | $933,699,800 | 54.72% |
| Standard Services | $126,876,828 | 23.59% | $410,954,140 | 76.41% |
| Grand Total | $1,475,981,884 | 21.72% | $5,319,845,538 | 78.28% |
Table 85 demonstrates that the average value of M/WBE contracts is consistently a fraction of the average value for noncertified firms, excepting contracts for goods. This seemingly greater average value is likely because LL 174 only requires participation goals for goods contracts worth up to $1 million.
Table 85: FY25 Average Value of Contracts Subject to LL 174 Participation Goals, by Industry[46]
| Industry | M/WBE Average Value | Non-Certified Average Value | Ratio of Avg Value: M/WBE to Non-Certified |
|---|---|---|---|
| Construction | $3,216,650 | $24,780,844 | 12.98% |
| Goods | $83,015 | $45,777 | 181.35% |
| Professional Services | $2,050,330 | $5,251,375 | 39.04% |
| Standard Services | $351,747 | $1,062,812 | 33.10% |
Construction
PPB Rules define the construction services industry as dealing in the planning, design, or construction of real property or other public improvements.[47] In addition to engineering and construction work, this industry also includes contracts for painting, carpentry, plumbing and electrical installation, asbestos and lead abatement, carpet installation and removal, and demolition.
Disaggregated disparities are especially stark for construction services contracts. This is particularly true for women-owned firms. Less than 1% of the value of construction services contracts were registered to businesses owned by women of color. Of the 449 contracts and POs registered for construction services in FY25, only 8 were registered to businesses owned by women of color (1.87%).
Table 86: FY25 Construction Industry LL 174-Eligible Contract Registrations and POs, by Race and Gender[48]
| M/WBE Category | # of Contracts | % Share | Total Value | % Share of Value | AVG Contract Value[49] |
|---|---|---|---|---|---|
| ALL M/WBEs (Excluding Non-Certified) |
197 | 44.17% | $435,084,107 | 10.11% | $3,216,650 |
| Asian American male-owned MBEs |
92 | 20.63% | $220,391,359 | 5.12% | $3,189,410 |
| Asian American women-owned MBEs |
4 | 0.90% | $916,628 | 0.02% | $302,436 |
| Black male-owned MBEs | 25 | 5.61% | $30,035,851 | 0.70% | $1,991,750 |
| Black women-owned MBEs | 1 | 0.22% | $21,962,348 | 0.51% | $21,962,348 |
| Hispanic American male-owned MBEs |
27 | 6.05% | $47,885,229 | 1.11% | $2,389,571 |
| Hispanic American women-owned MBEs | 3 | 0.67% | $1,992,222 | 0.05% | $1,970,722 |
| White WBEs | 45 | 10.09% | $111,900,470 | 2.60% | $4,295,018 |
| Non-Certified | 249 | 55.83% | $3,867,132,869 | 89.89% | $24,780,844 |
| Grand Total | 446 | 100.00% | $4,302,216,976 | 100.00% | $14,776,837 |
M/WBEs received about 10% of LL 174 eligible procurement value in the construction industry in FY25.
Chart 127: Share of Construction LL 174-Eligible Contract and PO Value by Certification Type, FY22-25[50]
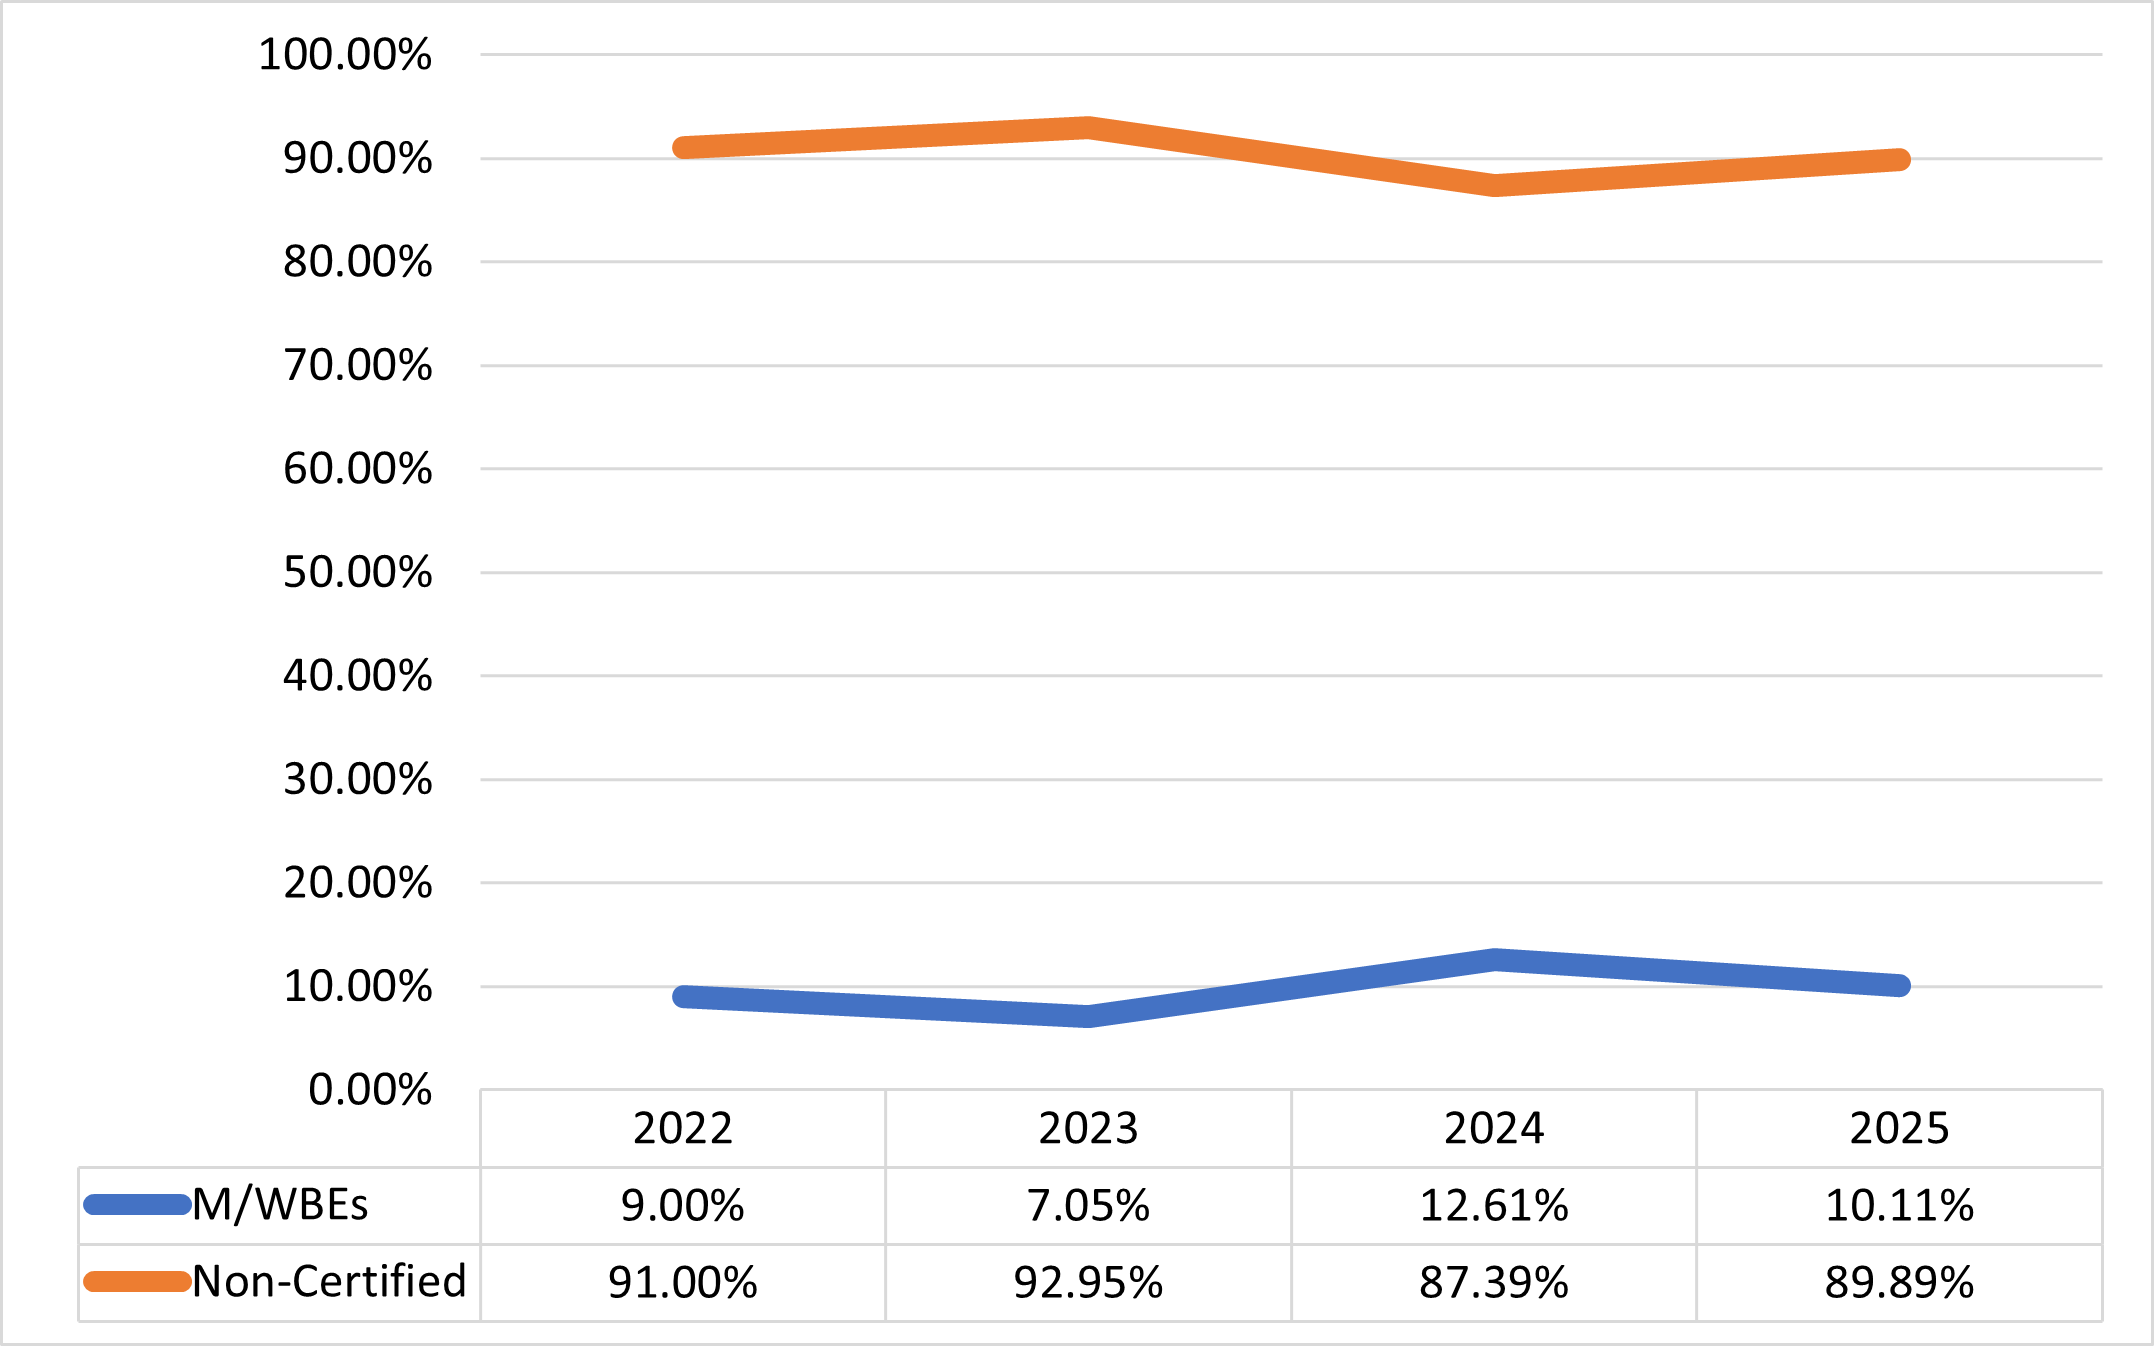
Goods Under $1 Million
The goods industry is made up of contracts for physical items and personal property, including but not limited to equipment, materials, printing, and insurance.[51] Procurements related to consumables such as food and fuel may also fall into the Goods industry. Absent directives to delegate this authority, DCAS is mandated under the Charter to purchase, inspect, store, and distribute all goods, supplies, materials, equipment, and other personal property required by any City agency.[52] In some circumstances, including for the use of the M/WBE Small Purchase method, DCAS may delegate this authority to agencies in furtherance of allowing agencies to use their discretion to award contracts to M/WBEs.[53]
Agencies most effectively utilize M/WBEs to purchase goods under $1 million, though it is noteworthy that these purchases are not very lucrative and individual purchases don’t necessarily have as much power to support the growth of a M/WBE. The highest share of goods contract registrations going to M/WBEs went to businesses owned by white women.
Table 87: FY25 Goods (Under $1 Million) LL 174-Eligible Contract Registrations and POs, by Race and Gender
| M/WBE Category | # of Contracts | % Share | Total Value | % Share of Value | AVG Contract Value5[54] |
|---|---|---|---|---|---|
| ALL M/WBEs (Excluding Non-Certified) |
5,079 | 56.55% | $117,643,981 | 68.12% | $83,015 |
| Asian American male-owned MBEs |
659 | 7.34% | $8,434,927 | 4.88% | $49,916 |
| Asian American women-owned MBEs |
342 | 3.81% | $12,112,311 | 7.01% | $96,915 |
| Black male-owned MBEs | 632 | 7.04% | $28,223,757 | 16.34% | $141,306 |
| Black women-owned MBEs | 231 | 2.57% | $4,856,203 | 2.81% | $71,391 |
| Hispanic American male-owned MBEs |
683 | 7.60% | $17,003,868 | 9.85% | $80,075 |
| Hispanic American women-owned MBEs |
236 | 2.63% | $4,916,684 | 2.85% | $75,453 |
| Native American male-owned MBEs | 9 | 0.10% | $65,005 | 0.04% | $0 |
| Native American women-owned MBEs | 1 | 0.01% | $35,940 | 0.02% | $35,940 |
| White WBEs | 2,286 | 25.45% | $41,995,286 | 24.32% | $65,737 |
| Non-Certified | 3,902 | 43.45% | $55,055,280 | 31.88% | $45,777 |
| Grand Total | 8,981 | 100.00% | $172,699,261 | 100.00% | $67,763 |
Chart 128: Share of Goods (Under $1 million) Contract and PO Value by Certification Type, FY22-25
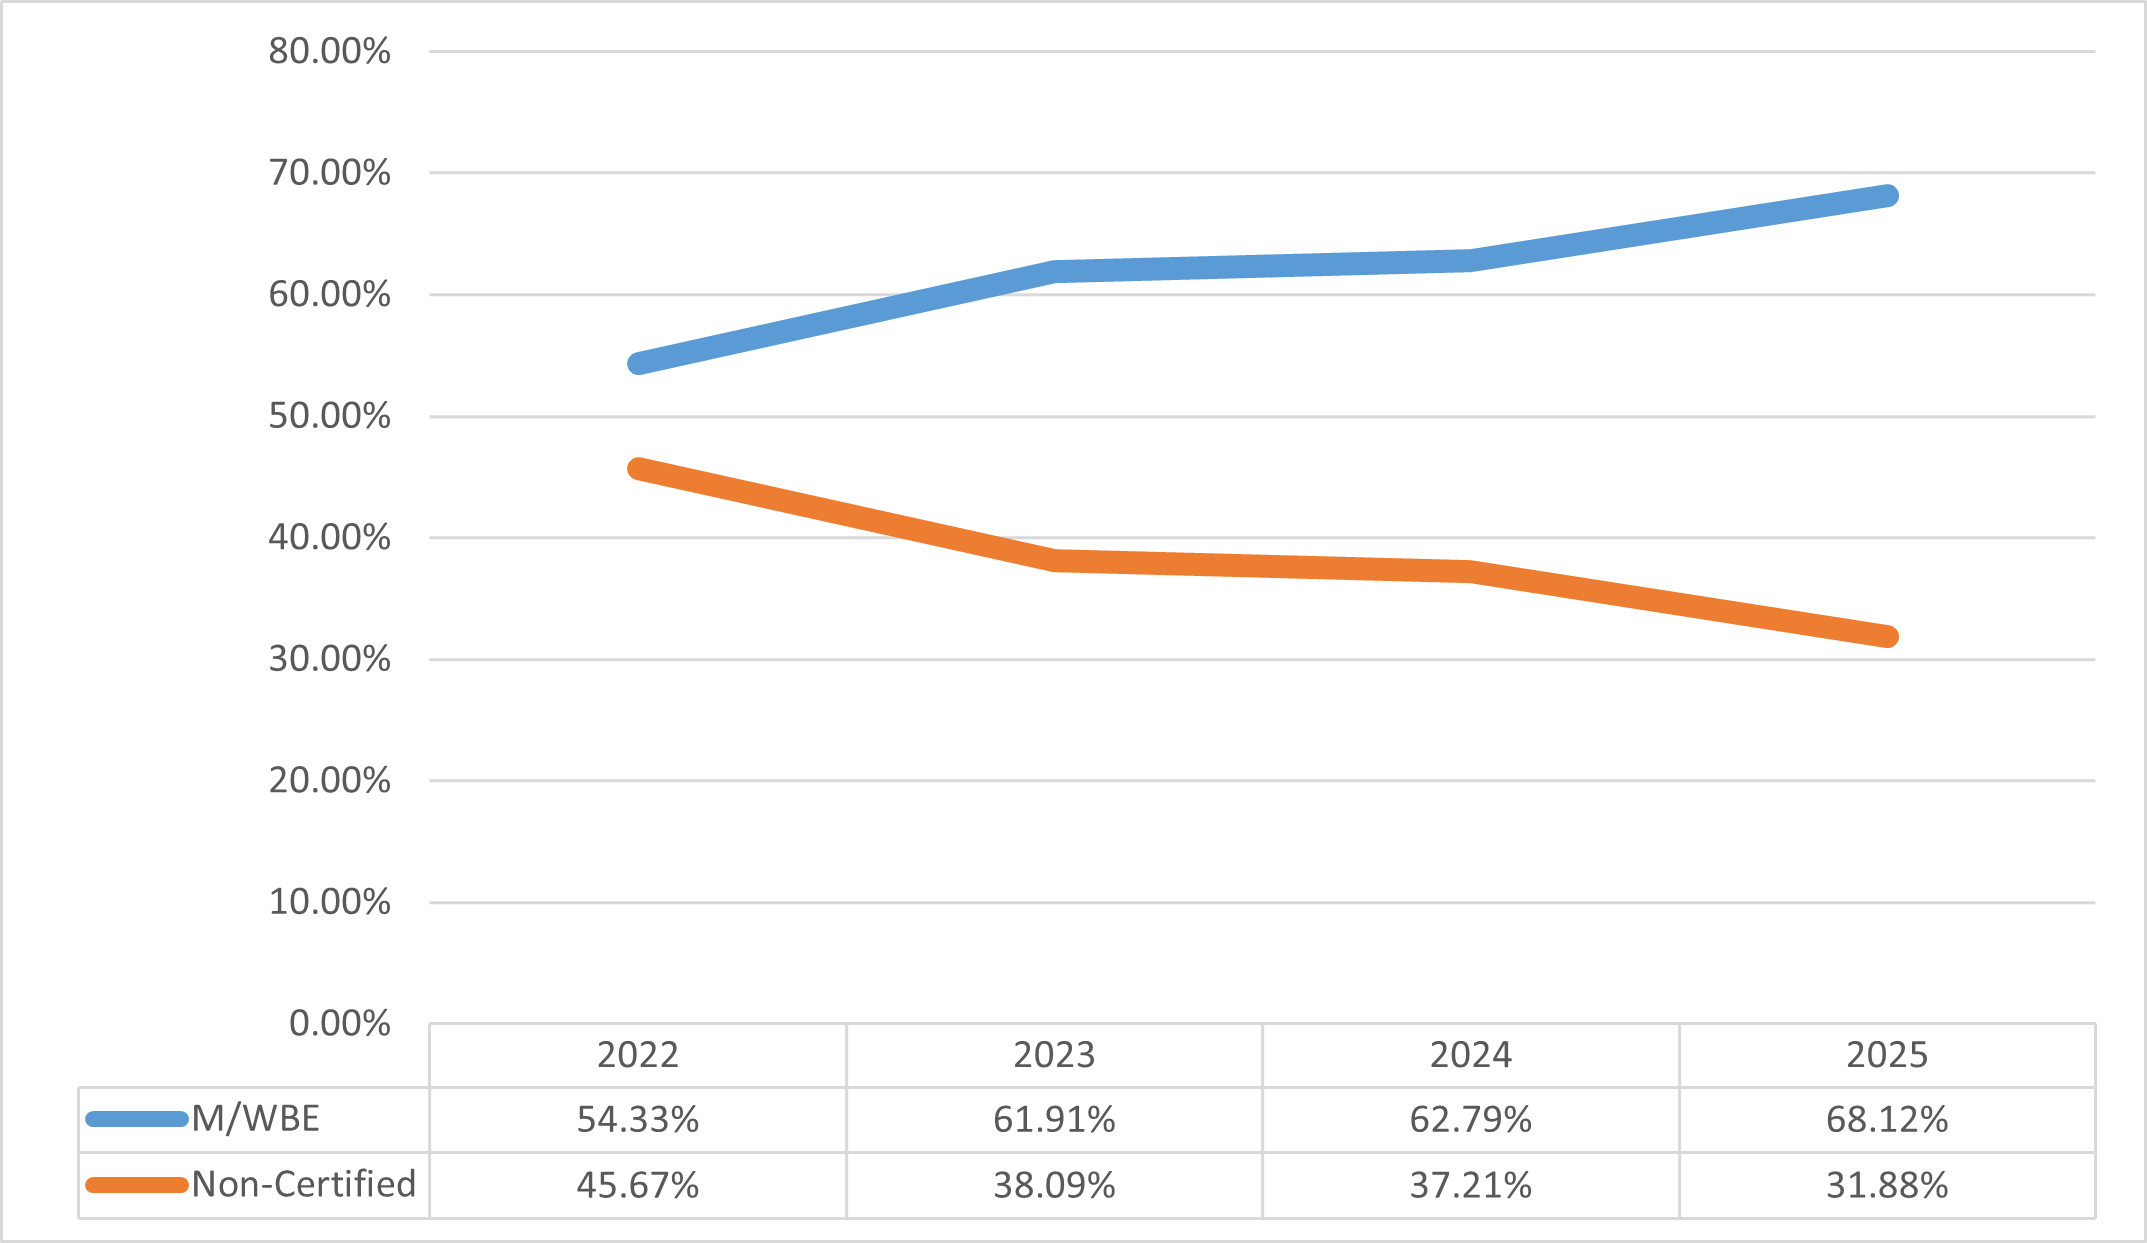
Professional Services
The professional services industry includes contracts for the provision of various kinds of expert advice and consulting, including legal services, medical services, and information technology and construction-related consulting.[55] Nearly 44% of LL 174-eligible professional services contracts were registered to M/WBEs, representing about 45% of the contract value.
Table 88: FY25 Professional Services LL 174-Eligible Contract Registrations and POs, by Race and Gender
| M/WBE Category | # of Contracts and POs | % Share of Contracts and POs | Total Contract and PO Value | % Share of Contract and PO Value | AVG Contract Value[56] |
|---|---|---|---|---|---|
| ALL M/WBEs (Excluding Non-Certified) |
575 | 43.89% | $772,748,956 | 45.28% | $2,050,330 |
| Asian American male-owned MBEs |
85 | 6.49% | $316,942,996 | 18.57% | $4,591,028 |
| Asian American women-owned MBEs |
125 | 9.54% | $108,914,833 | 6.38% | $1,120,441 |
| Black male-owned MBEs | 107 | 8.17% | $158,102,377 | 9.26% | $1,973,527 |
| Black women-owned MBEs | 41 | 3.13% | $10,459,633 | 0.61% | $465,932 |
| Hispanic American male-owned MBEs |
78 | 5.95% | $84,527,259 | 4.95% | $2,004,169 |
| Hispanic American women-owned MBEs |
29 | 2.21% | $9,252,131 | 0.54% | $458,300 |
| Native American male-owned MBEs | 1 | 0.08% | $19,309 | 0.00% | $0 |
| Native American women-owned MBEs | 0 | 0.00% | $0 | 0.00% | $0 |
| White WBEs | 109 | 8.32% | $84,530,418 | 4.95% | $1,825,798 |
| Non-Certified | 735 | 56.11% | $933,699,800 | 54.72% | $5,251,375 |
| Grand Total | 1,310 | 100.00% | $1,706,448,756 | 100.00% | $3,074,896 |
M/WBEs performed better among LL 174 eligible Professional Service Contracts in FY25 than in the prior three years. This improvement can be attributed to several on-call engineering Multiple Master Award (“MMA1s”) contracts that DDC registered with M/WBEs. While each of these contracts have a registered value of $50 million, prior reporting by this office has shown that the City often underspends against MMA1s and may not ultimately utilize them at all.[57]
Chart 129: Share of Professional Services LL 174-Eligible Contract and PO Value by Certification Type, FY22-25
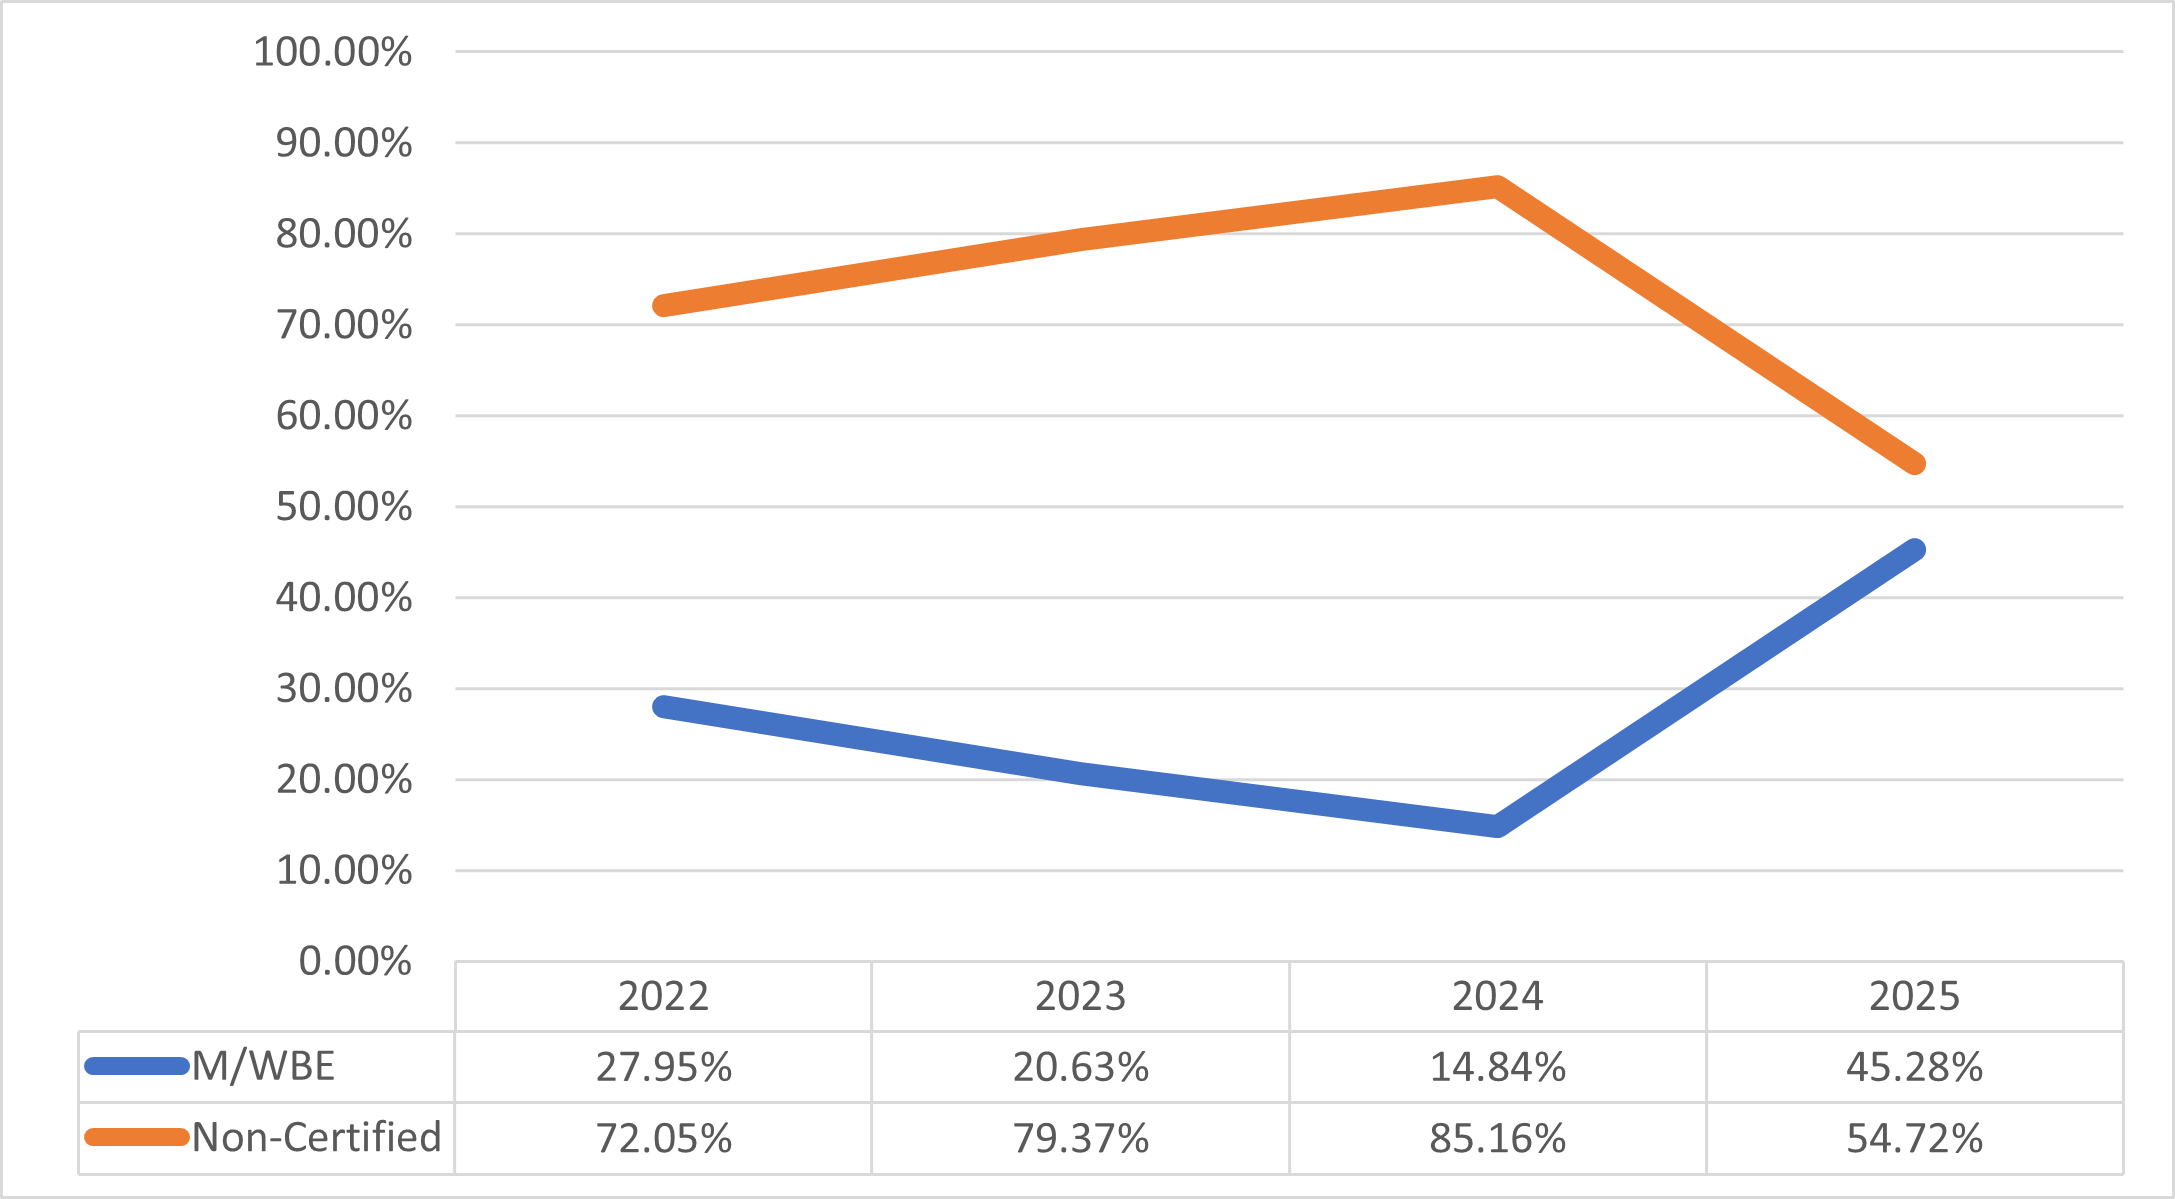
Standard Services
The standard services industry is composed of services other than professional services and human services such as custodial services, security guard services, stenography services, and office machine repair.[58] Analyses of standard services contracts show clear evidence that M/WBEs are winning less lucrative contracts than non-certified firms. Nearly 72% of LL 174-eligible standard services contracts were registered to M/WBEs, but these contracts only represent about 24% of the eligible value. Furthermore, the average value of a standard services contract registered to an M/WBE is approximately $352,000 whereas the average value for non-certified firms is nearly three times larger at $1.01 million.
Table 89: FY25 Standard Services LL 174-Eligible Contract Registrations and POs, by Race and Gender
| M/WBE Category | # of Contracts and POs | % Share of Contracts and POs | Total Contract and PO Value | % Share of Contract and PO Value | AVG Contract Value[59] |
|---|---|---|---|---|---|
| ALL M/WBEs (Excluding Non-Certified) |
14,331 | 71.92% | $126,876,828 | 23.59% | $351,747 |
| Asian American male-owned MBEs |
12,484 | 62.65% | $33,844,387 | 6.29% | $397,844 |
| Asian American women-owned MBEs |
618 | 3.10% | $12,703,332 | 2.36% | $512,105 |
| Black male-owned MBEs | 221 | 1.11% | $21,912,313 | 4.07% | $504,863 |
| Black women-owned MBEs | 66 | 0.33% | $3,971,753 | 0.74% | $132,057 |
| Hispanic American male-owned MBEs |
394 | 1.98% | $23,024,709 | 4.28% | $613,406 |
| Hispanic American women-owned MBEs |
79 | 0.40% | $6,842,777 | 1.27% | $182,560 |
| Native American male-owned MBEs | 3 | 0.02% | $15,150 | 0.00% | $0 |
| Native American women-owned MBEs | 0 | 0.00% | $0 | 0.00% | $0 |
| White WBEs | 466 | 2.34% | $24,562,406 | 4.57% | $246,209 |
| Non-Certified | 5,595 | 28.08% | $410,954,140 | 76.41% | $1,062,812 |
| Grand Total | 19,926 | 100.00% | $537,830,968 | 100.00% | $745,372 |
Chart 130: Standard Services LL 174-Eligible Contract and PO Value, FY22-25
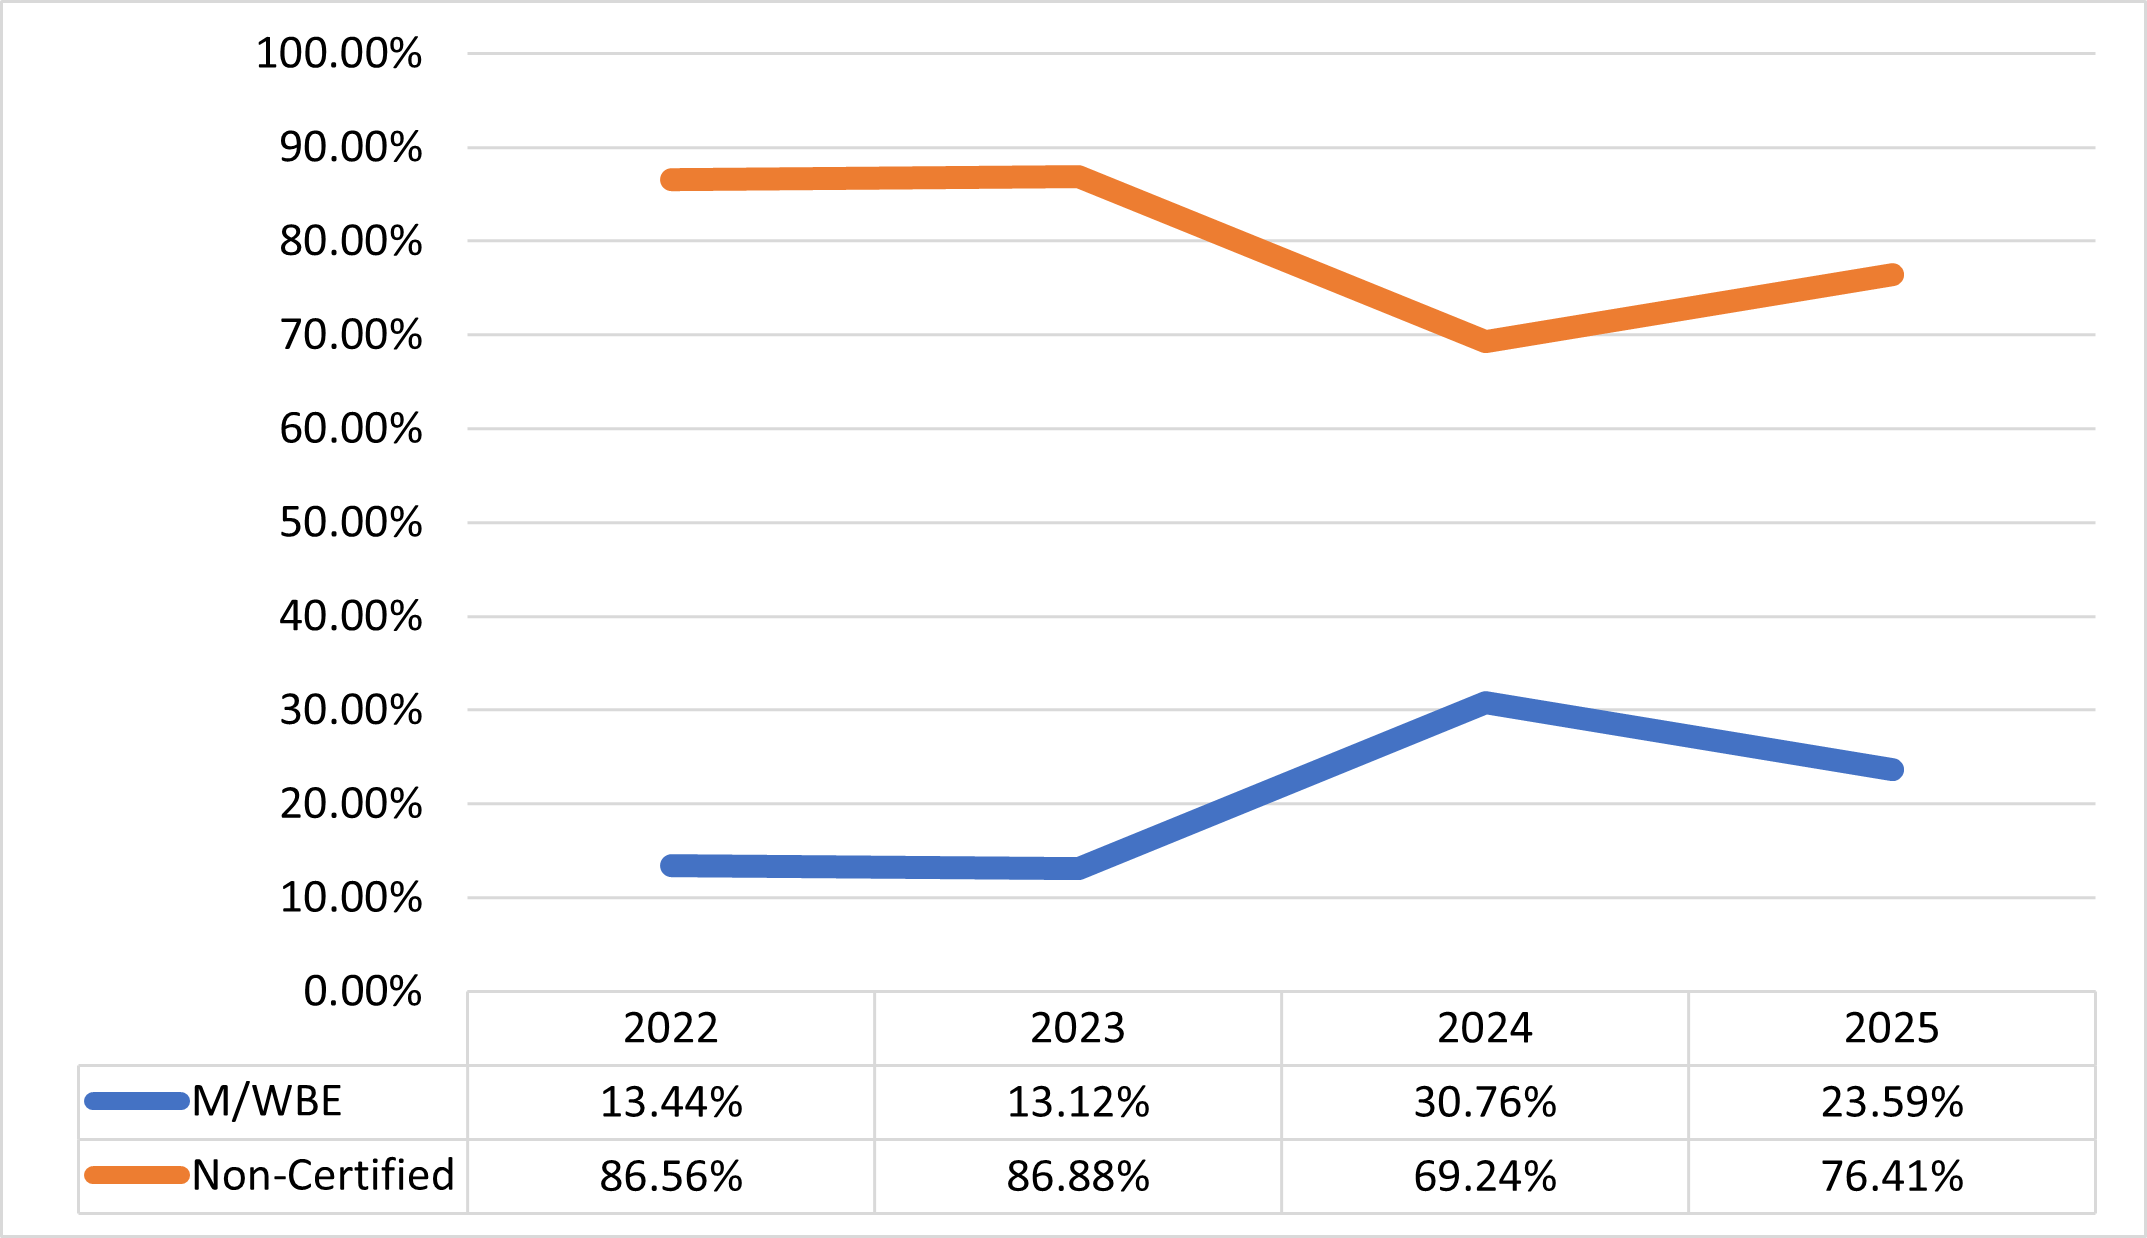
Industry Analysis of the M/WBE Small Purchase Method
Agencies most frequently use the M/WBE Small Purchase method to purchase goods and professional services. Agencies don’t frequently use this method for construction services. This is likely because such contracts typically exceed the M/WBE Small Purchase method threshold or because construction services contracts often utilize federal funding that precludes agencies from utilizing this method for contracts over $250,000.[60]
Table 90: Volume of M/WBE Small Purchase Method Registrations, by Industry, FY23-25[61]
| FY23 | FY24 | FY25 | |||||
|---|---|---|---|---|---|---|---|
| Industry | # of Contracts | % Share of Contracts | # of Contracts | % Share of Contracts | # of Contracts | % Share of Contracts | |
| Construction | 34 | 3.36% | 33 | 2.96% | 33 | 2.95% | |
| Goods | 426 | 42.14% | 505 | 45.37% | 489 | 43.74% | |
| Professional Services | 403 | 39.86% | 347 | 31.18% | 387 | 34.62% | |
| Standard Services | 100 | 9.89% | 123 | 11.05% | 125 | 11.18% | |
| Unclassified Contract | 48 | 4.75% | 105 | 9.43% | 84 | 7.51% | |
| Grand Total | 1,011 | 100.00% | 1,113 | 100.00% | 1,118 | 100.00% | |
Table 91: Value of M/WBE Small Purchase Method Registrations, by Industry, FY23-25[62]
| FY23 | FY24 | FY25 | ||||
|---|---|---|---|---|---|---|
| Industry | Total Value | Share of Value | Total Value | Share of Value | Total Value | Share of Value |
| Construction | $13,147,844 | 6.99% | $18,200,293 | 6.67% | $23,646,674 | 6.50% |
| Goods | $63,136,792 | 33.54% | $83,784,164 | 30.70% | $119,595,360 | 32.86% |
| Professional Services | $72,374,163 | 38.45% | $91,602,990 | 33.56% | $109,554,210 | 30.10% |
| Standard Services | $29,295,769 | 15.56% | $42,279,898 | 15.49% | $58,591,611 | 16.10% |
| Unclassified Contract | $10,266,269 | 5.45% | $37,051,205 | 13.58% | $52,580,034 | 14.45% |
| Grand Total | $188,220,838 | 100.00% | $272,918,549 | 100.00% | $363,967,889 | 100.00% |
Conclusion
M/WBEs continue to be disproportionately excluded from their fair share of City contracting in nearly every essential metric: their contracts represent a small share of the nearly $17.5 billion in the city’s FY25 contracted value; their contracts are, on average, a sliver of the value of contracts won by non-certified firms; and only 22% of certified M/WBEs benefitted from a new City contract in FY25. There have been several modest areas of growth and improvement, but most M/WBEs are still jumping over higher hurdles to compete with businesses owned by white men that have historically dominated the City contracting market. The City must commit to implementing policy reforms that will modernize its procurement policies, practices, and tools. These reforms will level the playing field for M/WBEs and create a procurement portfolio of vendors that matches the diversity of the City itself.
Appendix A: Procurement Methods, Tools, and Laws at Play
Contracts are vehicles by which City agencies are able to provide critical goods and services to the public. Agencies make the determination of what contracts are needed to support their programmatic missions. These may be contracts to support essential agency operations (e.g., securing office supplies or IT services for its staff) or contracts that enable the agency to fulfill certain policy initiatives, like expanding 5G access. The Comptroller’s Office published an updated Contract Primer that illustrates the contracting process in greater detail, from when an agency identifies the need for a procurement through registration of a contract with the Comptroller’s Office.[63]
A combination of relevant Executive Orders, Local Laws and other applicable rules and laws set forth the procedural requirements for each procurement method available to City agencies. This section of the Report will highlight key components of the City’s contracting processes that impact M/WBE utilization across mayoral agencies as well as the Department of Education (“DOE”) and the Office of the Comptroller.[64] The independent City agencies (such as DOE), or other agencies (such as state agencies, boards, libraries, and other corporations that perform public functions in the City) may have their own independent procurement procedures, laws, and regulations and M/WBE programs.
- Procurement Methods with Discretion that provide flexibility to City agencies to make direct contract awards to M/WBEs without formal competition.
- Other Procurement Methods that on their own or supported by supplemental procurement tools are designed to provide exclusive or more advantageous opportunities by which the City can award contracts to M/WBEs.
- Goal Based Program which requires that for procurements covered by LL 174, agencies establish participation goals that yield M/WBE prime and/or subcontracting contracts.
Procurement Methods with Discretion
The PPB Rules authorize agencies to choose from multiple procurement methods that allow contracting agencies latitude to make direct contract awards to M/WBEs without formal competition.
Small Purchases: “5+10” Rule
Small Purchases enable agencies to procure goods, services, and construction above the Micropurchase method limits without formal competition or public advertisement as long as the amount of the contract is below a “small purchase limit” set by the PBB and the City Council, currently $100,000. [65][66]
The PPB Rules outline a competition objective for the award of Small Purchases, currently known as the “5+10” method, that aims to facilitate M/WBE participation by limiting the number of Non-Certified vendors that can compete for opportunities while enabling agencies to include as many M/WBEs in the competition pool as it wishes.[67] Specifically, contracting agencies are required to solicit bids from a list of five randomly selected Non-Certified vendors and at least ten M/WBE vendors when making awards for goods and services (over $20,000) as well as construction (over $35,000), as long as the total value of the contract, including future modifications, does not exceed $100,000. The “5+10” procurement method is not supported by PASSPort; rather agencies seeking to utilize this method must access FMS, which is a separate containing a module that facilitates the solicitation and award. Through this system, vendors are randomly selected from the citywide bidders list based on FMS commodity codes (discussed in more detail later in this section) selected by the contracting agency. Agencies may proceed even if only one responsive bid or offer is received, as long as the ACCO determines the price to be fair and reasonable, the vendor responsible and that other vendors were given an opportunity to respond.
Small Purchases: M/WBE Small Purchase Method
First introduced in 2017 and since amended, the M/WBE Small Purchase method, codified under Section 3-08 of the PPB Rules, is designed to increase M/WBEs’ share in City contracts by providing contracting agencies with a tool to make direct contract awards up to thresholds authorized by the State with limited, targeted competition. Initially, in 2017 the Small Purchase method threshold was only up to $150,000 and limited to goods and services, but not construction procured using only City dollars. In November of 2019, pursuant to additional State legislative authority, the PPB unanimously voted to amend the City’s Rules to both increase the threshold up to $500,000 and expand the eligible industries to include construction. The NYC Law Department subsequently issued guidance to agencies that now permits the use of the method for federally funded procurements up to $250,000 and with certain procedural limitations. In general, contracting agencies leverage this method by soliciting at least three (3) quotes from certified M/WBEs and then award the contract to a responsible vendor that offers a fair and reasonable price.
The threshold for this method has since been amended twice—first in 2022 to increase to $1 million.[68] This threshold was raised again in 2023 to $1.5 million, as a result of advocacy from the Capital Process Reform Task Force (including the Comptroller’s Office).[69]
In FY25 the M/WBE Small Purchase method yielded a substantial share of registered M/WBE contracts (31.06%). Surpassing both the count and value totals from FY24, in FY25 city agencies registered 1,118 contracts via the M/WBE Small Purchase method, valued at $363,987,889.[70]
Micropurchase Procurement Method
Set within the Small Purchase Rule, Micropurchase procurements are those that do not exceed $20,000 for most goods and services, or up to $35,000 for construction. Unlike Small Purchases, which require limited competition but offer discretion in choice, agencies may use the micropurchase method to buy from any available responsible vendor at a fair price, without any competition. Despite this discretion, the Rules require agencies to ensure that micropurchases are distributed appropriately, including to M/WBEs.
Other Procurement Methods
The PPB Rules also provide City contracting agencies with many other methods to contract with M/WBEs, even if they offer agencies less discretion when selecting a vendor. While these methods often have longer and more detailed procedures and cycle times, they generally yield larger contracts. City agencies must deliberately and more effectively utilize these award methods to increase the share of lucrative contracts awarded to M/WBEs.
Competitive Sealed Bid (CSB) Method
The CSB is the default award method under the PPB Rules, General Municipal Law (“GML”) 103 and most other municipal procurement rules.[70] It functions to award contracts to responsive and responsible vendors that provide the lowest price point for a particular good, service, or construction while still meeting the agency‘s programmatic requirements and needs. Agencies must specify their requirements and criteria for vendors, which may include contractual terms and conditions, as well as minimum qualifications that must be met by the vendor, by issuing an invitation for bid (“IFB”).[72] CSBs are most often used for contracts pertaining to goods and construction. In fact, absent specific directives from other legal authority, CSBs are the required method for any contracts pertaining to public work contracts.[73]
Agencies may also solicit CSBs by sending notice to a list of prequalified vendors. Agencies may establish Prequalified Lists (“PQLs”) for multiple different types or sizes of projects. While opportunities for vendors to join an agency’s prequalified group must be continuously available to the public, and notice placed at least annually in the City Record, these lists are intended to save time by ensuring that prospective vendors have already been determined to hold the requisite experience, or to otherwise be capable of meeting the City’s needs.[74] While vendors must still be found responsible by an agency before being awarded a new CSB contract, agencies can conduct a preliminary background check on vendors while establishing a PQL to reduce the risk of complications.
Competitive Sealed Proposal (CSP) Method
The CSP method is another competitive method whereby agencies solicit for goods, services, or construction-related services via a Requests for Proposal (“RFP”). RFPs are generally used with the scope of a need is not well-defined, and an agency needs to understand an applicant vendor’s approach in order to make an award determination. Agencies must award proposals that are determined to be the most advantageous to the City, and may take into consideration price and other criteria, whose relative weight must be set forth in the RFP relating to technical approach, organizational capability, organizational capacity, and M/WBE status.[75] Other factors outside of those defined in the RFP cannot be considered by agencies when making award decisions, although there are generally multiple rounds of evaluation and opportunities for vendors to interview or present their proposal to an agency.[76] Like with CSBs, agencies can also issue an RFP notice to a PQL list.
CSPs are also the tool most often used to establish service master agreements. The FY24 version of this Report included a Specialized Focus on Master Agreements that included analyses that found that high-dollar-value Master Agreements are often not used up to their registered contract value and, in many instances, are not used at all. Additional information on master agreements can be found later in this Section.
Best Value Preferences for M/WBEs
In January 2020, the City adopted amendments to the PPB Rules allowing contracting agencies to consider M/WBE status when evaluating bids and proposals.[77]
Specifically, for a CSB that is typically awarded to the lowest responsible bidder, contracting agencies are authorized to give an M/WBE bidder a 10% price preference. This means that an M/WBE’s bid price will be evaluated as if it were 10% lower, which may result in more awards to M/WBEs that maintain competitive pricing.
For a limited time, including the period covered by this Report, the City required agencies to utilize Best Value for Bids for goods and standardized services.[78] As of a CCPO Directive issued August 1, 2025, agencies are no longer required to use Best Value for Bids for goods or standardized services.
Alternatively, for a CSP, the City must provide either a 10%-point preference or, if the proposal score meets or exceeds a minimum threshold for quality, either a 10% price preference or a 10%-point preference to an M/WBE’s proposal score. These quantitative preferences are required to be applied to CSP’s for goods, standard services, and professional services. Note that for construction-related consulting services, rather than 10%, M/WBEs must receive a 5%-point preference. As noted in the prior iterations of this Report, contracting agencies can increase M/WBE utilization by leveraging best value tools when using the CSB and CSP methods of procurement. However, analyses in earlier sections of this Report find that most RFBs and RFPs still result in awards to non-certified firms.
Negotiated Acquisition Contracts
Under section 3-04 of the PPB rules, agencies can move to limit competition via a negotiated acquisition procurement when the ACCO determines, with CCPO approval, that:
- There is a time-sensitive situation where a vendor must be retained quickly to meet the terms of a court order or consent decree, to avoid loss of available funding, to ensure continuity of services, or similar.
- There are a limited number of vendors available and able to perform required work.
- There is a compelling need to extend a contract beyond the typical twelve-month limit
- There is a need to procure legal services or consulting services in support of current or anticipated litigation, investigative or confidential services.
- There are previously unforeseen or unforeseeable construction-related service needs, typically after construction has begun, that cannot be addressed by a change order or other contract modification.
Negotiated acquisition extensions are typically used when agencies have exhausted all contractual renewals, as well as contract extensions permitted by other sections of the PPB Rules, because goods or services were needed for a longer time than originally anticipated, or because the agency has not been able to procure a replacement contract in a timely manner.
In spite of the fact that Negotiated Acquisition contracts are supported by a particular need that may dictate a preferred vendor, the LL still mandates that agencies make reasonable efforts to meet participation goals by requiring them to engage in outreach activities that encourage M/WBEs to complete for these procurements.[79]
In FY25 there were 962 negotiated acquisitions registered for a total value of $4,058,851,691.[80]
Emergency Procurement Contracts
The Charter and PPB rules define an emergency condition as “an unforeseen danger to life, safety, property, or a necessary service” which creates an immediate and serious need for goods, services, or construction that cannot be met quickly enough through normal procurement methods.[81] Agencies seeking to utilize this procurement method must solicit and receive prior approval from the Comptroller’s Office and Corporation Council. They must also seek to obtain as much competition in vendor selection as is possible and practical given the conditions of the emergency.
Agencies then submit a formal emergency declaration to the Comptroller’s Office and Corporation Counsel for approval, and to the City Council for notice. The emergency declaration must include information about the emergency itself, the goods or services or construction needed, the projected cost, the vendor selected in the emergency procurement, and basis of the awarded vendor’s selection. While work can begin under the framework of the emergency declaration prior to a contract’s registration, agencies must still submit contract packages to the Comptroller’s Office for registration before funds are made available to pay vendors.
On August 8, 2023, Mayor Adams issued Executive Order 34 (“EO 34”) to encourage better accountability and outcomes for M/WBEs. Among other mandates, EO 34 requires mayoral agencies to consider at least one quote from an M/WBE on all emergency procurements. EO 34 builds upon a previous Executive Order 59 (“EO-59”) issued by Mayor DeBlasio on July 28, 2020, in response to the ongoing State of Emergency due to the threat of COVID-19. EO-59 stated that agencies “shall not categorically exempt Emergency contracts from M/WBE participation goals, and shall instead, to the extent practicable in light of the nature of the procurement, follow the procedures set forth in Section 6-129(h) and (i) of the N.Y.C. Administrative Code to set goals for the contract.” Even absent a policy directive to engage with M/WBEs, and similar to Negotiated Acquisitions, the LL mandates agencies to conduct outreach encouraging M/WBE to compete for Emergency procurement contracts.[82]
This Office released “Rethinking Emergency Procurements” on November 30, 2023, which included a focused analysis on M/WBE utilization in emergency procurements. M/WBEs were awarded just 15% of the count of contracts included in the Report’s lookback period, amounting to only 3.45% of the total emergency procurement value. This Report can be found at this link: https://comptroller.nyc.gov/reports/rethinking-emergency-procurements/
Master Agreements
Master Agreements enable City Agencies to streamline the typically lengthy process for making purchases by establishing an “on-call” relationship with vendors under pre-arranged contractual terms. These contracts are typically used by the City in situations where the agency has projected a future need, but the volume and frequency of City purchases can’t be determined. Master Agreements benefit vendors since they have the potential to reach a wider customer base and agencies that can use these contracts to procure goods or services in a timelier manner.
There are two types of Master Agreement contracts:
- Master Agreements (MA1s) seek to leverage the City’s greater buying power and get the best possible price for a good or service. Only Department of Citywide Administrative Services (DCAS), the Office of Technology and Innovation (OTI), and the Department of Education (DOE) are authorized to register MA1 contracts.
- Multiple Master Agreements (MMA1s) allow a City agency to establish a common set of contractual terms ahead of time with a pre-selected group of vendors, which they can later call upon to provide a good or service in the future.
The FY24 Annual Report on M/WBE Procurement included a specialized focus on MMA1s and found that the City often underspends against MMA1s and may not ultimately utilize them at all.
M/WBE Certification
City-certified M/WBEs are certified by SBS.[83] A business seeking M/WBE certification must meet the following eligibility requirements:
- The business is legally authorized to transact business in New York State.
- The business has been in operation (i.e., selling goods and/or services) for at least one year.
- At least 51% of the business is owned, operated and controlled by a U.S. Citizen(s) or U.S. permanent resident(s) who are women and/or members of designated minority groups including:
- Black
- Hispanic
- Asian-Pacific
- Asian-Indian
- Native American
- The business has one of the following legal structures:
- Sole proprietorship
- Limited Liability Company (LLC)
- Corporation
- Limited Liability Partnership (LLP)
- Limited Partnership (LP)
- General Partnership
- The business’ principal office, place of business or headquarters is located within the five boroughs of New York City or in one of the following counties in New York and New Jersey:
- Nassau
- Putnam
- Rockland
- Westchester
- Suffolk
- Bergen
- Hudson
- Passaic
Note: a business located outside of New York City and outside of the designated counties noted above may qualify for M/WBE certification if the applicant can prove a substantial presence in the geographic market of New York City. Substantial presence can be demonstrated by providing documentation that satisfies at least two of the following conditions:
- Maintenance of a bank account for at least six (6) months in the City, or engagement in other banking transactions in the City, and/or
- Possession of a license (i.e., by the business or by at least one owner) issued by a New York City agency supporting its ability to transact business in the City, and/or
- Proof of business transactions, or attempted business transactions, in or with the City more than once over the past three (3) years
Additional information about M/WBE certification, including required documentation, can be found on SBS’ website: Minority and Women-owned Business Enterprise (M/WBE) Certification Program | City of New York (nyc.gov).
Participation Goals Program
Separate from the independent tools outlined above that can support the award of higher dollar value contracts to M/WBE prime vendors, agencies have a legally mandated responsibility to include M/WBE participation goals when using many of those methods as sourcing vehicles. As discussed below, when used effectively, participation goals ensure maximum M/WBE utilization even in circumstances where the chosen procurement method does not result in a contract award to an M/WBE prime.
The inception of the City’s M/WBE program was borne out of a disparity study which is discussed further along in this Report. Currently, the City’s Program is currently governed by Section 6-129(b) of the Admin Code, which codifies Local Laws 174 and 176 enacted by the City Council in 2019.[84][85] This legislation outlines mandated M/WBE participation goals for mayoral agencies and those of Elected Officials. As of this most recently amended guidance, contracting agencies are expected to establish and ensure that M/WBE participation goals are met for all eligible procurements in:
- Standard services;
- Professional services;
- Construction services;
- Goods (up to $1 million)
There are some specified exceptions, including but not limited to:[86]
- Emergency procurements;
- Intergovernmental (NY State Office of General Services (OGS)/ U.S. General Services Administration (GSA)) procurements;
- Sole source contracts;
- Government-to-government procurements;
- Contracts subject to federal or state funding requirements that preclude the City from imposing M/WBE participation goals or impose their own Disadvantaged Business Enterprise (DBE), MBE, or WBE goals;
- Human services procurements;
- Any procurement that results in an award to a not-for-profit entity; and
- Any procurement that is not competitively awarded (i.e., Required Authorized Source, etc.)
On all eligible procurements, agencies are required to establish M/WBE participation goals that maximize M/WBE utilization. If an eligible procurement results in the establishment of master agreement with task/work orders that are individually registered, goals are not set on the prime contract, as the scopes of work may not yet be known. Rather, the task orders issued pursuant to the master agreement may be subject to goal setting. In establishing participation goals, the City is required to ensure that substantial progress is made toward attaining the citywide goals set forth in the LL in as short a time as practicable. It is important to note that the discretionary procurement methods discussed earlier are not excluded from the LL 174 requirements, making it all the more critical that the City consider all eligible procurement methods as critical vehicles by which to attain higher M/WBE utilization.
These goals include specific contracting participation goals for each individual M/WBE category: “Black Americans, Asian Americans, Hispanic Americans, Native Americans, Women, and Emerging”. While the LL permits agencies to set an “unspecified goal,” which a vendor may meet by using an M/WBE regardless of certification category, when setting participation goals, agencies are required to consider the potential for the purchase to provide opportunities for specific categories of M/WBEs to develop greater capacity and to increase competition for city procurements.[87] In fact, Agency annual utilization plans, which are submitted to the speaker of the council and publicly posted, must include an explanation if any goal is different than the participation goal for the relevant group and industry classification as set forth in the LL.[88]
Monitoring a vendor’s compliance with the contractually required goal is outside the scope of this Report, though subcontractor compliance challenges are addressed earlier in this Report. It is important to understand that both an agency and the vendor’s compliance with goals is based on the dollar amount that is paid or obligated to be paid to an M/WBE. Therefore, the goal sets the legal benchmark for utilization, but prime and subcontract expenditures ultimately measure actual compliance and success. Much of the analyses in this Report focus on procurements subject to the City’s participation goals program.
Disparity Studies
New York City’s M/WBE program was created in 1992 in response to an initial disparity study that analyzed the availability and representation of M/WBEs in City contracting. The City is required to conduct this review at least once every two years.[89] To date, the City has produced only three disparity studies, the most recent of which was published in 2018, which analyzed data from July 2006 through July 2015. This 2018 disparity study found sufficient evidence of disparity and recommended that the City continue its M/WBE program in supporting of closing the gap. The 2018 disparity study supported the City’s goal of 30% utilization for M/WBEs, and informed the metrics used for disaggregated goals (by M/WBE category and by industry).
Prior iterations of this Report included a recommendation that the City swiftly proceed with the procurement of an updated disparity study to better reflect the state of the current economy. As of the date of the publishing of this Report, the City still has not yet released a solicitation to pursue an updated disparity study. Visit this link to access a copy of the 2018 disparity study: https://www.nyc.gov/assets/mwbe/business/pdf/NYC-Disparity-Study-Report-final-published-May-2018.pdf
Resources
New York City agencies and vendors leverage many systems, platforms, and resources that support its contracting functions. This Report references many key technology resources that are particularly relevant when discussing contracting with M/WBEs. This Report identifies problems and recommends changes and enhancements that would make these, individually and collectively more valuable tools to support the increase to M/WBE utilization.
FY25 Annual Summary Contracts Report for the City of New York
The Comptroller’s Office is required to publish an annual summary report of contracts and agreements assumed by New York City during the previous fiscal year in accordance with section 6-116.2 of the Administrative Code. This “Annual Summary Contracts Report” was released on October 31, 2025, and aims to provide better transparency into what the city is buying and how these purchases are being made. The Annual Summary Contracts Report includes plain data on nearly 13,000 registered procurement actions made by the City, representing a value of over $42 billion. This M/WBE utilization report is a follow-up to the Annual Summary Contracts Report that will focus on the share of City registered contracts going to M/WBEs, subject to LL 174 participation goals.
A copy of the report can be found at: https://comptroller.nyc.gov/reports/annual-summary-contracts-report-for-the-city-of-new-york-2025/
Financial Management System (FMS)
FMS is the City’s computerized accounting and financial data management system that is jointly administered by the Mayor and Comptroller and managed by the Financial Information Services Agency (“FISA”). FMS is the central repository of the accounting, budgetary and contracting activity for all city agencies. To properly track expenses and revenues, agencies are required to specifically identify the type of contract submitted for registration by selecting from a list of predetermined contract type codes in FMS. Award method categories indicate how the City selects vendors for a particular contract. This Report also references “Industry classifications” which are not entered by agencies into FMS but are instead derived from various FMS data points to reveal procurement trends by sector.
The majority of the data analyses in this Report pertaining to registered contracts were sourced from FMS.
Payee Information Portal (PIP)
Until recently, agencies were required to record all subcontract and subcontract payment records in PIP. Starting September 2024, PASSPort replaced PIP as the new system of record. PIP is managed by FISA and enables vendors to view financial transactions, register for Electronic Funds Transfer (EFT) payments, enroll in citywide bidders’ lists, report on subcontractors, and record payments made to subcontractors among other features.
Checkbook NYC
In July of 2010 the Comptroller’s Office launched Checkbook NYC, an online transparency tool that for the first time placed the City’s day-to-day spending in the public domain. Using an intuitive dashboard approach that combines a series of graphs and user-friendly tables, Checkbook NYC provides up-to-date information about the City’s financial condition.
Checkbook NYC has been ranked the top transparency tool in the nation for tracking government spending by the United States Public Interest Research Group and was named New York City 2013 “Best External Application” by Government Technology Magazine.
Checkbook NYC also contains a majority of the City’s contract data. This tool enables users to examine data on its “Contracts” tab by fiscal year (or other date ranges), procurement category, contract types, and more. Visit this link to access Checkbook NYC: https://www.checkbooknyc.com/
Online Directories of Certified Vendors
SBS Online Directory of NYC Certified Businesses
The SBS Online Directory of NYC Certified Businesses is a searchable list of M/WBE, Locally-based enterprises (LBE), and Emerging Business Enterprises (EBE) businesses certified by the City of New York. It includes contact information for these firms, as well as details regarding their expertise, experience, and more. As of June 30, 2025 (the end of FY25), the SBS Online Directory of Certified Vendors included 11,382 M/WBEs. Visit this link to access the SBS Online Directory: https://sbsconnect.nyc.gov/certification-directory-search/
Empire State Directory
There is a separate certification process for becoming a New York State certified M/WBE, defined by Article 15-A of the New York State Executive Law. The New York State M/WBE Directory is a searchable list of State certified M/WBEs, searchable by commodity code, location, work region, industry, and business size.
- Visit this link to access more information about the New York State M/WBE certification process: https://esd.ny.gov/doing-business-ny/mwbe/mwbe-certification-eligibility-requirements
- Visit this link to access the NYS M/WBE directory of certified firms: https://ny.newnycontracts.com/
PASSPort
This online vendor management and procurement system is managed by MOCS. PASSPort is where vendors and mayoral Agencies exchange information to create and manage vendor accounts, make determinations for contract awards, and complete performance evaluations. This platform is designed to increase transparency, reduce administrative burdens, and build more collaborative relationships for positive financial impact.
Until recently, agencies were required to record all subcontract and subcontract payment records in PIP. Starting September 2024, PASSPort has replaced PIP as the new system of record.
Visit this link to access PASSPort: https://passport.cityofnewyork.us/
PASSPort Public
PASSPort Public is a portal that is designed for data transparency and provides the public with insight into the City procurement system. The portal provides up-to-date information and status updates concerning vendors, solicitations, and contract registrations. Visit this link to access PASSPort Public: https://a0333-passportpublic.nyc.gov/
MOCS M/WBE Reporting
As of FY14, MOCS is required to publish quarterly reports on the progress of the M/WBE Program. The M/WBE Reports page on the MOCS website shares current and historical M/WBE reports and M/WBE Small Purchase Compliance Report. Visit this link to access the M/WBE Reports Page: https://www.nyc.gov/site/mocs/opportunities/m-wbe-reports.page
City Record Online (CROL)
The City Record Online (CROL) is a fully searchable database of notices published in the City Record newspaper which includes but is not limited to public hearings and meetings, public auctions and sales, solicitations and awards and official rules proposed and adopted by city agencies. Visit this link to access CROL: https://a856-cityrecord.nyc.gov/
M/WBEs are encouraged to use CROL to receive notice and learn about current and upcoming procurement opportunities.
Agency Procurement Plans (LL-1 and LL-63)
Under Local Law 1, SBS and MOCS are required to publish an annual plan and schedule listing anticipated contracting opportunities for the coming fiscal year. These plans include the following information for each solicitation: the specific type and scale of the services to be procured, the term of the proposed contract, the method of solicitation the agency intends to utilize, and the anticipated fiscal year quarter of the planned solicitation. Similarly, under Local Law 63 of 2011, amended by Local Law 85 of 2024, MOCS is required to publish a plan and schedule detailing the anticipated contract actions (for certain categories of procurement) of each City agency for the upcoming fiscal year. This requirement applies to contracts valued at more than $1 million providing standard or professional services, including against agency task orders. This amended legislation newly excludes contracts procured via the M/WBE Small Purchase method.
Both contracting plans may be useful tools to give vendors notice about potential upcoming procurement opportunities with each agency. However, last year’s Report examined these plans in-depth and found that navigating these lists is tedious – the City must do more to help connect M/WBEs to the agencies who are looking for them.
These plans are available on the MOCS website. Visit:
https://www.nyc.gov/site/mocs/resources/standard-prof-services-ll63.page
Appendix B: M/WBE Asset Managers & Public Finance
The NYC Office of the Comptroller Bureau of Asset Management and Bureau of Public Finance released the M/WBE and Emerging Manager Pension Report in November 2025 detailing the share of pension investments with M/WBE asset managers and emerging managers & the role of M/WBEs in public finance. The New York City Retirement Systems had a total of $26.5 billion in investments with or committed to M/WBE managers as of June 30, 2025. Those investments amount to 14.6% of U.S.-based actively managed assets, or approximately 5.8% of the total assets under management.
The report is available at: https://comptroller.nyc.gov/reports/mwbe-and-emerging-manager-pension-investments/
Appendix C: LL 174 Exclusions
In order to analyze the City’s utilization of M/WBEs in areas subject to LL 174 participation goals, this report excluded contracts and spending that fell into one of the following categories, pursuant to § 6-129(q) of the Administrative Code.
Award Method LL 174 Exclusions
| Award Method Code | Award Method |
| 5 | Sole Source |
| 6 | Emergency |
| 7 | Lessee Negotiation |
| 8 | Loan Negotiation |
| 9 | Rental Subsidy Negotiation |
| 10 | Renewal of Contract |
| 11 | Determined by Legal Mandate |
| 12 | Boro Needs/Discretionary Fund |
| 13 | Petition Private Use/Franchise |
| 14 | Concessionaire by Procedure |
| 15 | Renewal Franchise/Concession |
| 16 | Exempt Concession – Public Bid |
| 17 | Government-to-Government |
| 18 | Non-Procurement Transaction |
| 24 | Contract Conversion |
| 25 | Intergovernmental Procurement |
| 26 | Determined by Government Mandate |
| 28 | Buy Against |
| 29 | Assignment |
| 40 | DOE Listing Application |
| 41 | Cable Service Negotiation |
| 42 | Professional Membership Negotiation |
| 43 | Subscriptions Etc. per PPB |
| 44 | Public Utility |
| 45 | Small Purchase – Public Utility |
| 51 | Grants |
| 61 | Small Purchase – Renewal |
| 62 | Small Purchase – Intergovernmental |
| 68 | Force Account Negotiation |
| 78 | Real Estate Sales and Purchases |
| 79 | Watershed Land Negotiation |
| 99 | Miscellaneous |
| 100 | Small Purchase – Subscription etc. |
| 101 | Small Purchase – Professional Membership |
| 102 | Small Purchase – Grants |
| 103 | Small Purchase – Government-to-Government |
| 104 | Small Purchase – Assignment |
| 105 | Condemnations – Exempt OCA Processing |
| 106 | Small Purchase – Buy Against |
| 107 | Small Purchase Watershed Land Acquisition |
| 251 | Intergovernmental Procurement Renewal |
| 511 | Grant Renewal |
Industry LL 174 Exclusions[90]
| Industry |
| Human Services |
| Goods (Over $1 million) |
Vendor-Related 174 Exclusions
| Vendor |
| NYC Economic Development Corporation |
| NYC Housing Authority |
| All vendors with 1099 Non-Profit Status |
Contract Type LL 174 Exclusions
| Contract Type Code | Contract Type |
| 15 | Franchises |
| 17 | Revocable Consents |
| 18 | Permits |
| 20 | Concessions |
| 25 | Corpus Funded |
| 26 | Compensating Balance from Proceeds |
| 29 | Other Expense Contract or Revenue Related |
| 30 | Miscellaneous Revenue – No Expense |
| 35 | Lessee |
| 36 | Miscellaneous Property Rental |
| 39 | Lessor – Revenue |
| 40 | Lessor – Accounting Lines Exist |
| 41 | Cable Service |
| 42 | Professional Membership |
| 43 | Subscriptions |
| 44 | Public Utility |
| 46 | Requirements – Goods (Over $1 million) |
| 65 | Loans |
| 68 | Force Account Agreement |
| 70 | Programs |
| 72 | Programs (Not Tax Levy Funded) |
| 78 | Real Estate Sales and Purchases |
| 79 | Watershed Land Acquisition |
| 83 | Condemnations – Exempt OCA Processing |
| 85 | Intra-Agency Fund Agreements |
| 88 | New York City Bond Financing |
Appendix D: Z-Scores
In an effort to assess agency performance more fairly, this year’s analysis examined how much LL 174-eligibile business (as a function of value and volume) each agency did with M/WBEs relative to their peers with similar-sized LL 174 portfolios.
This analysis employed a statistical tool known as a Z-Score to measure how much business each agency did with M/WBEs as compared to their cohort average. First, volume and value totals were calculated for each agency in a given fiscal year. Next, those volume and value totals were compared for each agency to their respective cohort averages (e.g. the total value of all LL 174-eligible M/WBE contracts and POs for a “Tier 1” agency was compared to the average value of all LL 174-eligible M/WBE contracts and POs across “Tier 1” agencies, and the total number of LL 174-eligible contracts and POs for a “Small Volume” agency was compared to the average number of LL 174-eligible contracts and POs across all “Small Volume” agencies). Finally, Z-Scores for volume and value were combined for each agency into a unified score, giving greater weight to the value portion. The cohort system allows for standardized assessment across different agency sizes, ensuring that agencies are compared with their peers who handle a similar volume and value of LL 174-eligible contracts and POs. The result tells us if an agency is performing above, below, or at the average level compared to its peers within the same operational scale. Comparing Z-Scores within Cohorts ensures that each agency, is measured against a relevant and comparable standard.
Cohorts
Value and volume cohorts were established by aggregating LL 174-eligible contract and PO data for each agency over a four-year period (FY22-25). The extended timeframe accommodates the fluctuations in each agency’s procurement cycle, accounting for both heavier and lighter years. The cohorts were established as follows:
Value Cohorts
- Large: total aggregated value over $100 million
- Medium: total aggregated value between $50 million and $100 million
- Small: total aggregated value between $10 million and $50 million
- Micro: total aggregated value under $10 million
Volume Cohorts
- Large Volume: Over 10,000 contracts and POs
- Moderate Volume: Between 1,000 and 10,000 contracts and POs
- Small Volume: Between 100 and 1,000 contracts and POs
- Micro Volume: Less than 100 contracts and POs
All Ranked Agency Z-Scores, FY23-FY25
| Agency | Value Cohort | Volume Cohort | FY23 Combined | FY24 Combined | FY25 Combined | YOY 24-25 |
|---|---|---|---|---|---|---|
| ACS | Over 100M+ | Small Volume | -.087 | -0.48 | -1.05 | -0.57 |
| BIC | Under 10M | Very Small Volume | -0.97 | -0.97 | -1.06 | -0.09 |
| CCHR | Under 10M | Small Volume | -0.51 | -0.58 | -0.31 | 0.27 |
| CCRB | Under 10M | Very Small Volume | -0.47 | -0.51 | -0.80 | -0.28 |
| COMP | Between 10M-50M | Small Volume | -0.60 | 0.32 | -0.47 | -0.79 |
| DCAS | Between 50M-100M | Small Volume | 0.07 | 0.44 | 0.45 | 0.01 |
| DCLA | Under 10M | Very Small Volume | 1.07 | 0.28 | 0.37 | 0.10 |
| DCP | Under 10M | Small Volume | 0.00 | 0.58 | 0.27 | -0.31 |
| DCWP | Under 10M | Small Volume | 0.15 | 1.02 | 0.77 | -0.25 |
| DDC | Over 100M+ | Small Volume | 0.52 | 0.56 | 1.12 | 0.56 |
| DEP | Over 100M+ | Moderate Volume | 0.80 | 0.72 | -0.40 | -1.12 |
| DFTA | Under 10M | Small Volume | 0.53 | 0.27 | 0.88 | 0.61 |
| DHS | Between 50M-100M | Very Small Volume | -0.42 | -0.94 | -0.85 | 0.08 |
| DOB | Between 10M-50M | Small Volume | -0.43 | -0.83 | 1.39 | 2.22 |
| DOC | Between 10M-50M | Moderate Volume | 1.29 | 2.43 | 1.42 | -1.01 |
| DOE | Over 100M+ | Moderate Volume | 0.57 | 0.72 | 1.29 | 0.57 |
| DOF | Between 10M-50M | Small Volume | -0.67 | -0.33 | -0.54 | -0.21 |
| DOHMH | Over 100M+ | Moderate Volume | -0.96 | -0.89 | -0.67 | 0.21 |
| DOI | Under 10M | Small Volume | 0.14 | 0.61 | 0.47 | -0.14 |
| DOP | Under 10M | Small Volume | 0.57 | -0.04 | 2.13 | 2.17 |
| DORIS | Under 10M | Small Volume | -0.79 | -0.70 | -0.80 | -0.20 |
| DOT | Over 100M+ | Moderate Volume | -0.27 | -0.78 | -0.38 | 0.40 |
| DPR | Over 100M+ | Moderate Volume | 0.85 | 0.89 | 0.50 | -0.39 |
| DSNY | Between 50M-100M | Moderate Volume | 1.24 | 0.53 | -0.34 | -0.87 |
| DSS/HRA | Between 10M-50M | Small Volume | -0.76 | 0.45 | -0.65 | -1.10 |
| DYCD | Between 10M-50M | Small Volume | -0.40 | -0.17 | 0.12 | 0.30 |
| FDNY | Between 50M-100M | Small Volume | -1.01 | -1.45 | 1.06 | 2.52 |
| HPD | Over 100M+ | Large Volume | 0.03 | 0.05 | -0.39 | -0.44 |
| LAW | Between 10M-50M | Small Volume | 1.98 | 0.15 | -0.04 | -0.19 |
| LPC | Under 10M | Very Small Volume | -0.77 | -0.65 | -0.76 | -0.11 |
| MAYOR | Between 10M-50M | Small Volume | -0.33 | 0.28 | -0.59 | -0.87 |
| NYCEM | Between 10M-50M | Small Volume | -0.46 | -0.79 | -0.42 | 0.37 |
| NYPD | Between 50M-100M | Large Volume | 0.88 | 0.98 | 0.34 | -0.64 |
| OATH | Under 10M | Small Volume | 1.52 | -0.15 | -0.03 | 0.13 |
| OTI | Over 100M+ | Large Volume | -0.68 | -0.80 | -0.02 | 0.78 |
| SBS | Between 10M-50M | Small Volume | -0.39 | -1.07 | -0.88 | 0.19 |
| TLC | Under 10M | Small Volume | 1.60 | 2.43 | 0.47 | -1.96 |
Appendix E: Award Method Analysis Categories
This appendix provides additional information about the types of contracts and POs included in the analysis reflected in Table 10 and Table 11.
| Award Method Analysis Category | Award Method Codes (Unless Otherwise Specified) |
| Competitive Sealed Bid Contracts | 1, 3 |
| Competitive Sealed Proposal Contracts | 2, 22 |
| Accelerated Procurement Contracts | 27 |
| Demonstration Project Contracts | 23 |
| Innovative Procurement Contracts | 20 |
| Micropurchase Contracts | 30, 38, POs less than or equal to $20k, POs greater than $20.01k but less than or equal to $35k (CT 5 or CT 48 only). PON1s and CT83s are excluded. |
| Negotiated Acquisition Contracts | 21, 211 |
| Small Purchase Contracts – General | 31, 32, 35, 36, 37, 109, 111, 112, 113, POs greater than 35.01k, POs greater than $20.01k but less than or equal to $35k (except for CT 5 and 48). PON1s and CT83s are excluded. |
| Small Purchase Contracts – M/WBE | 72 |
Appendix F: Summary of Agencies in This Report
This Report measures M/WBE utilization among mayoral agencies. Specified sections of this Report include additional analyses for the Department of Education and non-mayoral Elected offices (including the Comptroller’s Office).
| Agency | Agency Short Name |
| Administration for Children’s Services | ACS |
| Borough President – Bronx | BXBP |
| Borough President – Brooklyn | BKBP |
| Borough President – Manhattan | MBP |
| Borough President – Queens | QBP |
| Borough President – Staten Island | SIBP |
| Business Integrity Commission | BIC |
| City Council | CC or Council |
| Civilian Complaint Review Board | CCRB |
| Commission on Human Rights | CCHR |
| Department for the Aging | DFTA |
| Department of Buildings | DOB |
| Department of City Planning | DCP |
| Department of Citywide Administrative Services | DCAS |
| Department of Consumer and Worker Protection | DCWP |
| Department of Correction | DOC |
| Department of Cultural Affairs | DCLA |
| Department of Design and Construction | DDC |
| Department of Education | DOE |
| Department of Environmental Protection | DEP |
| Department of Finance | DOF |
| Department of Health and Mental Hygiene | DOHMH |
| Department of Homeless Services | DSS/DHS |
| Department of Investigation | DOI |
| Department of Parks and Recreation | DPR |
| Department of Probation | DOP |
| Department of Records and Information Services | DORIS |
| Department of Sanitation | DSNY |
| Department of Small Business Services | SBS |
| Department of Transportation | DOT |
| Department of Veterans Services | DVS |
| Department of Youth and Community Development | DYCD |
| District Attorney – Bronx County | DABX |
| District Attorney – Kings County | DAKINGS |
| District Attorney – New York County | DANY |
| District Attorney – Queens County | DAQ |
| District Attorney -Richmond County | DARICH |
| Fire Department of New York | FDNY |
| Housing Preservation and Development | HPD |
| Human Resources Administration (Department of Social Services) | DSS/HRA |
| Landmarks Preservation Commission | LPC |
| Law Department | LAW |
| Mayoralty | MAYOR |
| New York City Emergency Management | NYCEM |
| New York Police Department | NYPD |
| Office of Administrative Trials and Hearings | OATH |
| Office of Technology and Innovation | OTI |
| Office of The Comptroller | COMP |
| Public Advocate | Pub Adv |
| Taxi and Limousine Commission | TLC |
Appendix G: FY25 LL 174-Eligible Prime and Subcontracts by Agency[91]
This appendix shares the total number of each agency’s prime contract registrations subject to LL 174 participation goals and the total number of those prime contracts that have approved subcontractors in PASSPort.
| Agency | # of LL 174 Contracts | # of LL 174 Contracts with PIP Approved Subcontracts |
|---|---|---|
| ACS | 364 | 13 |
| BIC | 4 | 0 |
| CCHR | 8 | 0 |
| CCRB | 48 | 0 |
| COMP | 124 | 0 |
| DCAS | 1,013 | 17 |
| DCLA | 29 | 0 |
| DCP | 37 | 0 |
| DCWP | 31 | 0 |
| DDC | 552 | 302 |
| DEP | 729 | 234 |
| DFTA | 84 | 0 |
| DHS/DSS | 100 | 4 |
| DOB | 50 | 3 |
| DOC | 222 | 1 |
| DOF | 105 | 7 |
| DOHMH | 1,904 | 14 |
| DOI | 55 | 0 |
| DOP | 34 | 0 |
| DORIS | 7 | 0 |
| DOT | 662 | 64 |
| DPR | 2,421 | 362 |
| DSNY | 256 | 30 |
| DSS/HRA | 233 | 0 |
| DVS | 2 | 0 |
| DYCD | 82 | 1 |
| FDNY | 286 | 9 |
| HPD | 379 | 31 |
| LAW | 216 | 0 |
| LPC | 6 | 0 |
| MAYOR | 134 | 0 |
| NYCEM | 109 | 0 |
| NYPD | 863 | 14 |
| OATH | 37 | 0 |
| OCJ | 4 | 0 |
| OTI | 638 | 1 |
| SBS | 94 | 0 |
| TLC | 30 | 0 |
| Grand Total | 11,952 | 1,107 |
Appendices H-L: Additional Data
Appendix H: PASSPort Approved Subcontract Records for LL 174-Eligible Primes, FY22-25 (Mayoral Agencies Only)
- This appendix contains a summary of subcontract records (count and value) by agency and M/WBE Category for the past three fiscal years
- Visit this link to view data: https://comptroller.nyc.gov/wp-content/uploads/2026/01/Appendix-H.xlsx
Appendix I: Summary of Contract and PO Totals, Subject to LL 174 Participation Goals
- This appendix contains a summary of contract and PO data (count and value) by agency and M/WBE Category
- Visit this link to view data: https://comptroller.nyc.gov/wp-content/uploads/2026/01/Appendix-I.xlsx
Appendix J: Summary of Spend Data, Subject to LL 174 Participation Goals
- This appendix contains summary data displaying spend by year, agency, and prime/sub contract type
- Visit this link to view data: https://comptroller.nyc.gov/wp-content/uploads/2026/01/Appendix-J-Summary-of-Spend-Data-Subject-to-LL-174-Participation-Goals.xlsx
Appendix K: Summary of M/WBE Small Purchase Method Registrations
- This appendix contains a summary of M/WBE Small Purchase method registration data (count and value) by agency and M/WBE Category.
- Visit this link to view data: https://comptroller.nyc.gov/wp-content/uploads/2026/01/Appendix-K-Summary-of-MWBE-Small-Purchase-Method-Registrations.xlsx
Appendix L: M/WBE Retroactivity by Agency, FY22-24
- This appendix contains a summary of all registered procurement contracts (not just subject to LL 174 participation goals) by agency and retroactivity status
- Visit this link to view data: https://comptroller.nyc.gov/wp-content/uploads/2026/01/Appendix-L-MWBE-Retroactivity-by-Agency-FY22-25.xlsx
Acknowledgments
Kerri Nagorski, Director of Procurement Policy and Partnerships, and Dan Roboff, Sr. Director of Contract Analytics, were the lead authors of this report with support from Charlette Hamamgian, Deputy Comptroller, Michael D’Ambrosio, Assistant Comptroller for the Bureau of Contract Administration, Daphnie Agami, Senior Advisor & Counsel to the Deputy Comptroller, James Leidy, Procurement Analyst, Rabia Akram, CUNY Fellow, Yifeng Zheng, CUNY Fellow, and Sadye Campoamor, Chief Equity Officer. Report design was completed by Archer Hutchinson, Creative Director & Digital Inclusion Officer and Danbin Weng, Multimedia Designer. Priyanka Thomas, Deputy Chief Technology Officer, and Denia Zaman, IT Project Manager from the Comptroller’s Bureau of Information Systems and Technology, as well as REI Systems Inc, provided consulting and other support for this Report. The Comptroller’s Office of the General Counsel has reviewed portions of this report.
Thank you to the M/WBE community and advocates for important contributions to this report.
Endnotes
[1] A note on terminology: For the purposes of this Report, “M/WBE” refers to a City-certified Minority or Women-Owned Business Enterprise. Terms used in this Report such as “Minority” and “Hispanic” are based on the NYC Administrative Code and Local Law 174 and align with the certification status in various systems and databases designed to implement those laws. Such terms are necessary for measurement, but they also have many shortcomings. They often do not reflect how people refer to themselves and fail to convey the expansiveness of human identities. There are no categories for people of two or more races, people of Middle Eastern or North African descent, LGBTQ+ contractors, or people with disabilities. New York City is already a “majority minority” city. While this Report is designed to measure outcomes under the existing legal framework, legislative or administrative changes would be welcome to update the categories to better reflect the diverse population of New York City.
[2] LL 77 revised Section 6-116.2 of the NYC Administrative Code to mandate the release of this Report annually prior to January 31 of each year: https://legistar.council.nyc.gov/LegislationDetail.aspx?ID=6505382&GUID=A9D5DD2A-1D82-4AEC-A03F-156EE1952881&Options=&Search=
[3] Additional context and methodology for Agency rankings and comparisons can be found in the “M/WBE Utilization by Agency” Section and in Appendix D of this Report.
[4] Summary data for prior fiscal years in this Report may reflect minor differences from tables in the FY24 Annual Report on M/WBE Procurement. Unless an update to the data methodology is otherwise noted, such discrepancies can be attributed to changes in vendor or contract characteristics since data was last pulled from FMS.
[5] Certification data is based on status reflected in FMS as of July 2025, when the data for this report was accessed. Vendors with non-profit organization types in FMS were also excluded from this Report’s analysis of LL 174 contracts.
[6] In September 2024 the Mayor’s Office of Contract Services (“MOCS”) launched Subcontractor Management functionality in PASSPort. Since then, PASSPort has been the sole system of record for capturing new subcontract approval and payment records. Additionally, FMS subcontract records entered prior to September 2024 have been transferred to PASSPort. Accordingly, this Report uses subcontract data from PASSPort.
[7] State legislation was adopted granting authority to the DOE to utilize the same framework as LL 174 in 2020. The Panel for Educational Policy approved this change during FY23.
[8] Chapter 11(B) of Title 66 of the Rules of the City of New York lays out the City’s M/WBE Certification Program within SBS’ Division of Economic and Financial Opportunity.
[9] Certification eligibility requirements are detailed in Appendix A of this Report.
[10] A list of required documentation can be found on the SBS website here: https://www.nyc.gov/html/nycbe/downloads/pdf/MWBE_Document_Checklist.pdf
[11] NY State Senate Bill 2023-S7371: https://www.nysenate.gov/legislation/bills/2023/S7371
[12] RCNY §1-01(e)
[13] N.Y.C. Administrative Code §6-129(g)(2)
[14] See Appendix C for a full list of exclusions used to arrive at a subset of contracts subject to LL 174 participation goals. This chart excludes values for non-Mayoral agencies.
[15] As reflected in FMS at the time data for this report was pulled.
[16] In FY23 and FY25, the DDC registered several large contracts associated with the City’s Borough Based Jail (“the DDC BBJ contracts”). Each of the following DDC BBJ contracts is worth billions of dollars: CT1-850-20238807786 (FY23), CT1-850-20248809339, CT1-850-20258806440, and CT1-850-20248809672. The three FY25 DDC BBJ contracts totaled $10.7 billion and had a significant impact on totals in several analyses. For example, if the FY25 BBJ contracts were to be excluded, the M/WBE share of LL174 value would increase to 21.72%. These contracts each have 30% M/WBE utilization goals and therefore have been included in this analysis.
[17] https://www.census.gov/quickfacts/newyorkcitynewyork
[18] Table 4 includes the DDC BBJ contracts registered in FY25 as described in footnote 16.
[19] This total does not include POs
[20]The FY25 DDC BBJ contracts (20248809672, 20258806440, 20248809339) were excluded from this analysis as outliers
[21] From Table 3 and Table 4 of this Report
[22] The FY25 DDC BBJ contracts (20248809672, 20258806440, 20248809339) were excluded from this analysis as outliers
[23] See Appendix E for more details about the types of contracts and POs included in this analysis.
[24] A number of contracts registered via the M/WBE Small Purchase method were excluded from this analysis because they were registered to non-certified vendors in FMS at the time the data for this report was pulled.
[25] The FY25 DDC BBJ contracts (20248809672, 20258806440, 20248809339) were excluded from this analysis as outliers
[26] The data in this Section is aligned with the data published by MOCS in the October 2025 Citywide Indicators Report: https://www.nyc.gov/site/mocs/resources/citywide-indicator-reports.page#MWBEPartners
[27] As of December 1, 2025.
[28] Although four prime contracts and 13 POs were registered to Native American M/WBE in FY25, the total value of these actions was just 0.02% of value subject to LL 174 goals. For this reason, Native American M/WBEs are not reflected in this some tables and charts in this Report.
[29] Per prior reporting, there were 10,768 certified firms in the SBS Directory in June 2022. A net change of 614 firms represents about a 5% increase.
[30] The 2021 Making the Grade Report issued by this Office reported that the total number of City-Certified M/WBEs was 6,679 in Fiscal Year 2018 and grew to 10,570 in Fiscal Year 2021: https://comptroller.nyc.gov/reports/making-the-grade/reports/making-the-grade-2021/
[31] The Department of Probation and the DOE are excluded from this delegation and required to submit all contracts procured via this method to this Office for registration.
[32]Federal Acquisition Rules cap the usage of the M/WBE Small Purchase award method at $250,000 for contracts funded with federal dollars. This may prevent agencies from utilizing this method for contracts with combined funding sources (that include $250,000 or more dollars from federal funds).
[33] These numbers exclude registered M/WBE Small Purchases that were listed as registered to Non-Certified firms at the time this data was pulled from FMS. These records may reflect businesses that have lost their M/WBE certification since registration or agency input errors.
[34] These numbers represent contract values as of the time of initial registration. Agencies are permitted to increase the value of M/WBE Small Purchase method contracts through a contract modification so long as they do not exceed the stipulated threshold. The agency must also comply with any necessary rules and procedures for the contract modification.
[35] Agencies were not permitted to use the M/WBE Small Purchase method for contracts valued over $500,000 in FY22 or for contracts valued over $1 million in FY23.
[36] These numbers exclude contracts registered via the M/WBE Small Purchase method that were listed as registered to Non-Certified firms at the time this data was pulled from FMS in July 2025. These records may reflect businesses that have lost their M/WBE certification since registration or agency input errors.
[37] This table examines subcontracts associated with LL 174 eligible CT1s registered between FY22 and FY25.
[38] CT1-850-20238807786 was registered by DDC to the TUTOR PERINI CORPORATION for $ 2,958,933,248
[39] https://comptroller.nyc.gov/reports/annual-summary-contracts-report-for-the-city-of-new-york-fiscal-year-2024/
[40] Note: Z-scores were generated for both value and volume by comparing agency totals against their cohort averages. Then, the two scores for each agency were combined, giving greater weight to the value score, allowing for the creation of a unified standardized metric. MA1 and MMA1 values are excluded from this metric.
[41] Some contracts registered via the M/WBE Small Purchase method were excluded from this analysis because they were registered to Non-Certified vendors as indicated in FMS at the time the data for this report was pulled.
[42] City procurement systems are limited and do not include the necessary data to confirm if a contract is in fact funded by State or Federal funds. Due to these limitations, LL 174-eligible data in this Report includes some contracts that may actually be excluded from LL 174.
[43] NYCEDC has its own Minority, Women-Owned, and Disadvantaged Business Enterprises (M/W/DBE) program that is not included in this Report.
[44] Note: Unlike Table 79, this table does not include POs. POs do not have a start date and therefore can’t be considered in retroactivity analyses. Agencies that have records in Table 79 but not in Table 80 reflect those that only issued POs in FY25.
[45] The FY25 DDC BBJ contracts (20248809672, 20258806440, 20248809339) were excluded from this analysis as outliers
[46] The FY25 DDC BBJ contracts (20248809672, 20258806440, 20248809339) were excluded from this analysis as outliers
[47] 9 RCNY § 1-01(e)
[48] DDC BBJ contracts (20248809672, 20258806440, 20248809339) were excluded from this analysis as outliers
[49] The average PO value for the construction industry was $13,920.
[50] The FY25 DDC BBJ contracts (20248809672, 20258806440, 20248809339, 20238807786) were excluded from this analysis as outliers.
[51] 9 RCNY § 1-01(e)
[52] NYC Charter §823(a)
[53] As of December 15, 2023, DCAS, the Comptroller, and MOCS have authorized agencies to make purchases of goods using the M/WBE Small Purchase method up to $1,500,000 without involving DCAS. Notwithstanding the above, the DCAS Office of Citywide Procurement (OCP) shall continue procuring all fuel, furniture, and vehicles regardless of dollar value. Agencies may continue procuring non-bulk (e.g., event catering) and public health/safety goods (e.g., commodities used to protect the general welfare of the public including, but not limited to, medical supplies, law enforcement equipment, emergency response supplies/equipment and fire/life safety equipment) at values not to exceed $100,000 per twelve-month period.
[54] The average PO value for the Goods (under $1 Million) industry was $7,459.
[55] 9 RCNY § 1-01(e)
[56] The average PO value for the Professional Services industry was $7,967
[57] The FY24 Annual Report on M/WBE Procurement included a specialized focus on MMA1s title “’Master’ Contracts of Disguise”.
[58] 9 RCNY § 1-01(e)
[59] The average PO value for the standard services industry was $1,919. Notably Black and Hispanic American women had the highest average PO value.
[60] Federal Acquisition Rules cap the usage of the M/WBE Small Purchase method at $250,000 for contracts funded with federal dollars.
[61] This table does not include M/WBE Small Purchase method contracts registered to firms that were not listed as certified in FMS as of July 2025.
[62] This table does not include M/WBE Small Purchase method contracts registered to firms that were not listed as certified in FMS as of July 2025.
[63] https://comptroller.nyc.gov/reports/contract-primer/
[64] N.Y.C. Admin. Code §6-129(i)(6)(a) defines “Agency” as a “city, county, borough, or other office, position, administration, department, division, bureau, board or commission, or a corporation, institution or agency of government, the expenses of which are paid in whole or in part from the city treasury.”
[65] 9 RCNY §3-08
[66] The M/WBE Small Purchase method is an exception to this threshold
[67] 9 RCNY §3-08
[68] Assembly Bill A10459: https://www.nysenate.gov/legislation/bills/2021/A10459
[69] Governor Hochul signed NY State Senate Bill 2023 – S7563 on December 8, 2023
[70] Table 19 of this Report
[71] GML §103 and applicable sections of the Code of Federal Regulations (CFR)
[72] NYC Charter §313
[73] GML § 100(5)
[74] NYC Charter §324
[75] PPB Rules §3-03(a)
[76] NYC Charter §319
[77] See PPB Rules §1-01(e), 3-02(o)(1)(iv), 3-03(a)(1), 3-03(g), and 3-03(g)(6)
[78] This requirement was established by a June 2024 CCPO, and in effect from June 2024 – August 2025, which covers this entirety of FY25.
[79]N.Y.C. Admin. Code §6-129(h)(2)(a)(e)
[80] NYC Office of the Comptroller Annual Summary Contracts Report Section “Group 2: Limited or Non-competitive Methods”
[81] NYC Charter §315 and 9 RCNY §3-06
[82] N.Y.C. Admin. Code §6-129(h)(2)(a)
[83] Chapter 11(B) of Title 66 of the Rules of the City of New York lays out the City’s M/WBE Certification Program within SBS’ division of economic and financial opportunity.
[84] https://legistar.council.nyc.gov/LegislationDetail.aspx?ID=3776475&GUID=140B19AA-8A79-4DF1-9A21-BB277797201F&Options=ID%7CText%7C&Search=1293-B
[85] https://legistar.council.nyc.gov/LegislationDetail.aspx?ID=3872955&GUID=391F7DE2-91E6-4D0C-9CAC-2AC8A166BF0E&Options=Advanced&Search=
[86] The data analyses pertaining to LL 174 participation goals included in this report use exclusions that align with these specified exceptions, detailed further in Appendix C.
[87] N.Y.C. Admin. Code §6-129(g)(2)
[88] N.Y.C. Admin. Code §6-129(g)(1)
[89] Pursuant to §11-61(d)(4)(a) of the Rules of the City of New York
[90] The data in this report uses rules employed by Checkbook NYC to assign industry classifications based on contract characteristics such as award category, contract type, and expense category. Expense categories may change over time based on the code selected by agencies when issuing new disbursements. Contracts that could not be mapped to the Construction, Goods, Professional Services, or Standard Service industries using these rules were labeled as “unclassified contracts.”
[91] Includes COMP and DOE