
I. Executive Summary
The FY 2024 Executive Budget and April 2023 Financial Plan incorporates many of the expenses that the Comptroller’s Office highlighted as unaccounted for in the Preliminary Budget, thus providing a more candid view of the City’s fiscal condition. The City added nearly $16 billion to fund the cost of settling municipal labor contracts over the five years of the Plan and $4.3 billion to pay for the cost of providing shelter and services to people seeking asylum. The Comptroller’s Office identifies the growing cost of providing these services as the biggest near-term risk to the City budget, particularly as State, and to a greater extent Federal, aid remains inadequate.
In addition to accounting for increased expenditures, the Financial Plan recognizes higher revenues. The City revised its tax forecast upward in each year—bringing its projections closer in line with the Comptroller’s Office. The City continues to add jobs and is now at 99.7 percent of its pre-pandemic employment level. And while local economic growth is slowing from its fast-paced pandemic recovery, neither the Comptroller’s Office nor the City projects a recession. There are reasons for caution, however, as the economic risk remains elevated. Turmoil in the banking sector, high interest rates, and rising commercial vacancies in the City are also causes for concern.
Overall, the FY 2024 Executive Budget as presented by the Mayor totals $106.69 billion, an increase of $4.03 billion over the Preliminary Budget, but $2.22 billion less than the $108.91 billion currently planned for FY 2023; with much of the difference stemming from the drop of Federal COVID-19 aid. Higher estimates of tax collections, along with the spending down of budgeted reserves, and savings resulting from a third consecutive Program to Eliminate the Gap (PEG), increased the projected FY 2023 surplus by $868 million, which is used to close the FY 2024 gap and results in balanced budgets for both years. In the outyears, the City projects gaps of $4.20 billion in FY 2025, $5.95 billion in FY 2026, and $6.98 billion in FY 2027.
Based on its own economic forecast, the Comptroller’s Office projects higher tax revenues than the Mayor in each year. Driven by strong collections early in the year, the Comptroller’s Office expects FY 2023 tax revenues to total $72.28 billion in FY 2023, 1.7 percent higher than the Mayor’s current projections and an increase of 3.9 percent compared with FY 2022 collections. After FY 2023, the Comptroller’s Office projects that tax revenues will dip slightly in FY 2024 (by 1.0 percent) before regaining growth in the outyears (averaging 3.0 percent).
While the Executive Budget addresses several major items left outstanding in the Preliminary Budget, there are still many underfunded expenditures and risks—the greatest of which is the cost of providing services to people seeking asylum. Given the high level of unpredictability, the Comptroller’s Office, in this report, explores several scenarios of the flow of arrivals, State and Federal aid, and costs. The mid-range scenario suggests $1.15 billion more in City funds could be required in FY 2024, growing to $2.94 billion in FY 2025, and $3.65 billion in FYs 2026 and 2027, the two years when no funds for these services are budgeted.
The Comptroller’s Offices estimates that spending at the Department of Education (DOE) will exceed budgeted costs by $210 million in FY 2023 rising to $2.72 billion in FY 2027. This results from the expiration of Federal COVID aid used to fund ongoing DOE programs, the underbudgeting of special education Carter Cases, the implementation of the State mandate to reduce class sizes, and the underfunding of charter school tuition costs, including the reauthorization of 14 charter schools as required by the 2023-2024 State budget, as well as other costs.
The Comptroller’s Office’s expenditure estimates also take into account other costs included in the 2023-2024 State budget but not yet reflected in the City’s Financial Plan, such as increased payments to the MTA, growth in payroll taxes paid by the City, and the capture of Federal healthcare funds, as well as several other actions. Together these result in additional City spending of $409 million in FY 2024, growing to $511 million in FY 2025. Underbudgeting for overtime and rental assistance costs also pose significant risks in FY 2024 and forward.
Because of the uncertainty around the cost of providing services to people seeking asylum, the Comptroller’s Office presents its restated surpluses and gaps with and without its estimates of increased spending. If the City’s projection of these costs (and the level of Federal/State reimbursement) proves accurate, the Comptroller’s Office projects additional resources of $1.69 billion in FY 2023, and a FY 2024 gap of $2.14 billion, roughly in balance with the FY 2023 surplus. Projected outyear gaps are larger at $6.45 billion in FY 2025, $9.05 billion in 2026, and $10.38 billion in FY 2027 (2.0 percent of the budget in FY 2024 growing to 9.6 percent in FY 2027).
If costs to provide services to people seeking asylum grow at a faster rate than the City projects, and if Federal and State support comes in less than budgeted, gaps increase to $3.29 billion in FY 2024 (3.1 percent of the budget) and reach $14.03 billion in FY 2027 (12.9 percent of the budget).
One risk not quantified here—but critical—is the impact that the City’s cost-saving measures could have on essential services. Since November, the City has proposed multiple PEG programs. These have included measures to reduce the high number of vacant City-funded positions by a cumulative 4,496 for FY 2024, as well as cuts to CUNY, public libraries, re-entry services at Rikers, and human service providers. New Yorkers would be better served by a multi-year and strategic approach to savings that maintains critical service levels.
The release of the Executive Budget also included an updated Capital Commitment Plan and Ten-Year Capital Strategy. The Capital Commitment Plan totals $97.93 billion from FY 2023 – FY 2027, a $1.39 billion increase over the Preliminary Plan. The greatest increase is for Department of Correction (DOC) projects, largely for the Brooklyn Borough-Based Jail. The Ten-Year Capital Strategy totals $164.78 billion. Based on past experience, it is unlikely that commitments will be delivered at the pace planned, resulting in lower levels of actual spending and borrowing.
Overall, while the Comptroller’s Office projects a surplus in the current year and a manageable gap in FY 2024, there is significant pressure in the outyears. The City must not only look at cost-cutting measures, but long-term strategies to increase efficiency, achieve long-term savings without cutting core services, improve its capital process to invest in infrastructure, and bolster revenues in ways that are equitable and effective to secure the city’s thriving future. [1]
Table 1. FY 2023 – FY 2027 Financial Plan
| Change FYs 2023 –2027 |
|||||||
| ($ in millions) | FY 2023 | FY 2024 | FY 2025 | FY 2026 | FY 2027 | Dollar | Percent |
| Revenues | |||||||
| Taxes: | |||||||
| General Property Tax | $31,570 | $32,405 | $32,366 | $32,633 | $33,238 | $1,668 | 5.3% |
| Other Taxes | 38,318 | 38,013 | 39,747 | 41,118 | 42,962 | 4,644 | 12.1% |
| Tax Audit Revenues | 1,200 | 721 | 721 | 721 | 721 | (479) | (39.9%) |
| Subtotal: Taxes | $71,088 | $71,139 | $72,834 | $74,472 | $76,921 | $5,833 | 8.2% |
| Miscellaneous Revenues | 8,251 | 7,793 | 7,624 | 7,562 | 7,518 | (733) | (8.9%) |
| Unrestricted Intergovernmental Aid | 297 | 0 | 0 | 0 | 0 | (297) | (100.0%) |
| Less: Intra-City Revenues | (2,361) | (1,996) | (1,987) | (1,989) | (1,986) | 375 | (15.9%) |
| Disallowances Against Categorical Grants | (15) | (15) | (15) | (15) | (15) | 0 | 0.0% |
| Subtotal: City-Funds | $77,260 | $76,921 | $78,456 | $80,030 | $82,438 | $5,178 | 6.7% |
| Other Categorical Grants | 1,109 | 1,082 | 1,075 | 1,070 | 1,070 | (39) | (3.5%) |
| Inter-Fund Revenues | 706 | 720 | 725 | 732 | 732 | 26 | 3.7% |
| Federal Categorical Grants | 11,721 | 10,411 | 8,060 | 7,052 | 7,026 | (4,695) | (40.1%) |
| State Categorical Grants | 18,113 | 17,555 | 17,540 | 17,304 | 17,367 | (746) | (4.1%) |
| Total Revenues | $108,909 | $106,689 | $105,856 | $106,188 | $108,633 | ($276) | (0.3%) |
| Expenditures | |||||||
| Personal Service | |||||||
| Salaries and Wages | $33,461 | $32,661 | $33,793 | $35,090 | $36,297 | $2,836 | 8.5% |
| Pensions | 9,414 | 9,634 | 10,415 | 10,878 | 11,060 | 1,646 | 17.5% |
| Fringe Benefits | 12,375 | 13,300 | 14,155 | 14,913 | 15,529 | 3,154 | 25.5% |
| Subtotal-PS | $55,250 | $55,595 | $58,363 | $60,881 | $62,886 | $7,636 | 13.8% |
| Other Than Personal Service | |||||||
| Medical Assistance | $6,297 | $6,651 | $6,385 | $6,385 | $6,535 | $238 | 3.8% |
| Public Assistance | 1,970 | 1,650 | 1,650 | 1,650 | 2,000 | 30 | 1.5% |
| All Other | 43,238 | 38,559 | 35,925 | 34,729 | 35,000 | (8,238) | (19.1%) |
| Subtotal-OTPS | $51,505 | $46,860 | $43,960 | $42,764 | $43,535 | ($7,970) | (15.5%) |
| Debt Service | |||||||
| Principal | $4,003 | $4,144 | $4,165 | $4,187 | $4,371 | $368 | 9.2% |
| Interest & Offsets | 3,541 | 3,671 | 4,101 | 4,847 | 5,354 | $1,813 | 51.2% |
| Subtotal Debt Service | $7,544 | $7,815 | $8,266 | $9,034 | $9,725 | $2,181 | 28.9% |
| FY 2022 BSA and Discretionary Transfers | ($6,114) | $0 | $0 | $0 | $0 | $6,114 | (100.0%) |
| FY 2023 BSA | $3,035 | ($3,035) | $0 | $0 | $0 | ($3,035) | (100.0%) |
| Capital Stabilization Reserve | $0 | $250 | $250 | $250 | $250 | $250 | NA |
| General Reserve | $50 | $1,200 | $1,200 | $1,200 | $1,200 | $1,150 | 2,300.0% |
| Less: Intra-City Expenses | (2,361) | (1,996) | (1,987) | (1,989) | (1,986) | 375 | (15.9%) |
| Total Expenditures | $108,909 | $106,689 | $110,052 | $112,140 | $115,610 | $6,701 | 6.2% |
| Gap to be Closed | $0 | ($0) | ($4,196) | ($5,952) | ($6,977) | ($6,977) | NA |
SOURCE: Mayor’s Office of Management and Budget
NOTE: Numbers may not add to totals due to rounding.
Table 2. Plan-to-Plan Changes, April 2023 Plan vs. January 2023 Plan
| ($ in millions) | FY 2023 | FY 2024 | FY 2025 | FY 2026 | FY 2027 |
| Revenues | |||||
| Taxes: | |||||
| General Property Tax | $149 | $392 | $220 | $477 | $1,082 |
| Other Taxes | 1,458 | 1,859 | 1,996 | 1,957 | 2,734 |
| Tax Audit Revenues | 479 | 0 | 0 | 0 | 0 |
| Subtotal: Taxes | $2,086 | $2,251 | $2,216 | $2,434 | $3,816 |
| Miscellaneous Revenues | 268 | 277 | 243 | 250 | 229 |
| Unrestricted Intergovernmental Aid | 45 | 0 | 0 | 0 | 0 |
| Less: Intra-City Revenues | (148) | (94) | (87) | (93) | (90) |
| Disallowances Against Categorical Grants | 0 | 0 | 0 | 0 | 0 |
| Subtotal: City-Funds | $2,251 | $2,434 | $2,372 | $2,591 | $3,955 |
| Other Categorical Grants | (63) | 22 | 18 | 15 | 16 |
| Inter-Fund Revenues | (20) | 22 | 26 | 33 | 33 |
| Federal Categorical Grants | (703) | 926 | (91) | 35 | 27 |
| State Categorical Grants | 1,056 | 630 | 377 | 87 | 86 |
| Total Revenues | $2,521 | $4,034 | $2,702 | $2,761 | $4,117 |
| Expenditures | |||||
| Personal Service | |||||
| Salaries and Wages | $1,964 | $1,169 | $1,856 | $2,465 | $2,974 |
| Pensions | 0 | 71 | 632 | 927 | 1,261 |
| Fringe Benefits | (160) | (201) | (224) | (206) | (197) |
| Subtotal-PS | $1,804 | $1,039 | $2,264 | $3,186 | $4,038 |
| Other Than Personal Service | |||||
| Medical Assistance | ($267) | $266 | $0 | $0 | $0 |
| Public Assistance | 320 | 0 | 0 | 0 | 0 |
| All Other | 1,808 | 3,778 | 1,645 | 680 | 719 |
| Subtotal-OTPS | $1,`861 | $4,044 | $1,645 | $680 | $719 |
| Debt Service | |||||
| Principal | $0 | ($17) | ($13) | ($6) | ($13) |
| Interest & Offsets | (111) | (69) | (76) | (64) | (29) |
| Subtotal Debt Service | ($111) | ($86) | ($89) | ($70) | ($42) |
| FY 2022 BSA and Discretionary Transfers | $0 | $0 | $0 | $0 | $0 |
| FY 2023 BSA | $869 | ($869) | $0 | $0 | $0 |
| Capital Stabilization Reserve | ($250) | $0 | $0 | $0 | $0 |
| General Reserve | ($1,505) | $0 | $0 | $0 | $0 |
| Deposit to Rainy Day Fund | $0 | $0 | $0 | $0 | $0 |
| Less: Intra-City Expenses | ($148) | ($94) | ($87) | ($93) | ($90) |
| Total Expenditures | $2,520 | $4,034 | $3,733 | $3,703 | $4,625 |
| Gap to be Closed | $0 | $0 | ($1,031) | ($942) | ($508) |
SOURCE: Mayor’s Office of Management and Budget
NOTE: Numbers may not add to totals due to rounding.
Table 3. Plan-to-Plan Changes, April 2023 Plan vs. June 2022 Plan
| ($ in millions) | FY 2023 | FY 2024 | FY 2025 | FY 2026 |
| Revenues | ||||
| Taxes: | ||||
| General Property Tax | $149 | $392 | $220 | $477 |
| Other Taxes | 2,711 | 2,360 | 2,541 | 2,478 |
| Tax Audit Revenues | 479 | 0 | 0 | 0 |
| Subtotal: Taxes | $3,339 | $2,752 | $2,761 | $2,955 |
| Miscellaneous Revenues | 940 | 538 | 362 | 279 |
| Unrestricted Intergovernmental Aid | 45 | 0 | 0 | 0 |
| Less: Intra-City Revenues | (387) | (57) | (58) | (60) |
| Disallowances Against Categorical Grants | 0 | 0 | 0 | 0 |
| Subtotal: City-Funds | $3,937 | $3,233 | $3,065 | $3,174 |
| Other Categorical Grants | 80 | 66 | 60 | 58 |
| Inter-Fund Revenues | (30) | (12) | (6) | 1 |
| Federal Categorical Grants | 2,437 | 1,735 | 102 | 78 |
| State Categorical Grants | 1,361 | 665 | 406 | 116 |
| Total Revenues | $7,785 | $5,687 | $3,627 | $3,427 |
| Expenditures | ||||
| Personal Service | ||||
| Salaries and Wages | $1,793 | $688 | $1,340 | $2,040 |
| Pensions | $0 | $932 | $2,601 | $3,945 |
| Fringe Benefits | ($265) | ($456) | ($565) | ($524) |
| Subtotal-PS | $1,528 | $1,164 | $3,376 | $5,461 |
| Other Than Personal Service | ||||
| Medical Assistance | ($267) | $266 | $0 | $0 |
| Public Assistance | $320 | $0 | $0 | $0 |
| All Other | $5,520 | $3,410 | $1,122 | $338 |
| Subtotal-OTPS | $5,573 | $3,676 | $1,122 | $338 |
| Debt Service | ||||
| Principal | $9 | ($77) | $74 | $32 |
| Interest & Offsets | (218) | (194) | (405) | (372) |
| Subtotal Debt Service | ($209) | ($271) | ($331) | ($340) |
| FY 2022 BSA and Discretionary Transfers | $0 | $0 | $0 | $0 |
| FY 2023 BSA | $3,035 | ($3,035) | $0 | $0 |
| Capital Stabilization Reserve | ($250) | $0 | $0 | $0 |
| General Reserve | ($1,505) | $0 | $0 | $0 |
| Deposit to Rainy Day Fund | $0 | $0 | $0 | $0 |
| Less: Intra-City Expenses | ($387) | ($57) | ($58) | ($60) |
| Total Expenditures | $7,785 | $1,477 | $4,109 | $5,399 |
| Gap to be Closed | $0 | $4,210 | ($482) | ($1,972) |
NOTE: Numbers may not add to totals due to rounding.
SOURCE: Mayor’s Office of Management and Budget
Table 4. Risks and Offsets to the April 2023 Financial Plan
| FY 2023 | FY 2024 | FY 2025 | FY 2026 | FY 2027 | |
| City Stated Gap | $0 | $0 | ($4,196) | ($5,952) | ($6,977) |
| Tax Revenues | |||||
| Property Tax | $90 | ($24) | $513 | $663 | $1,384 |
| Personal Income Tax | 590 | 410 | 124 | 99 | (245) |
| Business Taxes | 297 | (359) | (451) | (188) | (49) |
| Sales Tax | 71 | 235 | 151 | 60 | (9) |
| Real Estate Transaction Taxes | 43 | (45) | 228 | 188 | 3 |
| All Other | (1) | (8) | 40 | 67 | 70 |
| Audit | 100 | 179 | 179 | 179 | 179 |
| Subtotal Tax Revenues | $1,191 | $388 | $784 | $1,068 | $1,333 |
| Miscellaneous Revenues | ($89) | $67 | $65 | $49 | $34 |
| Total Revenues | $1,102 | $455 | $849 | $1,117 | $1,367 |
| Expenditures | |||||
| PS Accrual Savings | $725 | $362 | $0 | $0 | $0 |
| Temporary and Professional Services | 0 | (155) | 0 | 0 | 0 |
| Overtime | (282) | (538) | (440) | (440) | (440) |
| Education | (210) | (822) | (1,069) | (1,997) | (2,720) |
| Public Health Corps | 0 | 0 | (13) | (49) | (49) |
| Public Assistance | 0 | (225) | (225) | (225) | 0 |
| Rental Assistance | 0 | (392) | (392) | (392) | (392) |
| Payroll Mobility Tax | 0 | (65) | (69) | (72) | (73) |
| Contributions to MTA | 25 | (298) | (442) | (450) | (497) |
| Prevailing Wage for Shelter Security Guards | 0 | (55) | (55) | (55) | (55) |
| Foster Care Reimbursement Rate | 0 | (118) | (118) | (118) | (118) |
| Variable Rate Debt Service Savings | 40 | 0 | 0 | 0 | 0 |
| Court Appointed Counsel | 0 | (42) | (42) | (42) | (42) |
| Minimum Wage Increase | 0 | (8) | (21) | (30) | (38) |
| State Intercept of ACA eFMAP Savings | 0 | (129) | (214) | (343) | (343) |
| PHE eFMAP Savings | 285 | 48 | 0 | 0 | 0 |
| City Settlements | 0 | (157) | 0 | 0 | 0 |
| Total Expenditures | $583 | ($2,594) | ($3,100) | ($4,214) | ($4,767) |
| Comptroller’s (Risks)/Offsets | $1,685 | ($2,138) | ($2,251) | ($3,097) | ($3,399) |
| Restated (Gap)/Surplus | $1,685 | ($2,138) | ($6,447) | ($9,049) | ($10,376) |
| Asylum-Seeker Re-estimate | |||||
| Projected Risk | $0 | ($1,150) | ($2,940) | ($3,650) | ($3,650) |
| Restated (Gap)/Surplus w/ Asylum-Seeker Re-estimate | $1,685 | ($3,288) | ($9,387) | ($12,699) | ($14,026) |
$ in millions, positive numbers decrease the gap and negative numbers increase the gap
NOTE: Numbers may not add to totals due to rounding.
SOURCE: Office of the New York City Comptroller
II. The City’s Economic Outlook
Economic Forecast, 2023 – 2027[2]
More than one year has elapsed since the Federal Reserve started to significantly increase interest rates, and their upward revisions have continued through this month—although at a more moderate pace than when they began. The Federal Funds Rate—which is essentially under the Fed’s control—currently fluctuates in the range of 5.00 to 5.25 percent, while it stood at close to zero in February 2022. Throughout this period, many economic prognosticators have predicted an impending recession or at least a deceleration to a very slow rate of economic growth. However, most current economic measures suggest that a recession is likely not imminent.
The Mayor’s Office of Management and Budget (OMB) has revised upward its own prediction of real economic growth in calendar year 2023 to 1.0 percent (from 0.3 percent previously). Their forecast growth rises to 1.5 percent in 2024 and goes no higher than 1.7 percent in any year during the Plan window through 2027.
While acknowledging that substantial risks are present and the possibility of recession remains non-negligible, the Comptroller’s Office’s forecast expects that the U.S. economy will grow in both 2023 and 2024 at 1.7 percent each year. Our projected growth rates in years 2025-27, averaging 2.6 percent per year, are also higher than OMB’s and closer to long-run average growth rates outside of recessions.
Table 5 summarizes the economic forecasts of the Office of the Comptroller and OMB.
Table 5. Summary of Economic Forecasts
| 2023 | 2024 | 2025 | 2026 | 2027 | |||
| U.S. Economy | |||||||
|---|---|---|---|---|---|---|---|
| Real GDP (2012 $, % Change) | Comptroller | 1.7 | 1.7 | 2.6 | 2.8 | 2.5 | |
| Mayor | 1.0 | 1.5 | 1.5 | 1.7 | 1.7 | ||
| Payroll Jobs, (% Change) | Comptroller | 1.9 | 0.3 | 0.6 | 0.4 | 0.4 | |
| Mayor | 1.6 | (0.4) | (0.2) | 0.1 | 0.3 | ||
| Fed Funds Rate, (Percent) | Comptroller | 4.92 | 4.27 | 3.16 | 2.50 | 2.50 | |
| Mayor | 5.05 | 4.62 | 3.20 | 2.63 | 2.63 | ||
| 10-Year Treasury Notes, (Percent) | Comptroller | 3.86 | 3.88 | 3.79 | 3.98 | 4.01 | |
| Mayor | 3.98 | 3.70 | 3.39 | 3.26 | 3.23 | ||
| NYC Economy | |||||||
| Payroll Jobs (Change in Thousands) | Comptroller | 86.8 | 28.9 | 56.7 | 54.9 | 55.7 | |
| Mayor | 92.3 | 76.7 | 74.9 | 77.3 | 70.7 | ||
| Wage Earnings, (% Change) | Comptroller | 3.2 | 5.0 | 4.2 | 4.3 | 4.1 | |
| Mayor | 0.5 | 5.1 | 4.9 | 4.5 | 4.7 | ||
| CPI NY Area, (% Change) | Comptroller | 3.9 | 2.6 | 2.3 | 2.3 | 2.3 | |
| Mayor | 3.5 | 1.9 | 1.7 | 1.6 | 1.7 | ||
SOURCE: Office of the New York City Comptroller, Mayor’s Office of Management and Budget
Current Economic Conditions
Economic Growth
Economic growth in the U.S. has remained solid since the middle of last year, despite a persistent consensus view expecting a recession or significant slowdown. The U.S. economy’s real gross domestic product (GDP) grew at a 2.9 percent annual rate in the latter half of 2022, rebounding from a decline in the first half of the year, despite the contractionary monetary policy interventions by the Federal Reserve. While advanced GDP estimates from the Bureau of Economic Analysis for the first quarter of 2023 indicated a slower growth rate of 1.1 percent, this figure includes a $138 billion drawing down of private inventories that reduced real GDP growth spending, real GDP growth in the first quarter of 2023 was 2.9 percent. This economic growth was primarily fueled by real (i.e., inflation-adjusted) personal consumption spending, which rose by a strong 3.7 percent rate. The GDPNow measure from the Atlanta Fed—a “nowcast” of the current quarter based on available data—estimates the second quarter of 2023 growing at 2.7 percent.
Significant inventory reduction is often a sign that the economy has already entered the downward part of its business cycle and the resulting lowered inventory levels will help to activate the self-correcting recovery stage. The fact that this drawdown has not coincided with a negative GDP growth rate is a positive sign for the economy’s chances to get through this year without entering a recession.
Credit and Interest Rates
On May 3rd, the Federal Reserve increased interest rates to a range between 5.0 percent and 5.25 percent. The statement accompanying the decision signaled the possibility of a pause in the hiking cycle after 10 consecutive increases dating back to March 2022.
Recent liquidity crises in the banking sector have rattled nerves in an uncertain economy. The turmoil began with the failures of Silicon Valley Bank and Signature Bank in March and was sparked again at the start of May by First Republic’s disclosure of a drop in deposits exceeding 40 percent in the first quarter. Mid-size regional lenders play a major role in originating commercial real estate loans in the U.S. and in New York City—Signature was prominent in the NYC multifamily market while First Republic specialized in high-end mortgages in the city—and it therefore remains important to monitor impacts on lending.
The evidence so far suggests that federal policymakers have ample tools to largely insulate the economy and the financial system from substantial harm from such flare-ups. The FDIC rapidly arranged First Republic’s sale to J.P. Morgan Chase, which seemingly mitigated any further spread of the crisis. These are stories of undercapitalization and mismanaged risks at selective institutions, and the government has been expanding its role as a lender of last resort and as a facilitator of private-sector correctives—both of which provide significant crisis containment.
All of this is not to say there are no real credit effects from these events. Indeed, bank credit downgrades have raised the costs of funds overall by as much as 100 basis points (1.00 percent), indirectly impacting the rates borrowers pay. This amplification of the Fed’s policy of intentionally raising rates is part of the reason the monetary authority appears ready to pause its hikes. The Fed’s Senior Loan Officer Opinion Survey on Bank Lending Practices is showing an elevated number of banks reporting tightening lending standards, although most of those banks answered “tightened somewhat” rather than “tightened considerably.” And measures of total bank credit have been turning downward. In sum, the balance sheet crises at a certain number of regional banks are having a tightening effect, but so far it appears modest, and perhaps corrective, and not a credit “crunch” such as was seen last in 2008.
It is most likely that the lasting impact of these crises will come in the next major overhaul of banking regulation—when it will be recognized that the government is now implicitly underwriting commercial banks beyond those considered systemically important.
Inflation
Although inflation is moderating in both the U.S. and the New York City area, as seen in Chart 1, and trending in the right direction in most categories of goods and services, price growth remains far above the Federal Reserve’s target of 2 percent. The April headline Consumer Price Index (CPI) 12-month growth rate fell to 4.9 percent in the U.S. and to 3.7 percent in the New York City area. Inflation peaked in June 2022 at 9.1 percent nationally and 6.7 percent in the New York City area. The Federal Reserve’s preferred gauge (the core Personal Consumption Expenditures, or PCE, price index) stood at 4.6 percent year-over-year in March. CPI grew at a slower rate in the NYC area than in the U.S. since January 2021, with the differential widening to 2.5 percentage points in the first quarter of 2022. The rates have more recently converged. In the first quarter of 2023, the differential averaged 0.3 percentage points.
Chart 1. U.S. and NYC Area CPI (12-Month Percent Change)
SOURCE: Bureau of Labor Statistics
Locally, increased housing price inflation over the past year has masked what has been a stronger deceleration in other prices. As shown in Chart 2, shelter inflation in the New York City area—which captures housing costs of all types—remained near 6 percent in the first quarter of 2023. This is in sharp contrast with all other items in the basket, for which CPI inflation dropped to 2.5 percent in March (notably, motor fuel posted a 15.3 percent decline over the year).
Chart 2. NYC Area CPI Shelter vs. All Other Items (12-Month Percent Change)
SOURCE: Bureau of Labor Statistics
Corroborating this data on housing costs, median asking rental rates for one-bedroom apartments in New York City on StreetEasy.com have increased by 20 percent over the past year, as seen in Chart 3. This rise has been accompanied by a relatively low inventory of available apartments—averaging below 30,000 over the past 12 months compared to a nearly 40,000 average from 2015 through 2019 (a 25 percent decline).
Chart 3. NYC Rental Housing Inventory and Median One-Bedroom Asking Rent
SOURCE: StreetEasy.com
Labor Markets
After fully recovering from pandemic-era declines, and a year-plus into a period of contractionary monetary policy intended to curb a spike in inflation, the U.S. job market continues to show resilience, with 253,000 jobs added in April and the unemployment rate dropping to 3.4 percent (its lowest since May 1969). Average hourly earnings in April grew 4.4 percent over the year and the March Wages and Salaries component of the Employment Cost Index came in at 5.0 percent over the year.
But despite the low unemployment rate and continued wage and job growth, there are signs suggesting that labor markets are not tight: Job openings and quitting rates have both fallen significantly in recent months without an accompanying rise in the unemployment rate. This loosening of the job market likely portends a future reduction in wage growth and gives credence to the hope that the Fed can engineer a “soft-landing” reduction of inflation without an economic recession.
In New York State, the March job openings rate has already fallen to 4.5 percent of the labor force, a level consistent with earlier non-inflationary times (note that job openings data are not available below the state level, but New York City contains close to half of all employment statewide). Chart 4 shows the relationship between the job openings rate and the unemployment rate in New York State. Historically, downward movement in job openings rates is almost always associated with rising unemployment rates. This inverse correlation can be seen in the orange line which maps the relationship of the two rates between 2010 and early 2020. At the onset of the pandemic, in April 2020, the unemployment rate suddenly spiked (the grey line) as businesses shuttered temporarily, going far off the line that had previously prevailed. In the following year-and-a-half, unemployment fell steadily and the job openings rate rose commensurately (blue line), pushing job openings rates to unprecedented highs. These high openings rates were of great concern as they were likely to lead to rapid wage growth that, in turn, would fuel inflation. And the only way down appeared to include a rise in the unemployment rate, if this historic relationship still held. But in this unique case, the job openings rate in New York State has been falling for 15 months without any significant rise in the unemployment rate (yellow line).
Chart 4. Job Openings Versus Unemployment in New York State
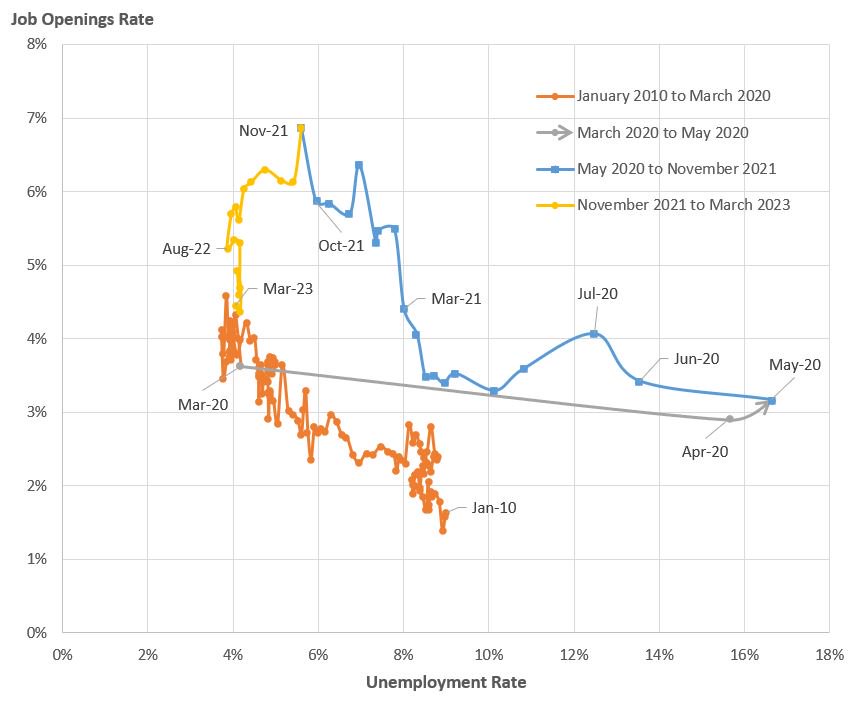
SOURCE: Bureau of Labor Statistics and NYC Office of the Comptroller
One part of the unusual labor market story in New York City has been a rise in the labor force. As seen in Chart 5, the City’s labor force has grown by 0.2-0.3 percent per month over the last eight months, for a cumulative total of 2.0 percent (83,000 workers). Such a pattern is usually seen in a recovery from a recession with high unemployment, with previously discouraged workers re-entering the employment and job-seeking pools as signs of a better labor market. Unlike a labor force contraction during a typical recession, which is largely a consequence of discouraged workers, the labor force reduction following the onset of the pandemic was caused by a temporary combination of home care needs, health concerns, and new forms of financial assistance. Recent labor supply increases appear to be the partial unwinding of those developments.
Chart 5. New York Labor Force and Unemployment Rate
SOURCE: New York State Department of Labor
NYC Employment
New York City private-sector employment rose by 190,000 jobs from March 2022 to March 2023, a 5 percent gain in payrolls that has returned the count to 99.7 percent of its pre-pandemic level from February 2020 (on a seasonally adjusted basis). However, the jobs recovery has been differently experienced across the city’s industries. Certain sectors have already significantly surpassed 100 percent of their pre-pandemic level—such as health care and social assistance (110 percent of pre-pandemic), and office-based employers in finance, information, and professional and business services (all at least 101 percent of pre-pandemic). At the same time, jobs in accommodation and food service (94 percent of pre-pandemic), construction (92 percent), retail (88 percent), and arts and entertainment (86 percent) lag their earlier levels. Table 6 shows New York City employment numbers as of March 2023. April payroll counts just released by the State show a decline of 16,000 jobs in NYC on a seasonally adjusted basis, with the largest declines in transportation and warehousing (8,800) and information technology (4,500).
Table 6. New York City Employment, Pre-Pandemic vs. Current
| (in thousands) | Seasonally Adjusted NYC Employment | March 2023 Change From | Mar. ’23 as a % of | |||||
| Industry: | Feb. ’20 | Apr.’20 | Mar. ’22 | Mar. ’23. | Feb. ‘20 | Apr. ‘20 | Mar. ’22 | Feb. ’20 |
|---|---|---|---|---|---|---|---|---|
| Total Non-Farm | 4,702.6 | 3,746.0 | 4,476.6 | 4,672.0 | (30.5) | 926.0 | 195.4 | 99.4% |
| Total Private | 4,108.1 | 3,161.7 | 3,907.4 | 4,097.1 | (11.0) | 935.4 | 189.7 | 99.7% |
| Financial Activities | 487.1 | 469.1 | 477.6 | 495.8 | 8.7 | 26.7 | 18.2 | 101.8% |
| Information | 229.2 | 204.2 | 234.0 | 235.3 | 6.1 | 31.1 | 1.3 | 102.7% |
| Professional and Business Services |
781.3 | 688.1 | 764.4 | 792.0 | 10.7 | 103.9 | 27.6 | 101.4% |
| Educational Services | 256.4 | 229.4 | 255.3 | 258.7 | 2.3 | 29.3 | 3.3 | 100.9% |
| Health Care and Social Assistance |
823.5 | 707.5 | 832.1 | 907.4 | 83.9 | 199.9 | 75.3 | 110.2% |
| Arts, Entertainment, and Recreation |
95.7 | 50.7 | 74.7 | 82.6 | (13.1) | 31.9 | 7.9 | 86.3% |
| Accommodation and Food Services |
374.4 | 105.8 | 307.8 | 350.6 | (23.8) | 244.8 | 42.8 | 93.6% |
| Other Services | 196.1 | 129.2 | 176.7 | 185.3 | (10.8) | 56.1 | 8.6 | 94.5% |
| Retail Trade | 346.1 | 230.3 | 307.0 | 305.1 | (41.0) | 74.8 | (1.9) | 88.2% |
| Wholesale Trade | 139.8 | 108.3 | 129.6 | 131.4 | (8.4) | 23.1 | 1.7 | 94.0% |
| Transportation and Warehousing |
134.9 | 98.8 | 132.6 | 131.8 | (3.1) | 33.0 | (0.8) | 97.7% |
| Construction | 162.6 | 87.7 | 143.7 | 149.8 | (12.8) | 62.1 | 6.1 | 92.1% |
| Manufacturing | 66.0 | 37.8 | 57.1 | 56.9 | (9.0) | 19.1 | (0.2) | 86.3% |
SOURCE: New York State Department of Labor, Mayor’s Office of Management and Budget
The Comptroller’s Office’s economic forecast projects New York City employment slowing its growth to 1.9 percent in calendar year 2023, 0.7 percent in 2024, and 1.3 percent in 2025-2027. Our forecast contains expected 2023 declines in employment in two high-wage sectors—securities and information technology, as well as indirect job-loss effects on other sectors emanating from the changes in these two industries.
The Comptroller’s Office expects that securities firms are currently reducing or planning reductions in their New York City employment, in response to diminished profits. Many of these reductions may not yet be showing up in the most recent employment data because of severance arrangements that formally delay removal from payrolls. The Comptroller’s Office projections reduce NYC securities employment by 6,000 (3 percent) over the course of 2023.
Nationwide, the information technology sector has been announcing payroll reductions. The sector, which employed 15,000 more people in New York City in 2022 than in 2019, already shed a net of 4,000 jobs in the city this year. The Comptroller’s Office expects a cumulative decline of 7,500 by the end of 2023. April 2023 payroll counts just released show an additional monthly decline of 4,500 for the information technology industry.
OMB’s New York City total employment forecast grows by 1.7 percent annually, on average, through 2027. In contrast, the Comptroller’s Office forecasts that relatively little post-pandemic employment recovery remains and assumes that—after a brief slowdown in 2023-24—overall New York City employment resumes growing at a historically typical rate of 1.2 percent.
Consumer Spending and Taxable Sales
Newly released data on taxable sales through February 2023 allows a preliminary analysis of consumer spending in New York City three years into the COVID-19 pandemic. Chart 6 contains an index of taxable sales to equal 100 in the first quarter of 2020. In the initial quarters of the COVID-19 pandemic, taxable sales surged in the parts of the New York Metropolitan Statistical Area (MSA) outside city limits, while they remained well below pre-pandemic levels in the city itself. This is consistent with an outflow of city residents and far fewer office and other daily commuters into the city. More recently, the gap in spending between New York City and its suburbs appears to be narrowing. NYC taxable sales in the first quarter of 2023 were 14.2 percent higher than three years prior, as compared with 16.7 percent higher in the inner MSA and 20.6 percent higher in the outer MSA.
Chart 6. Taxable Sales in NYC and the MSA
SOURCE: New York State Department of Taxation and Finance, Office of the New York City Comptroller. Inner MSA includes Long Island and the Lower Hudson Valley (Putnam, Rockland, and Westchester counties). Outer MSA includes the Mid-Hudson Valley (Dutchess, Orange, Sullivan, and Ulster counties).
NYC Real Estate Markets
After two years of post-pandemic recovery, office attendance in NYC appears to have reached a tentative steady state, with pandemic-accelerated remote and hybrid work patterns now expected to continue indefinitely. Card-swipe entry data from Kastle Systems are indicating stability in the rate of utilization of NYC office space in this year to date—a rate that averages 47 percent of its pre-pandemic usage levels. Other cities around the U.S. are also showing stabilizing preferences for physically reporting to the office in the Kastle data, but at different levels—for example, the technology-oriented San Jose area has stabilized at under 40 percent office attendance while Houston, a city with a greater intensity of professional and business services, has stayed near 60 percent. Corroborating this data for NYC is a February survey of office-based employers by Partnership for New York City which indicates that current office attendance averages 52 percent, not far below the employers’ expected “new normal” of 56 percent.
Diminished utilization of offices may foreshadow lower demand for leased space in the future. Long-term leases prevalent in much of the office market may spread the effects of such reduced demand over many years. But as can be seen in Chart 7, the most recent data on volume of leasing indicate that after having only partially recovered from its pandemic low point, NYC office leasing activity has declined in the past two quarters, especially for Class A office space.
Chart 7. NYC Office Leasing Activity by Class
SOURCE: CoStar
Risks to the Forecast
Despite the Comptroller’s Office’s forecast that a recession is not very likely, it remains a possibility in an uncertain economy. The consensus among economists is that the economy will shrink starting next quarter. Significant risk arises from tightening monetary policy. Inflation remains elevated and the Fed has made its intentions clear that it will raise rates further and risk a recession if inflation is not kept in check. Even though the “soft landing” scenario remains intact thus far, an increase in wage and price growth rates could alter the near-term economic outlook significantly. Due to the strength of payroll jobs, consumer spending, and core services inflation, a “no landing” scenario has started to emerge, where the Fed needs to raise rates more to tighten financial conditions and slow down demand. However, the turmoil in the banking sector and the associated tightening of credit standards have made this scenario less likely.
Negotiations regarding the U.S. debt ceiling could also generate market volatility. The Secretary of the Treasury recently informed Congress that, because of lower tax receipts, the Federal government is projected to hit the debt limit earlier than previously thought, potentially as early as June 1. The Fed’s chair remarked that breaching the debt limit would have “highly uncertain” and “averse” consequences on the U.S. economy, which the Fed may not be able to counter.
At the New York City level, an additional risk derives from the possibility of deeper job losses in the securities and tech sectors, and in overall office-using employment. Higher interest rates (especially long-term rates) and stagnating or declining leasing activity could exacerbate financial stress for commercial real estate. Widespread monetary tightening and supply shocks at a global level could also slow down the recovery of international travel and tourism spending.
III. The FY 2024 Executive Budget and April 2023 Financial Plan
Overview: Changes to FY 2023 and FY 2024
FY 2023 Budget
The FY 2023 Budget in the April 2023 Financial Plan totals $108.91 billion, an increase of $2.52 billion from the January Plan. The increase is the result of $2.25 billion more in anticipated City-funded revenues and $1.06 billion in additional State grants, offset by a $658 million reduction in Federal funding (including unrestricted grants).
The majority of the increase in City-funded revenues comes from upward revisions for nearly all the City’s major tax sources, resulting in an increase of $2.09 billion in forecasted tax revenues compared to the January Plan. Projections for miscellaneous revenue, from things like fines and fees also increased. The largest single source of the increase in State funding ($438 million of the $1.06 billion FY 2023 increase) reflects the Enacted State Budget’s action to provide the City with funding to help cover the cost of shelter for people seeking asylum in the City. In prior plans, the City had budgeted $1 billion in Federal funds to pay for these costs. This Federal support was removed in the April Plan for FY 2023, leading to the overall drop in Federal funding. This decline was offset somewhat by smaller increases in other Federal programs.
On the City-funded expenditure side, the largest change for FY 2023 comes from the addition of $2.29 billion to the City’s labor reserve to fund contract settlements for the City’s workforce. The City also budgeted $962 million of its own funds to cover costs of services and shelter for people seeking asylum, given the rising costs and lack of Federal aid expected this year. Another $815 million was added in agency expenditures. To help cover these increased expenditures the City drew down nearly all its budgeted reserves ($1.50 billion from the General Reserve and $250 million from the Capital Stabilization Fund). This leaves a balance of $50 million in the General Reserve remaining for FY 2023. Savings from the City’s PEG program increased by $417 million.
The City also added $868 million in surplus FY 2023 resources to the Budget Stabilization Account to pre-pay FY 2024 debt service and close that year’s budget gap.
FY 2024 Budget
The FY 2024 Budget in the April Plan totals $106.69 billion, the largest Executive Budget in the City’s history. It reflects a $4.03 billion increase over the January Plan. More than half of this increase comes from revisions in City-funded revenues, which are $2.43 billion higher than planned in January. As for FY 2023, the City increased projections for all its major tax sources, except for the mortgage recording tax (no change). Non-City funding sources increased by $1.60 billion, including the addition of $926 million in Federal grants and $630 million in State grants. The increase in non-City funds is largely due to expected funding to help pay for costs of services to people seeking asylum, with $600 million budgeted to come from Washington in FY 2024 and $562 million from Albany.
City-funded expenditures for FY 2024 increased by $3.30 billion compared to the January Plan. Just over half of this increase ($1.74 billion) is budgeted to cover costs related to services for people seeking asylum in the City’s care. The increase also includes $1.68 billion for the City’s labor reserve for contract settlement costs. Other City-funded agency expenditures increased by $959 million. These increases are offset by $863 million in additional PEG savings, as well as $216 million in debt service savings and other adjustments. As mentioned above, the City has budgeted $868 million in FY 2023 resources to pre-pay FY 2024 debt service costs, closing the FY 2024 budget gap.
Table 7. Changes to FY 2023 and FY 2024 City-Funds Estimates
from the January 2023 Plan
| ($ in millions) | FY 2023 | FY 2024 |
| Gap to be Closed – January 2023 Plan | $0 | $0 |
| Revenues | ||
| Tax Revenues | $2,086 | $2,238 |
| Non- Tax Revenues | 118 | 98 |
| Unrestricted Governmental Aid | 37 | 0 |
| Revenues From PEGs | 9 | 98 |
| Total Revenue Changes | $2,250 | $2,434 |
| Expenditures | ||
| Agency Expenditures | $815 | $959 |
| Asylum Seekers | 962 | 1,738 |
| Federal Funding Adjustment | 0 | (130) |
| Labor Reserve | 2,288 | 1,684 |
| Savings from PEGs | (417) | (863) |
| Debt Service | (111) | (86) |
| General Reserve | (1,505) | 0 |
| Capital Stabilization Fund | (250) | 0 |
| Prior Payables | (400) | 0 |
| Total Expenditure Changes | $1,382 | $3,302 |
| Gap To Be Closed Before Prepayments | $868 | ($868) |
| FY 2023 Prepayment of FY 2024 Debt Service | ($868) | $868 |
| Gap to be Closed – April 2023 Plan | $0 | $0 |
Program to Eliminate the Gap (PEG)
The April 2023 Financial Plan PEG totals $4.81 billion over the five years of the Plan period: $541.1 million in FY 2023, $1.05 billion in FY 2024, $1.11 billion in FY 2025, $1.09 billion in FY 2026, and $1.02 billion in FY 2027.
A partial vacancy restoration at the Departments of Social Services, Housing Preservation and Development, and Finance offset the PEG by $4.4 million in FY 2023 and restored 393 positions.
Combined with PEG initiatives from the November and January Plans, the savings sum to $13.66 billion over the Plan period. The largest categories of savings over the budget cycle are in expense re-estimates ($4.17 billion), an area that covers spending needs below anticipated amounts, lower usage rates, efficiencies, funding re-allocations, and expense-to-capital swaps.
Savings associated with personnel – including headcount reductions, fringe funding reductions, personnel savings not requiring headcount reductions, and accruals – make up $3.75 billion of the savings over the three programs. Over a third of this amount ($1.29 billion) represents vacancy reductions, with 4,496 city-funded positions slated to be cut as a result of the Administration’s PEG actions in FY 2024. Another $581.7 million of the personnel savings impacts fringe benefits across the Plan period, including reductions tied to headcount decreases ($465 million) and funding shifts to other sources of revenue ($116.7 million).
Separately, $2.12 billion of the PEG items (including some that are associated with personnel costs) are flagged as possible program impact actions – these are items that have the potential to directly impact service delivery.
Table 8. Cumulative PEGs Across the Budget Cycle
| Category | FY 2023 | FY 2024 | FY 2025 | FY 2026 | FY 2027 |
| April 2023 Financial Plan | |||||
| Debt Service | ($110,700,499) | ($85,569,936) | ($89,330,762) | ($70,150,209) | ($41,672,966) |
| Expense Re-Estimate | ($270,806,608) | ($448,129,011) | ($504,493,868) | ($544,552,662) | ($543,294,899) |
| Possible Program Impact | ($10,000,000) | ($138,884,391) | ($131,187,324) | ($128,218,530) | ($130,218,524) |
| PS Savings | ($17,400,000) | ($234,788,372) | ($248,899,132) | ($212,838,857) | ($181,266,196) |
| Revenue | ($132,156,685) | ($139,401,032) | ($133,108,206) | ($133,164,138) | ($127,814,138) |
| April 2023 Financial Plan Total | ($541,063,792) | ($1,046,772,742) | ($1,107,019,292) | ($1,088,924,396) | ($1,024,266,723) |
| January 2023 Financial Plan | |||||
| Debt Service | ($616,957) | ($53,812,000) | ($79,819,057) | ($98,664,469) | ($111,802,343) |
| PS Savings | ($144,597,385) | ($285,047,311) | ($291,594,235) | ($295,592,072) | ($299,626,167) |
| Revenue | ($65,328,000) | ($1,700,000) | ($1,700,000) | ($1,700,000) | ($1,700,000) |
| January 2023 Financial Plan Total | ($210,542,342) | ($340,559,311) | ($373,113,292) | ($395,956,541) | ($413,128,510) |
| November 2022 Financial Plan | |||||
| Debt Service | ($83,297,519) | ($116,163,806) | ($147,652,118) | ($158,593,298) | ($244,103,734) |
| Expense Re-Estimate | ($126,426,331) | ($337,193,520) | ($433,520,680) | ($477,893,767) | ($484,938,396) |
| Possible Program Impact | ($61,007,001) | ($373,974,503) | ($405,132,687) | ($372,021,785) | ($370,825,074) |
| PS Savings | ($366,431,053) | ($349,123,202) | ($290,620,868) | ($263,352,741) | ($254,383,677) |
| Revenue | ($278,885,567) | ($437,631,050) | ($239,631,723) | ($226,926,474) | ($217,585,625) |
| November 2022 Financial Plan Total | ($916,047,471) | ($1,614,086,081) | ($1,516,558,076) | ($1,498,788,065) | ($1,571,836,506) |
| Total PEG Impact November 2022, January 2023, April 2023 | |||||
| ($1,667,653,605) | ($3,001,418,134) | ($2,996,690,660) | ($2,983,669,002) | ($3,009,231,739) | |
SOURCE: Office of the New York City Comptroller, Mayor’s Office of Management and Budget
NOTE: Does not include $4,361,500 in FY 2023 partial vacancy restorations.
The April Program to Eliminate the Gap
OMB’s request for agencies to submit PEG proposals came just weeks before the release of the April Plan. The Administration cited cost concerns associated with collective bargaining and the city’s response to the influx of people seeking asylum in the City as reasons necessitating a savings program. Most agencies were required to submit a 4 percent reduction in their FY 2024 and outyear budgets. The DOE and CUNY were required to submit reductions of 3 percent. Agencies were also instructed to avoid layoffs and, where feasible, limit cuts that may impact service delivery.
Possible Program Impact
Many of the proposed initiatives seem to indicate that agencies have begun to pass on savings to contracted providers, likely forcing them to implement reductions. The Department of Homeless Services (DHS) included a “Provider Flexibility Funding” savings of $29.1 million in FY 2024 and the outyears that calls for contracted providers to reduce their budgets by 2.5 percent, with providers given some additional flexibility on salaries and staffing rules. The Department of Social Services (DSS) also submitted a provider flexibility savings of $3 million in FY 2024 and out, as well as a larger $9 million savings associated with the in-housing of various substance use treatment services. The Department of Correction (DOC) provided a savings of $17 million in FY 2024 and the outyears for the insourcing of contracted services including programmatic contractors.
Other concerning items include stated savings from reduced spending despite evidence of increased need:
- A reduction in home delivered meals ($5 million in FY 2024 and out) and Older Adult Center meals ($7 million in FY 2024 and $5.6 million in FY 2025 and out) due to less usage than expected at the Department for the Aging. This comes despite the Administration’s latest Mayor’s Management Report (MMR) highlighting that over 2.5 times as many meals have been served during the first four months of FY 2023 compared to the same time period in FY 2022.[3]
- Budgeted declines in spending for youth workforce programs ($9.1 million in FY 2024, $8.8 million in FY 2025 and out) at the Department of Youth and Community Development, even though the MMR showed growing programmatic participation.[4]
- Expense re-estimates at the Department of Housing Preservation and Development (HPD) for supportive housing rental assistance programs ($500,000 in FY 2023, $5.2 million in FY 2024, $8.2 million in FY 2025, $6.4 million in FY 2026, and $300,000 in FY 2027) despite completing more units of supportive housing.[5]
- Less spending on “traffic studies, data collection, and materials” at the Department of Transportation (DOT) ($23.4 million in FY 2024, $19.6 million in FY 2025, $18.1 million in FY 2026, and $20.1 million in FY 2027).
The Young Men’s Initiative, a public-private partnership started in 2011 (and greatly expanded during the de Blasio Administration) to address disparities among Black and Latino men between 16 and 24 continues to be incrementally reduced in the April Plan, losing $4.2 million in funding (just over $1 million baselined from FY 2024 onwards) across five agencies. The cumulative reduction over the three PEG plans for this program is $11.5 million from FY 2023 through FY 2027 across eight agencies.
Vacancy Reductions
In total, there were 122 City-funded vacancy reductions in the April Plan (160 cuts offset by 38 adds). Agencies with the largest reductions in planned positions included the Department of Sanitation (DSNY) with 76 uniformed reductions (33 in solid waste management, 24 in precision cleaning, 19 uniformed positions in administrative roles), the Department of Health and Mental Hygiene (DoHMH) with 33 reductions across divisions, DOT shifted 17 positions to state and Federal funding sources.
Efficiency Savings
Key efficiency savings in the April Plan include planned citywide wireless savings at the Office of Technology and Innovation (OTI, previously the Department of Information Technology and Telecommunications, DoITT) resulting from the discontinued use of devices and consolidation of wireless carriers ($20.3 million in FY 2024, $20.9 million in FY 2025, and $20.8 million in both FY 2026 and FY 2027) and technology-related funding efficiencies at DSS ($1 million in FY 2024 and out). This an example of the kind of cost-saving efficiency that could be explored and expanded into other areas of the City budget.
Uniformed Agency Offsets
The current PEG continues a pattern started in November of offsetting savings in the City’s uniformed agencies with other adjustments resulting in no actual budget reduction for these items, although they are counted in the PEG totals:
- The New York Police Department’s (NYPD’s) overtime reduction savings are offset by the same amount in adjustments elsewhere in the budget every fiscal year ($4 million in FY 2024 and out). NYPD school safety division personnel savings are offset by the same amount in every fiscal year ($59.9 million across the Financial Plan period). Interestingly, vacancy reductions associated with part-time school crossing guards in the amount of $7.5 million in FY 2024 and out were not offset by any other adds.
- The Fire Department (FDNY) saw similar offsets, with training savings ($1.6 million in FY 2024 and out), a reduction in help desk spending ($838,000 in FY 2024), and increased revenue from higher Medicare ambulance rates ($4.5 million in FY 2024 and out) completely offset by other City funds.
- DOC also saw a large offset in the outyears: $30 million in uniform overtime based on the closure of Rikers Island proposed but then also reversed with other adjustments in FY 2026 and FY 2027.
- Lastly, DSNY saw its savings of $6.7 million a year from FY 2024 and out from canceling annual snow removal training offset by the same amount in other adjustments.
S(no)w Future?
DSNY included snow removal savings of $45 million for the current fiscal year due to the lack of snow this winter. The City Charter sets the snow removal budget for a given fiscal year at the average of the five preceding fiscal years. Hence, a reduction of $904,000 in FY 2024, and an $11.8 million savings in the outyears.
Revenue and Other Considerations
The largest revenue item in the April Plan’s PEG (excluding rolls of prior year revenue into FY 2023) is NYPD’s increase in parking summons revenue based on headcount, deployment, and productivity, resulting in a gain of $30 million of revenue per year from FY 2024 and onwards. Similarly, DSNY includes $7.5 million in increased revenue annually beginning in FY 2024 resulting from alternate side parking summonses. DoHMH plans to “maximize several revenue sources agencywide” to bring in $7.5 million a year beginning in FY 2024—in areas as diverse as school-based nursing, mental health, building assessment, and health administration. Shifts to either State or Federal grant funding from City funds represent $24.5 million in FY 2024, $24.8 million in FY 2025, $22.4 million in FY 2026, and $20.4 million in FY 2027.
Risks and Offsets
The April 2023 Financial Plan, as required by law, presents a balanced budget in FY 2023 and FY 2024. It projects gaps of $4.20 billion in FY 2025, $5.95 billion in FY 2026, and $6.98 billion in FY 2027.
The Comptroller’s Office restates the City’s gaps and surpluses based on its own estimates of City revenues and expenditures; projected risks increase City gaps and offsets reduce them. In FY 2023, the Comptroller’s Offices projects that the City will end the year with a surplus of $1.69 billion, based on higher than anticipated revenues and somewhat lower expenditures than those forecast by the Administration. Given the uncertainty around the costs of services and shelter to people seeking asylum, the Comptroller’s Office presents its restated gaps in FY 2024 through FY 2027 with and without its projections of increased costs for this population.
If these costs remain within the levels currently budgeted by the City and all Federal and State reimbursement for these costs comes in as expected, the Comptroller’s Office estimates that FY 2024 will end with a gap of $2.14 billion and that outyear gaps will be higher than the City’s estimates: with a $6.45 billion gap projected for FY 2025, a $9.05 billion gap in FY 2026, and $10.38 billion gap in FY 2027. These differences result from higher revenue projections by the Comptroller’s Office in each year that are outstripped by even greater expenditure risks.
If the number of people seeking asylum in shelter and average daily cost to provide shelter exceeds levels currently projected by the City—and if not all non-City reimbursement comes in as currently projected—the Comptroller’s Office estimates that the City’s overall budget gaps would grow to $3.29 billion in FY 2024, $9.39 billion in FY 2025, $12.70 billion in 2026, and $14.03 billion in FY 2027. The City has not budgeted any funds for these costs in FYs 2026 and 2027, leading to the greater than $3 billion difference between the Comptroller’s Office’s two sets of estimates of gaps in those years. (See City Services for People Seeking Asylum section of this report for the Comptroller’s Office’s estimates of the possible increased costs).
Table 9. Risks and Offsets to the April 2023 Financial Plan
$ in millions, positive numbers decrease the gap and negative numbers increase the gap
| FY 2023 | FY 2024 | FY 2025 | FY 2026 | FY 2027 | |
| City Stated Gap | $0 | $0 | ($4,196) | ($5,952) | ($6,977) |
| Tax Revenues | |||||
| Property Tax | $90 | ($24) | $513 | $663 | $1,384 |
| Personal Income Tax | 590 | 410 | 124 | 99 | (245) |
| Business Taxes | 297 | (359) | (451) | (188) | (49) |
| Sales Tax | 71 | 235 | 151 | 60 | (9) |
| Real Estate Transaction Taxes | 43 | (45) | 228 | 188 | 3 |
| All Other | (1) | (8) | 40 | 67 | 70 |
| Audit | 100 | 179 | 179 | 179 | 179 |
| Subtotal Tax Revenues | $1,191 | $388 | $784 | $1,068 | $1,333 |
| Miscellaneous Revenues | ($89) | $67 | $65 | $49 | $34 |
| Total Revenues | $1,102 | $455 | $849 | $1,117 | $1,367 |
| Expenditures | |||||
| PS Accrual Savings | $725 | $362 | $0 | $0 | $0 |
| Temporary and Professional Services | 0 | (155) | 0 | 0 | 0 |
| Overtime | (282) | (538) | (440) | (440) | (440) |
| Education | (210) | (822) | (1,069) | (1,997) | (2,720) |
| Public Health Corps | 0 | 0 | (13) | (49) | (49) |
| Public Assistance | 0 | (225) | (225) | (225) | 0 |
| Rental Assistance | 0 | (392) | (392) | (392) | (392) |
| Payroll Mobility Tax | 0 | (65) | (69) | (72) | (73) |
| Contributions to MTA | 25 | (298) | (442) | (450) | (497) |
| Prevailing Wage for Shelter Security Guards | 0 | (55) | (55) | (55) | (55) |
| Foster Care Reimbursement Rate | 0 | (118) | (118) | (118) | (118) |
| Variable Rate Debt Service Savings | 40 | 0 | 0 | 0 | 0 |
| Court Appointed Counsel | 0 | (42) | (42) | (42) | (42) |
| Minimum Wage Increase | 0 | (8) | (21) | (30) | (38) |
| State Intercept of ACA eFMAP Savings | 0 | (129) | (214) | (343) | (343) |
| PHE eFMAP Savings | 285 | 48 | 0 | 0 | 0 |
| City Settlements | 0 | (157) | 0 | 0 | 0 |
| Total Expenditures | $583 | ($2,594) | ($3,100) | ($4,214) | ($4,767) |
| Comptroller’s (Risks)/Offsets | $1,685 | ($2,138) | ($2,251) | ($3,097) | ($3,399) |
| Restated (Gap)/Surplus | $1,685 | ($2,138) | ($6,447) | ($9,049) | ($10,376) |
| Asylum-Seeker Re-estimate | |||||
| Projected Risk | $0 | ($1,150) | ($2,940) | ($3,650) | ($3,650) |
| Restated (Gap)/Surplus w/ Asylum-Seeker Re-estimate | $1,685 | ($3,288) | ($9,387) | ($12,699) | ($14,026) |
SOURCE: Office of the New York City Comptroller
NOTE: Numbers may not add to totals due to rounding.
Revenue
The Comptroller’s Office anticipates tax and miscellaneous revenues will come in higher than the City’s projections in each year of the Plan – by $1.10 billion in FY 2023, $455 million in FY 2024, $849 million in FY 2025, $1.12 billion in FY 2026, and $1.37 billion in FY 2027.
Most of this difference come from higher tax revenue forecasts in each year of the Plan. In FY 2023 the Comptroller’s Office projects $1.19 billion in additional taxes compared with the City, nearly half of which comes from higher forecast personal income tax/pass-through entity tax projections. The difference between the Comptroller’s Office’s and the City’s total tax forecast shrinks in FY 2024 to $388 million before growing to $784 million in FY 2025, $1.07 billion in FY 2026, and $1.33 billion in FY 2027.
Miscellaneous revenues show a slight risk in FY 2023 due to the possible non-payment from the City’s vendor for bus shelter advertising. In all other years of the Plan, the Comptroller’s Office estimates Miscellaneous revenues will come in higher than in OMB’s assumptions, due to higher forecasts of interest rates and fines.
Expenditures
The Comptroller’s Office estimates expenditures will be higher than those reflected in the April Plan in each year, except for FY 2023. In FY 2023, expenditures are anticipated to total $583 million less than projected by the City. In FY 2024, however, the Comptroller’s Office projects net expenditure risks of $2.59 billion, which grow to $4.77 billion in FY 2027. These risks, however, do not include the Comptroller’s estimate of greater-than-budgeted costs to provide services to people seeking asylum.
While the City has increased budgeted expenditures for services to people seeking asylum in the April Plan for FY 2023 through FY 2025, these funds may not be sufficient given both the growth in their population and the costs incurred thus far by the City to provide these services. In addition, the Comptroller’s Office anticipates that the City may not receive a substantial portion of the planned reimbursement from the Federal government ($400 million of $600 million in Federal funding budgeted in FY 2024) and the State government (all of the $290 million currently budgeted in FY 2025)—meaning those expenses would have to be paid with City funding. Lastly, the April Plan does not include funds for services to this population in FY 2026 and FY 2027. Together, these factors could lead to additional expenditure risks of $1.15 billion in FY 2024, $2.94 billion in FY 2025, and $3.65 billion in FYs 2026-2027. With these costs included, expenditure risks would total $3.29 billion in FY 2024 growing to $8.42 billion in FY 2027. (See the City Services for People Seeking Asylum section for more details on the calculation of these estimates.)
The Department of Education (DOE) poses the largest set of risks over the plan period. The Comptroller’s Office estimates DOE expenditures will be $210 million above what the City has budgeted for FY 2023, growing to $2.72 billion in FY 2027. These risks include the exhaustion of Federal COVID stimulus funding for programs that are expected to continue past their expiration (fiscal cliffs associated with Summer Rising, Special Education Pre-K Expansion, Universal 3-K, and Community Schools), as well the chronic underbudgeting for special education Carter Cases, pupil transportation, and charter schools. This includes the impact of the Enacted New York State Budget’s reauthorization of 14 “zombie” charter schools to replace those that closed or never opened. In addition, the April Plan does not include funding to address the State’s mandate to reduce class sizes, which will begin to be phased in the next school year. See the Department of Education section for a further discussion of these risks.
The City’s underbudgeting of ongoing support for the Metropolitan Transportation Authority (MTA) also poses a major risk. As part of the Enacted State Budget, the City’s contribution of MTA paratransit expenses increased from 50 percent to 80 percent for the next two years (with a limit of a $165 million increase in subsidy each year). However, the April Plan did not include enough funding to cover even the 50 percent cost. The City’s budgeted amounts for the operating subsidies to the MTA Bus Company and Staten Island Railway are also underestimated. The chronic underbudgeting for these subsidies, plus the increased cost for Paratransit due to the State budget action leads to a risk of $298 million in FY 2024, growing to $497 million in FY 2027 for the City’s contributions to the MTA. See the Metropolitan Transportation Authority section for a further discussion of these items.
Additional risks that result from changes made in the State budget, released after the April Plan, include the State intercepting Enhanced Federal Medical Assistance Percentage (eFMAP) funds historically passed on to localities to pay for services, as well as an increase in the Payroll Mobility Tax that the City must pay for its employees. See the Enacted State Budget section for a further discussion of these items.
Other risks include additional funding necessary to cover foster care reimbursement costs as mandated by the State— an $118 million ongoing cost that is only reflected in FY 2023 in the April Plan. The Comptroller includes this cost as a risk in FY 2024 through FY 2027. Similarly, while funding has been added to cover the growing cost of the City’s rental assistance programs in FY 2023, these increases have not been carried through the rest of the Plan period, resulting in risks of $392 million in FY 2024 forward. The City also continues to underbudget for overtime costs, which presents risks of $282 million in FY 2024 (of which $139 million in uniformed overtime), growing to $538 million in FY 2025 ($376 million in uniformed overtime) and $440 million in FY 2026-FY 2027 ($322 million in uniformed overtime).
In addition, the Comptroller’s Office has included estimates of settlement costs for two class action lawsuits against the Department of Correction in its risks. In 2022, the City reached a settlement in the Lynch class action case on behalf of former detainees whose releases had been delayed for hours or days after they made bail. Based on the number of claimants thus far, the Comptroller’s Office estimates a $82 million risk in FY 2024. In addition, the Comptroller’s Office includes a $75 million risk in FY 2024 for the Onaida class action case, which concerns the Department of Correction’s extended detention of inmates subject to ICE detainers beyond their scheduled release date.
One area where the Comptroller’s Office forecasts lower than City-budgeted expenditures is for non-overtime personnel costs. Due to lower-than-expected headcount, personnel costs are expected to total $725 million less than budgeted by the City in FY 2023 and $362 million in FY 2024.
Revenue Analysis
Tax Revenues
The Mayor’s April 2023 Plan revises expected local tax revenues upward by $2.1 billion in the current fiscal year (FY 2023) compared to the January 2023 Plan. This revision reflects FY 2023 collections that have significantly exceeded OMB’s prior published forecasts and include upward revisions to personal income tax (up $657 million, inclusive of PTET), sales tax ($331 million), business income taxes ($350 million), and property tax (up $155 million). Also increasing the total was a $479 million upward revision to City audits, which surged in January with a likely one-time occurrence yielding nearly $500 million in banking corporation tax.
Table 10 shows FY 2023 collections though March and compares these to the forecast full year revenues in the Mayor’s Executive Plan. Despite the large upward revision, the Mayor’s Plan still expects substantially lower revenue for the balance of this year than was collected during the same months in the prior fiscal year, down 40 percent. One significant reason for this decline is the introduction of the pass-through entity tax (PTET) for NYC during FY 2023, which is discussed below. While our estimates agree that net collections will fall during the rest of FY 2023—relative to FY 2022 and relative to the earlier part of this fiscal year—the Comptroller estimates about half as large a decline as the Mayor for remainder of the fiscal year.
Table 10. FY 2023 Projections in the Mayor’s April 2023 Plan
| Collected FY to-date through Mar. 2023 | FY 2023 to-date growth versus prior year | Forecast Full FY 2023 growth versus prior year | Forecast Remainder FY 2023 growth versus prior year | |||
|---|---|---|---|---|---|---|
| ($ in millions) | Mayor | Comptroller | Mayor | Comptroller | ||
| Total | $61,209 | 11% | 0% | 4% | (40%) | (23%) |
| Property tax | 30,807 | 8% | 6% | 7% | (35%) | (11%) |
| Non-Property Taxes | 30,402 | 12% | (1%) | 2% | (29%) | (21%) |
| Personal Income Tax* | 12,762 | 21% | (5%) | (1%) | (49%) | (39%) |
| Business Income Tax | 5,728 | 0% | (5%) | (1%) | (15%) | (4%) |
| Sales Tax | 7,075 | 15% | 11% | 12% | 0% | 3% |
| Real Estate Transaction Taxes | 1,722 | (29%) | (33%) | (31%) | (44%) | (39%) |
| All Other | 2,045 | 21% | 23% | 18% | 30% | 12% |
| NYC DOF Audits | 1,069 | 111% | 41% | 53% | (62%) | (32%) |
SOURCE: Office of the New York City Comptroller, Mayor’s Office of Management and Budget
* Includes Pass-Through Entity Tax (PTET)
Preliminary data are available for April 2023 tax collections, which are shown in Table 11.
Table 11. Tax Revenue Collections FY 2023 To-Date
| FY through March 2023 ($ in millions) | April 2023 (Preliminary) ($ in millions) | FY through April 2023 (Preliminary) ($ in millions) | FY 2022 Through April ($ in millions) | Difference ($ in millions) | Growth | |
| Total | $61,209 | $4,770 | $65,980 | $62,394 | $3,585 | 6% |
| Property Tax | 30,807 | 731 | 31,538 | 29,560 | 1,978 | 7% |
| Non-Property Taxes | 30,402 | 4,040 | 34,442 | 32,834 | 1,607 | 5% |
| Personal Income Tax* |
12,762 | 2,128 | 14,890 | 14,569 | 322 | 2% |
| Business Income Tax |
5,728 | 928 | 6,656 | 6,601 | 55 | 1% |
| Sales Tax | 7,075 | 704 | 7,779 | 6,836 | 944 | 14% |
| Real Estate Transaction Taxes | 1,722 | 138 | 1,861 | 2,645 | (785) | (30%) |
| All Other | 2,045 | 70 | 2,116 | 1,608 | 508 | 32% |
| NYC DOF Audits | 1,069 | 71 | 1,140 | 576 | 564 | 98% |
SOURCE: New York State Department of Taxation and Finance, Mayor’s Office of Management and Budget, Office of the New York City Comptroller
* Includes Pass-Through Entity Tax (PTET)
Table 12 shows the risks (subtractions) and offsets (additions) that relate our revenue forecast to the Mayor’s April Executive Plan. Table 13 compares growth rates for the taxes and Table 14 compares the levels of forecast tax revenue.
Table 12. Tax Revenues Risks and Offsets
| ($ in millions) | FY 2023 | FY 2024 | FY 2025 | FY 2026 | FY 2027 |
| Property Tax | $90 | ($24) | $513 | $663 | $1,384 |
| PIT/PTET | 590 | 410 | 124 | 99 | (245) |
| Business Taxes | 297 | (359) | (451) | (188) | (49) |
| Sales Tax | 71 | 235 | 151 | 60 | (9) |
| Real Estate-Related | 43 | (45) | 228 | 188 | 3 |
| Other | (1) | (8) | 40 | 67 | 70 |
| Audits | 100 | 179 | 179 | 179 | 179 |
| Total | $1,191 | $388 | $784 | $1,068 | $1,333 |
SOURCE: Office of the New York City Comptroller
Table 13. Comparison of Tax Revenue Projections: Growth Rates
| FY 2023 | FY 2024 | FY 2025 | FY 2026 | FY 2027 | FYs 2023 – 2027 Average Annual Growth | |
|---|---|---|---|---|---|---|
| Property | ||||||
| Comptroller | 7.0% | 2.3% | 1.5% | 1.3% | 4.0% | 2.3% |
| Mayor | 6.7% | 2.6% | (0.1%) | 0.8% | 1.9% | 1.3% |
| PIT/PTET | ||||||
| Comptroller | (1.0%) | (5.3%) | 3.8% | 3.5% | 4.1% | 1.5% |
| Mayor | (4.5%) | (4.4%) | 5.8% | 3.7% | 6.2% | 2.7% |
| Business | ||||||
| Comptroller | (1.1%) | (9.5%) | (0.9%) | 3.3% | 3.2% | (1.1%) |
| Mayor | (4.7%) | (1.5%) | 0.3% | (0.2%) | 1.3% | 0.0% |
| Sales | ||||||
| Comptroller | 11.6% | 5.0% | 4.6% | 4.7% | 3.5% | 4.4% |
| Mayor | 10.7% | 3.3% | 5.6% | 5.7% | 4.1% | 4.7% |
| Real Estate-Related | ||||||
| Comptroller | (31.4%) | (3.2%) | 21.0% | 3.1% | (0.5%) | 4.7% |
| Mayor | (32.7%) | 0.7% | 8.2% | 5.1% | 6.9% | 5.2% |
| All Other | ||||||
| Comptroller | 17.8% | 6.2% | 4.8% | 3.5% | 2.8% | 4.3% |
| Mayor | 17.8% | 6.5% | 3.2% | 2.7% | 2.8% | 3.8% |
| Audits | ||||||
| Comptroller | 53.1% | (30.8%) | 0.0% | 0.0% | 0.0% | (8.8%) |
| Mayor | 41.3% | (39.9%) | 0.0% | 0.0% | 0.0% | (12.0%) |
| Total Tax | ||||||
| Comptroller | 3.9% | (1.0%) | 2.9% | 2.6% | 3.6% | 2.0% |
| Mayor | 2.1% | 0.1% | 2.4% | 2.2% | 3.3% | 2.0% |
SOURCE: Office of the New York City Comptroller, Mayor’s Office of Management and Budget
Table 14. Comparison of Tax Revenue Projections: Levels
| ($ in millions) | FY 2023 | FY 2024 | FY 2025 | FY 2026 | FY 2027 | |
| Property Tax | Comptroller | $31,660 | $32,382 | $32,879 | $33,296 | $34,622 |
| Mayor | 31,570 | 32,405 | 32,366 | 32,633 | 33,238 | |
| PIT/PTET | Comptroller | 16,531 | 15,653 | 16,249 | 16,821 | 17,511 |
| Mayor | 15,941 | 15,243 | 16,125 | 16,722 | 17,756 | |
| Business Taxes | Comptroller | 8,137 | 7,361 | 7,294 | 7,538 | 7,777 |
| Mayor | 7,840 | 7,720 | 7,745 | 7,726 | 7,826 | |
| Sales Taxes | Comptroller | 9,533 | 10,007 | 10,471 | 10,965 | 11,343 |
| Mayor | 9,462 | 9,772 | 10,320 | 10,905 | 11,352 | |
| Real Estate-Related | Comptroller | 2,223 | 2,151 | 2,603 | 2,684 | 2,670 |
| Mayor | 2,180 | 2,196 | 2,375 | 2,496 | 2,667 | |
| Other | Comptroller | 2,894 | 3,074 | 3,222 | 3,336 | 3,431 |
| Mayor | 2,895 | 3,082 | 3,182 | 3,269 | 3,361 | |
| Audits | Comptroller | 1,300 | 900 | 900 | 900 | 900 |
| Mayor | 1,200 | 721 | 721 | 721 | 721 | |
| Total | Comptroller | $72,278 | $71,528 | $73,618 | $75,540 | $78,255 |
| Mayor | $71,088 | $71,139 | $72,834 | $74,472 | $76,921 |
SOURCE: Office of the New York City Comptroller, Mayor’s Office of Management and Budget
Property Tax
The Comptroller projects that property tax revenue for FY 2023 will total $31.7 billion, an increase of $67.7 million since our March forecast, primarily due to positive adjustments in the allowance for abatements and restoration of some exempted properties into the tax roll.
The Comptroller projects FY 2024 property tax revenue of $32.4 billion, an increase of 2.3 percent from the current fiscal year as assessments continue to recover from the reductions in the FY 2022 assessment roll. Revenue growth is projected to slow, growing at an average annual rate of only 2.2 percent through 2027, when property tax collections are expected to reach $34.6 billion.
The Comptroller’s property tax forecast exceeds OMB’s by $90.1 million in 2023, ($23.5) million in 2024, $513.1 million in 2025, $662.5 million in 2026 and $1.4 billion in 2027. For 2023 and 2024, the difference between the Comptroller’s and OMB’s revenue forecasts are due to the forecast of the reserve components of the property tax: cancellations, refunds, delinquencies, etc. The differences in 2025 and beyond are primarily the result of the Comptroller’s higher levy growth forecast compared to OMB’s: 2.2 percent versus 1.0 percent from 2024 to 2027.
Personal Income Tax
The Comptroller forecasts that the combined sum of collections for personal income tax (PIT) and the closely related pass-through entity tax (PTET) will be $16.5 billion in FY 2023, a decline of about 1.0 percent from FY 2022. This forecast is $1.1 billion higher than in March, reflecting non-withheld collections in the intervening months that have greatly exceeded expectations. Our new forecast is also $590 million above OMB’s most recent forecast despite OMB’s upward revision of $657 million in the April Plan.
The introduction of a pass-through entity tax (PTET) for NYC tax has disrupted the usual PIT collection patterns in FY 2023 and made it more difficult both for forecasters to anticipate collections and for the State income tax collectors to properly allocate income tax payments to the City. PTET allows partnerships and S-corporations, which ordinarily pass-through all their income pre-tax to partners and shareholders, to first pay NYC (and NYS) PTET as an entity. When subsequently filing, owners claim tax credits for these taxes already paid on their individual income tax returns. Although designed to be revenue neutral, the timing of payments and credits for the PTET’s first tax year (2022) are not in sync. Extra revenue arrived earlier in large end-of-year payments in 2022 and additional smaller but substantial payments were made through March 2023. The offsetting credits for these payments show up mostly in April as diminished final return payments, smaller estimated payments made with extensions, and larger refunds.
In January, OMB estimated that total PIT/PTET collections in the month of April would total $1.0 billion. In their April Plan, they revised this expectation up to $1.5 billion, with much of the change coming from a lowering of their refund estimate for the month. By the end of April, actual collections for the month were $2.1 billion. The biggest surprises relative to the OMB January Plan expectations were: (i) April estimated payments—over 90 percent of which were extension payments—coming in nearly $300 million above anticipated; (ii) return payments, which were up more than $165 million over forecast; (iii) refunds, almost $200 million lower than expected; and (iv) Over $400 million more in City/State offset payments, which are adjustments based on tax returns that correct for prior misallocation of income tax receipts between the State and the City.
Information on 2022 PIT liability, which will help to explain the sources of this extra revenue, will not be available until next year. Table 15 is an attempt to take a first look at some of the more volatile non-withheld income tax components using currently available information on PIT and PTET. The data show that even with unexpectedly high April collections, there has been a 20.0 percent decline in non-withheld collections in FY 2023 through April. This is likely due to lower income realized from capital gains during the equity market downturn in 2022 versus the bull market of 2021.
Table 15. Selected Personal Income Tax Components in FY 2022 and FY 2023
| ($ in millions) | FY 2022 | FY2023 | % Change |
| PTET tax year 2022* | $0 | $1,877 | N/A |
| PIT estimated and extension payments through April** | 4,200 | 1,895 | (54.9%) |
| PIT returns Jan-April | 637 | $389 | (39.0%) |
| PIT State/City offsets Jan-April | 750 | $641 | (14.5%) |
| PIT refunds Jan-April*** | (739) | (924) | 25.0% |
| Total | $4,848 | $3,878 | (20.0%) |
* Collections through March excluding $288.5 million in March payments attributed to 2023 liability.
** Excludes first quarterly installment payments made in April.
*** Excludes $250 million EITC increase in FY 2023.
The table excludes returns, refunds, and State/City offsets collected in the first half of each fiscal year to avoid distortions from the outsized payments in October 2022 (which belong to the 2021 tax year). State/City offsets stem from revisions to the allocation of income tax liability between the State and the City.
SOURCE: Mayor’s Office of Management and Budget, New York State Department of Taxation and Finance, Office of the New York City Comptroller
In FY 2024, the Comptroller forecasts growth in combined PIT and PTET receipts to fall by a further 5.3 percent from this year’s level. Income taxes in New York City are highly sensitive to the volatile fluctuations in aggregate incomes of high earners and investors, as well as the profits of financial and other corporations. The Comptroller’s Office’s economic outlook forecasts declining employment in the high-wage securities and information technology sectors. Wall Street profits fell by more than 50 percent in 2022, and the Comptroller’s Office expects them to fall again this year by 9 percent with the high interest rate environment making it unlikely that the industry will move back towards the extraordinary profits of 2021. OMB forecasts a slightly smaller percentage drop from FY 2023 to FY 2024 (4.4 percent), but the FY 2024 PIT/PTET levels are still $410 million below the Comptroller’s Office forecast because of their lower starting point.
Migration Trends
The IRS recently released county-to-county migration data for 2020-2021, which contain total incoming and outgoing federal Adjusted Gross Income (AGI). The 2020-2021 data are counts of filers that have been linked longitudinally in tax returns for 2019 income and 2020 income. Filers are allocated to an origin county (where 2019 taxes were filed) and a destination county (where 2020 taxes were filed). The data also report 2020 AGI by origin-destination pair.[6] It should be noted that changing the address from where tax returns are filed does not necessarily imply the absence of taxable income in the origin county, nor does it necessarily imply that the filer changed domicile.
Table 16 reports IRS data from 2011-2012 to 2020-2021. Before 2020, the highest net outflow was reported for 2017 (77,050 returns), before the cap on State and Local Tax deductions (discussed briefly below) came into effect. Net outflows increased substantially during the COVID-19 pandemic (at the time 2019 and 2020 tax returns were filed), with the AGI difference between incoming and outgoing returns increasing to 5.4 percent and 6.5 percent of total AGI. Average outgoing AGI jumped in 2020 and 2021, consistent with the geographical distribution of USPS change of address requests and the concentration of remote work among high earners.
Table 16. IRS Estimates of Net Domestic Migration
| Year | Net balance | AGI difference | Average AGI ($000s) | |||
|---|---|---|---|---|---|---|
| Filers | Individuals | in billions | % of total AGI | Incoming | Outgoing | |
| 2012 | (21,131) | (65,427) | ($2.7) | (1%) | $67.5 | $76.5 |
| 2013 | (29,276) | (83,243) | ($4.2) | (1.5%) | $80.7 | $93.5 |
| 2014 | (31,099) | (85,659) | ($4.0) | (1.3%) | $77.5 | $89.1 |
| 2015 | (18,890) | (61,841) | ($3.7) | (1.2%) | $73.5 | $94.0 |
| 2016 | (43,091) | (113,449) | ($5.1) | (1.5%) | $93.3 | $100.5 |
| 2017 | (77,050) | (182,469) | ($8.5) | (2.4%) | $88.8 | $96.8 |
| 2018 | (53,418) | (131,180) | ($7.1) | (2.1%) | $92.9 | $105.7 |
| 2019 | (47,831) | (121,567) | ($6.7) | (1.8%) | $91.3 | $105.7 |
| 2020 | (114,282) | (229,982) | ($21.3) | (5.4%) | $86.9 | $138.9 |
| 2021 | (124,952) | (238,115) | ($24.4) | (6.5%) | $99.1 | $151.6 |
Source: IRS migration and county data, Office of the New York City Comptroller
NOTE: AGI difference is based on federal tax returns filed at the new address (e.g., in the 2021 row, this is 2020 AGI). Total AGI is the AGI from federal returns filed in NYC the previous year (e.g., in the 2021 row, this equals the 2020 AGI difference divided by total 2019 AGI). Average AGI is AGI divided by the number of incoming returns (e.g., tax year 2020 returns filed in NYC in 2021 by those who filed 2019 returns elsewhere in the US) or outgoing returns (e.g., 2021 returns filed outside of NYC by those who filed 2019 returns in NYC). The count of individuals is derived from the number of dependents in the tax return.
More recent State-level tax data from the NYS Department of Taxation and Finance, also indicates a significant increase in the rate of outmigration among high-income households in tax years 2020 and 2021. Among those with AGI of $25 million or above, the relocation rate was above 8 percent in 2021, up from around 2.5 percent before the COVID-19 pandemic in 2019. Despite the stronger migration flows, NYC AGI increased in both tax years 2020 and 2021, with the gains disproportionally concentrated among households with AGI of $25 million and above.
Business Income Taxes
Business income tax collections have also substantially outpaced prior projections. Corporation tax collections (excluding audits) of $4.7 billion through April are more than $400 million above OMB’s forecast in January, and unincorporated business taxes collections (excluding audits) are $100 million above expectations. In its April Plan, OMB has revised its business tax forecast for FY 2023 up by $350 million. Even with the OMB revision, the Comptroller estimates nearly $300 million in additional business tax revenue above the OMB estimate—in part because the latest OMB estimate has not caught up with current collections known to this point, and in part because the Comptroller expects stronger economic growth in the near term than does OMB.
Table 17 shows how both business and personal income tax collections in FY 2023 through April account for most of the difference in the FY 2023 revenue forecasts of the Comptroller and OMB.
Table 17. FY 2023 Income Taxes: Collections vs. OMB Forecasts
| Variance relative to January forecast | April forecast revisions | Variance minus revisions | |||
|---|---|---|---|---|---|
| in millions | Through March | April | Total | ||
| PIT | $77 | $1,134 | $1,211 | $65 | $1,146 |
| PTET | 397 | (44) | 353 | 592 | (239) |
| Total PIT + PTET | $475 | $1,090 | $1,565 | $657 | $908 |
| Corporation taxes | 83 | 334 | 417 | 181 | 236 |
| UBT | 57 | 51 | 103 | 169 | -66 |
| Business income taxes | 140 | 385 | 520 | 350 | 170 |
| Total income taxes | $615 | $1,475 | $2,090 | $1,007 | $1,083 |
SOURCE: New York City Department of Finance, Office of the New York City Comptroller
NOTE: Numbers may not tie due to rounding.
Sales Tax
Sales tax received by the City in FY 2023 through April totaled $7.8 billion, an increase of nearly 15 percent above the same point of the prior fiscal year. This rise has come from multiple factors including the nationwide strength in consumer spending and the recovery of NYC business districts that cater to rising numbers of commuters, tourists, and New Yorkers’ shopping and leisure activities. As mentioned in the economic summary above, taxable sales data indicate a narrowing of the gap created at the beginning of the pandemic between sales in New York City and those in its suburbs. As an ad valorem tax, NYC sales tax receipts were also increased by price inflation in the NYC area that has averaged 5.8 percent year-over-year for the duration of this fiscal year so far.
In its April Plan, OMB increased its FY 2023 forecast by $331 million, to $9.46 billion or 10.7 percent above the FY 2022 level. The Comptroller’s Office forecast a similar but slightly higher sales tax total of $9.53 billion for the fiscal year. In FY 2024, the difference between sales tax forecasts widens: the Comptroller’s Office expects that receipts will grow by 5.0 percent while OMB anticipates an increase of only 3.3 percent. The difference between the forecasts is explained by the somewhat more optimistic view of economic growth and consumer spending in this year and next, as compared to OMB’s. In later years, the gap between forecasts narrows.
Other Taxes
Real estate transaction taxes are collected by the City based on the sales of real property—real property transfer tax (RPTT); and fees imposed on all mortgages of real property recorded with the NYC Register’s Office or with the Richmond County Clerk—mortgage recording tax (MRT). The Comptroller ‘s Office forecasts that total revenue for the two transaction taxes will be $2.2 billion in FY 2023 ($74.0 million upward revision from the March forecast), a 31.4 percent decrease from FY 2022 total collections. As of April 2023, calendar year total collections have been $1.8 billion. Although the pace of collections has slowed down since January 2023, RPTT it is expected to pick up during the last two months of the fiscal year as the spring/summer buying season is underway. The Comptroller’s Office’s FY 2023 forecast exceeds OMB’s forecast by $43.0 million, ($45.0) million in FY 2024, $228.0 million in FY 2025, $188.0 million in FY 2026 and $3.0 million in FY 2027. As described in the Comments on the Preliminary Budget, the elevated interest rate environment due to the Federal Reserve tightening will continue to have an impact on the real estate market, especially on commercial real estate.
In all other taxes, the Comptroller’s Office’s forecast exceeds OMB’s by $40 million in FY 2025, growing to $70 million in FY 2027.
The Comptroller’s Office has long held that the financial plans underestimate the amount of City tax audits. Audits for the City averaged about $1.0 billion dollars from FY 2018 to FY 2022. The April Plan holds the amount at $1.2 billion in FY 2023, which was revised up by $479 million from the January Plan, and $721.0 million in each following year. Year-to-date through April 2023 the City has collected $1.1 billion and the Comptroller assumes the total will grow to $1.3 billion by the fiscal year’s end (audit collections in July and August are accrued to the previous fiscal year). The City should be able to collect $900 million in tax audits in each year of the Plan.
Risks to the Tax Revenues Forecast
Economic uncertainty in the U.S. and worldwide present risks to the tax revenues forecast for New York City. Both OMB and the Comptroller’s Office assume that the U.S. economy will continue to grow moderately in 2023 and 2024 even while contractionary monetary policy by the Fed is expected to push price inflation downward towards its long-run target near 2 percent. Many economic forecasters doubt that such a “soft landing” will occur and believe that a recession is likely to begin as early as this year. Several components of City tax revenues are directly related to NYC economic conditions that would be adversely affected by national and, to a lesser extent, international economic downturns. These include the individual and business income tax bases, which depend on NYC employment and wage growth, business profits (especially in the financial sector), and the performance of financial investments. Also affected are the sales tax and hotel tax bases, which are influenced by local consumer and business spending as well as by domestic and international tourism.
Locally, real estate market valuations and sale volumes have an immediate impact on transaction taxes and pose potential longer-run risks to property tax liabilities. There may be significant further adjustment ahead before reaching a post-pandemic steady state for commercial real estate. Long-lasting, elevated vacancy rates and depressed market price valuations would reduce City revenues both directly and indirectly through their impact on the broader local economy.
If the current liquidity crises in select banking institutions lead to broader credit contraction, this could also curtail business expansion—an important source of City revenue through income and employment growth. It could also severely limit real estate transactions and suppress real estate market values, both of which have a direct impact on City revenues and would have spillover effects throughout the revenue bases.
Miscellaneous Revenues
In the April Plan, the City raised its FY 2023 miscellaneous revenue projection by a net $120 million, to $5.89 billion, a 15.9 percent increase over the previous year. The bulk of the revision reflects higher projections for interest income and revenue from fines, offset by a downward adjustment to charges for services to reflect reduced student enrollment at the City’s community colleges. Table 18 shows the changes in the FY 2023 miscellaneous revenue projections since the January Plan.[7]
Table 18. Changes in FY 2023 Miscellaneous Revenue Estimates, April 2023 Plan vs. January 2023 Plan
| ($ in millions) | April | January | Change |
| Licenses, Permits & Franchises | $753 | $751 | $2 |
| Interest Income | 385 | 325 | 60 |
| Charges for Services | 878 | 1,004 | (126) |
| Water and Sewer Charges | 1,826 | 1,817 | 9 |
| Rental Income | 255 | 255 | 0 |
| Fines and Forfeitures | 1,428 | 1,273 | 155 |
| Other Miscellaneous | 365 | 345 | 20 |
| Total | $5,890 | $5,770 | $120 |
SOURCE: Office of the New York City Comptroller, Mayor’s Office of Management and Budget
The largest adjustment to the FY 2023 miscellaneous revenue projection was an increase of $155 million in fines to account for higher than previously estimated collections. Most of the increase ($100 million) reflects higher collections from parking fines, followed by a $48.6 million increase in camera fines, including an additional $25.1 million from speed camera fines, $16 million from bus lane cameras, and a $7.5 million increase from red light camera fines. Revenues from late penalties related to the filling of Real Property Income and Expense statements (RPIE) increased by $5 million.
The April Plan reduced estimated charges for services by a net $126 million. This was mainly due to a downward adjustment in projected revenues from CUNY’s tuition and fees, totaling $141 million to reflect reduced student enrollment. This was partially offset by increases in the 2 percent fire insurance fees ($8.5 million), Affordable NY Housing Program fees ($6 million), building inspection ($5.2 million), and other fees.
Projected interest income, which the City earns by investing funds from diverse sources, increased by $60 million to $385 million in FY 2023—the second upward adjustment since the April 2022 Plan. The latest projection reflects increases in short-term interest rates and greater than anticipated cash balances.
Revenue projection for “other miscellaneous,” which comprises mainly non-recurring revenues, increased by $20 million. This includes $5.6 million in refunds from City’s subcontractors, $5.4 million in additional in-rem negotiated sales, $4.3 million in asset sales and other revenues, and $3.5 million in union contribution.
Total miscellaneous revenue projections for FY 2024 and the outyears of the plan were also increased by $183 million in FY 2024, $156 million in FY 2025, $157 million in FY 2026, and $139 million in FY 2027. Excluding increased revenue projections from water and sewer charges, which are reimbursements from the New York City Water Board for the operation and maintenance of the water delivery and sewer system, the re-estimates are mainly driven by higher projections for fine revenues, interest income, and license, franchise and permits. The bulk of these revenue increases are included in the City’s PEG program for FY 2024 and the outyears. Total revenue PEGs in the miscellaneous budget total $84 million in FY 2024, $77 million in FY 2025, $79 million in FY 2026, and $76 million in FY 2027.
Table 19 shows the City’s April Plan projections for all categories of miscellaneous revenues. After increasing 15.9 percent in FY 2023 to $5.89 billion, the City expects total miscellaneous revenues to drop slightly to $5.80 billion in FY 2024 due mainly to a projected decline in fine revenues, and range from $5.53 billion to $5.63 billion annually in FYs 2025-2027.
Table 19. Miscellaneous Revenue Forecast, April 2023 Plan
| ($ in millions) | FY 2023 | FY 2024 | FY 2025 | FY 2026 | FY 2027 |
| Licenses, Permits & Franchises | $753 | $694 | $705 | $712 | $693 |
| Interest Income | 385 | 436 | 318 | 237 | 225 |
| Charges for Services | 878 | 1,021 | 1,025 | 1,028 | 1,029 |
| Water and Sewer Charges | 1,826 | 1,842 | 1,815 | 1,813 | 1,806 |
| Rental Income | 255 | 257 | 260 | 258 | 258 |
| Fines and Forfeitures | 1,428 | 1,178 | 1,174 | 1,182 | 1,182 |
| Other Miscellaneous | 365 | 369 | 340 | 343 | 339 |
| Total | $5,890 | $5,797 | $5,637 | $5,573 | $5,532 |
SOURCE: Office of the New York City Comptroller
Based on the City’s April Plan and current collections, the Comptroller’s Office expects total miscellaneous revenue will be below the City’s forecast by $88.5 million in FY 2023 and above the City’s forecasts by $67 million in FY 2024, $65 million in FY 2025, $49 million in FY 2026, and $34 million in FY 2027.
As discussed in the Annual Report on the State of the City’s Economy and Finances published in December 2022, JCDecaux, the franchisee for the City’s Coordinate Street Furniture Franchise, interrupted minimum guaranteed payments to the City in FY 2022. On May 11, the City Council resolved to extend the agreement for 5 years (for a total of 25 years), and increase the number of bus stop shelters (up to 360 additional) and automatic public toilets (up to 40 additional) installed, maintained, and operated by JCDecaux. This preludes the submission of a new contract for approval by the Franchise and Concession Review Committee (FCRC). It is expected that the additional allowed street furniture, if placed in high-revenue corridors, will increase the franchisee’s revenues. Because the new contractual terms are unknown, the Comptroller maintains a $108 million revenue risk to FY 2023 revenues, which represents the cumulative minimum guaranteed payment arrears to the end of the fiscal year.
While the April Plan raised projected fine revenues by $155 million in FY 2023 and about $60 million in the outyears, the Comptroller anticipates revenues from fines could be above the City’s forecast by $19.5 million in FY 2023, $12 million annually in FYs 2024-2026, and $6 million in FY 2027. These offsets are mainly attributable to higher projections for parking and camera fines. In addition, based on current short-term interest rates and the Comptroller’s cash balance forecast, the Office projects interest income will be above the City’s current projections by $55 million in FY 2024, $53 million in FY 2025, $37 million in FY 2026 and $28 million in FY 2027.
Federal and State Aid
The April 2023 Financial Plan projects total Federal and State aid of $30.13 billion (including unrestricted aid) in FY 2023, supporting nearly 28 percent of the City’s expenditure budget. Compared with the January Plan, the City has reflected a net boost of $398 million in the current year comprised of a $658 million decline in Federal aid and $1.06 billion increase in State grants. Beyond FY 2023, the April Plan shows increases of $1.56 billion in FY 2024, $286 million in FY 2025, and roughly $120 million annually in FY 2026 and FY 2027.
The changes in the April Plan mainly stem from the timing and revisions of Federal and State assistance for the reimbursement of costs related to services provided to people seeking asylum in the City. Under Federal grants, the Plan shows a decline of $1 billion in FY 2023 and an increase of $600 million in FY 2024, resulting in a net reduction of $400 million for this area. Meanwhile, the City recognizes new State support of $438 million in FY 2023 and $562 million in FY 2024; the Enacted State Budget included 29 percent reimbursement of shelter costs up to $1 billion. Going forward, the Plan reflects additional State funding of $290 million in FY 2025, representing the 29 percent State share for expected spending of $1 billion for costs related to people seeking asylum, although this funding was not included in the Enacted State Budget. No further estimates of State or Federal aid for these costs, or the costs themselves, have been included in the April Plan for FY 2026 and FY 2027.
As shown in Table 20, revisions in the April Plan have raised total Federal COVID assistance anticipated by the City to $7.62 billion in FY 2023-FY 2027, reflecting a modest increase of $58 million since the January Plan. The City reapportioned some of the remaining $2.02 billion in American Rescue Plan-State and Local Fiscal Recovery Funds (ARP SLFRF) in the April Plan. Compared to previous allocations, the April Plan reduced the use of ARP SLFRF funds by $102 million in FY 2023 and $131 million in FY 2025, and correspondingly increased assumptions by $233 million in FY 2024 with zero net impact on expected grants.
Overall, the largest component of Federal COVID relief in the Plan is $3.99 billion in combined American Rescue Plan-Coronavirus Response and Relief Supplemental Appropriation (ARP-CRRSA) education funding for the DOE budget, followed by the $2.02 billion in ARP-SLFRF and $771 million in FEMA grants (including unrestricted aid) currently reflected in the April Plan. These three funding categories constitute nearly 90 percent of the Federal COVID assistance assumed in the Plan. Combined with grants recognized in FY 2020 through FY 2022 that totaled about $18.91 billion, overall COVID assistance is currently expected to reach $26.53 billion.
Table 20. Projected Federal COVID Assistance, April 2023 Plan
| ($ in millions) | FY 2023 | FY 2024 | FY 2025 | FY 2026 | FY 2027 | Total |
| ARP SLFRF | $508.7 | $806.7 | $703.1 | $0.0 | $0.0 | $2,018.4 |
| ARP-CRRSA Education | 1,991.3 | 1,747.9 | 245.8 | 0.0 | 0.0 | 3,985.1 |
| FEMA | 515.1 | 2.0 | 1.0 | 1.0 | 0.0 | 519.1 |
| Epidemiology and Laboratory Capacity Grants | 293.9 | 11.4 | 0.1 | 0.0 | 0.0 | 305.4 |
| All Other | 375.2 | 85.0 | 52.9 | 19.8 | 9.9 | 542.8 |
| Subtotal | $3,684.2 | $2,653.0 | $1,003.0 | $20.8 | $9.9 | $7,370.8 |
| Unrestricted Aid-FEMA | 251.6 | 0 | 0 | 0 | 0 | 251.6 |
| Subtotal | $251.6 | $0 | $0 | $0 | $0 | $251.6 |
| Grand Total | $3,935.8 | $2,653.0 | $1,003.0 | $20.8 | $9.9 | $7,622.4 |
SOURCE: Mayor’s Office of Management and Budget
Federal and State grants are projected to fall sequentially in the outyears to $27.97 billion in FY 2024 and $25.60 billion in FY 2025 before settling at about $24.4 billion annually in FY 2026 and FY 2027. This trend essentially mirrors the decline in Federal COVID grants in the outyears and the absence of budgeted assistance for costs to provide services to people seeking asylum beyond FY 2025. The only major category expected to show growth over the next four years is State education aid, which is projected to grow modestly from $12.60 billion in the current year to $12.89 billion by FY 2025 and remain flat thereafter.
Enacted State Budget
The $229 billion State budget was passed by the legislature on May 2nd, more than a month overdue and about one week after the City’s April Plan was released. Major items impacting the City included the increase and indexation of the minimum wage, bail reform rollbacks that give judges more discretion, additional MTA funding (and costs), aid for services for people seeking asylum, the reauthorization of 14 additional charter schools in New York City, out of state tuition increases for SUNY and CUNY, and a natural gas ban for new construction starting in 2026.[8] The Governor’s ambitious plan to create 800,000 units of housing across the State over the next decade was not included in the final budget.
With the exception of the $1 billion in aid to help cover the cost of stays of people seeking asylum in the City shelters over FY 2023 and FY 2024, State budget impacts in Table 21 below are not reflected in the City’s Financial Plan. The City Services for People Seeking Asylum section of this report provides more detail on this aid to the City.
In addition to this shelter aid, positive budget impacts are in formula-based school aid adds of $337 million in FY 2024 (the Department of Education section of this report provides more detail).
Negative impacts include the State’s intercept of the City’s Federal eFMAP Medicaid funding. These funds are provided by the Federal government based on proportionate shares paid into Medicaid and historically passed on to localities to pay for services. Under the Enacted Budget, the State will capture 25 percent of the funding in State FY 2024, 50 percent in State FY 2025, and the entirety of the funds thereafter. OMB estimates this shift will cost New York City $129 million in FY 2024, $214 million in FY 2025, and $343 million in FY 2026 and 2027 once the entirety of the funding passes through to the State.
Table 21. Impact of Enacted FY 2024 State Budget
| ($ in millions) | FY 2023 | FY 2024 | Total Two-Year Impact |
| Formula-Based School Aid | $0 | $337 | $337 |
| Other Positive Spending Impacts | $438 | $562 | $1,000 |
| State support for asylum-seeker shelter and HERRC costs | 438 | 562 | 1,000 |
| Negative Spending Impacts | ($0) | ($409) | ($409) |
| ACA eFMAP to offset growth financed by State | 0 | (129) | (129) |
| Increase NYC Share of MTA Paratransit to 80% of net | 0 | (165) | (165) |
| Increased PMT/MCTMT taxes associated with City workforce and contract staff | 0 | (65) | (65) |
| 18-B Rate increase for Indigent Legal Services | 0 | (42) | (42) |
| Minimum wage increase | 0 | (8) | (8) |
| Total Net Impact | $438 | $490 | $928 |
SOURCE: New York State Division of Budget, Mayor’s Office of Management and Budget, Office of the New York City Comptroller
The budget also includes additional City contributions to the MTA of $230 million in FY 2024 and FY 2025 and $65 million each year thereafter, down from the Governor’s proposal of over $500 million per year. The City’s share of paratransit costs will rise from 50 percent to 80 percent net expenses in FY 2024 and FY 2025 (capped at 50 percent of the net cost plus $165 million), costing the City $165 million in those years. The Metropolitan Commuter Transportation Mobility Tax (MCTMT) rate increase from 0.34 to 0.60 percent will cost the City $65 million a year starting in FY 2024. (The Metropolitan Transportation Authority section has more details on City-related MTA costs.)
State-mandated minimum wage increases from $15 to $17, which are being phased in from January 2024 to January 2026, are expected to have a small cost impact on the City’s budget ($8.5 million in FY 2024) for uncovered categories of employees, as the City’s collective bargaining pattern includes a raise that surpasses the State’s provisions. Increased rates of reimbursement for court-appointed counsel (from $78 to $158 per hour) are expected to increase City costs by $42 million per fiscal year from FY 2024 onward.
Longer-term items include a provision to open 14 charter schools in the city – OMB estimates that this will cost the City $24 million in FY 2025 and will rise to $175 million per fiscal year when all 14 charter schools open.
The budget also included landmark climate policies: a ban on natural gas hookups in new construction, a cap-and-invest program to impose a cap that shrinks lower greenhouse gas emissions over time, and the Build Public Renewables Act enabling the New York Power Authority to pursue renewable energy initiatives. The Waste Reduction and Recycling Infrastructure Act that would have mandated that producers of packaging and paper products bear responsibility for disposal was not included in the final budget. The act was estimated to save the City $50 million by FY 2028 and $100 million in FY 2029 and out.
Expenditures Analysis
The April Plan as presented by the Mayor reflects $108.91 billion in spending in FY 2023 and $106.69 billion in FY 2024. The Plan grows to $115.61 billion in FY 2027. Both FY 2023 and FY 2024 expenditures reflect prior year pre-payments, which artificially lower expenditures by $3.08 billion and $3.04 billion, respectively. Excluding these adjustments and budgeted reserves, FY 2023 planned expenditures total $111.94 billion, dropping to $108.27 billion in FY 2024 before increasing to $108.60 billion in FY 2025, $110.69 billion in FY 2026, and $114.16 billion in FY 2027.
The net decrease of $3.67 billion from FY 2023 to FY 2024 in the Plan is largely attributable to a continued reduction in COVID-related expenses, as well as budgeted declines due to the PEG program, as well as underbudgeting in areas such as rental assistance, cash assistance, and education. These declines are partially offset by growth in personnel expenditures, which increase by 14 percent over the life of the Plan to cover collective bargaining increases, health insurance premium costs, as well as pension and other fringe benefits changes.
Table 22. FY 2023 – FY 2027 Expenditure Growth Adjusted for Prepayments and Reserves
| ($ in millions) | FY 2023 | FY 2024 | FY 2025 | FY 2026 | FY 2027 | Growth FYs 23-27 | Annual Growth |
| Personal Service | |||||||
| Salaries and Wages | $33,068 | $32,301 | $33,424 | $34,717 | $35,924 | 8.6% | 2.1% |
| Pensions | 9,301 | 9,522 | 10,303 | 10,765 | 10,948 | 17.7% | 4.2% |
| Health Insurance | 7,699 | 8,531 | 9,234 | 9,835 | 10,289 | 33.6% | 7.5% |
| Other Fringe Benefits | 4,579 | 4,685 | 4,835 | 4,992 | 5,154 | 12.5% | 3.0% |
| Subtotal-PS | $54,649 | $55,039 | $57,797 | $60,310 | $62,315 | 14.0% | 3.3% |
| Other Than Personal Service | |||||||
| Medicaid | $6,297 | $6,651 | $6,385 | $6,385 | $6,535 | 3.8% | 0.9% |
| Public Assistance | 1,970 | 1,650 | 1,650 | 1,650 | 2,000 | 1.5% | 0.4% |
| Judgments and Claims | 1,199 | 1,165 | 877 | 823 | 840 | (29.9%) | (8.5%) |
| Contractual Services | 24,584 | 21,531 | 19,999 | 19,019 | 19,005 | (22.7%) | (6.2%) |
| Other OTPS | 15,696 | 14,422 | 13,628 | 13,469 | 13,740 | (12.5%) | (3.3%) |
| Subtotal-OTPS | $49,746 | $45,419 | $42,539 | $41,347 | $42,120 | (15.3%) | (4.1%) |
| Debt Service | $7,544 | $7,815 | $8,266 | $9,034 | $9,725 | 28.9% | 6.6% |
| Expenditures Excluding Reserves Only | $111,938 | $108,274 | $108,602 | $110,691 | $114,160 | 2.0% | 0.5% |
| Prior Year Adjustment | (3,079) | (3,035) | |||||
| General Reserve | 50 | 1,200 | 1,200 | 1,200 | 1,200 | ||
| Capital Stabilization Reserve | 250 | 250 | 250 | 250 | |||
| Total Expenditures | $108,909 | $106,689 | $110,052 | $112,141 | $115,610 |
SOURCE: Office of the New York City Comptroller, Mayor’s Office of Management and Budget
NOTE: Intra-City adjustments are reflected in each of their respective expense categories.
Headcount
As documented in Title Vacant,[9] the City currently has a high number of vacant positions – the result of a decline in the number of municipal employees since the start of the COVID pandemic. Since taking office, the Adams Administration has begun to reduce these budgeted but vacant positions through its savings programs. Chart 8 shows a historical perspective of budgeted versus actual full-time headcount. It compares April Plan headcounts, Adopted Budget headcounts, and actual headcounts dating back to FY 2017. The April Plan can reflect an adjustment upward or downward from Adoption for the current fiscal year in response to actuals.
Chart 8. Historical Full-Time Headcount Plans vs. Actuals, FY 2017 – FY 2023
SOURCE: Office of the New York City Comptroller, Mayor’s Office of Management and Budget
The number of actual and budgeted City employees had been growing since the start of the de Blasio Administration until the onset of the COVID pandemic in early 2020. Both actual and budgeted headcount fell in FY 2021. Bolstered by the receipt of Federal COVID aid, the City increased budgeted headcount above pre-pandemic levels for FY 2022, including positions added for the expansion of 3-K and DOE mental health programs. However, actual staffing levels continued to fall, increasing the number of vacant positions.
At present, the April 2023 Plan forecasts citywide full-time headcount for June 30th, the current fiscal year-end, at 303,593 employees. As of February 2023, the most recent data available, there were 280,674 full-time employees, still well-below the budgeted headcount by historical standards. Looking to the outyears, planned full-time headcount, as shown in Table 23, is expected to decline over the Plan period by about 2 percent, from 303,593 in FY 2023 to 298,046 in FY 2027, but at levels still well above the city’s current actual full-time headcount. While uniformed headcount is projected to remain flat throughout the Plan, both pedagogical and civilian headcount levels are expected to decline.
Because it is unlikely that FY 2023 headcount levels will reach budgeted amounts by the end of the fiscal year or in early FY 2024, the Comptroller’s Offices estimates that personnel costs will be $725 million less than budgeted by the City in FY 2023 and $362 million in FY 2024.
Table 23. Total Funded Full-Time Year-End Headcount, April 2023 Financial Plan
| FY 2023 | FY 2024 | FY 2025 | FY 2026 | FY 2027 | % Change FY 2023 – FY 2027 |
|
| Pedagogical | ||||||
| Dept. of Education | 126,895 | 126,075 | 125,186 | 123,367 | 123,367 | (2.8%) |
| City University | 4,293 | 4,289 | 4,289 | 4289 | 4,289 | (0.1%) |
| Subtotal | 131,188 | 130,364 | 129,475 | 127,656 | 127,656 | (2.7%) |
| Uniformed | ||||||
| Police | 35,030 | 35,001 | 35,001 | 35,001 | 35,001 | (0.1%) |
| Fire | 10,954 | 10,954 | 10,954 | 10,954 | 10,954 | 0.0% |
| Correction | 7,060 | 7,060 | 7,060 | 7,060 | 7,060 | 0.0% |
| Sanitation | 7,639 | 7,878 | 7,914 | 7,916 | 7,916 | 3.6% |
| Subtotal | 60,683 | 60,893 | 60,929 | 60,931 | 60,931 | 0.4% |
| Civilian | ||||||
| Dept. of Education | 13,109 | 13,117 | 13,110 | 12,563 | 12,563 | (4.2%) |
| City University | 1,746 | 1,735 | 1,735 | 1,735 | 1,735 | (0.6%) |
| Police | 14,845 | 14,502 | 14,502 | 14,502 | 14,502 | (2.3%) |
| Fire | 6,453 | 6,375 | 6,366 | 6,366 | 6,366 | (1.3%) |
| Correction | 1,731 | 1,730 | 1,730 | 1,726 | 1,726 | (0.3%) |
| Sanitation | 1,907 | 1,938 | 1,938 | 1,938 | 1,938 | 1.6% |
| Admin. for Children’s Services | 7,079 | 7,079 | 7,079 | 7,079 | 7,079 | 0.0% |
| Social Services | 12,486 | 12,132 | 12,003 | 11,990 | 11,990 | (4.0%) |
| Homeless Services | 1,952 | 1,923 | 1,908 | 1,890 | 1,890 | (3.2%) |
| Health and Mental Hygiene | 5,989 | 5,815 | 5,594 | 5,548 | 5,548 | (7.4%) |
| Finance | 1,897 | 1,878 | 1,878 | 1,878 | 1,878 | (1.0%) |
| Transportation | 5,681 | 5,768 | 5,838 | 5,841 | 5,841 | 2.8% |
| Parks and Recreation | 4,663 | 4,698 | 4,701 | 4,701 | 4,701 | 0.8% |
| All Other Civilians | 32,184 | 32,039 | 31,695 | 31,706 | 31,702 | (1.5%) |
| Subtotal | 111,722 | 110,729 | 110,077 | 109,463 | 109,459 | (2.0%) |
| TOTAL | 303,593 | 301,986 | 300,481 | 298,050 | 298,046 | (1.8%) |
SOURCE: Office of the New York City Comptroller, Mayor’s Office of Management and Budget
Compared to the January Plan, planned full-time headcount increased somewhat, as shown in Table 24, although it remains below the number reflected in the Adopted Budget. This reflects the partial restoration of vacancy reductions in DSS, HPD, Department of Finance, and additional Traffic Enforcement Agents in NYPD in FY 2023 only. There are also one-time increases in FY 2024 for the Campaign Finance Board and Federally funded Office of Emergency Management positions. The remaining increases stem primarily from baseline increases at DSNY for the Organics Program, the Parks department, for an Arborist Apprenticeship Program, a Trail Formalization Program, Tree Risk Management, and the NYC SPARX Program. Other headcount increases include FDNY for the B-HEARD Mental Health Response Program, City Council staffing, and DoHMH for various health and mental health initiatives.
Table 24. Full-Time Headcount Changes, January 2023 Financial Plan vs. April 2023 Financial Plan
| FY 2023 | FY 2024 | FY 2025 | FY 2026 | FY 2027 | |
| Pedagogical | |||||
| Dept. of Education | 0 | 0 | 0 | 0 | 0 |
| City University | 0 | 0 | 0 | 0 | 0 |
| Subtotal | 0 | 0 | 0 | 0 | 0 |
| Uniformed | |||||
| Police | 0 | (29) | (29) | (29) | (29) |
| Fire | 0 | 0 | 0 | 0 | 0 |
| Correction | 0 | 0 | 0 | 0 | 0 |
| Sanitation | 40 | 229 | 263 | 263 | 263 |
| Subtotal | 40 | 200 | 234 | 234 | 234 |
| Civilian | |||||
| Dept. of Education | 0 | 8 | 8 | 8 | 8 |
| City University | 0 | 0 | 0 | 0 | 0 |
| Police | 165 | 0 | 0 | 0 | 0 |
| Fire | 26 | 90 | 90 | 90 | 90 |
| Correction | 0 | 0 | 0 | 0 | 0 |
| Sanitation | 0 | 36 | 36 | 36 | 36 |
| Admin. for Children’s Services |
0 | 0 | 0 | 0 | 0 |
| Social Services | 339 | 5 | 0 | 0 | 0 |
| Homeless Services | 0 | 3 | 3 | 3 | 3 |
| Health and Mental Hygiene | 191 | 211 | 80 | 41 | 41 |
| Finance | 19 | 0 | 0 | 0 | 0 |
| Transportation | 0 | 0 | 0 | 0 | 0 |
| Parks and Recreation | 2 | 112 | 112 | 112 | 112 |
| All Other Civilians | 194 | 609 | 281 | 305 | 301 |
| Subtotal | 936 | 1074 | 610 | 595 | 591 |
| Total | 976 | 1274 | 844 | 829 | 825 |
SOURCE: Office of the New York City Comptroller, Mayor’s Office of Management and Budget
Labor
The City has settled labor agreements with two major unions, District Council 37 (DC 37) and the Police Benevolent Association (PBA), representing just under one-third of City employees. The Administration began this round of collective bargaining agreements by reaching a settlement with DC 37 in February 2023 that established the pattern of wage increases for civilian employees that are now reflected in the April Plan. The agreement, which was ratified by DC 37 members, includes wage increases of 3 percent for the first four years (retroactive to FY 2021) and a 3.25 percent wage increase in the fifth year. Members will also receive a one-time ratification bonus of $3,000. The agreement includes provisions to establish an Equity Fund valued at $70 million annually to address areas with severe recruitment and retention issues and to ensure that all employees currently earning less than $18 an hour will make at least $18 an hour by July 1, 2023.
In April 2023, the City reached an agreement with the PBA providing wage increases of 28 percent over an eight-year period, August 1, 2017 to July 31, 2025. In the prior round of collective bargaining, all unions representing uniformed employees except for the PBA had settled in line with the established pattern of 7.95 percent raises over the three-year period of 2017 to 2020 (2.25 percent in year one, 2.5 in year two, and 3 percent in year three). Therefore, PBA’s recent agreement covers the three years not settled for them in the prior round (for those years, the PBA settled in line with the established pattern), as well as setting a new pattern for the following five years. The latter five years provides wage increases of 3.25 percent in each of the first two years, 3.5 percent in each of year three and four and 4 percent in year five, establishing the pattern of wage increases for uniformed employees that are now reflected in the April Plan for the current round of collective bargaining.
The City maintains a labor reserve within the Financial Plan to cover contractual wage increases for employees; after contracts are ratified, funds are transferred out of the reserve and into individual agency budgets. Previously, funds were held in the reserve to provide annual wage increases of 1.25 percent under the current round of collective bargaining. The April 2023 Plan reflects increases to the labor reserve of $2.29 billion in FY 2023, $1.68 billion in FY 2024, $3.10 billion in FY 2025, $4.02 billion in FY 2026, and $4.84 billion in FY 2027 to fund the incremental costs resulting from the pattern for wage increases established by DC 37 and the PBA for all City employees.[10]
The April Plan also reflects the transfer of funds out of the labor reserve to agency budgets to cover the costs of the DC 37 labor agreements, as well as some other costs. The fiscal year balances remaining in the labor reserve are approximately $3 billion in each of FY 2023 and FY 2024, $4.31 billion in FY 2025, $5.42 billion in FY 2026 and $6.54 billion in FY 2027.
Overtime
Overtime expenditures are budgeted at $1.94 billion in FY 2023 and $1.26 billion for FY 2024 in the April Plan. The Comptroller’s Office estimate that FY 2023 overtime spending will be even higher at $2.23 billion. This results from greater NYPD overtime usage within the City and the subway system, as well as the reliance on overtime by many agencies facing difficulties in hiring and retaining City employees. The City has implemented initiatives to address these challenges, which should result in lower overtime usage for FY 2024, although the Comptroller’s Office estimates it will still be above current budgeted amounts. The Comptroller’s Office currently projects a decline in FY 2024 overtime usage to $1.79 billion, which still exceeds the April Plan’s projections by $538 million as shown in Table 25.[11]
Table 25. Projected Overtime Spending, FY 2023 and FY 2024
| ($ in millions) | FY 2023 Adopted Budget | FY 2023 April Plan | FY 2023 Comptroller’s Projection | FY 2023 Risk | FY 2024 Executive Budget | FY 2024 Comptroller’s Projection | FY 2024 Risk |
| Uniformed | |||||||
| Police* | $372 | $598 | $725 | ($127) | $372 | $650 | ($278) |
| Fire | 252 | 421 | 421 | 0 | 251 | 275 | (24) |
| Correction | 126 | 238 | 250 | (12) | 126 | 200 | (74) |
| Sanitation | 148 | 149 | 149 | 0 | 108 | 108 | 0 |
| Total Uniformed | $898 | $1,406 | $1,545 | ($139) | $857 | $1,233 | ($376) |
| Civilian | |||||||
| Police-Civilian | $80 | $83 | $120 | ($37) | $80 | $100 | ($20) |
| Social Services | 16 | 60 | 85 | (25) | 25 | 60 | (35) |
| All Other Agencies | 306 | 394 | 475 | (81) | 293 | 400 | (107) |
| Total Civilians | $402 | $537 | $680 | ($143) | $398 | $560 | ($162) |
| Total City Risk | $1,300 | $1,943 | $2,225 | ($282) | $1,255 | $1,793 | ($538) |
SOURCE: Office of the New York City Comptroller, Mayor’s Office of Management and Budget
NOTE: *The April 2024 Plan includes $62 million in reimbursement to the City for costs associated with the Enhanced Subway Safety initiative.
Compared to the January Plan, the FY 2023 and FY 2024 budgeted amounts for overtime spending were revised upward by $341 million and $25 million, respectively. The FY 2023 increase resulted mainly from additions to the overtime budgets for NYPD and DOC uniformed employees by $223 million and $112 million, respectively, to align with year-to-date spending. The increase to the NYPD’s uniformed overtime budget included $62 million of State funding towards costs associated with the Enhanced Subway Safety initiative. Following the introduction of the Enhanced Subway Safety initiative, NYPD uniformed overtime expenses averaged $65 million monthly. However, that cost declined to an average of $55 million for March and April, bringing total overtime NYPD uniformed expenses to $582 million through April 2023. The Comptroller’s Office projects this spending to reach $725 million for FY 2023, resulting in a $127 million risk to the revised overtime NYPD budget. The Comptroller’s Office also includes a $12 million risk for DOC overtime spending thus far this year.
For FY 2024, uniformed overtime spending is expected to be higher than budgeted for NYPD, FDNY, and DOC employees. The Comptroller’s Office projects that NYPD FY 2024 overtime spending will be approximately $650 million, $278 million higher than budgeted. The April Plan includes a NYPD efficiency PEG of $4 million annually beginning in FY 2024 as a savings on overtime spending. This initiative does not impact the budgeted amounts since it is offset with an equal increase in City funds elsewhere in the NYPD budget. For a historic look at NYPD overtime spending see the report Overtime Overview.
Spending for civilian overtime was $660 million in FY 2022, up from a pre-pandemic cost of $645 millon in FY 2019. As many agencies continue to rely on overtime usage to counter vacancies, the FY 2023 civilian overtime cost is expected to be even higher at $680 million. This is particularly evident at the Department of Social Services (DSS). The department spent $85 million for overtime in FY 2022. FY 2023 expenditures through April are $72 million. This is on pace to be at least the same amount as FY 2022, and double the average annual overtime cost of $42 million between FY 2017 and FY 2021.
Contracted Temporary Services and Contracted Professional Services
City agencies often contract with outside vendors to staff and perform essential functions. These include temporary services and various professional services, including legal services, accounting services, architectural and engineering services, and other consultant services, and can be used to counter high vacancy rates in particular areas or titles, or to fill a temporary or highly specialized need. The Executive Budget forecasts $1.31 billion in spending authority in FY 2023, sharply decreasing to $849.6 million in FY 2024, and then slowly ramping down to $740.6 million in FY 2027. Historically, the City conservatively budgets these expenses in the Adopted Plan, particularly in Computer Services, Legal Services, Professional Services-Other, and Temporary Services. The City then adjusts spending throughout the fiscal year in each Plan (Table 26). Since FY 2019, agencies have consistently committed and spent upwards of $1 billion, with $1.12 billion already committed for FY 2023. It is likely that agencies will still require these services at a similar level to current spending in FY 2024, which could pose a risk of $155.1 million to the FY 2024 budget (Table 27). The City may reduce its reliance on these services if it hires up to its authorized headcount in the outyears.
Table 26. Historical Actual Commitments vs. Plan
| ($ in millions) | FY 2019 | FY 2020 | FY 2021 | FY 2022 | FY 2023 |
| Actual Commitments | $1,079.4 | $1,118.2 | $1,019.7 | $1,169.3 | $1,120.0 |
| Adopted Plan | $837.2 | $831.0 | $717.9 | $880.9 | $945.9 |
| November Plan | $1,011.5 | $1,093.6 | $939.8 | $1,202.2 | $1,167.4 |
| Preliminary Plan | $1,095.6 | $1,136.7 | $1,036.9 | $1,254.8 | $1,237.7 |
| Executive Plan | $1,163.8 | $1,210.6 | $1,110.7 | $1,253.3 | $1,306.5 |
NOTE: FY 2023 Actual Commitments are as of April 30, 2023. Planned expenditures and commitments exclude COVID-related budget codes, but are otherwise All-Funds.
SOURCE: Office of the New York City Comptroller, Mayor’s Office of Management and Budget
Table 27. Potential Risk
| ($ in millions) | FY 2024 |
| Executive Plan | $849.6 |
| Projected Commitment | $1,134.3 |
| Underbudgeting Risk-All Funds | ($284.7) |
| Underbudgeting Risk-City Funds | ($155.1) |
NOTE: FY 2024 Commitment is a projection based on the average of FY 2019 – FY 2023 historical actual commitments, including a 3 percent price increase to account for inflation.
SOURCE: Office of the New York City Comptroller, Mayor’s Office of Management and Budget
Health Insurance
Employees and retirees’ pay-as-you-go health insurance cost in the April Plan is $8.53 billion for FY 2024, $1.62 billion higher than the budgeted amount for FY 2023. The FY 2023 estimate, however, reflects a reduction of $792 million that was prepaid in FY 2022. After adjusting for this prepayment, the FY 2024 budgeted amount is $832 million higher than the FY 2023 forecast of $7.70 billion. As shown in Table 28, health insurance costs are projected to continue to increase at an average annual rate of 6.4 percent to $9.23 billion in FY 2025, $9.84 billion in FY 2026, and $10.29 billion in FY 2027.
Compared to the January 2024 Plan, the budgeted amounts for health insurance decreased by $263 million in FY 2023, $291 million in FY 2024, $330 million in FY 2025, and $340 million in each of FY 2026 and FY 2027, mainly from a realignment of funding to bring in line with historical health insurance spending for DOE employees.
Table 28. Projected Pay-As-You-Go Health Expenditures
| ($ in millions) | FY 2023 | FY 2024 | FY 2025 | FY 2026 | FY 2027 |
| Department of Education | $2,488 | $2,942 | $3,342 | $3,639 | $3,779 |
| CUNY | 139 | 128 | 140 | 140 | 153 |
| All Other | 4,280 | 5,461 | 5,752 | 6,055 | 6,358 |
| Sub-total | 6,907 | 8,531 | 9,234 | 9,835 | 10,290 |
| FY 2023 Retiree Health Prepayment | 792 | ||||
| PAYGO Health Insurance Costs | $7,699 | $8,531 | $9,234 | $9,835 | $10,290 |
SOURCE: Office of the New York City Comptroller, Mayor’s Office of Management and Budget
NOTE: All Other includes all active employees as well as retirees.
The current projections of health insurance costs reflect premium rate increases for active employees and pre-Medicare retirees of 6.0 percent in FY 2024, 5.75 percent in FY 2025, 5.5 percent in FY 2026, and 5.25 percent in FY 2027. It also includes rate increases for Senior Care, a supplement to traditional Medicare, of 4.8 percent in FY 2024, 4.7 percent in each of FYs 2025 and 2026, and 4.6 percent in FY 2027. However, with the support and approval of the Municipal Labor Committee (MLC), the City recently signed a contract with Aetna to implement an NYC Medicare Advantage Plan to replace the Senior Care program effective September 1, 2023.
The switch to NYC Medicare Advantage Plan is expected to lower the City’s health care costs by approximately $600 million annually. However, the savings will not be accrued to the General Fund and will instead be deposited into the Health Insurance Stabilization Fund.[12] Based on the projected growth in Senior Care rates, the Comptroller’s Office estimates that the City’s current projection of $600 million for Senior Care costs for FY 2023 would increase to $629 million in FY 2024, $658 million in FY 2025, $689 million in FY 2026, and $722 million in FY 2027. The City could realize potential budgetary savings of $58 million in FY 2025, $89 million in FY 2026, and $122 million in FY 2027. The City has not indicated if the amount to be transferred to the Health Insurance Stabilization Fund will be the entire savings from reduced cost or a constant $600 million annually. As part of the agreement, the City will pay for a waiver of pre-authorizations for certain procedures, estimated to cost the City approximately $45 million per year and subject to review every two years.[13]
Pensions
The April Plan projects pension expenditures of $9.52 billion in FY 2024, approximately $220 million higher than the current FY 2023 estimate of $9.30 billion. Pension contributions are projected to continue to grow to $10.30 billion in FY 2025, $10.77 billion in FY 2026, and $10.95 billion in FY 2027. When compared to the January Plan, the pension budget projections increased by $71 million in FY 2024, $632 million in FY 2025, $927 million in FY 2026, and $1.26 billion in FY 2027 as the result of transfers from the labor reserve for wage increases following the City’s labor settlements.
The pension investment earnings for FY 2023 will impact pension contributions beginning in FY 2025. Following the end of each fiscal year, the City’s Office of the Actuary measures the investment returns earned by the pension funds and compares them to the returns that would have been generated if investment earnings have equaled the Actuarial Interest Rate (AIR) assumption.[14] The Financial Plan projections assume pension investments will earn the AIR of 7 percent per year. Through March 31, 2023, audited figures indicate that pension investments have earned approximately 5 percent this fiscal year. Depending on the final fiscal year-end returns, 1 percent above or below the AIR of 7 percent will decrease or increase respectively the City’s contribution to the pension systems by approximately $50 million in FY 2025 growing to $175 million by FY 2027.
Public Assistance
Through April, the City’s public assistance caseload has averaged 446,164 recipients per month in FY 2023. Over the same July – April period in the prior year, caseload averaged only 385,323. The caseload average in the current year represents nearly a 16 percent increase over the same period in FY 2022. As shown in Chart 9, the City’s public assistance caseload has risen almost without pause since the end of the Federal Pandemic Unemployment Compensation program in September 2021, which provided supplemental unemployment benefits dating back to the initial phase of the COVID outbreak.
Chart 9. Public Assistance Caseload and Monthly Changes March 2020 – April 2023
SOURCE: New York City Department of Social Services
According to the City, between September 2021 and April 2023, there was a 79 percent increase in the average number of applicants per month compared to the final month in FY 2021. For applications received between September 2021 and August 2022, the most recent month for which complete data is available, the average monthly case acceptance rate increased to 46 percent from 35 percent in June 2021.
Though the City has not provided an update of its caseload projections, the April Plan increases the budget for baseline grants spending by $320 million to $1.8 billion in the current year.[15] However, the estimates in FY 2024 – FY 2026 remain unchanged at about $1.48 billion annually before rising to $1.83 billion in FY 2027. Given the continued surge in both caseload and grant spending in the latter months of FY 2023, if spending stabilizes at the current higher monthly rate in the $150 million range, the City will need to provide additional funding of at least $225 million annually in FY 2024 – FY 2026 to keep pace with its obligations for public assistance spending—another risk to the City’s budget.
Department of Education
The April Plan reflects a net increase of $251 million in the Department of Education (DOE) budget in the current year. For FY 2023, the DOE budget now totals $31.46 billion net of intra-City funds, a modest decline of $18 million from actual FY 2022 spending of $31.48 billion, as shown in Table 29. Compared to the January Plan, the majority of additional funding for the FY 2023 budget stems from $109 million in collective bargaining transfers mainly for the DC 37 agreement, $80 million in State aid adjustments, and $50 million in School Construction Authority revenue.
Table 29. Department of Education Funding Detail, April 2023 Plan
| ($ in millions) | FY 2023 | FY 2024 | FY 2025 | FY 2026 | FY 2027 |
| Total DOE Funding* | $31,459.8 | $30,549.3 | $30,639.0 | $30,837.8 | $31,038.2 |
| City Funds | $14,513.8 | $13,862.1 | $15,108.8 | $15,749.6 | $15,950.0 |
| State Funds | 12,610.2 | 12,703.3 | 12,895.3 | 12,895.3 | 12,895.3 |
| Federal Funds | 4,117.3 | 3,820.5 | 2,471.4 | 2,029.4 | 2,029.4 |
| Other Categorical Funds | 218.6 | 163.4 | 163.4 | 163.4 | 163.4 |
| April Plan Changes | $250.8 | ($177.0) | ($182.0) | ($164.5) | ($166.2) |
| Year-to-Year Changes | ($17.8) | ($910.5) | $89.7 | $198.8 | $200.4 |
SOURCE: Office of the New York City Comptroller, Mayor’s Office of Management and Budget
NOTE: *Net of intra-City funds.
The April Plan establishes net overall funding of $30.55 billion for the DOE in FY 2024, a decline of $911 million from the FY 2023 projection. Compared with the January Plan, the FY 2024 DOE Budget reflects a decline of $177 million. The Executive Budget recognizes increases of $78 million in collective bargaining transfers and $57 million in various adjustments mainly from recognition of higher energy costs. In addition, the budget also accounts for new needs of $12 million, including culinary training ($7 million), shelter-based community coordinators ($3 million), and climate education ($2 million).
These increases are more than offset by PEG reductions totaling $325 million. The latest round of DOE savings centers primarily on fringe benefits, constituting more than 90 percent or $306 million of the total assigned to the department. The City indicates that the cut would lead to a more realistic spending projection in this area based on actual spending from prior years. After these reductions, fringe benefits spending would still maintain average annual growth of nearly 6 percent throughout the Plan compared to actual spending in FY 2022. In total, the FY 2024 DOE budget has sustained $1.12 billion in PEG reductions since the June 2022 Plan.
In the outyears, the DOE budget is projected to range between $30.64 billion to $31.04 billion. Over this period, Federal stimulus funding under ARP-CRRSA education grants will continue to wind down, falling from $1.75 billion in FY 2024 to $246 million in FY 2025, before expiring in FY 2026. The reduced Federal support is offset mainly by a higher level of City funds in the Plan, rising more than $2 billion between FY 2024 and FY 2027, while State support is expected to grow by only about $200 million between FY 2024 and FY 2025 and then stay flat thereafter.
Moreover, the April Plan has not yet captured education aid increases from the recently enacted State budget that occurred after the release of the City’s budget. Compared with April Plan estimates, the Enacted State Budget would provide about $337 million more in formula-based aids in FY 2024. The main component of the increase is Foundation Aid, which comes in at $274 million higher than the City’s current projection for FY 2024. Other notable variances include greater-than-expected transportation aid of $99 million and a net lower-than-anticipated special education excess cost aids of $33 million. In addition, the State has also approved the re-issuance of 14 charter school slots to replace schools that have either ceased or never started their operations in the City. The City indicates the fully phased-in costs for the 14 re-authorized charter schools could reach $175 million annually.
Similar to the January Plan assessment, a wide range of risks to the DOE budget remain in place in the current plan, shown in Table 30. The City indicates that unless the State provides dedicated funding for future charter school tuition rate increases, shortfalls could materialize at $47 million in FY 2024, $133 million in FY 2025, $361 million in FY 2026, and $600 million in FY 2027. These estimates include the phased-in costs, within the April Plan period, of the aforementioned 14 reauthorized charter schools enacted by the State. In addition, the City has underfunded special education Carter Cases spending in each year of the Plan, which nearly tripled over the past six years.[16] In order to maintain baseline funding similar to the FY 2022 spending level of $918 million, the City will need to increase Carter Cases funding by $210 million in FY 2023 and $475 million annually in FY 2024 – FY 2027. Also, the DOE has likely underbudgeted pupil transportation costs in the outyears that could require additional City funding of $75 million to $225 million in each of FY 2024 – FY 2027.
Table 30. Projected Education-Related Risks in the April 2023 Financial Plan
$ in millions. Negative numbers indicate risks to the Financial Plan and increase the gap.
| FY 2023 | FY 2024 | FY 2025 | FY 2026 | FY 2027 | |
| Charter School Tuition | $0 | ($47) | ($133) | ($361) | ($600) |
| Carter Cases | (210) | (475) | (475) | (475) | (475) |
| Pupil Transportation | 0 | (75) | (125) | (175) | (225) |
| Class Size Reduction Mandate | 0 | 0 | 0 | (433) | (867) |
| 3K Expansion | 0 | 0 | 0 | (93) | (93) |
| Special Ed Pre-K Expansion | 0 | 0 | (47) | (95) | (95) |
| DOE Mental Health Services | 0 | 0 | (37) | (86) | (86) |
| Community Schools Expansion and Sustainability | 0 | 0 | (27) | (54) | (54) |
| Summer Rising | 0 | (176) | (176) | (176) | (176) |
| DOE Contracted Nursing | 0 | (49) | (49) | (49) | (49) |
| Total Education-Related Risks | ($210) | ($822) | ($1,069) | ($1,997) | ($2,720) |
SOURCE: Office of the New York City Comptroller
NOTE: Numbers may not add to totals due to rounding.
The Department could also face risks for various core instructional and support initiatives upon the expiration of Federal COVID grants. Chief among these are the underfunding of 3K programmatic costs by $93 million annually in FY 2026 and FY 2027, and the respective needs of $176 million and $49 million for the continuation of Summer Rising and school nursing each year beginning in FY 2024. The City would also need to provide additional funding of $111 million in FY 2025 and $235 million annually in FY 2026 and FY 2027 as ongoing support for special education pre-kindergarten expansion, mental health, and community schools programs unless these initiatives are phased out.
In addition, the April Plan does not include funding to address the State’s mandate to further narrow class size caps. The approved legislation would begin imposing the stricter class size limits, designated for New York City only, in the next school year. Under the plan, the City will need to phase in the reductions over a five-year period and achieve full compliance by September 2028. The DOE estimates that, once fully phased-in, the new mandate could lead to additional costs of $1.3 billion annually, requiring $433 million in FY 2026 and $867 million in FY 2027.
City Services for People Seeking Asylum
New York City has experienced a sudden and significant rise in the arrivals of people seeking asylum. Since April 2022, the City has reported that more than 67,000 such individuals have gone through the New York City emergency shelter system, with 42,400 in the City’s care as of May 17th. The need to provide shelter, healthcare, education and childcare, and other essential services has been immediate, creating an unforeseen budgeting and programmatic challenge for the City, particularly the provision of shelter. Long-term, individuals and families seeking asylum face additional needs including immigration services, work authorizations, employment services and sustainable, affordable housing.
The City first responded by expanding shelters through Department of Homeless Services (DHS) emergency contracts. Then, in October 2022, the Mayor issued an emergency authorization designating NYC Health and Hospitals (H+H) to operationalize Humanitarian Emergency Response and Relief Centers (HERRCs). The HERRCs are largely hotels but have sometimes been located in non-traditional spaces, such as the Brooklyn Cruise Terminal, and parking lots on Randall’s Island and Orchard Beach. They were intended to be short-term and serve as the first point of contact as people arrived in the City, offering services and settlement options.
Given the lack of viable affordable housing alternatives, HERRCs are now providing longer-term shelter while DHS continues to open emergency shelters as the population continues to increase. As of May 14th, there were approximately 140 emergency DHS shelters for people seeking asylum, compared with 57 shelters open on November 2, 2022. The chart below shows the total number of emergency DHS shelters and HERRCs that the City has opened since November 2022, when this information first became available.
Chart 10. Number of DHS Shelters and HERRCs
SOURCE: New York City Mayor’s Office.
NOTE: A new HERRC, the Roosevelt Hotel, opened on May 19th and is not included in this chart.
Budget Impacts Included in the April Plan
Table 31. Funding for Costs of Services to People Seeking Asylum, April 2023 Plan
| ($ in millions) | FY 2023 | FY 2024 | FY 2025 | Total |
| City | 962 | 1,738 | 710 | 3,410 |
| State | 438 | 562 | 290 | 1,290 |
| Federal | – | 600 | – | 600 |
| Total | $1,400 | $2,900 | $1,000 | $5,300 |
SOURCE: Mayor’s Office of Management and Budget
The April Plan reflects increased estimates of the cost of services for people seeking asylum compared with prior financial plans as the population continues to increase. These updated estimates total $1.40 billion in costs in FY 2023, $2.90 billion in FY 2024, and $1 billion in FY 2025, with the overwhelming majority of funds in each year budgeted for shelter costs. No funds were included for FY 2026 or beyond. Prior to the release of the April Plan, the City had budgeted $1 billion, in FY 2023 only, for services related to people seeking asylum—all of which it assumed would be reimbursed by the Federal government. In addition to increasing the total budget, the April Plan also reflects changes in funding of these costs.
As shown in Table 31, the City now expects to pay the lion’s share of these costs in each year ($962 million in FY 2023, $1.74 billion in FY 2024, and $710 million in FY 2025). The New York State Enacted Budget provides a maximum of $1 billion to New York City for aid to reimburse 29 percent of shelter expenditures for this population from April 2022 through April 1, 2024.[17] The City has budgeted $438 million of this State funding in FY 2023, and $562 million in FY 2024. The State Budget does not indicate any funding continuing into FY 2025, but the City has included $290 million in the Plan as a continuation of the 29 percent shelter cost share.
In terms of Federal funding, the City now only anticipates $600 million, all of which is budgeted in FY 2024. This support is expected under the Federal omnibus appropriations bill that was passed in late 2022 and included $800 million in nationwide aid to cities for reimbursement of costs related to providing services to people seeking asylum. On May 5th, the City announced it was awarded only $30.5 million from its initial $350 million application for this funding. The Federal government has reported that this award was part of a first tranche focused mostly on border communities, and that interior cities such as New York can expect to see more in the next round of funding. However, this relatively small award suggests that the City’s final allocation will not total the $600 million currently budgeted.
Apart from these funds, the City reported receiving $8 million in December for costs related to people seeking asylum through the Federal Emergency Management Agency’s (FEMA’s) Emergency Food and Shelter Grant program, and a further $2 million was obtained from Senator Schumer.[18]
Comptroller’s Office Estimates of Alterative Scenarios
The rate of people seeking asylum entering New York City has been unpredictable since the population first began arriving. This uncertainty continues, particularly following the expiration of Title 42 – a Trump-era policy that limited immigration into the U.S. due to the COVID public health emergency— which ended on May 11th, just over a week prior to the release of this report. Based on the rate of arrivals through April 30th, the Comptroller’s Office has estimated several possible scenarios for the growth of this population in the City’s shelter systems (DHS and HERRCs), as well as the corresponding costs for those scenarios.
The chart below shows the growth of the number of individuals who are seeking asylum that are in emergency shelters since the start of FY 2023 (July 1, 2022) through May 3rd, 2023. DHS shelters have absorbed nearly all recent growth, and the HERRC population has remained relatively flat, although a new HERRC opened on May 19th at the Roosevelt Hotel and is serving as an arrival center offering legal and medical services, placement, and shelter.
Chart 11. Shelter Census, Individuals Seeking Asylum
SOURCE: New York City Mayor’s Office
The Comptroller’s Office receives regular information on the total number of individuals seeking asylum (adults and children) that are in City shelters (DHS and HERRCs). In order to calculate cost, however, the Office had to estimate the number of households in shelter, which is how the cost of shelter is calculated.[19],[20]
Based on the Comptroller’s Office estimates of household size, the average daily growth rate over the first 10 months of FY 2023 was 51 households per day. To project low, medium, and high scenarios for growth in the household population for the remainder of FY 2023 and FY 2024 the Comptroller’s Office used the 25th percentile (38 households per day), 50th percentile or median (51 households per day), and 75th percentile (64 households per day) of daily household growth in FY 2023, respectively. Chart 12 shows estimates based on these assumptions for population growth, based on household size through April 30, 2023 and compares these values to the Administration’s latest growth rate estimate of 40 households per day continuing through FY 2024 on which their budgeted costs are based.
Chart 12. Shelter Projections, Households Seeking Asylum
SOURCE: New York City Mayor’s Office, Mayor’s Office of Management and Budget, Office of the New York City Comptroller
COST
In addition to the shelter population, the cost of the provision of shelter depends upon the average per diem (daily) shelter costs for emergency shelter. Shelter per diem costs include expenses for food, shelter security services, laundry, data processing, and other supplies and services offered by the City through contracts with non-profit providers.
According to OMB, the average per diem rate for shelters serving people seeking asylum for FY 2023 (through March 2023) is $385, based on current expenditures and households served. OMB assumes a slightly lower, $380 average, per diem for the entire fiscal year, and an even lower per diem rate of $320 for FY 2024. (The Comptroller’s Offices relies on OMB estimates of these costs, as delays in updating financial systems to reflect the latest spending and contracting make it difficult to reconstruct the per diem figures that OMB has reported.)
While the Administration is anticipating it can negotiate new contracts at lower rates, it is possible, even likely, that new contracts will be more expensive as vendors and space become scarcer and emergency sites in untraditional spaces need to be constructed. Furthermore, because the FY 2024 budget is based on an overall average for these shelters, the reduction from $385 to $320 implies that all new shelters must be negotiated at significantly lower rates to offset the current more expensive shelters. (A list of known contracts is available for download).[21]
Table 32 shows a matrix of possible FY 2024 costs based on the Comptroller’s Office’s low, medium, and high projections of shelter growth, as well as low, medium, and high estimates of the daily shelter costs. The high per diem shelter estimate is the average daily cost reported thus far for FY 2023. OMB’s projected per diem for FY 2024 represents the low per diem rate, and the Comptroller’s Offices uses a per diem of $353, the average of the high and low daily cost as a hypothetical middle point.
Table 32. Matrix of Possible Costs for Shelter & Services to People Seeking Asylum, FY 2024
| Comptroller’s Office Projected Shelter Per Diems | ||||
|---|---|---|---|---|
| Low | Medium | High | ||
| $320 | $353 | $385 | ||
| Comptroller’s Office Projected Daily Growth (HH Per Day) | 38 | $2.92B | $3.22B | $3.52B |
| 51 | $3.31B | $3.65B | $3.98B | |
| 64 | $3.68B | $4.06B | $4.43B | |
| OMB 40 | $2.9B | |||
SOURCE: Office of the New York City Comptroller
NOTE: According to OMB, the FY 2024 cost of services for people seeking asylum of $2.9 billion assumes shelter census growth of 40 households per day at a per diem rate of $320.
Based on these variables the Comptroller’s Office estimates that FY 2024 shelter costs for this population could range from $2.92 billion to $4.43 billion. For its risk calculation, the Office uses the mid-range estimate of $3.65 billion for FY 2024, and then extends this expectation to the outyears with the acknowledgement that little is known for how these costs and the services required could change in those years.
The Comptroller’s Office expense estimate is $750 million more than is currently budgeted in FY 2024 and $2.65 billion more than budgeted for FY 2025. As described above, the Comptroller’s Office also assumes some of the State and Federal funding currently budgeted is a risk. This includes $400 million of the $600 million funds currently expected in FY 2024 from Washington and the total $270 million in State funds budgeted for FY 2025 that were not included in the State budget. If these State and Federal funds do not come in as currently budgeted by OMB, the Comptroller’s Office estimates that the total City-funded cost for FY 2024 would be $2.88 billion in FY 2024, and $3.65 in the outyears. Taking into account the City funds already budgeted for these years brings the City-funded risk to $1.15 billion and $2.94 billion for FY 2025. Because the Financial Plan does not include any funds in FY 2026 and FY 2027, the City risk is the total $3.65 billion in those years.
Table 33. Asylum Seeker Risks to the Financial Plan Into the Outyears
| ($ in millions) | FY 2023 | FY 2024 | FY 2025 | FY 2026 | FY 2027 |
| Federal Assistance | $0 | ($400) | $0 | $0 | $0 |
| State Assistance | $0 | $0 | ($290) | $0 | $0 |
| Asylum Seeker Expenses | $0 | ($750) | ($2,650) | ($3,650) | (3,650) |
| Estimated Risk | $0 | ($1,150) | ($2,940) | ($3,650) | ($3,650) |
SOURCE: Office of the New York City Comptroller
Uncertainty Moving Forward
The number of migrants seeking asylum in New York will continue to fluctuate based on situations in origin countries and U.S. Federal policy, including Title 42’s replacement. Currently, OMB has not included in their projection an estimate for how the number of people seeking asylum will change following the expiration of Title 42. How this will play out exactly remains to be seen, although from May 10th to May 17th the City has welcomed 4,900 individuals seeking asylum into the City’s care, or approximately 700 per day. Using the Comptroller’s household-size estimate, this equates to an increase of 2,085 households, or nearly 300 households per day. While the Comptroller’s Office identifies specific funding amounts for the coming years, these risks are far from certain.
Rental Assistance
Within the Department of Social Services (DSS), the Human Resources Administration (HRA) administers the majority of New York City’s rental assistance spending, with only a relatively small portion of funds allocated to rental assistance programs at DHS. HRA oversees multiple rental assistance programs, including legacy programs such as the Living in Communities program (LINC), the Special Exit and Prevention Supplement (SEPS), and the Family Eviction Prevention Supplement (CITYFEPS), which have mostly been replaced by the Fighting Homelessness and Eviction Prevention Supplement (CityFHEPS). CityFHEPS has emerged as the largest and most crucial tool that the City uses to help individuals and families find and keep housing. It now accounts for the vast majority of HRA rental assistance spending, and all of the growth.
As shown in Chart 13, the City’s budgeted spending on rental assistance grew dramatically in FY 2023. While spending has been rising steadily since FY 2017 through FY 2022—growing from $138 million to $356 million over that period—costs this year are budgeted to total nearly twice last year’s spending. The April Plan for FY 2023 includes a total of $718 million, of which $583 million is City-funded, an additional $83 million is funded by Federal COVID assistance, and other State and Federal funds are budgeted to cover the remaining $51 million. This reflects a $324 million increase over FY 2023 budget for rental assistance in the January Plan, though OMB has noted that $166 million is a temporary adjustment and will be removed at Adoption. Despite this increase for FY 2023, the April Plan budgets only $157 million for rental assistance in FY 2024 and the outyears. In FYs 2024 and 2025, this includes $97 million in City funds and $8 million in Federal COVID funds (along with some other State and Federal funding). The Federal COVID funding is zeroed then out and replaced by City funds, for a total of $106 million of City funds in FYs 2026 and 2027.
Chart 13. Human Resources Administration Rental Assistance Expenditures
SOURCE: Financial Management System
NOTE: The Planned FY 23 Budget (Current Modified) reflects a $166 million technical adjustment in City funds, which OMB expects to reduce in the Adopted Plan.
The implementation of a series of recent program reforms is the primary driver of the program’s rising costs. Expanded eligibility criteria opened up the program to certain single adult households instead of just families, reduced associated work requirements, and created an administrative path to circumvent maximum room rental rates. Household subsidy amounts for voucher holders, including tenant-friendly adjustments to utility allowances, were pegged to household size. And perhaps most critically, during FY 2022, payment standards were increased to match the rent amounts used in the Federal Section 8 voucher program. These reforms have substantially broadened the scope and expense of the CityFHEPS program by expanding the households in shelters and at-risk populations that meet eligibility requirements and making it easier for them to find apartments.
Chart 14 provides an overview of the number of households who have been successfully placed in permanent housing through the CityFHEPS program and other rental assistance programs each month from January 2017 to February 2023, with the data showing the shift to CityFHEPS and a consistent increase in the number of successful placements, particularly over the past two years. Since the start of FY 2022, single adult households have generally been the largest utilizers of new CityFHEPS vouchers.
Chart 14. HRA Voucher Program Placements, January 2017 – February 2023
SOURCE: New York City Department of Social Services
NOTE: Other City Voucher Programs include CFEPS, FHEPS A, FHEPS B, LINC and SEPS.
As noted above, overall rental assistance expenditures have grown steadily since FY 2017, rising from $138 million in FY 2017 to $356 million in FY 2022. As the program continues to successfully place people into housing, the overall number of City-paid vouchers in any given month rises. At the current pace of placements, and with new leases and renewals occurring at higher rental rates, the budget for this program will need to grow. As Chart 15 illustrates, program expenses have grown over the course of FY 2023, and they are projected to continue to grow in the final quarter as well.
Chart 15. FY 2023 Quarterly HRA Rental Assistance Expenses
SOURCE: Financial Management System
Given the significant decline in the planned budget for rental assistance after FY 2023, the Comptroller’s Office analyzed monthly spending levels and program placements to estimate the budget risk in FY 2024 and the outyears. Based on spending thus far, the total cost for FY 2023 is projected to reach $430 million. The Comptroller’s Office assumes that monthly spending will continue to grow in FY 2024, albeit at a slightly slower rate than in FY 2023 as the program adjusts to the recent changes in eligibility and payment standards. In total, the Comptroller’s Office estimates FY 2024 costs will reach $549 million, $392 million more than the current budgeted, and that all of the additional cost will be City-funded. Because the programmatic changes driving these increases are relatively recent, outyear growth is difficult to project. However, it is unlikely that costs will decline. The Comptroller’s Office thus assumes the program will require at least as much funding in FY 2025 through FY 2027, leading to $392 million risks in each of the outyears. This forecast does not include any additional expansions of the program which may be necessary to manage current shelter demand in New York City.
Metropolitan Transportation Authority
The City has budgeted approximately $1 billion in annual subsidies to the Metropolitan Transportation Authority (MTA). This includes support for such services as Access-a-Ride paratransit, the MTA Bus Company, and Staten Island Railway. These subsidies are intended to cover either a portion or all the difference between the agency’s operating expenses and its revenue from fares.
Prior to the enactment of the New York State 2023-2024 Budget, the City was mandated to cover 50 percent of the MTA’s Access-a-Ride paratransit net expenses. The City typically underbudgets this support. The New York State Enacted Budget, however, included language that now requires the City to increase its contribution to 80 percent of the paratransit costs for the next two years, with the increase in subsidy capped at $165 million for each year. Because the April Plan did not include sufficient funding for even the City’s 50 percent contribution, the Comptroller’s Office estimates risks of $248 million and $262 million in FY 2024 and FY 2025 for the paratransit subsidy, with the risk reducing to $112 million in FY 2026 and $127 million in FY 2027 when the City’s contribution is expected to return to 50 percent of net expenses.
In its current Plan, the City has also underestimated the need for operating subsidies to the MTA Bus Company and Staten Island Railway. As such, the Comptroller’s Office has included an additional risk of $49 million in FY 2024, growing to $370 million in FY 2027. Including the paratransit risk, the City’s total risk related to contributions to the MTA are $298 million in FY 2024, $442 million in FY 2025, $450 million in FY 2026, and $497 million in FY 2027.
The City also funds the MTA through its Fair Fares program. Fair Fares, administered through the Department of Social Services, provides half-priced fares for New York City Transit subways, buses, and Access-A-Ride paratransit trips for low-income New Yorkers. The program is available to 932,000 eligible New Yorkers. To date, only about 30 percent of that population has applied for the program. This City’s Financial Plan baselines $75 million annually for the cost of the program. As of the end of April, $53 million, or 71 percent of the budget, had been committed. The Comptroller’s Office estimates that by fiscal year end, expenses will reach $68 million—resulting in a potential surplus of about $7 million.
The Enacted State Budget includes an expected 4 percent fare hike for the MTA, implying full fares will increase from $2.75 to $2.86 ($1.38 to $1.43 for Fair Fares). This would increase the City’s per-ride subsidy for the Fare Fairs program. At current levels of enrollment, however, there seems to be sufficient funding in the City’s budget to cover this fare increase.
Additional proposals, particularly in combination with a rate increase, could place fiscal pressure on the Fair Fares program. City Council Speaker Adrienne Adams in her State of the City address proposed expanding eligibility to households making less than 200 percent of the Federal poverty limit (the program is now limited to those with incomes below the Federal poverty limit). Expanding eligibility and increasing participation through greater advertising and outreach would present a great public benefit to New Yorkers who rely on transit, but the City’s budget for the program would need to increase to support greater participation. According to research from the Community Service Society, if the income limit were raised to 200 percent of the poverty limit, the number of New Yorkers eligible for the program would double, and if half of those of those eligible took part in the program, the City would have to spend an additional $120 million to $150 million annually, excluding the impact of the fare increase[22]. The Comptroller’s Office intends to monitor these possible impacts in future plans.
IV. Capital Budget and Financing Program
Capital Commitment Plan, FY 2023 – FY 2027
All-Funds Commitments
The April 2023 Capital Commitment Plan for Fiscal Years 2023 – 2027 adds up to $97.93 billion in all-funds authorized commitments, a $1.39 billion (1.4 percent) increase compared to the January 2023 Capital Plan over the same fiscal years. City-funds authorized commitments make up $93.56 billion of the total authorized commitments. After adjusting for the reserve for unattained commitments, all-funds planned commitments drop to $88.86 billion, as shown in Table 34. After adjusting for the reserve for unattained commitments, the City-funds commitments drop to $84.49 billion. The April Plan in FY 2023 adds up to $18.72 billion of the all-funds authorized commitments, or 19 percent of the total planned amount. In the next four years of the Plan, authorized commitments increase to $24.30 billion in FY 2024, then decrease to $19.87 billion in FY 2025, to $17.65 billion in FY 2026, and to $17.39 billion in FY 2027, resulting in an average authorized commitment amount of $19.59 billion per year over the period, about $280 million more per year than in the January Plan.
Table 34. FY 2023–FY 2027 Capital Commitments, All-Funds
| ($ in millions) Project Category | FY 2023 – FY 2027 April 2023 Commitment Plan |
Percent of Total | Change from January 2023 Plan |
| Housing and Economic Development | $17,063 | 17.4% | $690 |
| Education and CUNY | 16,378 | 16.7% | 601 |
| Environmental Protection | 15,295 | 15.6% | (701) |
| Dept. of Transportation and Mass Transit | 14,383 | 14.7% | (498) |
| Administration of Justice | 11,461 | 11.7% | 1,490 |
| Resiliency & Energy Efficiency, Technology, and Equipment | 6,599 | 6.7% | 60 |
| Parks Department | 4,177 | 4.3% | 260 |
| Hospitals | 2,641 | 2.7% | (351) |
| Other City Operations and Facilities | 9,935 | 10.1% | (166) |
| Total Authorized Commitments | $97,931 | 100.0% | $1,386 |
| Reserve for Unattained Commitments | ($9,074) | N/A | ($267) |
| Total Net of Reserve for Unattained Commitments | $88,857 | N/A | $1,119 |
NOTE: Numbers may not add due to rounding.
SOURCE: Mayor’s Office of Management and Budget, FY 2023–FY 2027 April 2023 Capital Commitment Plan
Following a similar pattern as past plans, 64.5 percent of the Plan is in four program areas: Housing and Economic Development, Education and CUNY, Environmental Protection (DEP), and Dept. of Transportation (DOT) and Mass Transit.
The $1.39 billion net increase over FY 2023 – 2027 relative to the January Plan consists of both increases and decreases over the 39 project types. The top three commitment increases are $1.48 billion for the Department of Correction (DOC), almost exclusively for the Brooklyn Borough Based Jail project, followed by $618 million for HPD, and $314 million for the DOE. [23] The top three decreases are to sewer-related projects in the amount of $497 million, H + H-related projects in the amount of $351 million, and DOT highways and street reconstruction projects in the amount of $246 million. The remaining net increase of about $65 million is distributed across the 33 other project types.
While the April Plan reflects $97.93 billion of planned commitments over the next five years, it is very unlikely that actual commitments will come in at that level. As discussed in this Office’s Annual Report on Capital Obligations, actual commitments are often below planned amounts, resulting both in less spending and borrowing by the City.
Ten-Year Capital Strategy
The City is required under the City Charter to issue a biennial Ten-Year Capital Strategy (TYCS) every odd calendar year. The Strategy for FY 2024 – FY 2033 totals $164.78 billion—$160.64 billion in City-funds and $4.14 billion in non-City funds. This is an increase of $5.45 billion, or 3.4 percent, from the Preliminary Ten-Year Capital Strategy (PTYCS) published in January, as shown in Table 35. The April 2023 Strategy increased by $5.18 billion in City funds along with an increase of $261.7 million in non-City funds. The Strategy is supported almost exclusively by City General Obligation (GO), Transitional Finance Authority (TFA), and New York Water Finance Authority financing, with these sources accounting for 97.5 percent of the total.
The April 2023 Strategy is front-loaded with 48 percent of estimated commitments over the first four years and 58 percent over the first five. Consistent with past strategies, most of the commitments are for Education, DEP, Housing (including NYCHA), economic development, and DOT projects, which together constitute 67 percent of the Capital Strategy. The categories with the largest changes from the Preliminary Strategy in January are the Administration of Justice with an increase of $1.72 billion ($1.62 billion DOC), DOE/CUNY with an increase of $1.20 billion, and Housing with an increase of $816 million as shown in Table 35.
Table 35. Ten-Year Capital Strategy for FY 2024 ― FY 2033, April 2023 vs. January 2023 Preliminary Ten-Year Capital Strategy
| ($ in millions) | January 2023 Capital Strategy City-Funds | January 2023 Capital Strategy All-Funds | April 2023 Capital Strategy City-Funds | April 2023 Capital Strategy All-Funds | Change in City-Funds | Change in All-Funds |
| Education (DOE and CUNY) | $18,105 | $18,169 | $19,234 | $19,369 | $1,129 | $1,200 |
| Environmental Protection | 28,418 | 29,046 | 28,367 | 29,006 | (50) | (40) |
| DOT | 29,978 | 31,280 | 30,451 | 31,553 | 473 | 274 |
| Housing (HPD and NYCHA) | 22,728 | 23,048 | 23,464 | 23,864 | 736 | 816 |
| Administration of Justice | 13,358 | 13,391 | 15,034 | 15,114 | 1,676 | 1,723 |
| Hospitals (H + H) |
3,174 | 3,831 | 3,434 | 4,096 | 261 | 265 |
| Resiliency, Tech. & Equipment | 9,702 | 9,811 | 10,043 | 10,158 | 341 | 347 |
| Economic Development | 5,963 | 6,058 | 5,973 | 6,239 | 10 | 180 |
| Parks Department | 8,324 | 8,747 | 8,441 | 8,865 | 117 | 117 |
| All Other | 15,702 | 15,951 | 16,193 | 16,514 | 491 | 564 |
| Total | $155,451 | $159,332 | $160,636 | $164,778 | $5,185 | $5,446 |
SOURCE: April 2023 FY 2024 Ten-Year Capital Strategy, Fiscal Years 2024-2033, and the January 2023 Preliminary Ten-Year Capital Strategy, Fiscal Years 2024-2033
NOTE: Numbers may not add due to rounding.
Notably, over the Ten-Year Strategy period, Housing (HPD & NYCHA) averages $2.39 billion per year, below the often-cited goal of $4 billion per year. Only in FY 2024 does the City meet its $4.0 billion per year plan goal.
A Service Category View of the Strategy
Table 36 contains a matrix of 11 service categories and three life cycle classifications. These categorizations place capital projects in broad infrastructure, equipment, vehicle, land, and facility categories along with three “lifecycle” project categories: state of good repair (SOGR), which involves maintaining and repairing facilities and infrastructure, program expansion, which involves adding new or expanding current facilities and infrastructure, and programmatic replacement, which involves replacing facilities or equipment.
The top five service categories comprise just over 71 percent, or $117.7 billion, as shown on Table 36.
Table 36. FY 2024 — FY 2033 Ten-Year Capital Strategy
Major Capital Commitments by Service Category and Life-Cycle Classifications
| ($ in millions) Service Category |
State of Good Repair | Program Expansion | Programmatic Replacement | Total | Percent of Total |
| Road and Bridge Works | $29,953 | $0 | $0 | $29,953 | 18.2% |
| Public Buildings and Facilities | 14,287 | 576 | 11,290 | 26,153 | 15.9% |
| Housing | 12,543 | 11,321 | 0 | 23,864 | 14.5% |
| Educational Facilities | 14,453 | 4,844 | 3 | 19,300 | 11.7% |
| Stormwater & Wastewater Management | 1,352 | 7,982 | 9,095 | 18,428 | 11.2% |
| Equipment and Technology | 1,183 | 0 | 10,202 | 11,385 | 6.9% |
| Water Supply and Treatment | 175 | 6,483 | 3,183 | 9,842 | 6.0% |
| Parks and Open Spaces | 8,019 | 706 | 0 | 8,725 | 5.3% |
| Community Facilities | 7,951 | 126 | 192 | 8,269 | 5.0% |
| Economic Development | 0 | 6,239 | 0 | 6,239 | 3.8% |
| Mass Transit & Ferries | 0 | 0 | 2,621 | 2,621 | 1.6% |
| Total | $89,916 | $38,277 | $36,585 | $164,778 | 100.0% |
| Percent of Total | 54.6% | 23.2% | 22.2% | 100.0% |
SOURCE: April 2023 FY 2024 Ten-Year Capital Strategy, Fiscal Years 2024-2033.
NOTE: Numbers may not tie due to rounding.
All of the $29.95 billion for Road and Bridge work falls into the state of good repair category. Highlights of the Road and Bridge works category include:
- $15.02 billion for the rehabilitation and reconstruction of bridges, including $10.04 billion for bridge useful life extension projects throughout the City, and $4.98 billion for the reconstruction of bridges rated “fair.”[24]
The Public Buildings and Facilities category, which sums to $26.15 billion, includes:
- $8.40 billion of estimated commitments for new borough-based jail facilities over FY 2024 – FY 2028;[25]
- $6.55 billion for miscellaneous energy efficiency, sustainability, and retrofit projects;
- $2.71 billion for the reconstruction and renovation of court facilities;
- $1.70 billion for building systems and infrastructure projects for the Department of Correction; and
- $1.43 billion for Dept. of Sanitation garages and facilities.
The Housing category, which totals $23.9 billion, includes:
- $7.30 billion for new housing construction;
- $5.56 billion for the preservation of existing housing stock;
- $4.39 billion for low-to-moderate income public housing construction and upgrades associated with NYCHA which include roof replacements, lead abatement, elevator rehabilitation, heating component upgrades, and pest mitigation; and
- $4.02 billion for special needs housing.
The Educational Facilities category, which totals $19.30 billion, includes:
- $7.97 billion for the rehabilitation of schools’ components;
- $4.78 billion for new schools or other forms of system expansion; and
- $3.40 billion for emergency, inspection, and miscellaneous projects.
In the Stormwater and Wastewater Management category of $18.4 billion, such highlights include:
- $6.43 billion water pollution control upgrades and reconstruction;
- $3.30 billion for citywide sewer extensions to accommodate new development; and
- $3.04 billion for the replacement and/or augmentation of existing sewers citywide.
The remaining 29 percent of the Strategy is allocated among six service categories, with allocations of $11.39 billion for Equipment and Technology, $9.84 billion for Water Supply and Equipment, $8.27 billion for Community Facilities, $8.73 billion for Parks and Open Spaces, $6.24 billion for Economic Development projects, and $2.62 billion for Mass Transit.
Highlights among these six categories include:
- $3.70 billion for neighborhood parks and playground related projects;
- $2.53 billion for large, major, and regional park reconstruction projects;
- $1.59 billion for major Parks recreational projects; and
- $1.51 billion for the essential reconstruction of facilities for cultural institutions and $1.40 billion allocated to the four library systems largely for state-of-good repair work.
The Strategy is also classified by life cycles with state of good repair (SOGR) at $89.9 billion (54.6 percent), program expansion at $38.3 billion (23.2 percent), and programmatic replacement at $36.6 billion (22.2 percent) as also shown in Table 36.
An Eleven-Year View of the Commitment Plan and Strategy – FY 2023 – FY 2033
The inclusion of FY 2023 coupled with the Strategy period of FY 2024 – FY 2033 provides an eleven-year view of the change in capital commitments from the January 2023 to the April 2023 Plan conditions as shown in Table 37. This results in a net increase of $2.71 billion over FY 2023 – FY 2033 rather than the $5.45 billion change over the FY 2024-2033 Strategy period as shown in Table 35 earlier in the report.
In FY 2023, eight of the nine categories in the table saw Plan decreases except for DEP, which increased by $71 million for a net total decrease of $2.73 billion in FY 2023. Decreases in the first year of a given plan condition are common to meet adjusted timelines. Five of the nine categories saw their FY 2023 decreases restored within the FY 2024 – FY 2027 Commitment Plan period with two additional categories restored by FY 2033. The remaining two categories—the Dept. of Transportation and the Resiliency & Energy Efficiency, Technology, and Computer Equipment category—did not fully make up the decreases from FY 2023, with net decreases over FY 2023 – FY 2033 of $104 million for DOT and $103 million in the Resiliency & Energy Efficiency, Technology, and Computer Equipment category. Notably, the budget line for energy efficiency and sustainability (PU-25) was reduced by $135 million over FYs 2028 – FY 2030 from the Preliminary Strategy.
The main drivers of the net $2.71 billion increase over the 11-year period are from a $1.45 billion increase to the Borough Based Jail capital project in Brooklyn and an increase of $476 million to CUNY for the redevelopment of the Hunter Brookdale Campus which includes a new Science Park and Research Campus.
Table 37. Change in Capital Commitments from the January 2023 Plan Condition and Preliminary Ten-Year Capital Strategy, All-Funds – FY 2023 – FY 2033
| ($ in millions) | FY 2023 Change from January Plan | FY 2024 – FY 2027 Change from January Plan | FY 2028 – FY 2033 Change from January Plan | Change for the 11-Year Period |
|---|---|---|---|---|
| Project Category | ||||
| Education and CUNY | ($360) | $962 | $238 | $840 |
| Environmental Protection | 71 | (772) | 731 | 31 |
| Dept. of Transportation and Mass Transit | (378) | (121) | 394 | (104) |
| Housing and Economic Development | (809) | 1498 | (502) | 188 |
| Administration of Justice | (253) | 1743 | (20) | 1470 |
| Resiliency & Energy Efficiency, Technology, and Computer Equipment | (450) | 510 | (163) | (103) |
| Parks Department | (44) | 304 | (187) | 73 |
| Hospitals | (252) | (99) | 364 | 13 |
| Other City Operations and Facilities | (260) | 94 | 470 | 304 |
| Total Change in Commitments | ($2,734) | $4,119 | $1,327 | $2,712 |
NOTE: Numbers may not add due to rounding.
Funding the Capital Strategy
As shown in Table 38, the Strategy continues to be primarily financed by City bonds (General Obligation (GO) and Transitional Finance Authority Future Tax Secured (TFA FTS), with an estimated $132.27 billion in anticipated local tax-supported borrowing, or 80.3 percent of the Strategy. Municipal Water Finance Authority (NYW) debt is expected to fund $28.37 billion, or 17.2 percent of the Strategy. The remaining 2.5 percent, about $4.14 billion, is estimated to be funded with Federal ($3.37 billion), State ($573.3 million), and other non-City sources ($196 million).
Table 38. Funding of the FY 2024 – FY 2033 Ten-Year Capital Strategy, April 2023
| ($ in millions) Agency/Project Type |
Tax-Supported | Water Authority Funded | Non-City Funded | Total Funded |
| Department of Education/CUNY | $19,234 | $0 | $135 | $19,369 |
| Department of Environmental Protection | $0 | $28,367 | $639 | $29,006 |
|
Dept. of Transportation |
$30,451 | 0 | $1,102 | $31,553 |
| Housing Preservation and Development | $19,072 | $0 | $400 | $19,472 |
| NYCHA | $4,392 | $0 | $0 | $4,392 |
| Economic Development (SBS) | $5,973 | $0 | $265 | $6,239 |
| Administration of Justice | $15,034 | $0 | $80 | $15,114 |
| Resiliency, Technology, and Citywide Equipment | $10,043 | $0 | $115 | $10,158 |
| Parks Department | $8,441 | $0 | $424 | $8,865 |
| Hospitals (H +H) | $3,435 | $0 | $661 | $4,096 |
| Other City Operations and Facilities | $16,193 | $0 | $322 | $16,515 |
| Total | $132,269 | $28,367 | $4,142 | $164,778 |
| Percent of Total Funding | 80.3% | 17.2% | 2.5% | 100.0% |
NOTE: FYs 2024 – FY 2033 Ten-Year Capital Strategy, April 2023. Numbers may not tie due to rounding.
Financing Program
Total projected borrowing in the April 2023 Financial Plan for FY 2023 through FY 2027 sums to $62.71 billion as shown in Table 38. This is $360 million higher than the January 2023 Financial Plan. This is a result of net increases of $370 million in GO borrowing, $430 million in Transitional Finance Authority (TFA) Future Tax Secured (FTS) borrowing, offset by a decrease of $440 million in New York City Municipal Water Finance Authority (NYW) borrowing over the period. The $800 million combined GO and TFA increase is consistent with the net capital commitment increase of $2.09 billion in the April 2023 Capital Plan over FY 2023-2027 excluding DEP.[26]
Table 39. April 2023 Financial Plan Financing Program
| ($ in millions) | Estimated Borrowing and Funding Sources FY 2023 – FY 2027 | Change from January 2023 | Percent of Total |
| General Obligation Bonds | $26,965 | $370 | 43.0% |
| TFA FTS Bonds | 26,850 | 430 | 42.8% |
| NYC Water Finance Authority | 8,893 | (440) | 14.2% |
| TFA BARBs | 0 | 0 | 0.0% |
| Total | $62,708 | $360 | 100.0% |
SOURCE: NYC Office of Management and Budget, FY 2024 Executive Budget and April 2023 Financial Plan.
Debt Service
As shown in Table 40, debt service, net of prepayments, in the April 2023 Financial Plan and FY 2024 Executive Budget totals $7.62 billion in FY 2023, $7.89 billion in FY 2024, $8.34 billion in FY 2025, $9.10 billion in FY 2026, and $9.79 billion in FY 2027[27]. These amounts represent decreases from the January 2023 Plan of $110 million in FY 2023, $86 million in FY 2024, $89 million in FY 2025, $70 million in FY 2026, and $42 million in FY 2027 for a total decrease of $397 million over the Plan period.[28] Over the Financial Plan period TFA debt service comprises $244 million of the decrease followed by an estimated GO decrease of $146 million and lease-purchase debt with a $7 million decrease. The drivers of TFA savings are refunding savings of $185 million, lower than anticipated borrowing costs of $70 million over the Financial Plan period and estimated variable rate interest cost savings of $22 million in FY 2023. This is offset by other miscellaneous baseline increases.[29] GO savings are driven by $54 million of savings from lower interest costs on variable rate bonds and lower letter-of-credit fees in FY 2023. In addition, a March 2023 GO refunding produced savings of $36 million over the Financial Plan period. In addition, GO experienced approximately $53 million of savings from lower than projected debt-service costs from year-to-date borrowings.
Table 40. April 2023 Financial Plan Debt Service Estimates
| (($ in millions) | FY 2023 | FY 2024 | FY 2025 | FY 2026 | FY 2027 | Change FY 2023 – FY 2027 |
Average Annual Growth |
| GO | $4,157 | $4,400 | $4,573 | $4,826 | $5,031 | $874 | 4.9% |
| TFA FTSa | 3,259 | 3,294 | 3,573 | 4,089 | 4,576 | 1,317 | 8.9 |
| Lease-Purchase | 128 | 121 | 120 | 119 | 118 | (10) | (2.0) |
| TSASC, Inc. | 76 | 76 | 76 | 69 | 69 | (7) | (2.4) |
| Total | $7,620 | $7,891 | $8,342 | $9,103 | $9,794 | $2,174 | 6.5% |
| Change from January | ($110) | ($86) | ($89) | ($70) | ($42) | ($397) | N/A |
SOURCE: NYC Office of Management and Budget, FY 2024 April 2023 Financial Plan, April 2023.
NOTE: Debt service is adjusted for prepayments. Amounts do not include TFA BARBs.
Debt Affordability
Debt service as a percentage of tax revenues is a widely used metric to measure affordability. The debt service to local tax revenue ratio is estimated to be 10.6 percent in FY 2023, 11.0 percent in FY 2024, 11.3 percent in FY 2025, 12.1 percent in FY 2026, and 12.6 percent in FY 2027 as shown in Chart 16. The two-percentage point rise in the ratio is due to disparate growth rates between debt-service and local tax revenues. From FY 2023 to FY 2027, debt-service grows at an annual rate of 6.6 percent compared to local tax revenue growth of 2.0 percent.[30] The City projects the debt service to tax revenue ratio will remain below the 15 percent threshold for debt affordability through FY 2033. Annual debt service growth is estimated to be 5.8 percent from FY 2027 to FY 2033, with an estimated annual tax revenue growth of 3.6 percent. If tax revenue growth averaged only 2 percent per year in the outyears, the ratio would exceed 15 percent by FY 2032. The Comptroller’s Office is in the process of selecting a consultant to conduct a comprehensive debt affordability study to examine these issues.
Chart 16. NYC Debt Service as a Percent of Tax Revenues
SOURCE: Office of the NYC Comptroller, Comprehensive Annual Financial Reports, FY 1992 – FY 2022 and NYC Office of Management and Budget, FY 2023 April Plan and FY 2024 Executive Budget.
As shown on Table 41, the Comptroller’s Office estimates that the General Debt Limit will grow from $127.45 billion in FY 2023 to $156.84 billion by FY 2027, an increase of 23.1 percent. Total indebtedness is estimated to grow from $95.6 billion in FY 2023 to $140.5 by FY 2027, an increase of 46.8 percent. As a result, the remaining debt margin is forecast to decrease from about $31.9 billion to $16.3 billion by FY 2027. This estimated remaining debt margin is about $8.3 billion higher than OMB’s estimate of $8.0 billion, largely attributable to a higher estimate of the General Debt Limit.
Table 41. Forecast of Fiscal Year-End Debt Margin, FY 2023 – FY 2027– April 2023 Financial Plan
| End of Fiscal Year – June 30th ($ in millions) | FY 2023 | FY 2024 | FY 2025 | FY 2026 | FY 2027 |
| General Debt Limit | $127,448 | $131,324 | $136,836 | $146,334 | $156,841 |
| Debt Applicable to Limit: | |||||
| Net GO Bonds Outstanding | 40,205 | 42,515 | 45,673 | 49,205 | 53,267 |
| Estimated TFA Bonds above $13.5 Billion Limit | 32,076 | 35,262 | 39,216 | 43,385 | 47,579 |
| Adjustments: | |||||
| Excluded Funded Debt- (Water Supply Revenue Code 851 and School Exclusion Adjustment) | (12) | (16) | (12) | (9) | (7) |
| Contract Liability, land, and other liabilities | 23,287 | 30,375 | 35,889 | 38,634 | 39,663 |
| Total Indebtedness | $95,556 | $108,135 | $120,766 | $131,215 | $140,502 |
| Legal Debt Margin | $31,892 | $23,189 | $16,070 | $15,119 | $16,339 |
| Percent of Debt Limit Remaining | 25.0% | 17.7% | 11.7% | 10.3% | 10.4% |
| Percent of Limit Exhausted | 75.0% | 82.3% | 88.3% | 89.7% | 89.6% |
| OMB Debt Affordability Statement – Remaining Margin | N/A | $22,706 | $14,179 | $10,953 | $8,028 |
| Comptroller Estimate- Remaining Margin | $31,892 | $23,189 | $16,070 | $15,119 | $16,339 |
| Difference | N/A | $483 | $1,891 | $4,166 | $8,311 |
SOURCE: New York City Office of Comptroller and select Capital Plan information from the April 2023 Capital Commitment Plan
V. Appendix
Table A1. April 2023 Financial Plan Revenue Detail
| ($ in millions) | FY 2023 | FY 2024 | FY 2025 | FY 2026 | FY 2027 | Change FYs 2023– 2027 |
Annual Percent Change | |
|---|---|---|---|---|---|---|---|---|
| Dollars | Percent | |||||||
| Taxes: | ||||||||
| Real Property | $31,570 | $32,405 | $32,366 | $32,633 | $33,238 | $1,668 | 5.3% | 1.3% |
| Personal Income Tax | 15,941 | 15,243 | 16,125 | 16,722 | 17,756 | 1,815 | 11.4% | 2.7% |
| General Corporation Tax | 5,351 | 5,189 | 5,132 | 5,023 | 5,028 | (323) | (6.0%) | (1.5%) |
| Unincorporated Business Tax | 2,489 | 2,531 | 2,613 | 2,703 | 2,798 | 309 | 12.4% | 3.0% |
| Sales and Use Tax | 9,462 | 9,772 | 10,320 | 10,905 | 11,352 | 1,890 | 20.0% | 4.7% |
| Real Property Transfer Tax | 1,270 | 1,343 | 1,432 | 1,503 | 1,607 | 337 | 26.5% | 6.1% |
| Mortgage Recording Tax | 910 | 853 | 943 | 993 | 1,060 | 150 | 16.5% | 3.9% |
| Commercial Rent | 876 | 890 | 912 | 930 | 945 | 69 | 7.9% | 1.9% |
| Utility | 440 | 449 | 452 | 461 | 477 | 37 | 8.4% | 2.0% |
| Hotel | 637 | 666 | 709 | 734 | 762 | 125 | 19.6% | 4.6% |
| Cigarette | 18 | 17 | 16 | 16 | 16 | (2) | (11.1%) | (2.9%) |
| All Other | 923 | 1,048 | 1,073 | 1,098 | 1,123 | 200 | 21.7% | 5.0% |
| Cannabis Tax | 0 | 12 | 20 | 30 | 38 | 38 | 8990.9% | 208.8% |
| Tax Audit Revenue | 1,200 | 721 | 721 | 721 | 721 | (479) | (39.9%) | (12.0%) |
| Total Taxes | $71,087 | $71,139 | $72,834 | $74,472 | $76,921 | $5,834 | 8.2% | 2.0% |
| Miscellaneous Revenue: | ||||||||
| Licenses, Franchises, etc. | $753 | $694 | $705 | $712 | $693 | ($60) | (8.0%) | (2.1%) |
| Interest Income | 385 | 436 | 318 | 237 | 225 | (160) | (41.6%) | (12.6%) |
| Charges for Services | 878 | 1,021 | 1,025 | 1,028 | 1,029 | 151 | 17.2% | 4.0% |
| Water and Sewer Charges | 1,826 | 1,842 | 1,815 | 1,813 | 1,806 | (20) | (1.1%) | (0.3%) |
| Rental Income | 255 | 257 | 260 | 258 | 258 | 3 | 258.0% | 0.3% |
| Fines and Forfeitures | 1,428 | 1,178 | 1,174 | 1,182 | 1,182 | (246) | (17.2%) | (4.6%) |
| Miscellaneous | 365 | 369 | 340 | 343 | 339 | (26) | (7.1%) | (1.8%) |
| Intra-City Revenue | 2,361 | 1,996 | 1,987 | 1,989 | 1,986 | (375) | (15.9%) | (4.2%) |
| Total Miscellaneous Revenue | $8,251 | $7,793 | $7,624 | $7,562 | $7,518 | ($733) | (8.9%) | (2.3%) |
| Unrestricted Intergovernmental Aid: | ||||||||
| Other Federal and State Aid | ($297) | 0 | 0 | 0 | 0 | ($297) | (100.0%) | (100.0%) |
| Total Unrestricted Intergovernmental Aid | ($297) | 0 | 0 | 0 | 0 | ($297) | (100.0%) | (100.0%) |
| Reserve for Disallowance of Categorical Grants | ($15) | ($15) | ($15) | ($15) | ($15) | $0 | 0.0% | 0.0% |
| Less: Intra-City Revenue | ($2,361) | ($1,996) | ($1,987) | ($1,989) | ($1,986) | $375 | (15.9%) | (4.2%) |
| TOTAL CITY-FUNDS | $77,259 | $76,921 | $78,456 | $80,030 | $82,438 | $5,179 | 6.7% | 1.6% |
| Other Categorical Grants | $1,109 | $1,082 | $1,075 | $1,070 | $1,070 | ($39) | (3.5%) | (0.9%) |
| Inter-Fund Agreements | $706 | $720 | $725 | $732 | $732 | $26 | (3.7%) | 0.9% |
| Federal Categorical Grants: | ||||||||
| Community Development | $444 | $255 | $239 | $238 | $236 | ($208) | (46.8%) | (14.6%) |
| Social Services | 3,679 | 3,435 | 3,445 | 3,438 | 3,436 | (243) | (6.6%) | (1.7%) |
| Education | 3,955 | 3,687 | 2,147 | 1,901 | 1,901 | (2,054) | (51.9%) | (16.7%) |
| Other | 3,643 | 3,034 | 2,229 | 1,475 | 1,453 | (2,190) | (60.1%) | (20.5%) |
| Total Federal Grants | $11,721 | $10,411 | $8,060 | $7,052 | $7,026 | ($4,695) | (40.1%) | (12.0%) |
| State Categorical Grants: | ||||||||
| Social Services | $2,759 | $2,465 | $2,204 | $1,907 | $1,907 | ($852) | (30.9%) | (8.8%) |
| Education | 12,602 | 12,695 | 12,887 | 12,888 | 12,888 | 286 | 2.3% | 0.6% |
| Higher Education | 276 | 276 | 276 | 276 | 276 | 0 | 0.0% | 0.0% |
| Department of Health and Mental Hygiene | 690 | 624 | 624 | 624 | 624 | (66) | (9.6%) | (2.5%) |
| Other | 1,786 | 1,495 | 1,549 | 1,609 | 1,672 | (114) | (6.4%) | (1.6%) |
| Total State Grants | $18,113 | $17,555 | $17,540 | $17,304 | $17,367 | ($746) | (4.1%) | (1.0%) |
| TOTAL REVENUES | $108,908 | $106,689 | $105,856 | $106,188 | $108,633 | ($275) | (0.3%) | (0.1%) |
NOTE: Numbers may not add due to rounding.
Table A2. April 2023 Financial Plan Expenditure Detail
| ($ in millions) | FY 2023 | FY 2024 | FY 2025 | FY 2026 | FY 2027 | Change FYs 2023 – 2027 |
Annual Percent Change | |
|---|---|---|---|---|---|---|---|---|
| Dollars | Percent | |||||||
| Mayoralty | $195 | $173 | $163 | $162 | $160 | ($36) | (18.3%) | (4.9%) |
| Board of Elections | 246 | 138 | 138 | 138 | 138 | (108) | (43.9%) | (13.5%) |
| Campaign Finance Board | 78 | 73 | 13 | 13 | 13 | (65) | (83.6%) | (36.3%) |
| Office of the Actuary | 7 | 7 | 7 | 7 | 7 | (0) | (0.3%) | (0.1%) |
| President, Borough of Manhattan | 6 | 6 | 5 | 5 | 5 | (0) | (8.3%) | (2.1%) |
| President, Borough of Bronx | 7 | 7 | 6 | 6 | 6 | (1) | (14.2%) | (3.8%) |
| President, Borough of Brooklyn | 8 | 7 | 7 | 7 | 7 | (2) | (20.8%) | (5.7%) |
| President, Borough of Queens | 8 | 6 | 5 | 5 | 5 | (2) | (27.5%) | (7.7%) |
| President, Borough of Staten Island | 5 | 5 | 5 | 5 | 5 | (1) | (11.8%) | (3.1%) |
| Office of the Comptroller | 116 | 117 | 117 | 117 | 117 | 2 | 1.5% | 0.4% |
| Dept. of Emergency Management | 189 | 217 | 89 | 34 | 32 | (158) | (83.3%) | (36.1%) |
| Office of Administrative Tax Appeals | 6 | 6 | 6 | 6 | 6 | 0 | 2.3% | 0.6% |
| Law Dept. | 269 | 235 | 215 | 216 | 216 | (53) | (19.7%) | (5.3%) |
| Dept. of City Planning | 44 | 49 | 47 | 45 | 46 | 1 | 3.0% | 0.7% |
| Dept. of Investigation | 48 | 39 | 39 | 39 | 39 | (9) | (18.9%) | (5.1%) |
| NY Public Library — Research | 33 | 31 | 31 | 32 | 32 | (1) | (3.3%) | (0.8%) |
| New York Public Library | 170 | 158 | 160 | 162 | 162 | (8) | (4.4%) | (1.1%) |
| Brooklyn Public Library | 128 | 119 | 121 | 123 | 123 | (5) | (4.1%) | (1.1%) |
| Queens Borough Public Library | 133 | 123 | 125 | 127 | 127 | (6) | (4.4%) | (1.1%) |
| Dept. of Education | 31,460 | 30,549 | 30,639 | 30,838 | 31,038 | (422) | (1.3%) | (0.3%) |
| City University | 1,246 | 1,257 | 1,263 | 1,264 | 1,281 | 34 | 2.8% | 0.7% |
| Civilian Complaint Review Board | 24 | 23 | 24 | 24 | 24 | 0 | 0.3% | 0.1% |
| Police Dept. | 5,571 | 5,071 | 5,103 | 5,136 | 5,182 | (390) | (7.0%) | (1.8%) |
| Fire Dept. | 2,597 | 2,297 | 2,262 | 2,264 | 2,261 | (336) | (13.0%) | (3.4%) |
| Dept. of Veterans’ Services | 6 | 5 | 5 | 5 | 5 | (1) | (10.7%) | (2.8%) |
| Admin. for Children Services | 3,143 | 2,720 | 2,737 | 2,722 | 2,722 | (421) | (13.4%) | (3.5%) |
| Dept. of Social Services | 11,676 | 10,991 | 10,696 | 10,649 | 11,145 | (531) | (4.5%) | (1.2%) |
| Dept. of Homeless Services | 3,493 | 4,087 | 2,789 | 2,162 | 2,159 | (1,333) | (38.2%) | (11.3%) |
| Dept. of Correction | 1,362 | 1,166 | 1,155 | 1,186 | 1,186 | (175) | (12.9%) | (3.4%) |
| Board of Correction | 3 | 3 | 3 | 4 | 4 | 0 | 10.5% | 2.5% |
| Citywide Pension Contributions | 9,301 | 9,522 | 10,303 | 10,765 | 10,948 | 1,646 | 17.7% | 4.2% |
| Miscellaneous | 15,623 | 15,956 | 17,519 | 19,124 | 20,816 | 5,193 | 33.2% | 7.4% |
| Debt Service | 4,285 | 4,521 | 4,693 | 4,946 | 5,149 | 864 | 20.2% | 4.7% |
| TFA Debt Service | 3,259 | 3,294 | 3,573 | 4,089 | 4,576 | 1,317 | 40.4% | 8.9% |
| FY 2022 BSA and Discretionary Transfers | (6,114) | 0 | 0 | 0 | 0 | 6,114 | (100.0%) | (100.0%) |
| FY 2023 BSA | 3,035 | (3,035) | 0 | 0 | 0 | (3,035) | (100.0%) | (100.0%) |
| Public Advocate | 5 | 5 | 5 | 5 | 5 | (0) | (8.4%) | (2.2%) |
| City Council | 100 | 100 | 85 | 85 | 85 | (15) | (15.0%) | (4.0%) |
| City Clerk | 6 | 5 | 5 | 5 | 5 | (1) | (10.7%) | (2.8%) |
| Dept. for the Aging | 540 | 469 | 473 | 393 | 392 | (147) | (27.3%) | (7.7%) |
| Dept. of Cultural Affairs | 250 | 158 | 159 | 161 | 161 | (89) | (35.5%) | (10.4%) |
| Financial Info. Serv. Agency | 120 | 116 | 117 | 119 | 119 | (1) | (1.0%) | (0.2%) |
| Office of Payroll Admin. | 16 | 15 | 16 | 16 | 16 | (0) | (2.9%) | (0.7%) |
| Independent Budget Office | 7 | 7 | 7 | 7 | 6 | (0) | (4.9%) | (1.3%) |
| Equal Employment Practices | 1 | 1 | 1 | 1 | 1 | 0 | 0.5% | 0.1% |
| Civil Service Commission | 1 | 1 | 1 | 1 | 1 | (0) | (5.1%) | (1.3%) |
| Landmarks Preservation Commission | 8 | 8 | 7 | 8 | 8 | (1) | (6.4%) | (1.6%) |
| Districting Commission | 1 | 0 | 0 | 0 | 0 | (1) | (100.0%) | (100.0%) |
| Taxi & Limousine Commission | 168 | 56 | 55 | 54 | 53 | (114) | (68.2%) | (24.9%) |
| Office of Racial Equity | 0 | 3 | 3 | 3 | 3 | 3 | N/A | N/A |
| Commission on Racial Equity | 0 | 1 | 2 | 2 | 2 | 2 | N/A | N/A |
| Commission on Human Rights | 12 | 14 | 14 | 14 | 14 | 3 | 22.8% | 5.3% |
| Youth & Community Development | 1,043 | 1,010 | 953 | 938 | 938 | (104) | (10.0%) | (2.6%) |
| Conflicts of Interest Board | 3 | 2 | 3 | 3 | 3 | (0) | (4.8%) | (1.2%) |
| Office of Collective Bargaining | 2 | 2 | 2 | 2 | 2 | (0) | (1.5%) | (0.4%) |
| Community Boards (All) | 21 | 21 | 20 | 21 | 21 | (0) | (1.4%) | (0.3%) |
| Dept. of Probation | 115 | 111 | 106 | 105 | 105 | (10) | (8.4%) | (2.2%) |
| Dept. Small Business Services | 414 | 197 | 185 | 149 | 146 | (268) | (64.8%) | (23.0%) |
| Housing Preservation & Development | 1,492 | 1,353 | 1,263 | 1,235 | 1,243 | (249) | (16.7%) | (4.5%) |
| Dept. of Buildings | 193 | 217 | 191 | 188 | 188 | (5) | (2.5%) | (0.6%) |
| Dept. of Health & Mental Hygiene | 3,006 | 2,100 | 2,044 | 2,023 | 2,023 | (982) | (32.7%) | (9.4%) |
| NYC Health + Hospitals | 1,697 | 1,732 | 1,220 | 971 | 981 | (716) | (42.2%) | (12.8%) |
| Office of Administrative Trials & Hearings | 66 | 65 | 65 | 66 | 66 | (0) | (0.6%) | (0.2%) |
| Dept. of Environmental Protection | 1,661 | 1,638 | 1,584 | 1,577 | 1,570 | (91) | (5.5%) | (1.4%) |
| Dept. of Sanitation | 1,909 | 1,848 | 1,845 | 1,838 | 1,850 | (59) | (3.1%) | (0.8%) |
| Business Integrity Commission | 9 | 8 | 8 | 9 | 9 | (1) | (6.8%) | (1.7%) |
| Dept. of Finance | 340 | 335 | 327 | 330 | 330 | (11) | (3.1%) | (0.8%) |
| Dept. of Transportation | 1,483 | 1,404 | 1,404 | 1,388 | 1,377 | (106) | (7.2%) | (1.8%) |
| Dept. of Parks and Recreation | 586 | 552 | 552 | 562 | 562 | (24) | (4.1%) | (1.0%) |
| Dept. of Design & Construction | 246 | 155 | 154 | 156 | 156 | (90) | (36.5%) | (10.7%) |
| Dept. of Citywide Admin. Services | 713 | 615 | 592 | 594 | 591 | (122) | (17.1%) | (4.6%) |
| D.O.I.T.T. | 723 | 610 | 593 | 547 | 547 | (176) | (24.3%) | (6.7%) |
| Dept. of Record & Info. Services | 17 | 16 | 16 | 16 | 16 | (1) | (5.3%) | (1.4%) |
| Dept. of Consumer & Worker Protection | 66 | 63 | 63 | 64 | 64 | (2) | (2.7%) | (0.7%) |
| District Attorney – N.Y. | 165 | 154 | 153 | 155 | 156 | (9) | (5.7%) | (1.5%) |
| District Attorney – Bronx | 107 | 102 | 103 | 104 | 104 | (3) | (2.9%) | (0.7%) |
| District Attorney – Kings | 137 | 134 | 135 | 136 | 136 | (1) | (0.4%) | (0.1%) |
| District Attorney –Queens | 92 | 88 | 89 | 89 | 89 | (2) | (2.7%) | (0.7%) |
| District Attorney – Richmond | 24 | 22 | 22 | 22 | 22 | (2) | (6.3%) | (1.6%) |
| Office of Prosec. & Special Narc. | 27 | 27 | 27 | 27 | 27 | 0 | 1.2% | 0.3% |
| Public Administrator – N.Y. | 1 | 1 | 1 | 1 | 1 | 0 | 2.6% | 0.7% |
| Public Administrator – Bronx | 1 | 1 | 1 | 1 | 1 | 0 | 1.9% | 0.5% |
| Public Administrator – Brooklyn | 1 | 1 | 1 | 1 | 1 | (0) | (7.4%) | (1.9%) |
| Public Administrator – Queens | 1 | 1 | 1 | 1 | 1 | 0 | 6.4% | 1.6% |
| Public Administrator – Richmond | 1 | 1 | 1 | 1 | 1 | (0) | (2.9%) | (0.7%) |
| Prior Payable Adjustment | (400) | 0 | 0 | 0 | 0 | 400 | (100.0%) | (100.0%) |
| General Reserve | 50 | 1,200 | 1,200 | 1,200 | 1,200 | 1,150 | 2300.0% | 121.3% |
| Energy Adjustment | 0 | 0 | 9 | 114 | 160 | 160 | N/A | N/A |
| Lease Adjustment | 0 | 0 | 47 | 95 | 145 | 145 | N/A | N/A |
| OTPS Inflation Adjustment | 0 | 0 | 56 | 111 | 167 | 167 | N/A | N/A |
| TOTAL EXPENDITURES | $108,909 | $106,689 | $110,052 | $112,141 | $115,610 | $6,701 | 6.2% | 1.5% |
NOTE: Numbers may not add due to rounding. Agency expenditures shown above are net of intra-City expenditures.
Acknowledgements
The Comptroller wishes to thank the entire Bureau of Budget team for their contributions in analyzing the April 2023 Financial Plan and developing this report. He is also grateful to Archer Hutchinson for the design and layout.
Endnotes
[1] https://comptroller.nyc.gov/reports/raising-revenues
[2] The Office of the Comptroller is grateful to Michael Dardia for his work and advice on the economic and tax forecast.
[3] Preliminary Mayor’s Management Report, January 2023, page 214 Goal 1b.
[6] Methodological notes are available here.
[7] Miscellaneous revenue analysis excludes intra-City revenues. Water and sewer revenues are mostly payments from the New York City Water Board for the operation and maintenance of the water delivery and sewer system and are not available for general operating purposes.
[8] https://www.nytimes.com/2023/05/02/nyregion/budget-hochul-bail-housing.html
[9] Title Vacant : Office of the New York City Comptroller Brad Lander (nyc.gov)
[10] This includes all municipal employees as well as certain employees at covered organizations such as NYCHA, H+H, CUNY, etc. and some human services employees providing services under contract with the city.
[11] Overtime Overview : Office of the New York City Comptroller Brad Lander (nyc.gov)
[12] The Health Insurance Fund created in the mid 1980’s paid the difference between the GHI and HIP health insurance premiums, essentially protecting employees and retirees from paying more to be covered by GHI. Currently, the City contributes $35 million to the fund annually. For several fiscal years, the GHI premium was lower than the HIP premium leading to a higher than anticipated balance in the fund. Over time, the City and unions were able to draw from the fund balance to offset wage increases and other benefits for employees. In recent years, however, GHI health insurance premiums have been about equal or higher than HIP premiums. This has led to a reduction in the balance of the fund and the likelihood that the fund will not be able to meet obligations in coming fiscal years.
[13] With a planned implementation date of September 1, 2023, the City will realize lower health care costs for ten months of the fiscal year for FY 2024. Assuming a monthly cost of $52.4 million, heath care costs will be lower by $524 million for the fiscal year.
[14] Returns above or below the AIR for a given fiscal year are phased into the Actuarial Asset Value over a five-year period in accordance with the Actuary’s Actuarial Asset Valuation Methodology (AAVM).
[15] The City indicates this allocation will likely be reduced by $40 million through a technical adjustment during budget adoption.
[16] Pursuant to Florence County School District Four v. Carter, when a parent or guardian disagrees with DOE’s recommended individualized educational plan, they may elect to place the student in a non-public school and seek reimbursement for their costs or direct payment to the school by commencing legal proceedings against DOE, known as a Carter Case.
[17] NYS Bill A03003, page 653
[19] Typically, the Department of Homeless Services pays a per diem rate for each household as they usually share one room or unit. The Comptroller’s office only receives regular information on the total number of asylum-seeking individuals (adults and children) and must estimate the number of households in shelter. A household can be a family with children, two adults living together as a family (adult parent with an adult child or two adults living as partners without children) or a single adult living alone.
[20] This report uses an estimate of 2.35 individuals per household, based on correspondence with OMB. However, the true size of a household generally differs by makeup. Families with children have an average of approximately 3.5 individuals, adult families approximately 2.1, and single adults have a household size of one.
[21] A more detailed view of contracts is available for download https://comptroller.nyc.gov/reports/accounting-for-asylum-seekers/
[22] Debipriya Chatterjee, “Over a Million New Yorkers Will Benefit from Expanding NYC’s Fair Fares Program.” Community Service Society of New York, 8 Mar. 2023, https://www.cssny.org/news/entry/fair-fares-expansion-million-new-yorkers-benefit-nyc.
[23] Given the inflationary environment and delays, the four Borough Based Jail projects could exceed current cost estimates as evidenced by the recent contract for the Brooklyn Detention Center. As a result, the anticipated completion date of 2026 will likely be exceeded.
[24] Of note within the Bridges category is the Brooklyn Queens Expressway reconstruction and triple cantilever project which is estimated at approximately $1.7 billion could grow higher due to on-going delays due to a community-driven design process.
[25] $736 million of planned commitments for borough based jail facilities reside in FY 2023 and actual commitments to date are about $550 million.
[26] DEP’s capital plan decreased by $701 million over FYs 2023-2027 as this amount was largely rolled out to FYs 2028-2033.
[27] Includes GO, conduit debt, TFA-PIT bonds, and TSASC.
[28] These figures represent all-funds and thus may differ from estimates in the City’s PEG program.
[29] The TFA savings shown are net of costs related to equity contributions as a part of refunding transactions.
[30] These figures exclude TSASC debt service.