Power and the Gender Wage Gap
Women comprise about half (49.6 percent) of New York City’s workforce, contributing almost $100 billion annually in earnings to the economy.[1] Women are a particularly important part of the municipal workforce, where they account for more than half (59 percent) of all employees, with some two-thirds being women of color.[2] In addition to their public service, women also reflect the entrepreneurial spirit of the city; the number of women-owned businesses in New York City grew 65 percent between 2002 and 2012.[3] And, on top of paid work, women in New York City contribute untold unpaid labor as well, caring for families and loved ones, contributing to arts and culture, and strengthening neighborhoods across the five boroughs.
Women power New York City. Yet existing research and women’s lived experiences indicate that they continue to face disparate treatment at work. Although women make up a nearly equal share of the workforce, they take home only 40 percent of total earnings citywide.[4] This policy brief, by New York City Comptroller Scott M. Stringer, offers new analysis of the gender wage gap in New York City, for the first time breaking down data on earnings by gender, race, and occupation. The analysis shows that women are paid less on average than men in a variety of occupations, even when controlling for a number of factors that may affect earnings.
The Comptroller’s Office finds that the gender wage gap, or the difference in average earnings between women and men, is largest among higher-paying occupations, including financial managers and software developers—jobs in which men have historically been overrepresented. Given the earning and investment power of the financial and technology sectors, this, in effect, creates not only a gender wage gap but a power gap. On the other hand, the gender wage gap appears smaller—and, in limited cases, is reversed—in jobs predominantly held by and traditionally associated with women, such as nurses and secretaries. For women of color, data show that the gender wage gap is larger on average than for white women across all occupations.
Gender Wage Gap by Race and Occupation
To understand the extent to which the gender wage gap exists within individual occupational titles in New York City, the Comptroller’s Office used 2016 U.S. Census Bureau data to compare the full-time earnings of men and women in nine common New York City occupations. The results show that white men are paid more on average than women, across racial groups, in seven of the nine occupations included in the analysis: financial managers, software developers, miscellaneous managers, marketing and sales managers, accountants, designers, and retail sales supervisors
(see Table 1).
Table 1: Average Earnings by Gender, Race/Ethnicity, and Occupation
| Gender | All | Men | Women | |||
| Race/Ethnicity | All | White | AAPI | Black | Hispanic | White |
| Financial Managers | $166,924 | $224,842 | $91,026 | $88,055 | $100,184 | $135,989 |
| Software Developers | $146,993 | $155,892 | $105,942 | — | $108,788 | $119,989 |
| Miscellaneous Managers | $128,239 | $156,323 | $98,355 | $97,929 | $85,476 | $122,868 |
| Marketing & Sales Managers | $114,176 | $138,465 | $91,833 | $89,605 | $104,955 | $108,970 |
| Accountants | $85,728 | $99,085 | $74,832 | $75,703 | $58,314 | $95,093 |
| Registered Nurses | $79,675 | $75,552 | $78,439 | $66,288 | $74,195 | $81,308 |
| Designers | $71,369 | $77,482 | $70,318 | $63,216 | $62,847 | $69,774 |
| Retail Sales Supervisors | $66,818 | $76,651 | $64,398 | $46,531 | $70,754 | $74,169 |
| Secretaries | $55,734 | $51,067 | $41,030 | $50,165 | $44,714 | $62,029 |
Source (Table 1 and Charts 1-5): Comptroller’s Office analysis of 2016 American Community Survey. Data represent average earnings of white men and Asian American and Pacific Islander, Black, Hispanic, and white women who are privately employed, childless, age 25 to 65, have very good or native English ability, have at least a high-school degree, and reside in New York City. Comparisons do not take into account the many factors beyond ethnicity, including seniority, experience, education and other factors, affecting individual earnings. Margins of error, not reported here, are larger for less common combinations of occupation and race/ethnicity.
The gender wage gap is largest among financial managers, the highest-paying occupation in the analysis with average annual earnings of about $166,000. White male financial managers earn more than two times what Hispanic, Asian American and Pacific Islander (AAPI), and Black women are paid within the same occupational group— roughly $224,000 annually compared to about $100,000, $91,000, and $88,000, respectively. Put another way, Hispanic, AAPI, and Black women financial managers make 45 cents, 40 cents, and 39 cents, respectively, for every dollar paid to white male financial managers. The gender wage gap is smaller but still stark for white women, who make 60 cents to the dollar (see Chart 1).
Chart 1: Gender Wage Gap between Women & White Men Financial Managers in NYC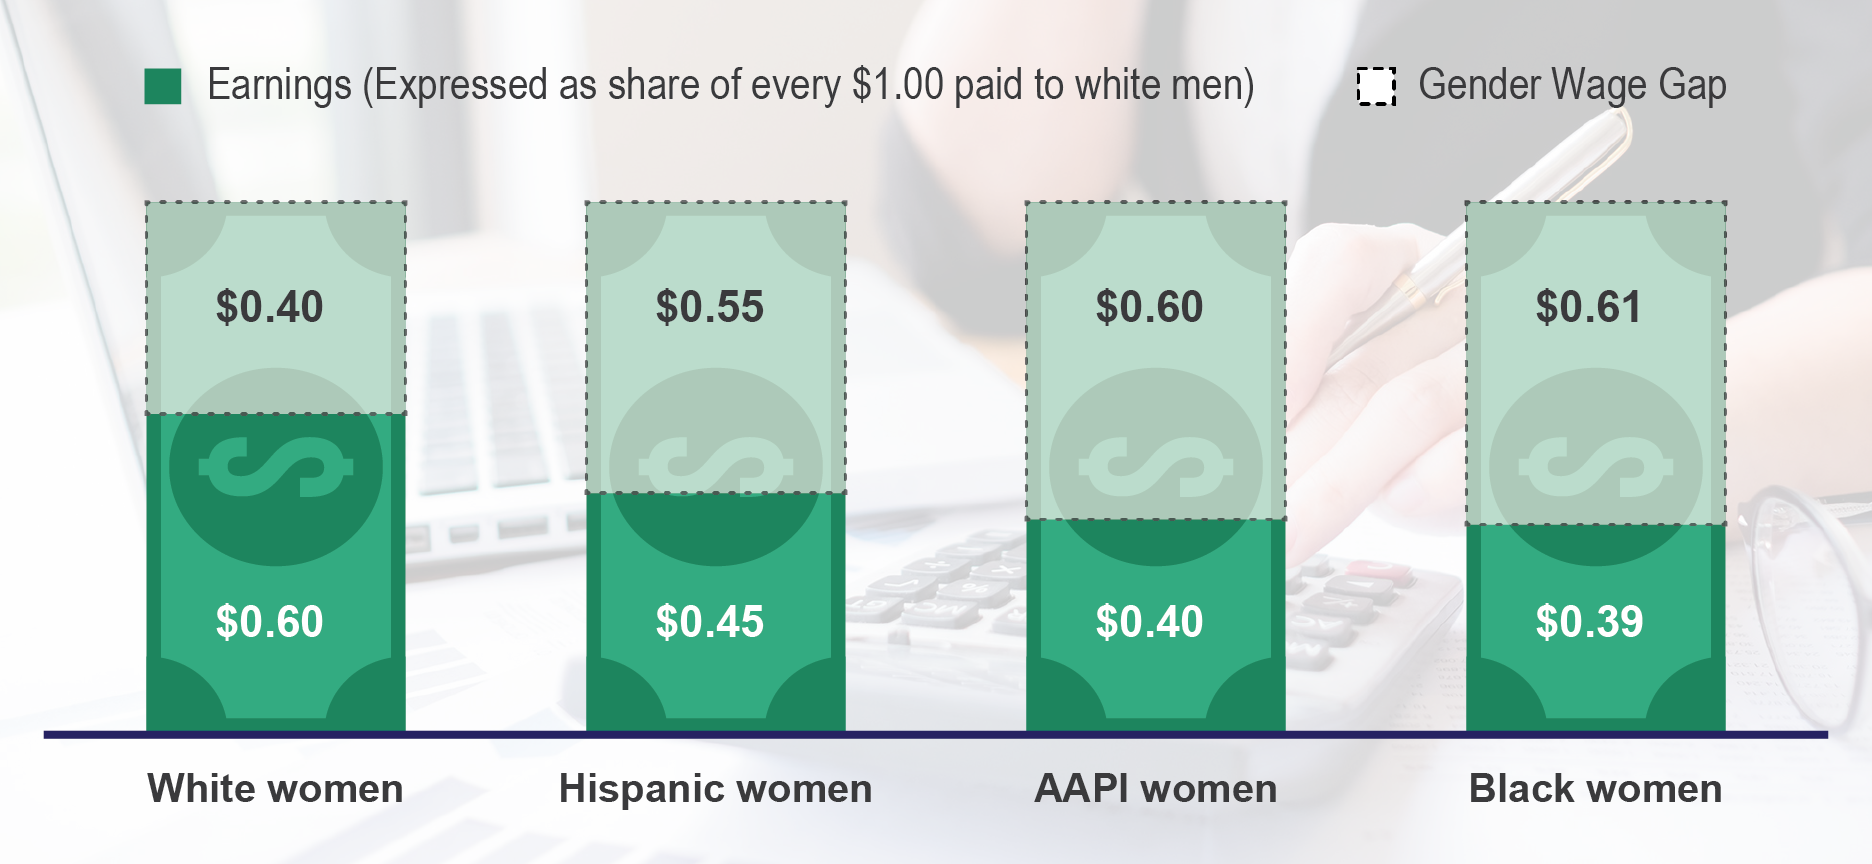
The average earnings of white men far exceed those of women in the software developer category as well. In these jobs, white, Hispanic, and AAPI women make on average 77 cents, 70 cents, and 68 cents, respectively, for every dollar paid to white men (see Chart 2). The sample size for Black women was not large enough to be included in the analysis.
Chart 2: Gender Wage Gap between Women & White Men Software Developers in NYC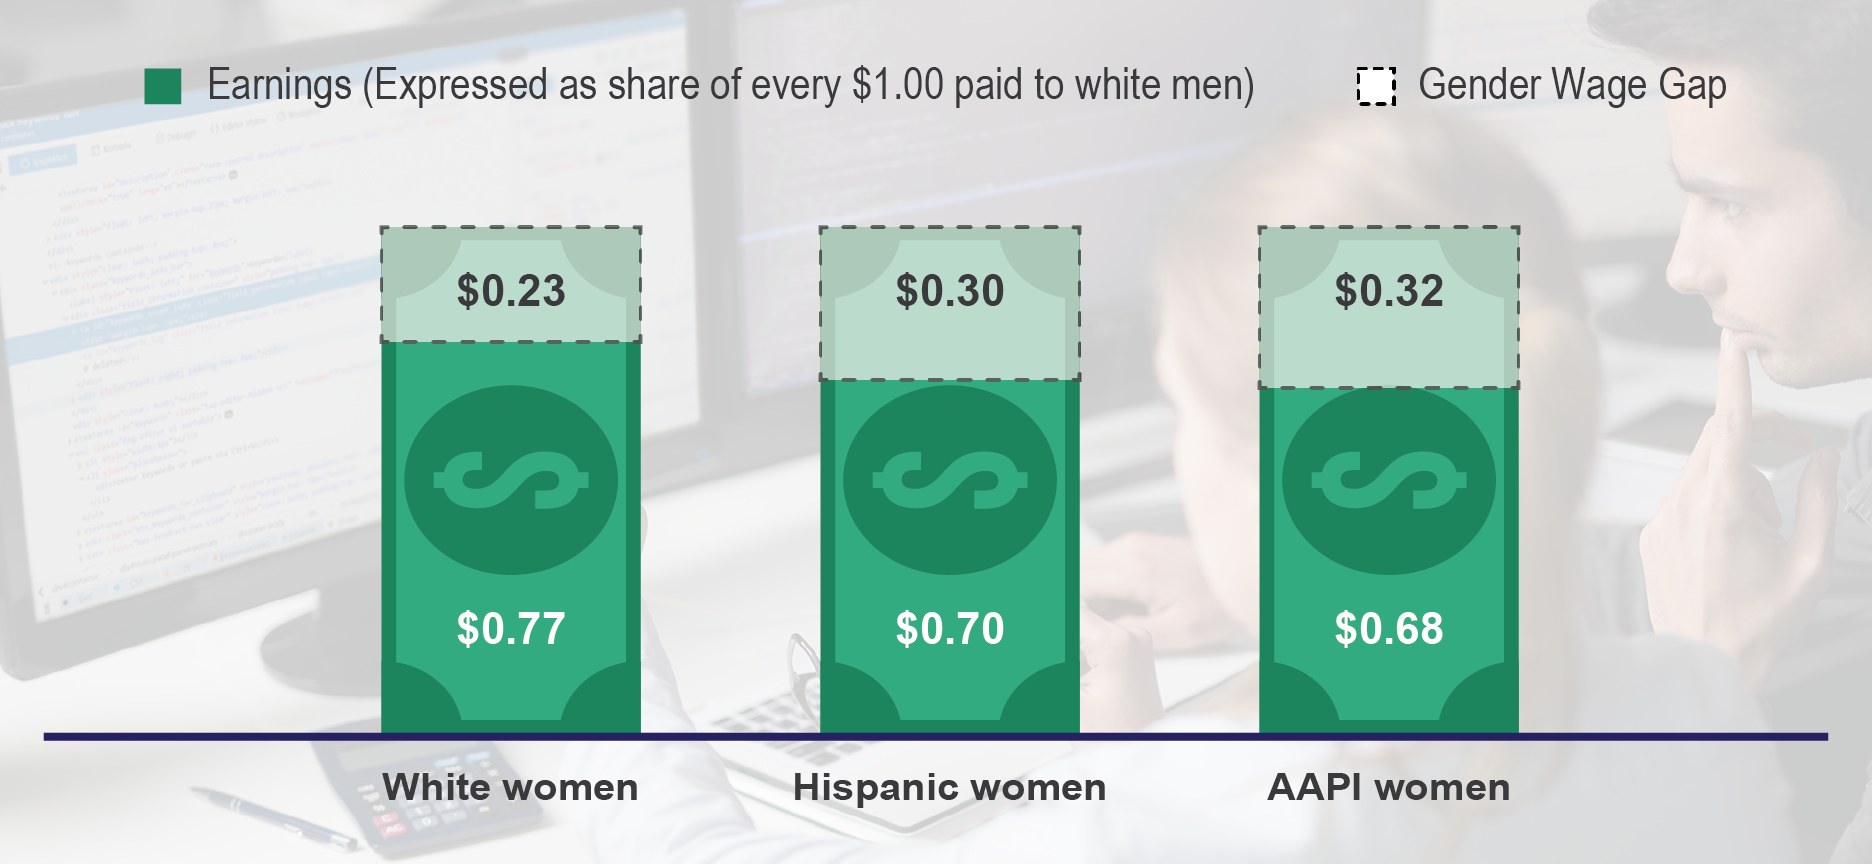
Of the occupations included in the analysis, the wage gap is smallest overall for women who are registered nurses and secretaries. In fact, white women and AAPI women earn more on average than white male registered nurses, making $1.08 and $1.04, respectively, for every dollar paid to a white man in the field (see Chart 3).
Chart 3: Gender Wage Gap between Women & White Men Registered Nurses in NYC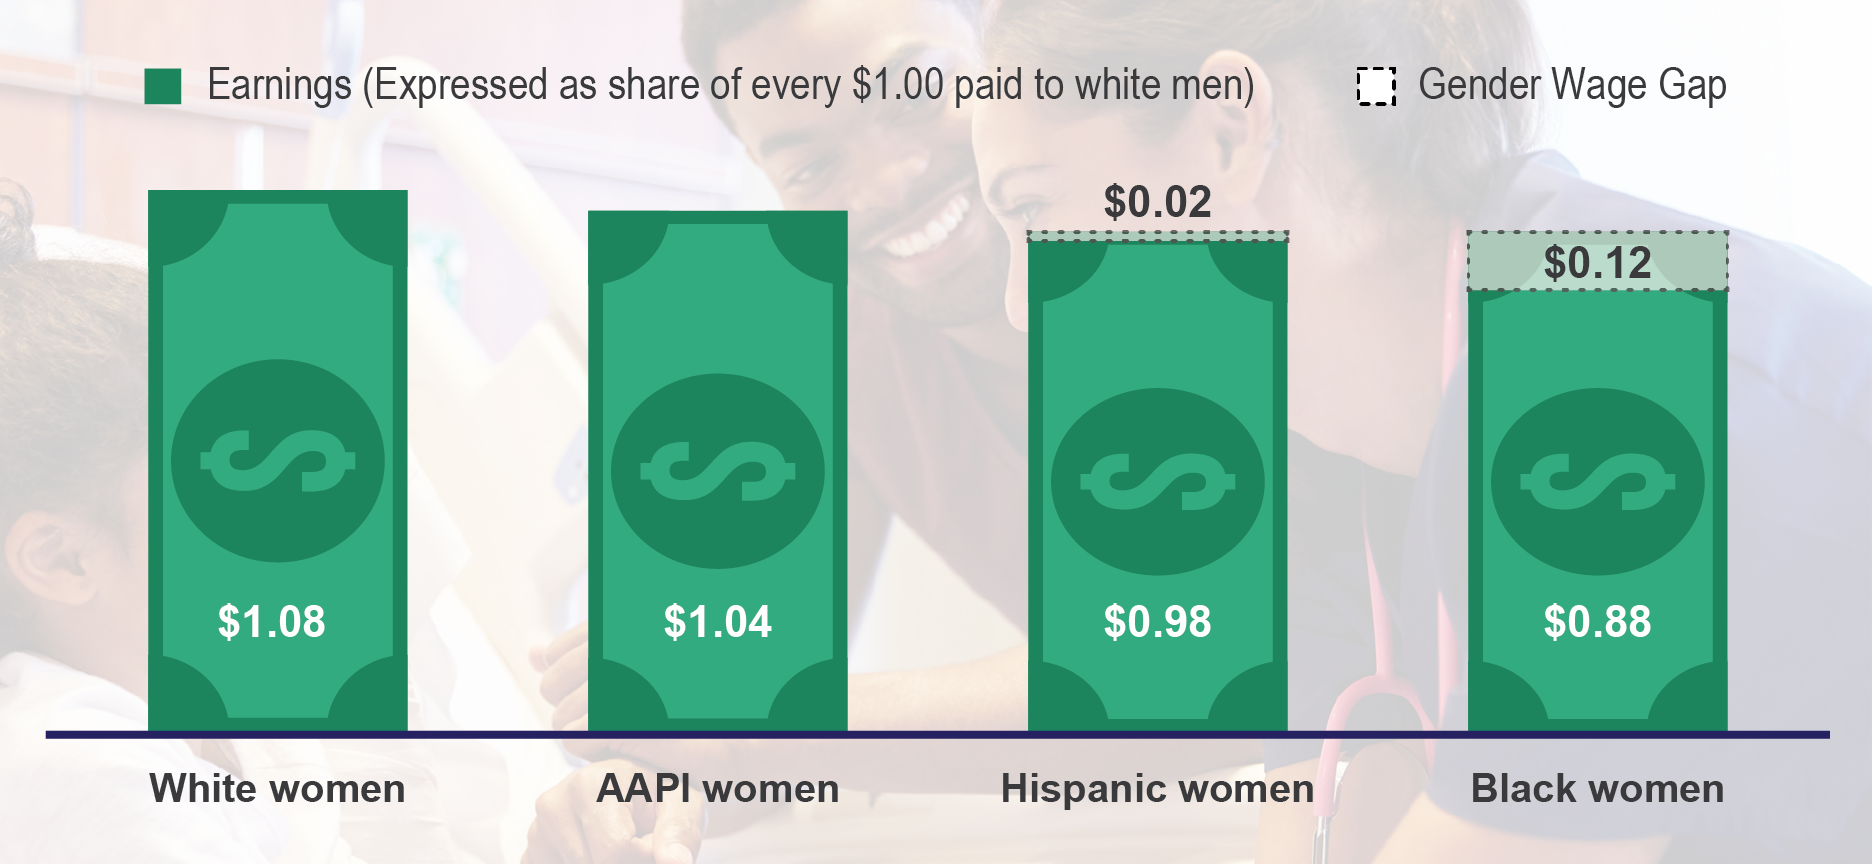
The Comptroller’s analysis shows that white women’s average full-time earnings are also larger than white men’s within the occupational group of secretaries, the lowest-paying job title included, with average annual earnings of roughly $56,000 (see Chart 4). In this case, the wage gaps between white women and Black, Hispanic, and AAPI women are actually larger than the gaps observed between white men and women of color.
Chart 4: Gender Wage Gap between Women & White Men Secretaries in NYC
Overall, as shown in Chart 5, the gender wage gap tends to be larger in higher-paying occupations historically filled by and associated with men and smaller in lower-paying jobs traditionally held by and associated with women. With the exception of designers, where AAPI women’s average earnings are about the same as white women’s, the gender wage gap is larger for women of color than for white women across all the occupations.
Chart 5: Women’s and Men’s Full-time Earnings by Race and Occupation
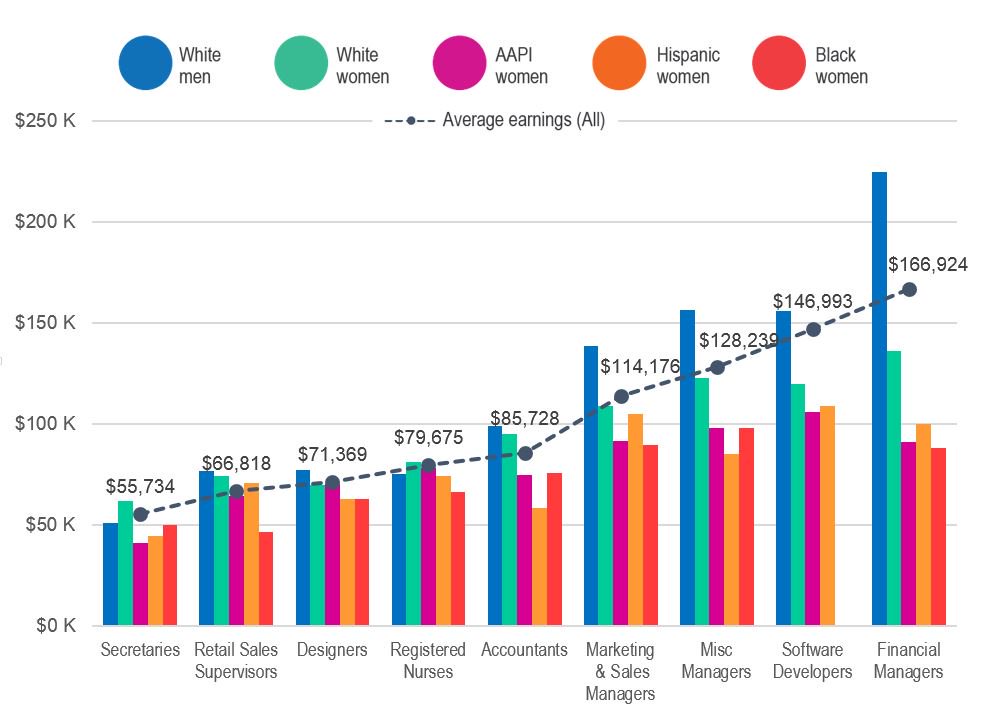
Note: The sample size for Black women in the software developer category was too small to be included.
What’s Power Got to do with it?
The patterns that emerge in this analysis, and which align with a now large body of research on the gender wage gap—that women are paid less than white men on average, and women of color are paid less than white women—indicate that both gender and race influence earnings differentials in New York City. Breaking the data down even further, in this case by occupation, shows that these gaps tend to persist even for people engaged in the same line of work. That the gender wage gap is larger in historically male-dominated occupations and smaller in female-dominated occupations, such as nursing, suggests that experience and seniority are driving at least part of the pay disparities observed today.
The larger gender wage gap in occupations with more lucrative salaries has significant implications for women’s long-term economic security—especially for women of color—as women will experience less wage growth and accumulate less wealth than men over their lifetimes. Despite the fact that women make up more than half (54.9 percent) of the workforce of S&P 500 finance companies, they hold only 6.3 percent of CEO positions and occupy fewer than one-third (29.9 percent) of senior-level manager positions, according to research conducted by Catalyst.[5] Traditional gatekeepers within the tech industry have also largely relegated women to less senior positions than men, even among employees with similar education.[6] Until women have more equal access to and representation in senior roles within these fields, they will continue to have disproportionately less earning power than men.
It is important to note that, due to the limitations of available data, this analysis conceals intra-group differences that may affect women’s earnings and therefore women’s experiences of the wage gap. For example, AAPI women are far from homogenous, encompassing more than 50 different ethnic groups. National data indicate that Southeast Asian and Pacific Islander women in particular experience much higher wage gaps.[7] In addition, the analysis does not distinguish between cisgender and transgender women. Existing research, including a recent Comptroller Office survey of New Yorkers who identify as LGBTQ, shows that transgender people experience disproportionately high rates of economic insecurity.[8] Transgender women of color in particular face multiple barriers to employment and varying work histories, which would contribute to lower earnings relative to cisgender men and women.
Changing Practices and Valuing Women’s Work
Although this analysis reveals large disparities in pay, particularly in finance and technology, there is reason to be hopeful that the wage gap will shrink in the coming years. Indeed, New York State and New York City have recently taken steps to advance more equitable hiring and employment practices. Private employees in the state now provide the same minimum guarantee of paid family leave, regardless of gender, and employers in New York City can no longer ask prospective employees for their salary histories. It will likely take time for data to reflect this progress, but the City and State, alongside employers in the private sector, can do more to facilitate the conditions needed to achieve pay equity and close the wage gap for good.
Prohibit all employers statewide from asking for candidates’ salary histories.
Local Law 67, which went into effect in October 2017, prohibits New York City employers from asking for or basing compensation on salary history. This is an important and historic step forward. Relying on a job applicant’s prior salary history to set wages can perpetuate prior wage discrimination based on gender and race. Often, this happens unintentionally and without malice, but the practice is all too common. Rather than inquire about a candidate’s previous salary, employers should offer wages that reflect the prospective employees’ merit and the responsibilities of the job. City oversight of reported violations and assessed fines will be critical to bolstering the law’s impact over time. However, in addition, and in the near-term, the Comptroller’s Office urges the New York State Assembly and Senate to pass legislation that would extend the ban to all employers statewide. Four states—California, Delaware, Massachusetts, and Oregon—and Puerto Rico have already passed such a ban, and accomplishing this in New York will help to standardize the practice of salary history blind hiring.
Build diversity in organizational leadership and boards, in particular in the corporate sector.
Achieving pay equity will require action beyond policy. The institutional barriers that impede women’s representation in higher-paying industries and suppress wages in lower-paying, women-dominated jobs are deep-rooted, having been reinforced and reproduced over decades. Changing perceptions of the value of women’s work and capacity for leadership will therefore require long-term investments in culture change. The Comptroller’s Office is committed to increasing diversity in leadership, through its Boardroom Accountability Project and work to expand Minority- and Women-Owned Business Enterprises, and urges public- and private-sector employers alike to commit resources to diversity initiatives that center and create clear leadership pipelines for women and communities of color.
Endnotes
[1] Comptroller’s Office analysis of U.S. Census Bureau, 2016 American Community Survey.
[2] New York City Department of Administrative Citywide Services, New York City Government Workforce Profile Report, Fiscal Year 2016, http://www.nyc.gov/html/dcas/downloads/pdf/misc/workforce_profile_report_fy_2016.pdf.
[3] Center for an Urban Future, Breaking Through: Harnessing the Economic Potential of Women Entrepreneurs (March 2016), https://nycfuture.org/pdf/Breaking-Through.pdf.
[4] Comptroller’s Office analysis of U.S. Census Bureau, 2016 American Community Survey.
[5] Catalyst, Pyramid: Women in S&P 500 Finance (August 22, 2017), http://www.catalyst.org/knowledge/women-sp-500-finance.
[6] Anna Beninger, High Potentials in Tech-Intensive Industries: The Gender Divide in Business Roles (2014), http://www.catalyst.org/system/files/high_potentials_in_tech-intensive_industries_the_gender_divide_in_business_roles_2.pdf.
[7] National Asian Pacific American Women’s Forum, Achieving Pay Equity for Asian Americans and Pacific Islanders (March 2017), https://www.napawf.org/uploads/1/1/4/9/114909119/epd_fact-sheet_final.pdf.
[8] National Center for Transgender Equality, The Report of the 2015 U.S. Transgender Survey (December 2016), https://transequality.org/sites/default/files/docs/usts/USTS-Full-Report-Dec17.pdf; New York City Comptroller Scott M. Stringer, Results of a Survey of LGBTQ New Yorkers (June 2017), https://comptroller.nyc.gov/wp-content/uploads/documents/Results_of_a_Survey_of_LGBTQ.pdf.