
Background
New York City’s bus system faces many performance challenges, with slow speeds and inconsistent service plaguing the commutes of 1.1 million daily riders. In April 2024, the NYC Comptroller’s Office published Behind Schedule, a comprehensive performance review of the bus system. This report found that bus speeds have remained stagnant over the past ten years, one-third of buses fail to show up at their scheduled stops on-time, and over half of bus lines with frequent service experience delays due to “bunching,” or inconsistent spacing between stops.[1] This report card builds on that analysis, using real-time data from the MTA to provide a more detailed look into bus performance, assessing every bus line in the city on these metrics and providing a letter grade to reflect the quality of service that riders regularly experience. The goal of this report card is to inform the City and State’s targeted interventions to improve bus performance citywide.
Metrics and Methodology
Metrics
Table 1 summarizes the three key metrics this report card uses to assign a letter grade to every bus line in the city. The selected metrics reflect the bus performance factors most relevant to riders’ experiences and perception of service quality: average speed, bunching rate, and on-time performance.
Table 1: Bus Performance Metrics
| Metric | Definition |
| Average Speed | A bus’s typical operating speed, weighted by how often it runs and controlled for borough and service type (i.e. express or local). A bus’s average speed reflects dwell time, or the amount of time a bus spends at stops waiting for passengers to board. |
| Bunching Rate (for buses with headways of < 10 minutes) | Two or more buses are “bunched” when observed headways are one-quarter or less of the scheduled headway. If buses on a route are scheduled to arrive every eight minutes, a bus two minutes or less behind the one preceding it is considered bunched. The grading methodology for this report used the inverse (“not-bunched rate”), where a higher value indicated better performance. |
| On-Time Rate (for buses with headways > 10 minutes) | A bus is “on-time” if, at the point of observation, it arrived at a given stop within five minutes of its scheduled arrival time. A bus with an on-time rate of 65% shows up at its scheduled stop within five minutes of the scheduled time two-thirds of the time. |
Letter Grades
This report card uses an A through F scale to grade bus lines, designed to reflect riders’ experiences using the New York City bus system. A bus line’s letter grade is a composite of its performance along the metrics of speed, bunching, and on-time performance. A grade of C indicates that a bus line is performing at an average level for its borough or service type (i.e. express or local). Service on A-grade buses is substantially better than average, while bus lines with a grade of D or F are failing compared to their peers. The Methodology section contains a detailed explanation of grading methodology. A full list of bus lines and their letter grades is available in the downloadable Appendix.
Findings
Assessment of New York City bus lines over three key metrics – speed, on-time rate, and bunch rate – reveals consistent patterns in bus performance across each borough, between different types of bus service, and citywide. Table 2 summarizes borough-wide performance across all three metrics, while Table 3 summarizes performance by type of service.
Table 2: Bus Performance by Borough
| Brooklyn | Manhattan | Queens | Bronx | Staten Island | Citywide | |
| Average Speed (mph) | 7.56 | 6.49 | 8.78 | 7.63 | 12.41 | 9.3 |
| Median Bunch Rate | 15% | 9.5% | 13.2% | 10.7% | 5.5% | 10.6% |
| Median On-time Rate | 69.6% | 73.8% | 70.2% | 72.9% | 71.4% | 70.3% |
Table 3: Bus Performance by Service
| Local | SBS | Express | |
| Average Speed (mph) | 8.12 | 8.77 | 12.48 |
| Median Bunch Rate | 11.7% | 10.4% | 5.9% |
| Median On-time Rate | 71.5% | 70.5% | 65.1% |
Major Findings
- A majority of buses are performing at “below average” standards: 56% of bus lines (186 out of 332) received a grade of D or lower, meaning that they run at speeds significantly below the borough-wide average, are more likely to experience bunching, and consistently fail to arrive at scheduled stops on-time. By comparison, only 27 lines (8%) received a B or higher. Only seven lines received an A grade.
- Almost three-quarters (73%) of Manhattan buses have grades of D or F, worse than in any of the other four boroughs. This is due largely to heavy traffic in Manhattan, where some buses run at speeds as low as 5 mph.
- 15% of Brooklyn buses are bunched, a rate considerably higher than the citywide average of 10.6%. This means that 15% of buses in Brooklyn fail to maintain even spacing along their routes, creating unreliable service and wait times regularly in excess of 10 minutes for riders on lines where average wait times should be no more than five minutes. Of the 14 bus lines with bunching rates of 20% or more, seven are in Brooklyn. Riders of these lines would experience long wait times on at least one out of every five trips.
- Express buses have higher average speeds but a much lower on-time reliability rate than the system overall. Many express buses travel across bridges, highways, and tunnels, allowing them to reach speeds most local buses cannot. However, they fail to reach stops at their scheduled times compared to local or SBS buses. This is problematic for riders given that express buses are less frequent than other types of service. All of the ten bus lines with on-time performance rates below 50% are express buses.
- SBS lines perform slightly better than local and express buses overall. 16% of SBS bus routes received A or B grades, compared to just 8% of routes overall. SBS buses also have higher average speeds and on-time performance rates, as well as lower bunching rates, than local routes. This is likely attributable to stop consolidation and all-door boarding on these routes, as documented in assessments of New York City’s bus priority measures.[2]
Is congestion pricing improving bus performance?
Data collected from the MTA before and after the implementation of congestion pricing in January 2025 provides insight into the program’s impacts on bus performance. 106 bus lines operate at least partially in the Central Business District (CBD). Data on speed, on-time performance, and bunching for these lines, collected for five months before and after implementation, demonstrates measurable improvements. Between January 1 and June 1, 2025, reliability scores for buses operating in the CBD improved by 9.2% compared to the five months preceding implementation. Express buses account for much of this effect (Table 4). Buses operating outside the congestion zone did not see effects at the same scale. Speed improvements were modest across all lines, likely due to buses maintaining schedules created prior to the program’s enactment.
Table 4: Congestion Pricing Impacts on Bus Performance
| On-time Performance | Bunching Rate | Speed (mph) | ||||
| Bus Type | Before | After | Before | After | Before | After |
| Express | 58.0% | 69.2% | 8.6% | 7.1% | 12.2 | 12.4 |
| Local | 68% | 72.1% | 12.6% | 10.2% | 6.5 | 6.5 |
| Overall | 60.6% | 70% | 9.9% | 8.1% | 10.7 | 10.9 |
Next Steps for Performance-Based Planning
There is no shortage of plans to address the performance challenges facing New York City’s bus system, and the interventions required to improve service are well-established. Transit signal priority, bus network redesigns, all-door boarding and fare-free service pilots, and the creation of dedicated bus lanes have been repeatedly recommended by transit experts, advocates, and oversight bodies—and the Comptroller’s Office. Despite this, the City has made limited progress in implementing these measures at a scale sufficient to deliver meaningful improvements, and riders continue to experience slow and unreliable service.
In 2018, the NYC Department of Transportation’s Better Buses plan established a performance target of increasing bus speeds by 25% citywide—from approximately 8 to 10 miles per hour. That target has since been abandoned, and the lack of progress is evident: seven years later, average speeds for local buses remain at about 8 miles per hour. While the MTA publishes extensive performance data, it rarely connects major interventions—such as network redesigns, installation of protected bus lanes, and expansion of transit signal priority—to specific, time-bound performance goals.
Independent analyses of NYCDOT’s bus priority program found mixed results. A 2025 report assessing corridor-level speed impacts of different bus lane types, How Much Faster Are We Moving, found that some bus lanes produced speed gains of up to 33% while others saw only modest improvements, or even speed reductions.[3] Bus line grades also varied across lines that ran along bus lanes or used SBS features, with most SBS lines (12 out of 19) receiving Cs.
Improving bus service cannot be measured solely by the completion of policy initiatives or infrastructure projects; it must be reflected in measurable improvements that riders can experience in their day-to-day lives. Without clearly defined targets, it is impossible for the public to assess whether these initiatives are delivering the intended results. This report card is intended to serve as a model for how the City and State should hold themselves accountable to service improvement goals, clearly illustrating where service is underperforming and providing a framework for how to move toward demonstrable outcomes.
To achieve sustained and equitable improvements in bus service, the City and MTA should immediately establish performance-based goals, redesign its public reporting to link interventions with measurable outcomes, and commit to meeting these benchmarks.
Potential performance targets could include:
- Increasing speeds by 15% citywide, moving 90% of C-grade bus lines to B-grade or better;
- Reducing the average bunching rate on high-frequency bus routes from 10.6% to 5%; and
- Improving reliability on the 40 bus lines performing worst on bunching and on-time performance metrics.
Acknowledgements
This report was authored by Sindhu Bharadwaj, Senior Policy Analyst for Transportation and Infrastructure. Nathaniel Cain, Summer Intern, led the underlying analysis with support from Dan Levine, Senior Data Analyst & Products Manager, and Robert Callahan, Director of Policy Analytics. Archer Hutchinson, Creative Director, led the graphic design and report layout with support from Addison Magrath, Graphic Designer.
Methodology
Data
This report card used live data from MTA’s Bus Time feed collected between June 17, 2024 and June 12, 2025, archived at five-minute intervals, to calculate on-time performance and bus bunching metrics. This data reports each bus’s location, distance along its route, and anticipated time at its next stop based on GPS position. Speed data came directly from MTA Open Data’s Bus Route Segment Speeds table, from June 1, 2024 to June 20, 2025. This table shows how fast buses are traveling between pairs of subsequent timepoints (the major stops on a bus route) for every bus line in the system.
Grading
Reliability
Bunching rates and on-time performance serve as complementary metrics to evaluate overall bus reliability. A combination of the two metrics (“reliability”) accounts for two-thirds of a bus line’s final grade.
For periods when a bus is scheduled to arrive at least once every 10 minutes, its bunching rate is the most relevant measure of reliability. On-time performance is applicable at times when buses are scheduled to arrive more than 10 minutes apart. Each bus line’s reliability score is a weighted average of these two measures, proportional to the number of hours of the week when that line has frequencies better or worse than every 10 minutes. These rates were weighted according to the proportion of short and long headways, respectively, giving more influence to the metric most relevant to the typical headway length. The resulting reliability scores were then standardized by converting them to z-scores. Reliability measures are similar across boroughs and bus types, so for these measures, all buses lines are compared to all other bus lines.
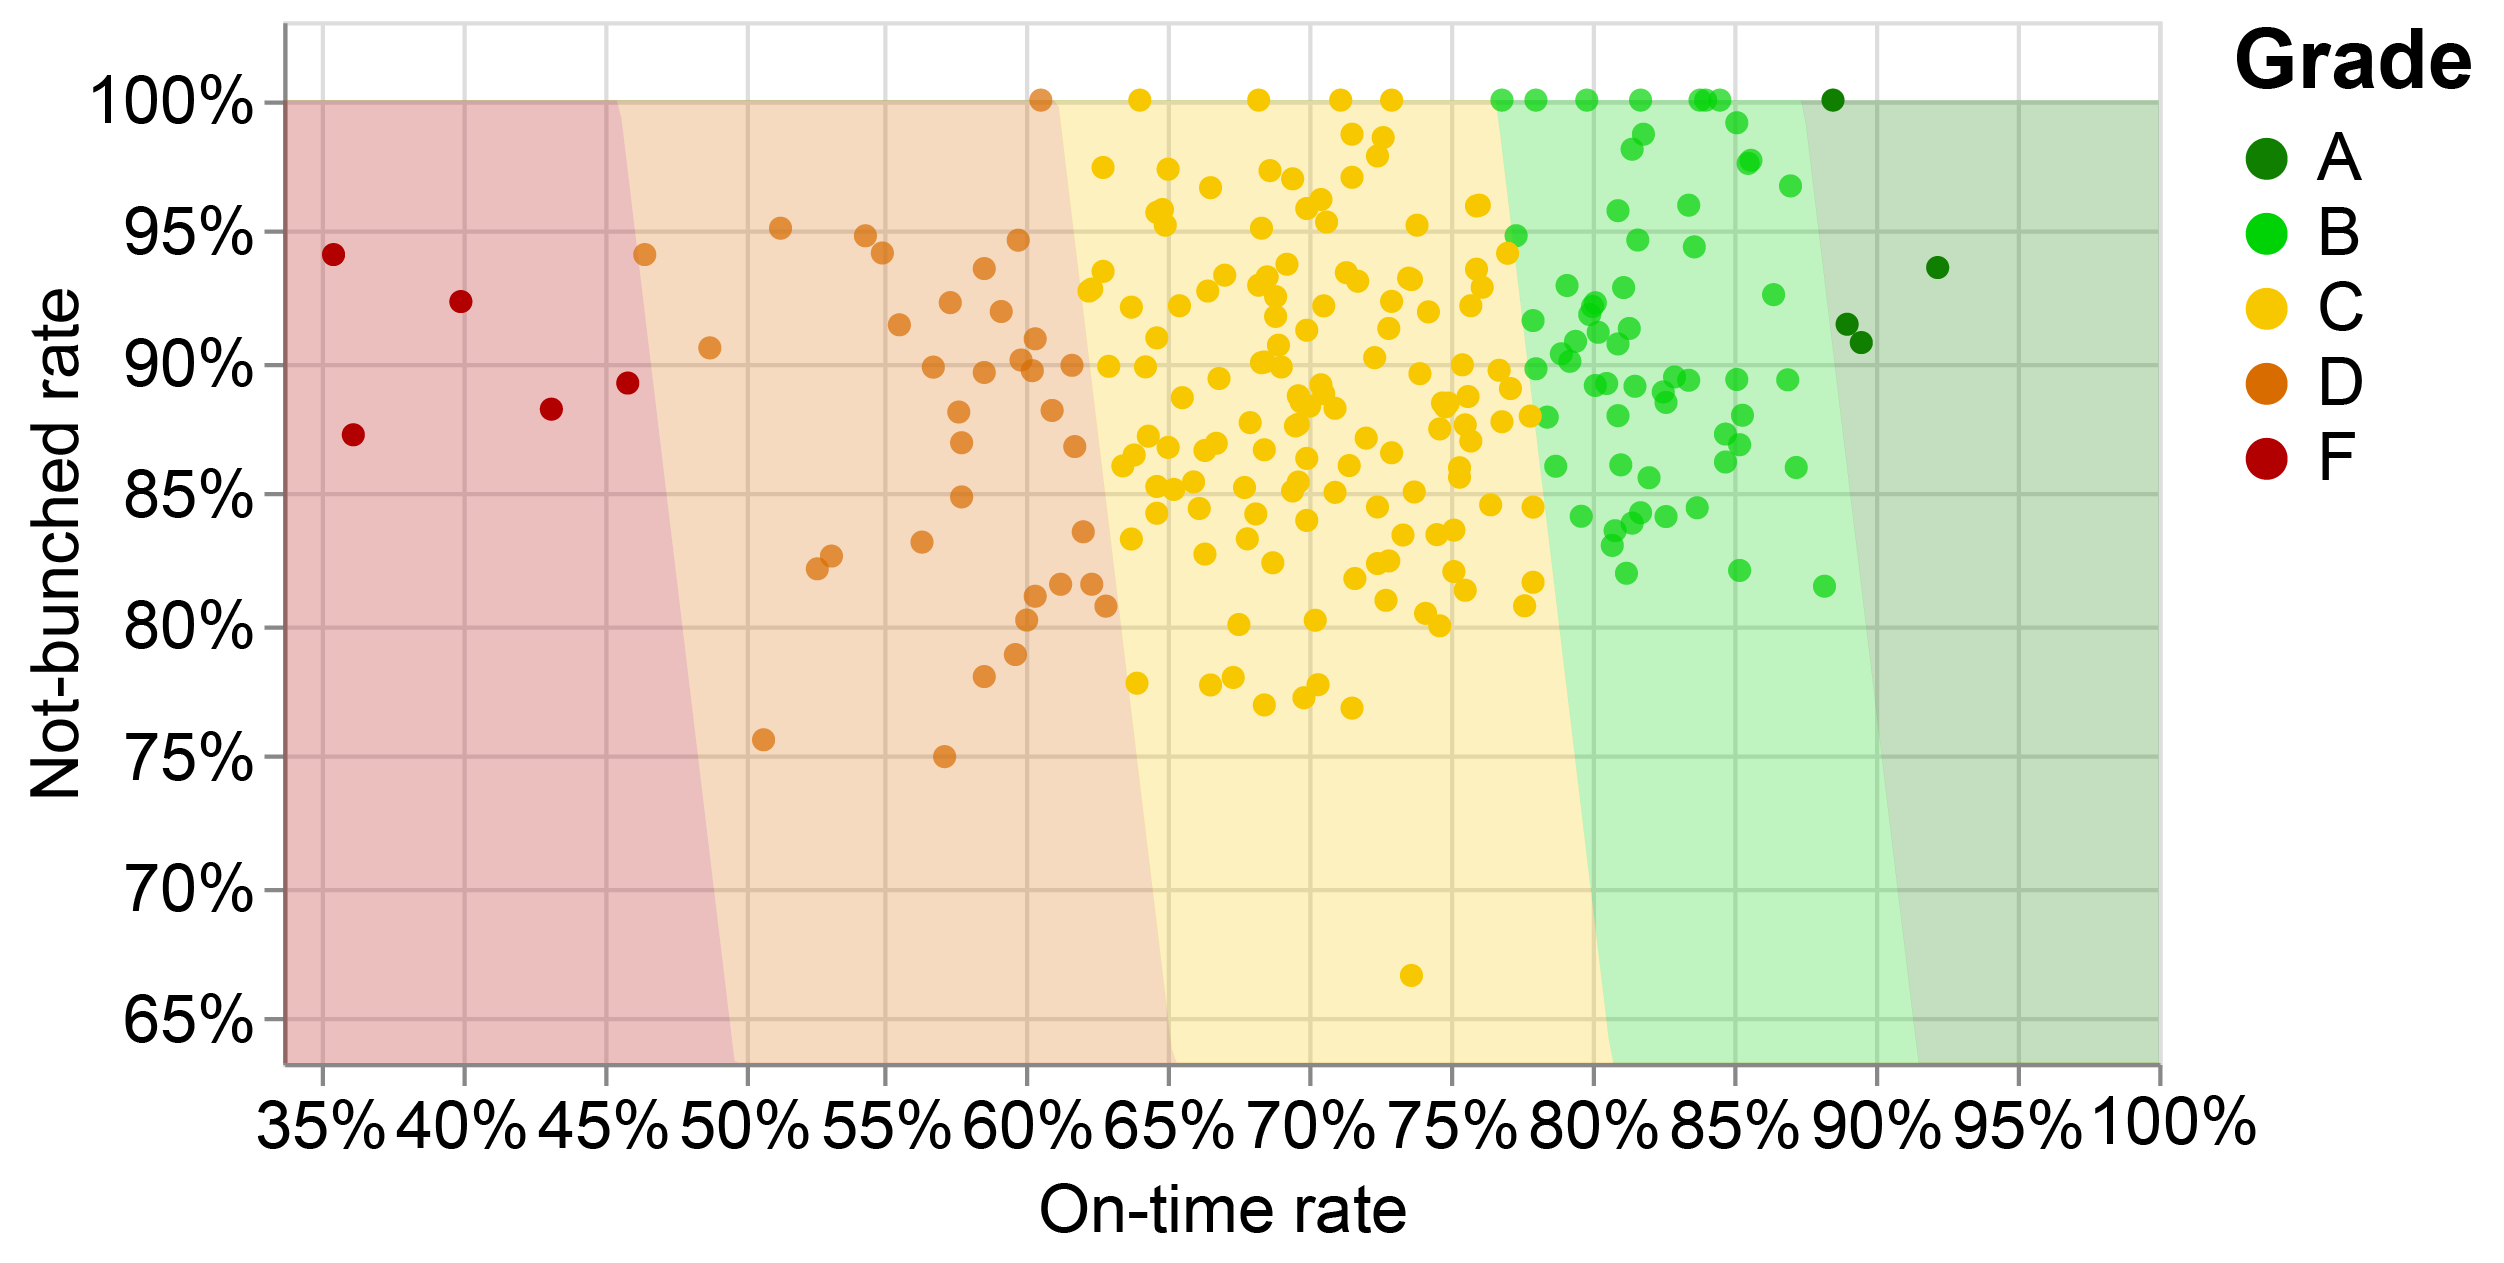
Figure 1 plots each bus line as a point showing that line’s observed on-time and not-bunched rates. The shaded regions indicate the approximate boundaries between letter grades. These boundaries between grades are for a typical bus line. Note that the slope of these boundaries are in fact different for each line, because they are based on the weighting between the two components (on-time rate and bunching rate), which in turn is based on each line’s schedule (the proportion of hours per week it is scheduled to have better-than-10-minute headways).
Figure 1: Bus Reliability Grades
Average Speed
For average speed, buses were divided into six categories: Express, or local routes within Brooklyn, Manhattan, Queens, Staten Island, and the Bronx. Within each group, z-scores were calculated for each bus. This approach creates separate speed distributions by group, allowing each bus to be evaluated relative to what is typical for its service area, rather than against citywide norms. This controls for substantial variation in average bus speeds across boroughs and between local and express lines. No such borough-level variation was observed for reliability metrics, so those were evaluated using a single citywide distribution.
Final Grades
A weighted average of the two Z-scores was then computed for each bus line: 33% weight given to speed, and 66% weight given to reliability. This average z-score was then normalized and rescaled to a 4.0 academic GPA scale. This yields a bell-curve style grade reflecting overall performance. Within the bell curve distribution, letter grades were assigned using the following thresholds:
| Grade | Bell-Curve Grade |
| A | >= 3.7 |
| B | 3.0 – 3.7 |
| C | 2.0 – 3.0 |
| D | 1.0 – 2.0 |
| F | <1.0 |
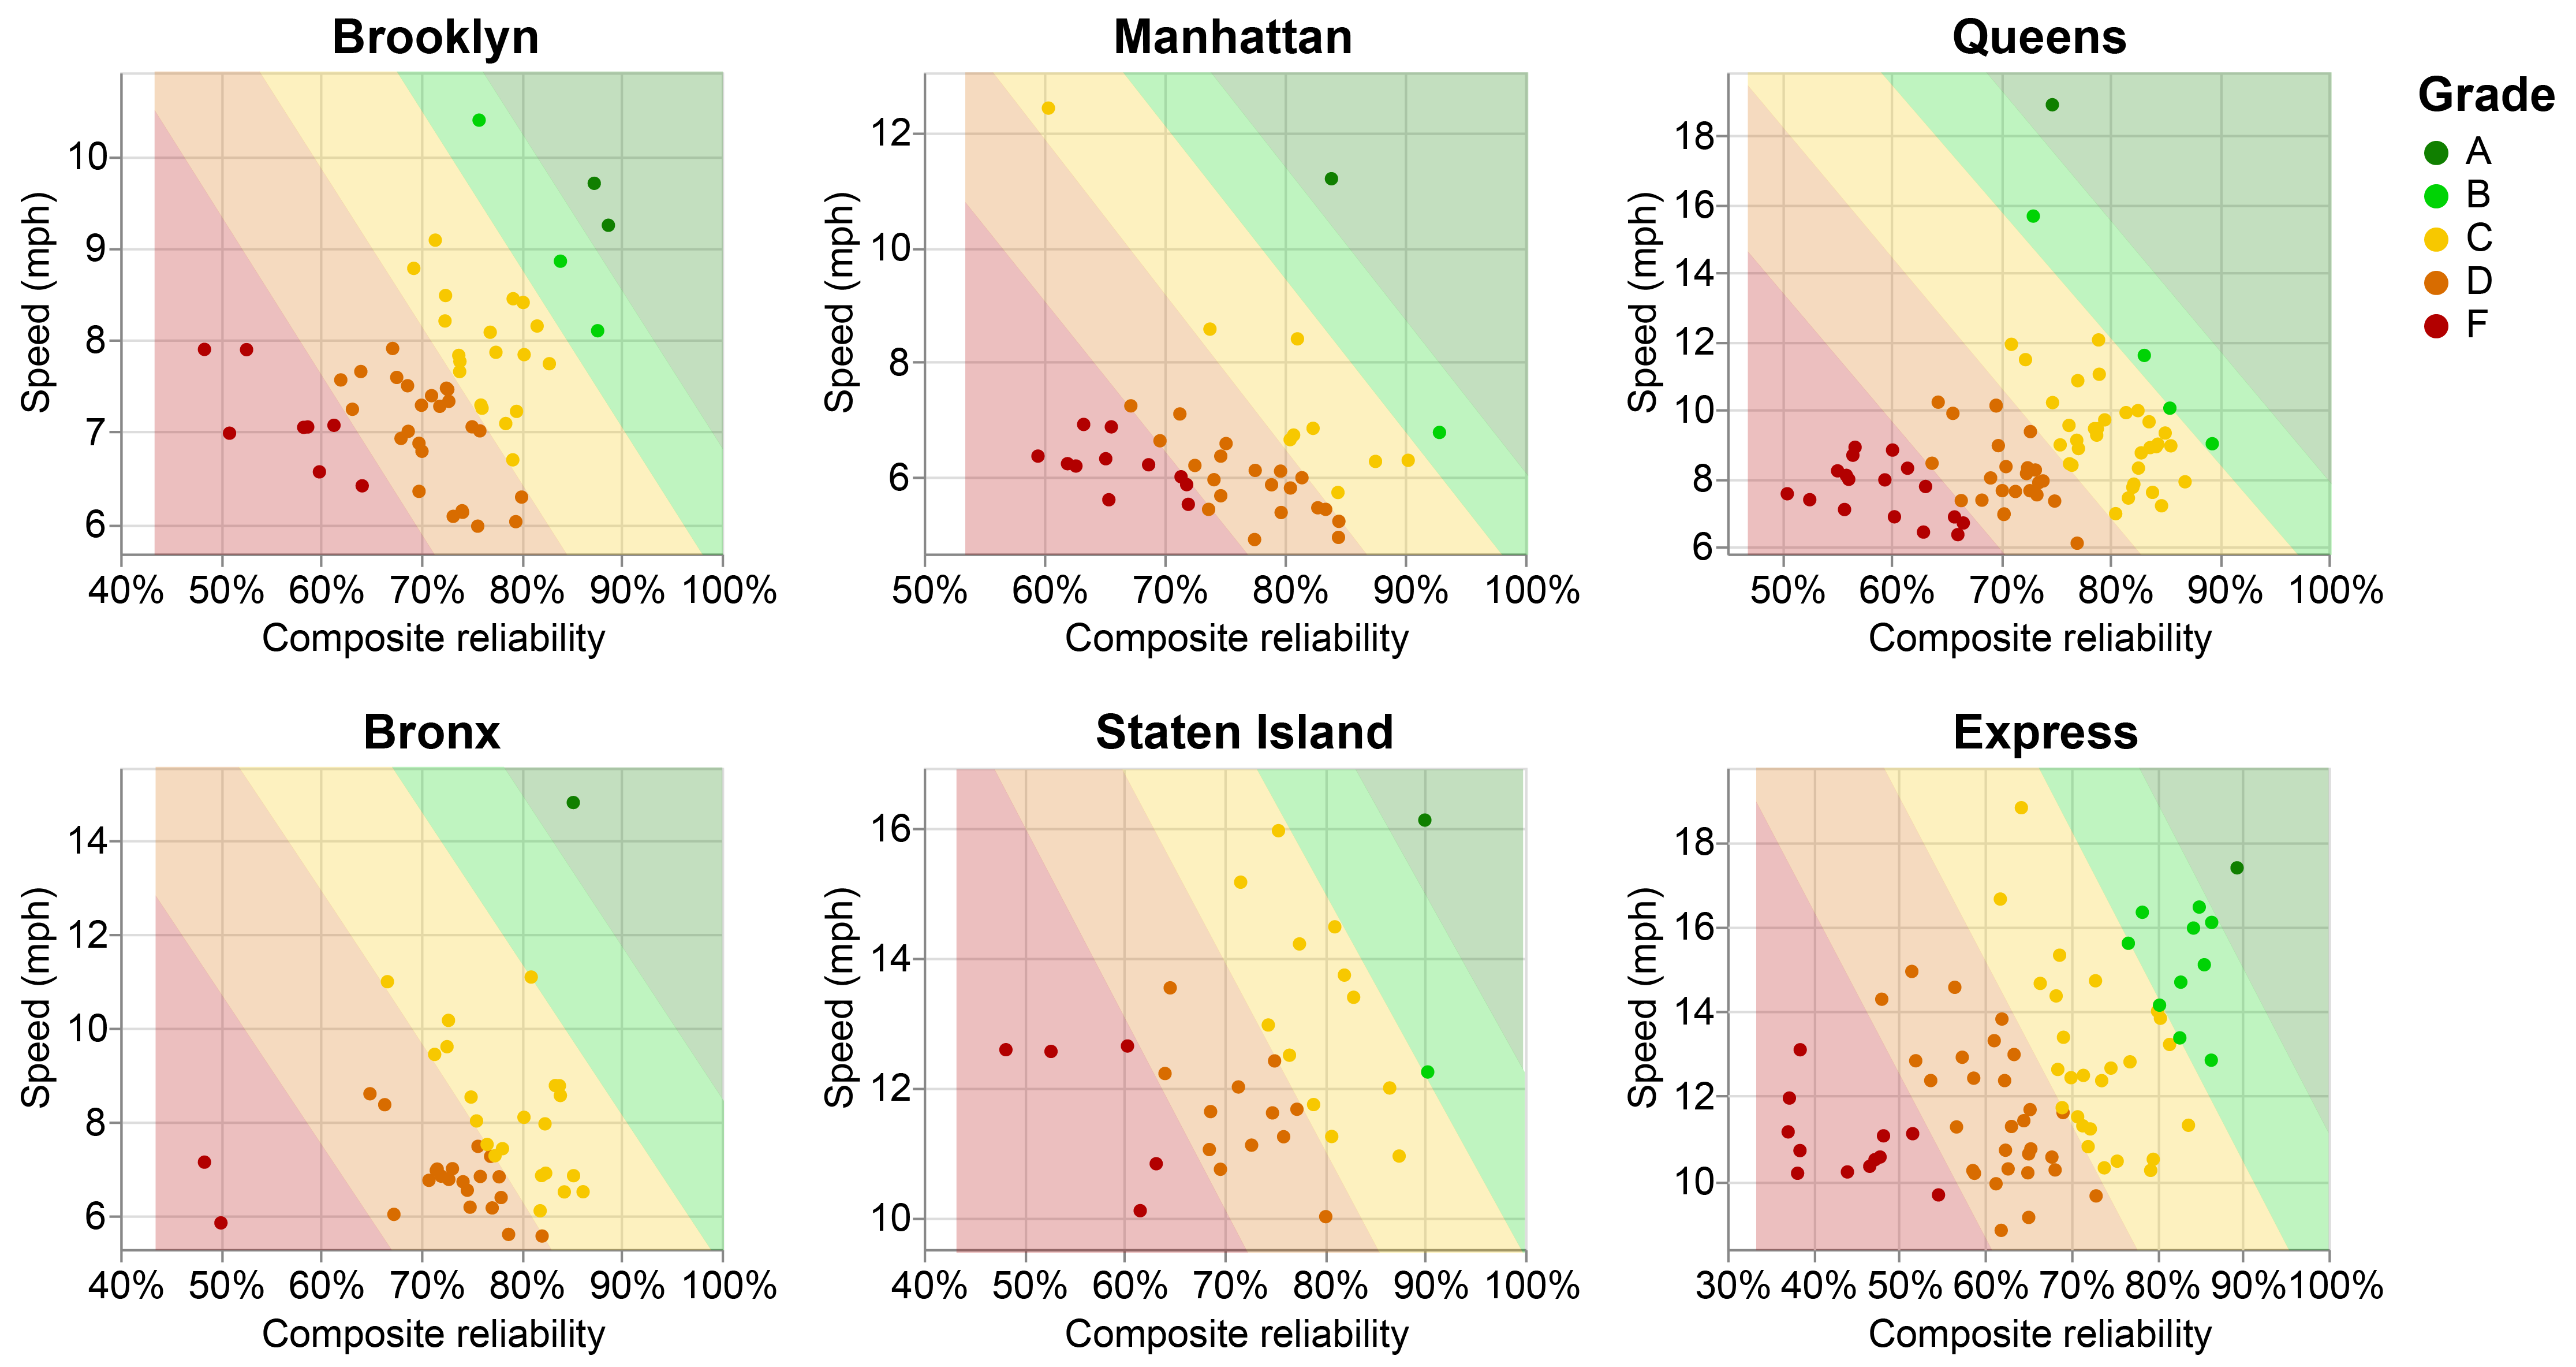
The final grades for each bus line, combining that line’s speed and composite reliability, are plotted on Figure 2 below.
Figure 2: Overall grades (speed and reliability) by borough/type of service
Bus Report Card Search
Curious about your bus line’s performance? Use the search bar below to view your bus line’s report card.
Endnotes
[1] Office of New York City Comptroller Brad Lander. (2025, April). Behind Schedule. https://comptroller.nyc.gov/reports/behind-schedule-how-new-york-citys-bus-system-slow-rolls-riders/
[2] People Oriented Cities. (2025). How Much Faster Are We Moving? https://peopleoriented.org/nyc-bus-priority
[3] ibid