
Key Findings
Vacancy Rates Have Risen
The retail vacancy rate has increased overall in the last decade, even as the City has continued to grow through new development. Vacancy rates vary greatly across the City, however:
- In 2017, the city-wide retail vacancy rate was 5.8 percent, up from 4.0 percent in 2007.
- Vacant retail space in New York City increased by 5.2 million square feet over the last decade.
- Although Manhattan has neighborhoods with extensive empty retail space, retail vacancy rates are highest in outer borough neighborhoods with large retail spaces, such as malls – notably on Staten Island, where the vacancy rate is almost 11 percent.
Changing Use of Retail Space as Internet Shopping Grows
The rise of internet retailing has changed the mix of retail space away from sellers of goods and toward service providers, including restaurants and bars. Nationally, Amazon sales alone rose from $14.8 billion in 2007 to $177.9 billion in 2017. In New York City, the number of retail outlets rose by nearly 20 percent over the same period – but the number of personal services establishments rose by nearly 50 percent, and bars and restaurants by 65 percent
Online sales have been a significant driver of outer borough retail vacancy in particular. Regression analysis shows Amazon sales are positively, and statistically significantly, associated with retail vacancy, driving vacant retail square footage in New York City higher by nearly one percentage point between 2007 and 2017
Rising Rents Have Contributed to Rising Vacancy Rates
Retail rents rose by 22 percent on average citywide between 2007 and 2017. In some parts of the City, the rate of growth was much more rapid. Average rents doubled over the period in some neighborhoods, such as Soho (zip code 10012), while falling in others – for example in the Financial District.
Regression analysis shows rising retail rents are a significant driver of retail vacancy. Controlling for other factors, a one percent increase in average retail rents is associated with 0.33 percent increase in vacant retail square footage.
Property taxes paid by retail tenants as part of their rent are also an increasing burden, doubling over the last ten years to over $2.2 billion in 2017, and accounting for a rising share of total retail rent burdens. In 2007, retail tenants paid $1.1 billion in property taxes, equal to about 20 percent of total retail rents paid. The $2.2 billion in property taxes paid by retail tenants in 2017 accounted for 23 percent of total retail rents paid.
Regulatory Hurdles Impede Turnover of Space
Regulatory burdens – especially those that may be associated with a change of use from selling goods to a personal services use or bar or restaurant – are also associated with greater retail vacancy.
The share of Department of Buildings alteration permits unapproved after 30 days is a significant driver of retail vacancy. A one percent increase in this metric is associated with a 3.28 percent increase in vacant retail square footage. Although this metric fell sharply between 2007 and 2018, it increased substantially in 2018, particularly outside Manhattan.
The average number of days it takes to get a liquor license is also a significant driver of retail vacancy. A one percent increase in this measure is associated with a 0.17 percent increase in retail vacancy. In 2018, liquor license approval times increased city wide from roughly 50 to about 75 days, an increase of nearly 50 percent.
Actions to Reduce Retail Vacancy
Creating a more small business-friendly city would also help address the changing face of streetfront retail space. The Comptroller’s 2016 Red Tape Commission spelled out some sixty steps the City should take to help improve the city’s small business environment, including separating the enforcement and permitting functions of the Department of Buildings, improving the streetscape through prompt removal of unused sidewalk scaffolding, improved street parking, and a more business-friendly approach by City agencies.
In addition to those and other steps outlined in the Commission’s report, the following actions could help directly address high retail vacancy rates:
Provide tax incentives for independent merchandise retailers in high-vacancy retail corridors. The City should provide tax credits for independent retailers to help lower the cost of space in retail corridors with persistently high vacancy rates.
Create a single point-of-contact customer service for businesses occupying retail space. To expedite and facilitate a change in use of retail space from goods to personal services or an eating or drinking establishment, the City should create a multi-agency task force staffed with single point-of-contact customer service representatives to assist new businesses by coordinating and expediting the necessary regulatory actions. The City should also waive permitting and inspection fees for businesses taking over existing space that has been vacant for a given period of time.
Incorporate retail demand into neighborhood planning. The City should require an analysis of retail demand in any major development proposal or rezoning, to ensure that the right amounts and types of retail space are incorporated into the planning process.
Introduction
Concerns about the state of retail in New York City have been widespread at least since the Great Recession of 2008-2009. Many a New Yorker has bemoaned the loss of a beloved local store, replaced by a bank branch or pharmacy chain – or by nothing at all. Vacant storefronts are not only a blight on neighborhoods, but represent a loss of potential economic activity, including lost job opportunities and income for New Yorkers, as well as lower tax revenues – as much as $185 million a year in sales tax receipts, for example. Debates over what should be done have been fueled by numerous analyses, press stories, and personal anecdotes.[1]
Numerous theories have been put forward to explain the changing face of retail across the City. The rise of Amazon and internet shopping has put pressure on traditional retailers across the country, and been blamed for the loss of retail in New York City as well. Others have pointed the finger at rising rents and landlord profiteering, with owners driving out tenants with unaffordable leases. The real estate industry has argued that retail rents increases cannot be driving retail vacancy, arguing that asking rents are in fact falling.[2] Landlords, in turn, have pointed to the regulatory burdens of City agency inspections and permitting, community board and Landmarks Preservation Commission approvals, and other bureaucratic barriers to starting a business. Many businesses have warned of the impacts of increases in New York City’s minimum wage, and the effect it would have on their ability to stay in business.[3] The Department of City Planning, in a recently-released analysis of twenty-four retail corridors across the city, reached the conclusion that “storefront vacancy may not be a citywide problem.”[4]
In a city that is constantly innovating and changing by industry, and growing and gentrifying across neighborhoods, it is difficult to integrate the growing collection of individual experiences, perspectives, and anecdotes into a comprehensive picture. In a city of 8.5 million people and 300 square miles, observations from one, or even many, corners of Manhattan offer at best partial insights. What has been lacking, until now, is a comprehensive, data-driven, analysis of New York City’s retail landscape.
This report, by New York City Comptroller Scott Stringer, fills that void using a range of unexplored and underutilized data sources. Using administrative data from New York City property tax filings, this report provides a comprehensive measure of the vacant retail square footage, and the retail vacancy rate, for every neighborhood in New York City from 2007 to 2017 as well as average retail rent per occupied retail square foot. Using commercial leasing data, this report also analyzes net effective rents on new retail leases across New York City from 2013 to present to examine changing trends in asking rents.
This report shows how retail is growing and changing in New York using data on employment, wages and establishments from the U.S. Bureau of Economic Analysis, as well as merchant data from MasterCard. Finally, using data from the New York State Liquor Authority on liquor license approvals, and from the NYC Department of Buildings on alteration permit approvals, we examine how regulatory hurdles can impede efficient turnover of vacant retail space.
Our findings are reported in a series of charts and tables with accompanying text.
The phenomenon of vacant retail space varies greatly across the city from neighborhood to neighborhood, and the simultaneous interaction of several different factors that could affect vacancy rates – from construction and leasing of new space, to rising asking rents, changing uses of storefronts for new types of businesses, and government regulations – makes a simple explanation elusive. This report also provides, in an appendix, the results of a multivariate regression analysis that attempts to integrate several explanatory factors into a single analytic framework.
Finally, we provide in-depth profiles of ten neighborhoods across the City, selected based on previous reporting and analysis as well as our own examination of neighborhoods exhibiting high vacancy rates or striking changes in their retail profile.
Retail Vacancy Rates Have Risen Citywide
Chart 1. Retail Vacancy Rates Have Risen Citywide
Source: Office of the Comptroller from Department of Finance RPIE filings.
The citywide retail vacancy rate has increased substantially, from a low of 4.0 percent in 2007 to 5.8 percent in 2017 — a period covering the last days of the boom before the great recession, through the downturn and subsequent recovery, and the rise of internet shopping. The vacancy rate, measured as vacant retail square feet divided by total retail square feet, rose substantially citywide in the wake of the Great Recession – from 4.0 percent in 2007, to 5.6 percent in 2012. A slight decline was reported in 2014 and 2015, which could in part have derived from better reporting from property owners to the Department of Finance, but the rate resumed its growth and rose to a high of 5.8 percent by 2017.
The vacancy rate rose across all five boroughs. Retail vacancy rates rose most dramatically in Staten Island, from 4.3 percent in 2007, up to nearly 11 percent in 2017. Staten Island, Queens, and the Bronx consistently had vacancy rates above the citywide average.
Although the vacancy rate in Manhattan was consistently below the citywide average, it rose steadily from 3.3 percent in 2007 to 5.2 percent in 2017.
In comparison, the vacancy rate in Brooklyn rose from 4.3 percent in 2007, to a peak of 5.8 percent in 2012, and has since fallen to 5.1 percent. Similarly, the vacancy rate in the Bronx peaked at 7.4 percent in 2010, and has since fallen closer to the citywide average. In both cases, population growth and gentrification have likely helped to improve the retail outlook.
Reported vacant retail space roughly doubled over the last decade, rising to 11.8 million square feet in 2017, up from 5.6 million square feet before the great recession. (About 1 million square feet of this increase in reported vacant retail square footage is attributable to better reporting due to increased penalties on property owners for failing to file Real Property Income and Expense (RPIE) statements with the Department of Finance, beginning in 2014.[5])
Reported vacant retail in Staten Island increased the most rapidly, from about 350,000 square feet in 2007 to about 1.1 million square feet in 2017. Reported vacant retail square footage in Manhattan, which accounts for just over one-third of the citywide total, doubled, from 2.1 million square feet in 2007 to about 4.3 million in 2017. Reported vacant retail square footage roughly doubled in the other boroughs as well, increasing from 830,000 square feet to 1.6 million in the Bronx, from 1 million to 2.1 million in Brooklyn, and 1.2 million to 2.7 million in Queens.
The Highest Vacancy Rates are Outside the Manhattan Core
Chart 2. Highest Vacancy Rates are Outside the Manhattan Core
Source: 2017 RPIE Filings, New York City Department of Finance
Neighborhoods with the highest vacancy rates are in the outer boroughs. While some particularly retail-intensive Manhattan neighborhoods, such as Greenwich Village/Soho (10013), do have some of the largest vacant square footage totals in New York City, they do not have vacancy rates substantially higher than the citywide average (Chart 2).
Staten Island zip codes are among the highest in both vacant square footage and vacancy rates. Spatially, rising vacancy is more difficult to characterize. As shown in Tables 1 and 2, between 2007 and 2017 increases in retail vacancy were widespread, with some of the most dramatic increases in the outer reaches of the Bronx, Queens and Staten Island. Although increases in vacancy rates were widespread, zip codes with the greatest increases in vacancy rates were generally outer borough areas with suburban style malls.
Table 1. Zip Codes with Most Vacant Square Footage in 2007 and 2017
Table 2. Zip Codes with Highest Vacancy Rates in 2007 and 2017
Growth of Internet Shopping Has Changed the Usage of Retail Space
Chart 3. “Experiential” Use of Retail Space Rising Faster than Traditional Retail
Source: Quarterly Census of Employment and Wages 2006 to 2017 (2006 = 100)
The growth of online retail impacted the mix of businesses making use of retail space, with more businesses selling meals and services, and relatively fewer selling goods.
Increasingly, Americans shop on-line. In 2007, Amazon.com had $14 billion in sales and 17,000 employees. By 2017 those figures had risen to $177 billion in sales and over half a million employees. Internet sales accounted for less than one percent of total U.S. retail sales in 2000, 5 percent of total sales in 2012, and over 10 percent of total sales in the first quarter of 2019.[6]
The rise in on-line shopping has led to a change in how storefront retail space is used. Increasingly, retail space is used for restaurants and bars, and for personal services – everything from barbers to dry cleaners, nails salons to exercise studios.
Between 2006 and 2017, the number of New York City retail establishments increased by 19 percent. In contrast, establishments providing personal services increased by almost 50 percent in New York City while the number of bars and restaurants rose 65 percent. A similar pattern is evident in employment. Retail employment in New York City grew by 22 percent, while employment in bars and restaurants grew by 45 percent, and personal services employment grew by nearly 75 percent.
Chart 4. NYC’s Changing Retail Mix: More Selling Food and Services, Fewer Selling Goods
Source: Mastercard
Data from Mastercard shows the number of New York City merchants selling goods, as opposed to services, actually declined starting in 2012 (Chart 4). Notably, merchants selling both clothing and general merchandise declined between 2012 and 2018, despite the city’s growing population.[7] Over the period, bars and restaurants constituted the largest category of retail merchants in the city, with about 17,000 processing Mastercard transactions in 2018. It was also one of the faster growing categories, with merchant growth of almost 40 percent since 2012.
The fastest growing categories of merchants were grocery stores, laundry services and specialty food stores, with New York City merchants growing by over 80 percent since 2012. These are merchant categories highly correlated with population growth and income growth.
Chart 5. Growth in Merchant Counts by New York City Neighborhood, 2012 to 2018
Source: Mastercard. For neighborhood definitions, see Appendix.
Geographically this growth has been very unevenly distributed, with merchants growing fastest outside Manhattan (Chart 5). The Bronx is booming, with merchant counts rising by 55 percent since 2012. Uptown Manhattan and Harlem are close behind, with merchant counts increasing by nearly 43 percent since 2012. In contrast, there was almost no growth in merchant counts in Midtown and Downtown Manhattan over the period.
Note that some of the growth in merchant counts could be attributable to more widespread use, or acceptance, of credit and debit cards.
Rising Rents Have Contributed to Retail Vacancy
Chart 6. Average Retail Rents Continue to Rise
Source: RPIE Filings 2007 to 2017. Average rents are equal total annual retail rental income divided by total occupied retail square feet. Rents in nominal dollars.
Average retail rents rose across most of New York City between 2007 and 2017 (Chart 6). Citywide, over this period average retail rents rose from $42 per square foot to $51 per square foot, an increase of roughly 22 percent. Average rents rose especially dramatically in many zip codes with high retail rents to begin with, doubling from $60 to $126 in Soho (10012), and from $79 to $146 on the Upper East Side (10021), an increase of 87 percent.
Despite these widespread increases, retail rents declined even in nominal terms in 58 New York City zip codes between 2007 and 2017. Of these 7 were in Manhattan, 5 in the Bronx, 16 in Brooklyn, 24 in Queens, and 5 in Staten Island.
Chart 7. Retail Rents on New Manhattan Retail Leases are Trending Downward
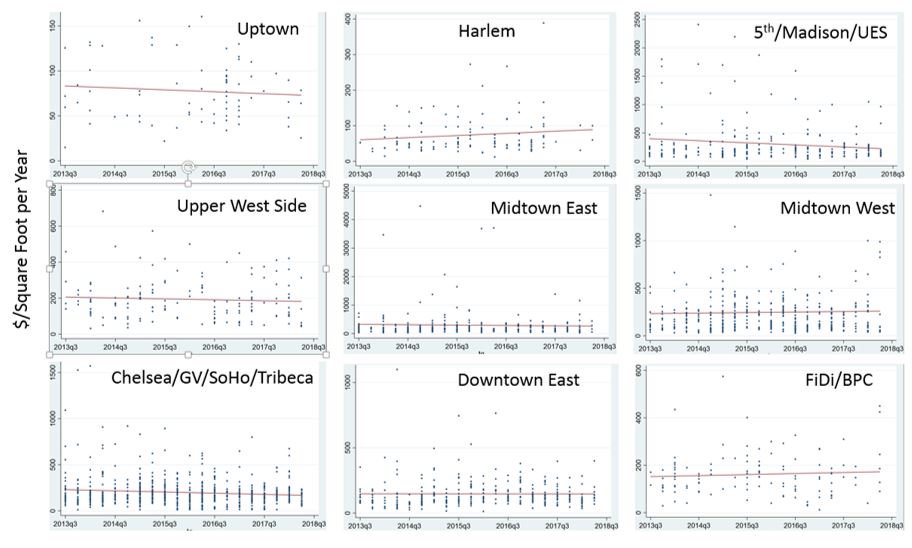
Source: Compstak.com.
Note Each dot in the figure represents the net effective rent (rent net of concessions, givebacks, free month’s rent, etc.) on a new retail lease as reported by users of Compstak Reported on a quarterly basis from the third quarter of 2013 through the third quarter of 2018. Regression lines in red show the general trend of retail rents for new leases. Note that scale of vertical axis differs by neighborhood.
Compstak data on new retail leases confirm that Manhattan retail tenants on average continue to pay more per square foot than retail tenants in outer boroughs, but there is some evidence rents on many new leases are coming down (Chart 7). Although the patterns are difficult to characterize, there is evidence of a trend toward lower rents on new leases in high end areas such as prime retail corridors on the Upper East Side, driven primarily by a decline in rents at the highest end. For many areas of Manhattan, the highest rents in the Compstak data were recorded several years ago.
Because rents in many neighborhoods have been rising for 10 years or more, however, retail tenants renewing 10 year leases will find little relief from modest declines in retail rents on new leases.
Figure 8. Retail Rents on New Outer Borough Retail Leases are Trending Upward
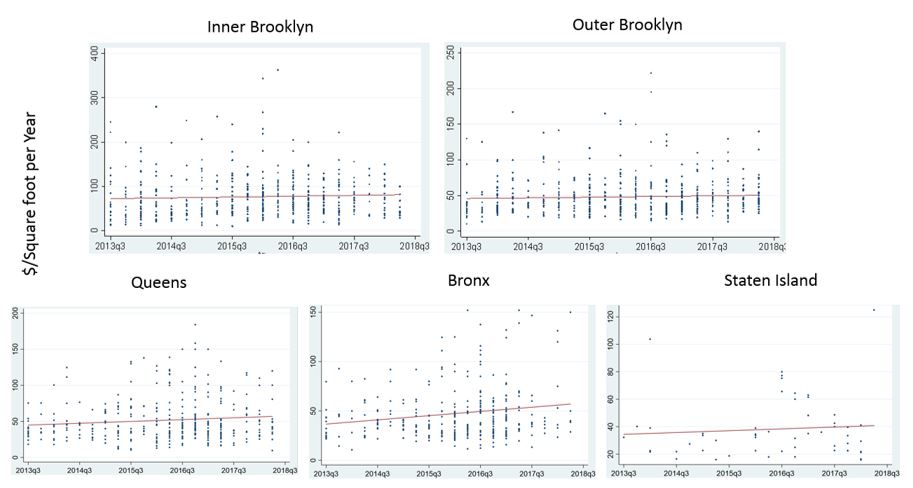
Source: Compstak.com.
Note Each dot in the figure represents the net effective rent (rent net of concessions, givebacks, free month’s rent, etc.) on a new retail lease as reported by users of Compstak Reported on a quarterly basis from the third quarter of 2013 through the third quarter of 2018. Regression lines in red show the general trend of retail rents for new leases. Note that scale of vertical axis differs by neighborhood.
Outside Manhattan, average retail rents are lower, but rents on new leases are rising (Chart 8). Unlike many areas of Manhattan, the highest recorded retail rents in the outer boroughs are likely to be recent. Although retail rents are much lower outside of Manhattan, reflecting differences in the incomes and numbers of people living, working and visiting there, the general trend is toward higher retail rents on new leases in the outer boroughs. This is especially true in the Bronx, where both high end and low end retail rents are rising.
Chart 9. Property Tax Payments by Retail Tenants Have Doubled over the Last Decade
Source: 2017 RPIE Filings, New York City Department of Finance
Property tax payments by retail tenants doubled in aggregate over the last decade and accounted for an increasing share of total rents paid (Chart 9). Retail tenants paid $1.1 billion in property tax in 2007, equal to about 20 percent of total retail rents paid. This figure rose to nearly $2.3 billion in 2017, equal to roughly 23 percent of total retail rents paid.
Property taxes are commonly perceived as a responsibility of landlords rather than tenants, but many retail leases, particularly in Manhattan, include clauses making retail tenants contractually obligated to pay some or all of the property tax on the property they lease. Analysis of Compstak data on roughly 5,000 retail leases does not show any clear trend toward an increased prevalence of triple net or other leases making retail tenant responsible for property taxes. This suggests that increased property tax payments by retail tenants are likely driven by increasing assessed values, and rising property tax bills, on retail property.
Regulations Can Increases Retail Vacancy
Some observers have argued that high rates of retail vacancy may be driven by excessive regulation, such as the Landmark status of retail buildings, or slow or highly-conditioned approvals by local community boards, or permitting and approval processes of City agencies, all of which could add to the time and expense of reconfiguring or updating retail space.[8] To examine this hypothesis, we considered several measures of regulatory burden, including time to approve liquor license applications by the State Liquor Authority; delays in approval of building alteration permits by the City Department of Buildings; and retail located in buildings or historic districts designated by the City’s Landmarks Preservation Commission.
Chart 10. Average Liquor License Approval Times Rose in 2018
Source: New York State Liquor Authority
The average number of days it takes to get a liquor license application approved is a significant driver of retail vacancy. As internet retailing drives down prices and profitability for brick and mortar retail, bars, restaurants and other service providers take up a greater share of retail space. Delays in approval of a liquor license is an important impediment to such conversion. An important step in the approval process is a 30-day waiting period following notification of the local community board.[9] The State Liquor Authority gives great weight to Community Board recommendations when approving and denying liquor license applications, and in imposing “stipulations” under which the application may be approved.
Based on the multivariate regression described in the appendix, a one percent increase in this measure is associated with a 0.17 percent increase in retail vacancy. After declining dramatically over the prior decade, the average time to approve a liquor license rose substantially in 2018, to an average of 72 days, from an average of 49 days in 2017 (Chart 10). By itself, this increase would be sufficient to drive up New York City retail vacancy up by roughly 0.1 percent in a single year.
There is considerable geographic variation in approval times, with liquor licenses generally taking longer to get approved in Manhattan, in particular in neighborhoods such as Greenwich Village, the West Village, and Soho.
Chart 11. The Share of Alteration Permits Unapproved After 30 Days is Rising in the Outer Boroughs
Source: New York City Department of Buildings
The share of Department of Buildings alteration permits unapproved after 30 days is also a significant driver of retail vacancy. A one percent increase in this metric is associated with a 3.28 percent increase in vacant retail square footage. Although this metric fell sharply between 2007 and 2017, it increased substantially in 2018, particularly outside Manhattan (Chart 11).
Chart 12. The Share of Alteration Permit Applications Unapproved After 30 Days is Systematically Higher Outside Manhattan
Source: New York City Department of Buildings, Share of alteration permits unapproved after 30 days for zip codes with over 100 permit applications in 2018
In contrast to liquor license approvals, the share of alteration permits unapproved after 30 days is historically lowest in Manhattan. Over the last several years it has been increasing modestly in the outer boroughs, and is systematically higher outside Manhattan. In 2018, the share of alteration permits unapproved after 30 days range from as high as 15 percent in the Queens zip code 11421 in Woodhaven, to a low of 0.5 percent in Yorkville on the Upper East Side (Chart 12).
Chart 13. Retail Vacancy is Not Correlated with the Share of Retail Located in Landmarked Buildings
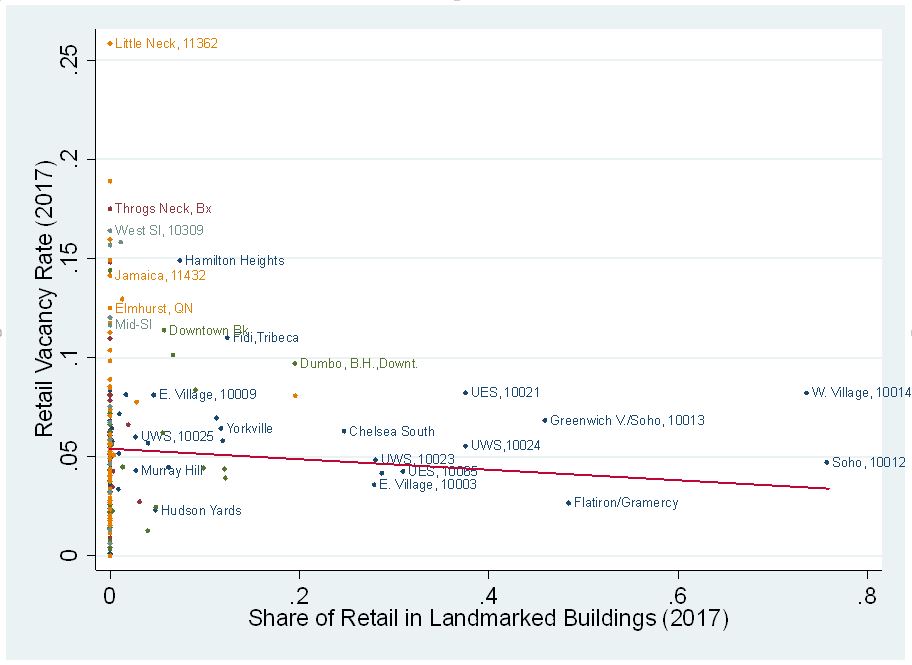
Source: 2017 RPIE Filings, New York City Department of Finance, and New York City Department of City Planning, PLUTO data.
There is little evidence that landmark status, by itself, has contributed to rising vacancy rates. Controlling for other measurable factors, multivariate regression analysis shows greater retail square footage in landmarked properties is associated with lower rates of vacant retail (Chart 13).
Actions to Reduce Retail Vacancy
This analysis makes clear that retail vacancy is a growing phenomenon, resulting from the changing shopping patterns of New Yorkers, excessively high rents in some areas, and City agencies that are not working to expedite opening of new businesses in retail spaces.
The report of the Comptroller’s 2016 Red Tape Commission spelled out some sixty steps the City could take to help improve the city’s small business environment generally.[10] Creating a more small business-friendly city would also help in meeting the challenge of the changing face of streetfront retail space. Among the Commission’s proposals:
- Split the Department of Buildings into two agencies, separating its inspection and remediation responsibilities from its permit and review functions.
- Require prompt removal of unused sidewalk scaffolding.
- Expand and improve the Department of Transportation’s PARK Smart program in retail corridors.
- Take a more pro-active, educational approach to helping small business owners comply with City rules and regulations.
In addition to those and other steps outlined in the Commission’s report, the following actions could help directly address today’s high retail vacancy rates:
Provide tax incentives for independent merchandise retailers in high-vacancy retail corridors. The City should provide tax credits for independent retailers to help lower the cost of space in retail corridors with persistently high vacancy rates. City Planning, working with the Department of Finance, would identify and map retail corridors and monitor vacancy rates. “Independent” businesses – for example, those with no more than 5 locations in New York City and 5 outside of the city – locating in corridors with vacancy rates above a certain level for more than a given period of time (one or two years) could receive a credit against either the commercial rent tax (in that area of Manhattan to which it applies) or the real property tax (requiring the landlord to calculate that share of rent attributable to retail space when the space is leased). The credit would be equal to a percentage of the tax (up to 20 percent, for example).
Create single point-of-contact customer service for businesses occupying retail space. To expedite and facilitate a change in use of retail space from goods to personal services or an eating or drinking establishment, the City should create a multi-agency task force staffed with customer service representatives to assist new businesses by coordinating and expediting the necessary regulatory actions – including construction permitting; health and safety (FDNY) inspections; and liquor license applications, among others. Each business would have a single customer service point of contact for all City interactions. The task force should also include representatives of utilities like ConEd and cable providers.
The City should also waive permitting and inspection fees for businesses taking over existing space that has been vacant for a given period of time.
Incorporate retail demand into neighborhood planning. The City should require an analysis of retail demand and inventory in discretionary approvals of any major development proposal or rezoning to ensure that the right amounts and types of retail space are incorporated into the planning process. The focus should be on the need for basic neighborhood services such as grocery stores, child care, and community facility space, as well as to ensure that retail space is provided in the appropriate amounts and configurations.
Appendix: Regression Analysis
Data
The various data sources examined in this report paint a picture of a changing retail market, characterized by the rise of internet retailing, rising retail rents, and regulatory delays. In this environment, retail vacancy can be viewed as a product of factors that are driving change, and factors inhibiting that change. As data on retail vacancy are generally not publicly available, there is little existing research on retail vacancy to offer guidance on variable selection and modeling choices.[11] A wide net was cast to identify potential drivers of retail vacancy. Descriptive statistics for the most important of these factors are included below.
The dependent variable in our model was vacant retail square footage, aggregated annually by zip code, from 2007 and 2017, from RPIE filings.[12]
The independent variables are described below, and summarized in Table A1 on the next page:
- Aggregate Amazon Sales – Global Amazon sales, ranging from $14.84 billion in 2007 to $177.87 billion in 2017 are used as a proxy for the rise of internet retailing, due to the lack of a measure of internet sales at the zip code, or even county level.
- Minimum Wage – Over the sample period the minimum wage increased uniformly across the five boroughs of New York City, from the federal minimum of $7.15 in 2008, up to $10.50 for small employers and $11.00 for large employers in 2017.
- Employment (log) – Annual employment at the county level, from the Quarterly Census of Employment and Wages (QCEW). Employment may impact retail vacancy both directly, by occupying retail space, and indirectly, as a count of workers in New York City on a daily basis spending money.
- Retail Square Footage in Zip Code (log) – Reported retail square footage from RPIE filings, aggregated by zip code and year.
- Average Retail Rent per Occupied Square Foot (log) – Average annual retail rent per occupied retail square foot in the zip code, taken from RPIE filings, regardless of whether those rents are just rent, or due to property taxes or escalation clauses in retail leases.
- Number of RPIE Filers in Zip Code (log) – Total annual number of RPIE filers in a zip code. This is a particularly important consideration due to a 2014 rule change that increased penalties on landlords for failing to file RPIE returns.[13] Increased penalties led to a 1-year jump in RPIE filings from 58,061 in 2013 to 88,008 in 2014, and higher total reported vacant retail square footage. Including the number of RPIE filers in the regression model controls for changes in reported retail vacancy that are driven by increased reporting as opposed to increased vacancy.
- Added Retail (log) – Added retail square footage aggregated to the zip code level from year-to-year tax lot changes from PLUTO data.
- Share of Alteration Permits Unapproved After 30 Days – Derived from New York City Department of Buildings data.
- Average Number of Days to Approve a Liquor License (log) – Derived from New York State Liquor Authority data.
Table A1. Descriptive Statistics of Important Retail Factors, 2007-2017
NOTE: All data at ZIP Code level unless otherwise indicated
Excluded Variables
For both public policy purposes, and future research, identifying factors that are not significant drivers of retail vacancy may be just as important as identifying factors that are. The following variables were included in several regression model specifications, but were excluded from the final regression model specification below, as they were not correlated with retail vacancy:
- County level measures of average wages, total wages, and establishment counts from the QCEW;
- Residential unit counts by zip code and year (as a proxy for local population changes) from PLUTO data;
- Different measures of permit approval times and permit volumes for New Building Permits and Demolition permits (as opposed to alteration permits), aggregated to the zip code level, from the New York City Department of Buildings;
- Year-to-year losses in retail square footage aggregated from the tax lot up to zip code level, from Department of City Planning PLUTO data;
- Total annual permitted scaffolding days, and permitted scaffolding days on retail property aggregated up to the zip code level, from Department of Buildings data;
- The share of retail square footage located in landmarked buildings.
Model Specification
Annual retail square footage at the zip code level (taken from RPIE filings) is regressed on available explanatory variables. Explanatory variables were left in levels when the magnitude of changes is more likely to be important than proportional changes. This is the case for variables such as aggregate Amazon sales – where a $1 billion (100%) increase in aggregate Amazon sales from $1 billion to $2 billion, is likely have a smaller impact on New York City retail vacancy than a $15 billion (50%) increase in aggregate sales from $30 billion to $45 billion.
Simple Ordinary Least Squares (OLS) regression of log vacant retail square footage on explanatory variables will identify as drivers of retail vacancy, variables that vary primarily in cross-section (between zip codes) rather than over time. A good example of this is the share of retail square footage located in Landmarked buildings. OLS regression log vacant retail square footage on Landmarked retail square footage shows a statistically significant negative relationship. However, there is little change in Landmarked retail square footage over time in comparison to large and persistent difference between zip codes, because Landmarked retail is concentrated in a subset of Manhattan zip codes.
Because of this, the following specification is chosen as the primary model specification:
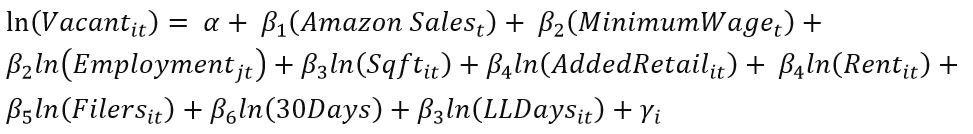
The log vacant retail square footage in zip code (i) and year (t), is regressed on:
- Amazon sales and the minimum wage, Two factors that vary by year (t), but do not vary geographically
- Log employment, which varies by each of the five counties (j) of New York City and year (t), but takes the same value for all zip codes within a county in a given year
- Other factors (square footage, added retail, retail rents, RPIE filer counts, DOB and liquor license approval times etc.) that vary by both zip code (i) and year (t)
- a zip code level (i) fixed effect
Results
Regression result support three of four theories as drivers of retail vacancy: rising internet sales, rising rents, and regulatory burdens. Although increase retail capacity is associated with greater retail vacancy: there is little evidence of overbuilding. A compete summary of regression results follows in Table A2.
Theory 1: Amazon/Internet Sales. Amazon sales is positively, and statistically significantly, associated with retail vacancy. Controlling for other factors, a $1 billion increase in Amazon sales is associated 0.006% increase in vacant retail square footage in New York City. Total Amazon sales, regardless of geography, increased from $14.84 billion in 2007 to $177.87 billion in 2017. This roughly $160 billion increase in Amazon sales over the period would imply an increase in vacant retail square footage of roughly 1% over the period (.006% * $162B = 0.97%).
Theory 2: Rising Rents. Average retail rent per occupied retail square foot in the zip code, taken from RPIE filings is positively, and statistically significantly, associated with retail vacancy. A 1% increase in average retail rents is a zip code is associated with a 0.33% increase in vacant retail square footage.
Theory 3: Overbuilding. Increases in retail square footage are positively, and statistically significantly, associated with increased retail vacancy. Coefficient interpretation is complicated by the fact that regression analysis yields two statistically significant measures of increased retail space: increased reported retail square footage from RPIE filings, and increased year-over-year square footage aggregated up from tax lot level PLUTO data. Taken together, they imply a 1% increase in retail square footage is associated with a roughly 1% (0.968% + 0.028% = 0.996%) increase in vacant retail square footage. As retail square footage increases, vacant retail increases proportionally, leaving the rate of vacancy unchanged. This coefficient would need to be larger than 1 to imply that overbuilding is driving retail vacancy. It is not greater than 1, suggesting an underlying rate of retail vacancy that is unchanged by construction.
Theory 4: Regulatory Burdens. Two measure of regulatory burdens are associated with greater retail vacancy.
- The share of alteration permits taking of over 30 days to approve is positively, and statistically significantly, associated with retail vacancy. A 1% increase in the share of alteration permits taking over 30 days to approve is associated with a 3.28% increase in vacant retail square footage.
- The average number of days it takes to get a liquor license approved is positively, and statistically significantly associated with retail vacancy. A 1% increase in the average number of days it takes to get a liquor license approved is associated with a 0.17% increase in retail vacancy.
Table A2. Fixed Effects Estimates of Log Vacant Retail Square Footage on Explanatory Variables
Appendix: Neighborhood Definitions
See Table A3 on the following page for a list of zip codes in each neighborhood in Chart A1.
Chart A1: Neighborhood Definitions Used in the Analysis
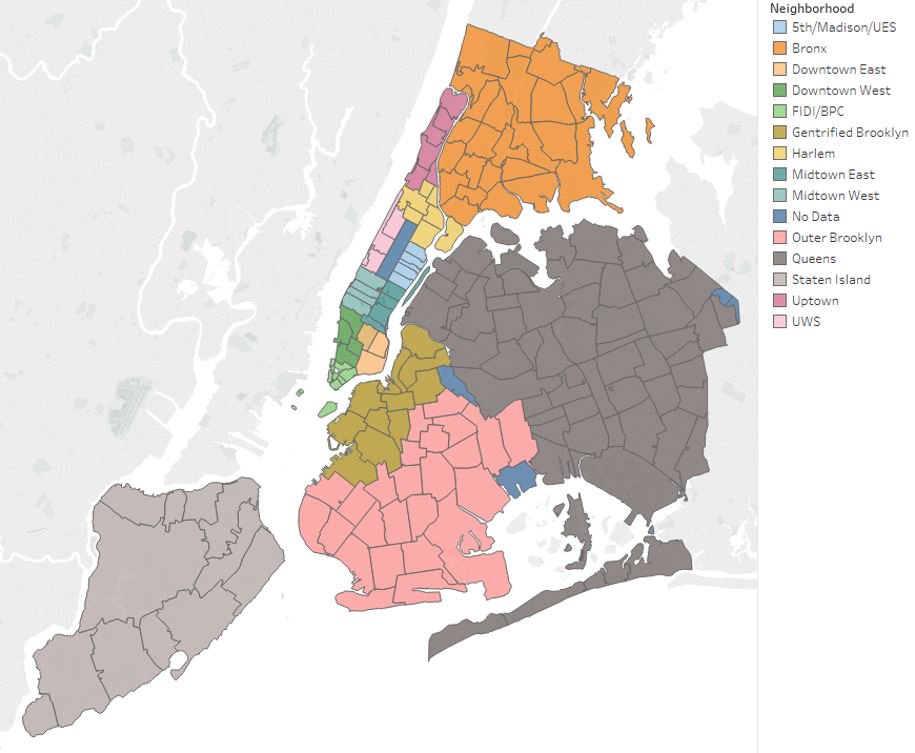
Table A3: Neighborhood Definitions Used in the Analysis
Note on Sources and Methodology
Vacancy
Every year, owners of commercial property in New York City are required to file statements of Real Property Income and Expense (RPIE) with the Department of Finance as part of the annual process of assessing the value of real property. Among the data included on these forms are: the amount of retail square footage of each property, the amount of that retail square footage that was vacant for the year, and the rental income attributable to retail square footage that was not vacant. The Department of Finance provided the Office of the Comptroller with annual RPIE filings summarized at the zip code level to protect taxpayer confidentiality, going back over a decade.
This data was used to measure the vacancy rate as the amount of vacant retail square footage divided by total retail square footage.
Properties with assessed values less than $40,000, co-op buildings with less than 2,500 square feet of commercial space, and smaller residential properties are not required to file RPIE statements. It is estimated that about one-quarter of retail square footage in New York City is located in properties that do not file RPE statements, and is therefore un-accounted for in this research. Measures of retail vacancy rates may understate, or overstate, retail vacancy rates if vacancy rates in smaller buildings differ significantly. Assuming they do not, measures of aggregate vacant retail square footage would be understated by roughly 25 percent, but this varies by neighborhood.
Beginning with filings for the 2014 tax year, the Department of Finance significantly increased penalties for non-filing, which resulted in a nearly 52 percent increase in the number of filings. Because the penalties were primarily aimed at improving reporting by smaller buildings, there was a much smaller increase in reported square footage – less than 17 percent – and the average space per filing decreased by 23 percent. New filers averaged less than 1,000 square feet of retail space, compared to the average of nearly 3,000 square feet before the penalty increase.
Rents
This report addresses the question using two data sources: average rents on existing leases from RPIE property tax filings, and data on new retail leases from Compstak, which provides insight on current market conditions.[14]
In contrast to measures such as asking rents, or even self-reported contract rents, the retail rents calculated from RPIE filings represent the average current year rent per square foot for all retail tenants, regardless of when their lease was signed. They therefore may be lower (or higher) than asking rents on currently available spaces. Average retail rents calculated from RPIE data will be slow to reflect changes in market conditions, because most retail leases cover periods of 10 years or more and only a fraction of current-year retail rent income is derived from new leases. Thus, changes in the market, as reflected by rising or falling new or renewal asking rents, will be captured only partially and slowly, over time.
In contrast to the DOF RPIE data, data from Compstak captures new leases and renewals, and therefore provides a better measure of current market conditions. Compstak (www.compstak.com) is a crowdsourced data platform for commercial real estate data. Retail rents, and other lease details are self-reported by members. Compstak data also have a number of limitations for purposes of this analysis: In addition to being self-reported, each lease covers a retail space of a different size; and from one quarter to the next the mix of property may change dramatically. For example, the data show the highest retail rent on the Upper East Side in the 4th quarter of 2013 was less than $500/square foot. The next quarter the highest rent was almost $2500, likely reflecting a difference in location, rather than a profound change in the underlying market. For these reasons, average rents are not calculated from Compstak lease data. Compstak data also contains fewer leases for lower-profile neighborhoods, particularly those outside Manhattan.
Retail Square Footage and Landmarked Square Footage
This report uses multiple measures of retail square footage. RPIE data was used to measure changes in total reported retail square footage. As this data was aggregated to the zip code level by New York City’s Department of Finance, it is unable to measure increases in retail square footage in a zip code that are offset by decreases in retail square footage elsewhere in the zip code. It also fails to capture retail square footage that is unreported on RPIE filings.
This report used tax lot level retail additions and losses, aggregated up to the zip code level from New York City Department of City Planning PLUTO data.
PLUTO data was also used to calculate the percentage of retail square footage that is located in Landmarked buildings.
Retail Usage and Merchant Types
Data for retail establishments by type (Chart 3) from U.S. Bureau of Economic Analysis, Quarterly Census of Employment and Wages (QCEW). Data on merchant types and counts based on transactions processed from 2012 through 2018 provided by MasterCard. Note that counts of merchants processing credit card transactions do not take into account cash-only businesses, which may be more prevalent in lower-income neighborhoods where residents have less access to credit, or in communities with different attitudes toward credit, and therefore may not be consistent with QCEW data.
Building Alteration Permits
New York City’s Department of Building requires building permits for any large scale demolition, construction or alteration of buildings. Alterations are categorized as Alt-1, for major changes to use, egress or occupancy, or as Alt-2 or Alt-3 for smaller changes to the space.[15] This report analyzed 1.9 million building permit applications from 2007 through 2018, examining a variety of building permit metrics in the context of retail vacancy. These included: zip code level permit volumes, average approval times, and the share of permits unapproved after one week, one month, and one year, for new building permits, demolition permits and alteration permits. Multivariate regression analysis identified one metric in particular as a statistically significant predictor of retail vacancy – the percentage of alteration permits (Alt-1, Alt-2 and Alt-3) unapproved after 30 days.
Liquor Licenses
This report analyzed data on over 35,000 liquor license applications submitted to the New York State Liquor Authority between 2007 and 2018. Data was provided to the New York City Comptroller’s Office by the State Liquor Authority, with assistance from the New York State Office of Information Technology Services.
Acknowledgements
The Comptroller wishes to thank Andrew McWilliam, senior research economist, for the analysis in this report, along with Lawrence Mielnicki, chief economist, and Preston Niblack, deputy comptroller for budget. Bureau of Budget interns Hayoung Park and Jane Wenqi Wang provided assistance in developing individual neighborhood profiles, which Angela Chen, senior website developer, designed and formatted. Senior press officer Tian Weinberg prepared the press release. The Comptroller also thanks MasterCard, Compstak, and LiveXYZ for permission to use their data.
Endnotes
[*] Live XYZ maps storefronts citywide, providing a comprehensive index of occupied and vacant spaces.https://livexyz.com/
[1] For example, Manhattan Borough President Gale Brewer’s Office conducted a count in 2017 of vacant retail space on Broadway on the Upper West Side (https://commercialobserver.com/2017/06/does-broadway-have-too-many-vacant-storefronts/); The following year, the office of State Senator Brad Hoylman produced a similar study focusing on retail vacancy in Greenwich Village (https://www.nysenate.gov/newsroom/press-releases/brad-hoylman/its-bleaker-bleecker-street-new-report-examines-high-rent). and The New York Times ran a photo expose on empty storefronts and highlighted an estimate from Douglas-Elliman that 20% of Manhattan storefronts were vacant (https://www.nytimes.com/interactive/2018/09/06/nyregion/nyc-storefront-vacancy.html?action=click&module=Editors%20Picks&pgtype=Homepage)
[2] “Manhattan retail asking rents continue to decline,” Real Estate Weekly, Dec. 4, 2018 (https://rew-online.com/manhattan-retail-asking-rents-continue-to-decline/)
[3] Real Estate Board of New York: A Tale of Two Retail Neighborhoods, 2018 (https://www.rebny.com/content/rebny/en/newsroom/press-releases/2018_Press_Releases/A_Tale_of_Two_Retail_Neighborhoods_Comparative_Study_West_Village_Hells_Kitchen_New_York_City_Community_Board_Analysis.html.html. accessed 6/28/2019)
[4] New York City Department of City Planning, Assessing Storefront Vacancy in NYC: 24 Neighborhood Case Studies. August, 2109 (https://www1.nyc.gov/assets/planning/download/pdf/planning-level/housing-economy/assessing-storefront-vacancy-nyc.pdf)
[5] Increased penalties caused more retail landlords to file RPIE returns, resulting in greater reported retail vacancy.
[6] Federal Reserve Bank of St. Louis, FRED data. https://fred.stlouisfed.org/series/ECOMPCTSA, accessed 6/18/2019
[7] Counts of merchants processing credit card transactions do not take into account cash only businesses, which may be more prevalent in lower-income neighborhoods where residents have less access to credit, or in communities with different attitudes toward credit.
[8] See for example Real Estate Board of New York, A Tale of Two Retail Neighborhoods, op. cit.
[9] https://sla.ny.gov/community-input, accessed 7/8/2019
[10] Office of the New York City Comptroller, Red Tape Commission: 60 Ways To Cut Red Tape And Help Small Businesses Grow. March 29, 2016 (https://comptroller.nyc.gov/reports/red-tape-commission-60-ways-to-cut-red-tape-and-help-small-businesses-grow/)
[11] A review of the importance of friction in labor, marriage and property markets is provided in: Markets with Search Frictions, Scientific Background on the Sveriges Riksbank Prize in Economic Sciences in Memory of Alfred Nobel, October 2011 (http://www.faseg.net/pdf/NobelEco2010/ecoadv10.pdf)
[12] The vacancy rate was considered as the dependent variable, but not selected. The vacancy rate is calculated as vacant retail square footage divided by total retail square footage. Several important retail factors are correlated with both vacant square footage and total square footage, in particular variables related to construction and development. The vacancy rate is unsuitable as a dependent variable because it is difficult to determine whether coefficient estimates are driven by correlation between independent variables and either the numerator or the denominator component of the vacancy rate.
[13] http://rules.cityofnewyork.us/content/filing-rpie-statements-owners-income-producing-property, accessed 3/5/2019
[14] Compstak (www.compstak.com) is a crowdsourced data platform for commercial real estate data. Retail rents, and other lease details are self-reported by members.
[15] https://www1.nyc.gov/site/buildings/homeowner/permits.page, accessed 7/9/2019