Introduction
Transit ridership in New York City remains significantly below 2019 levels, an enduring legacy of the Covid-19 pandemic. While traffic on MTA’s bridges and tunnels leading into the city are close to or higher than in 2019, transit usage continues to lag. Examining recent trends in subway and bus ridership sheds light on the status of recovery and informs improvements needed to match shifting travel patterns. In 2020, total subway ridership dropped to 37% of pre-pandemic levels.[1] Recovery has been gradual, but the latest ridership data show that certain pandemic ridership trends seem here to stay.
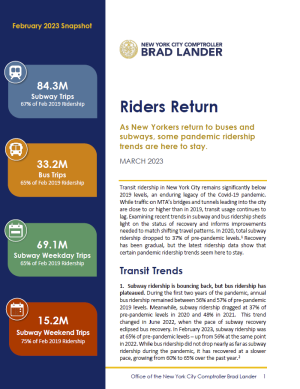
February 2023 Snapshot

84.3M
Subway Trips
67% of Feb 2019 Ridership

33.2M
Bus Trips
65% of Feb 2019 Ridership

69.1M
Subway Weekday Trips
65% of Feb 2019 Ridership

15.2M
Subway Weekend Trips
75% of Feb 2019 Ridership
Transit Trends
- Subway ridership is bouncing back, but bus ridership has plateaued. During the first two years of the pandemic, annual bus ridership remained between 56% and 57% of pre-pandemic 2019 levels. Meanwhile, subway ridership dragged at 37% of pre-pandemic levels in 2020 and 48% in 2021. This trend changed in June 2022, when the pace of subway recovery eclipsed bus recovery. In February 2023, subway ridership was at 65% of pre-pandemic levels – up from 56% at the same point in 2022. While bus ridership did not drop nearly as far as subway ridership during the pandemic, it has recovered at a slower pace, growing from 60% to 65% over the past year.[2]
- Subway ridership remains stronger on weekends than weekdays. Since the onset of the pandemic, weekend ridership on the subway system has consistently been closer to 2019 levels weekday ridership. The gap between weekday and weekend ridership recovery persists as remote and hybrid work schedules remain the norm and New Yorkers take fewer weekday commuting trips to work.
- Subway ridership is recovering in the outer boroughs faster than in Manhattan. While ridership levels improved citywide between 2020 and 2021, recovery in Manhattan has been slower than in the other three boroughs served by the subway system, with ridership at 40% of pre-pandemic levels as of 2021, the most recent year for which data is available. The Bronx led the four boroughs in recovery as of 2021, with ridership at 52% of 2019 levels.[3]
Subway Ridership Recovery Rates by Borough
Source: MTA. “Subway and bus ridership for 2021.”
Conclusion
As New Yorkers adjust to new commuting patterns and tourism returns, public transit must also adjust to serve new patterns and needs. The crush of subway commuters from the outer boroughs to Manhattan during peak rush hours may not return to the same degree as in 2019, but the need for more frequent, reliable service at off-peak times has only intensified as travel patterns change. These changes may also require reassessing how and where to prioritize new transit service and projects. Taking stock of these shifts and investing in stronger, 24-hour service are necessary to win back riders and revitalize New York City’s transit system.
Endnotes
[1] MTA. “Subway and bus ridership for 2020.” https://new.mta.info/agency/new-york-city-transit/subway-bus-ridership-2020.
[2] NYS Open Data. “MTA Performance Metrics.” metrics.mta.info.
[3] MTA. “Subway and bus ridership for 2021.” https://new.mta.info/agency/new-york-city-transit/subway-bus-ridership-2021.
