
Introduction
You’ve been hearing about AI a lot lately – maybe you’re even wondering if the Comptroller’s economic monthly newsletters and spotlights are written by AI (answer: not yet). Artificial intelligence has been on the rise for decades, but it has become ubiquitous in the past few years with the advent of large language models (LLMs), self-supervised machine learning models that train on massive amounts of text and can generate their own language. LLMs are the basis for generative AI models like ChatGPT that are constantly improving and expanding, and can already do many quite remarkable things.
ChatGPT was released in November 2022, and since then, it and other LLMs have significantly changed how humans behave at work, school, and in their personal lives. A study released in June 2024 found that nearly half of teachers and students used ChatGPT at least once a week, up from 27 percent a year prior, and a majority of students have used chatbots for both essay writing and exam preparation. A Gallup poll released in June found that 40 percent of surveyed employees used AI at least a few times per year in their job, up from 20 percent in 2023, and daily use increased from 4 percent a year ago to 8 percent now.
The rise of generative AI has prompted discourse from people in all occupations and industries. In early July, the Senate struck a provision from President Trump’s budget reconciliation bill that would have banned states from passing laws regulating AI in the next ten years. The moratorium was supported by tech leaders, including OpenAI CEO Sam Altman, who feared that forcing AI companies to comply with different state regulations would slow development, particularly in the U.S.’s race against China for dominance in the AI sector. Meanwhile, Dario Amodei, CEO of competing AI firm Anthropic, opposed the moratorium, calling it “too blunt an instrument…I believe that these systems could change the world, fundamentally, within two years; in 10 years, all bets are off.”
In a May 2025 interview, Amodei argued that AI could eliminate half of current entry-level white-collar jobs within the next five years. A month later, the CEO of Amazon wrote that “in the next few years, we expect that [generative AI] will reduce our total corporate workforce.” Not everyone agrees: The Wall Street Journal released an opinion piece in June called “No, AI Robots Won’t Take All Our Jobs,” subtitled “Instead, they will boost productivity, lower prices, and spur the evolution of the labor market.”
In October 2023, New York became the first major city to release an artificial intelligence plan focusing on AI use and regulation within city government. Earlier this year, the city’s Economic Development Corporation released an AI report which set several goals for AI adoption among businesses and workers. The report was especially focused on incentivizing AI companies to build in the city and implementing AI literacy programs in schools and workplaces.
Although there is no consensus on precisely how AI will impact employment and the job market, it is clear that AI usage will increase, and it will fundamentally change how many people work. The first step in understanding the current and future impact of AI on work is examining how frequently and in what capacity it is being used across different occupations. This Spotlight intends to provide initial prompts for conversation about AI’s potential impact on New York City’s economy and workforce in the near- and medium-term. We are humble, of course, to a future that is impossible to predict with accuracy; still, we hope this analysis will help advance such conversations.
Summary of findings
This spotlight builds on analysis from Anthropic, an AI startup whose large language model, Claude, is a competitor to ChatGPT. The Anthropic Economic Index first links user conversations in Claude to work tasks. It then uses an existing crosswalk to connect those tasks to occupation groups in order to analyze how AI is currently used in the American workforce. Our analysis then examines how the concentration of occupations in New York compares to the U.S., what it implies for AI’s impact on workers, and how it may have already affected the job market.
The results show that nearly 40 percent of work conversations in Claude are concentrated in analytical and writing tasks, while Claude is rarely used in occupations that require physical interactions. Across all occupations, workers tend to collaborate with Claude, using it more often to augment rather than automate their tasks.
Several occupations that make up significant proportions of Claude conversations are overrepresented in New York relative to the rest of the country; however, New York’s workforce is also concentrated in several occupations which appear infrequently in the Claude data. In general, occupations with more Claude conversations tend to have higher wages.
The share of job postings that mention AI in their descriptions has increased nationwide. At the same time, overall job postings have declined for many industries. Some of the occupations with the highest shares of Claude conversations have still not recovered to pre-pandemic levels. In the New York metro area, the few occupations that are increasing in headcount all have low shares of Claude usage.
Measuring occupational AI usage
AI usage for an occupation can be measured by examining conversations between users and LLMs, classifying each as part of a specific work task if applicable, and then determining which occupations involve which tasks. In 2025, researchers at Anthropic released a paper analyzing conversations from their AI platform, Claude. They linked these conversations to tasks as defined in the O*NET database of occupational tasks, then linked tasks to occupations using definitions from the Bureau of Labor Statistics. The remainder of this section provides necessary background on these datasets, following Anthropic’s methodology. More comprehensive information can be found in the Appendix.
The Standard Occupational Classification
The Bureau of Labor Statistics (BLS) classifies specific jobs into broader occupations using the Standard Occupational Classification (SOC) system. The data are reported annually for both the U.S. and metro areas. All jobs are classified into one of 867 detailed occupations, which are then grouped into 459 broad occupations, 98 minor groups, and 23 major groups. This report focuses on 21 major groups. Military occupations are excluded because they are not shown in Anthropic’s data, and Farming, Fishing, and Forestry occupations are excluded because they represent only 0.01% of Claude conversations. The table below uses a professional baseball player as an illustration of the SOC system’s levels.
Table 1
| SOC Code | Level | Category |
|---|---|---|
| – | Job | Professional Baseball Player |
| 27-2021 | Detailed Occupation | Athletes and Sports Competitors |
| 27-2020 | Broad Occupation | Athletes, Coaches, Umpires, and Related Workers |
| 27-2000 | Minor Group | Entertainers and Performers, Sports and Related Workers |
| 27-0000 | Major Group | Arts, Design, Entertainment, Sports, and Media Occupations |
Source: Bureau of Labor Statistics
O*NET
The Occupational Information Network (O*NET) is a database sponsored by the U.S. Department of Labor/Employment and Training Administration. It defines 19,530 work tasks that together comprise every SOC occupation in the U.S. Every detailed occupation is made up of several tasks. For example, the Web Developer detailed occupation (SOC code 15-1134) is made up of 27 tasks (e.g. “Select programming languages, design tools, or applications”). Most tasks map to a single detailed occupation, and the average detailed occupation consists of 20 tasks. O*NET also categorizes tasks as either core (critical to the occupation) or supplemental (less relevant or important). Most tasks (71.5 percent) in the database are considered core, and the rest are supplemental.
Anthropic, Claude, and the Economic index
Anthropic is an AI startup, founded in 2021 by former OpenAI employees who wanted a stronger emphasis on safety and ethics. Its chatbot platform, Claude, was first released in March 2023. Claude is a competitor to ChatGPT, and as of March 2025, had 19 million monthly active users (ChatGPT exceeded 400 million weekly in the same period).
Anthropic’s researchers used Claude to categorize every conversation from December 2024 through January 2025 as work, nonwork, or schoolwork related. A majority of conversations (4 million) were identified as work-related. Once work conversations were identified, Anthropic researchers asked Claude to map each to the single most relevant O*NET task. Finally, using the map between SOC codes and O*NET mentioned above, Claude conversations were mapped to both broad and specific occupations.
Augmentation and automation
Anthropic defines five types of interactions a user can have with Claude. These five types define whether Claude augments or automates a task. In augmentation, the user works in conjunction with Claude to accomplish a task. In automation, Claude performs the task with no or minimal human involvement. The five types of interactions are defined as follows:
Automation:
- Feedback loop: the user and Claude have a dialogue where the user provides feedback based on Claude’s output (e.g. the user asks Claude to debug a piece of code, Claude provides an output, the user asks Claude to debug another issue based on what Claude provided, and so on).
- Directive: the user asks Claude to perform a task, and user-Claude interaction is minimal beyond this (e.g. the user asks Claude to format a document).
Augmentation:
- Validation: the user provides their own work and asks Claude to confirm its accuracy or improve it (e.g. the user provides code and asks Claude to verify that the code is logical and efficient).
- Task iteration: the user and Claude collaborate to refine an output (e.g. the user asks Claude to draft a marketing strategy, Claude responds, the user asks Claude to add more metrics, and so on).
- Learning: the user asks Claude to provide information that expands the user’s existing knowledge base (e.g. the user asks Claude to explain a neural network).
Assumptions and limitations
Although the results of Anthropic’s task analysis are informative and can indicate trends in the workforce, there are several key assumptions and limitations to keep in mind when interpreting the data and drawing conclusions from it.
First, Claude users are not necessarily representative of all generative AI users. Because Claude is not as widely known as other generative AI platforms like ChatGPT, people who specifically use Claude at work may be concentrated in certain occupations (as a hypothetical example, a software engineer may be more likely than a teacher to know about and use Claude). In addition, Claude’s conversation data cannot capture workers who use ChatGPT or other LLMs, so there are likely some tasks which are missing from the data because they were completed via another platform.
Second, Claude only produces text outputs, so it can’t be used for tasks that involve image or video generation (e.g. tasks in graphic design occupations). Specialized tools such as DALL-E and Midjourney may be more suitable in these instances, but their use is not represented in Claude’s data. Again, this implies that some tasks do not appear in the data, even though AI is involved in their completion.
Third, classification of conversations is difficult (and in some cases, impossible, without input from the original user). For instance, a user asking Claude for advice on a meal plan could be working as a dietitian or could be looking for personal advice. Similarly, it can be difficult to differentiate conversations initiated by professionals in a field and students taking classes in that field. AI prevalence for a given task may be either underestimated or overestimated because of this ambiguity.
Fourth, the proportion of tasks that involve augmentation with rather than automation by Claude is likely underestimated. Since Claude cannot track how an output is used after the conversation ends, conversations may be falsely classified as automation, even if the result is ultimately changed or even discarded by a user.
Finally, the dataset spans December 2024 and January 2025, so the task and occupational usage may have changed in the months since. Although total usage has likely increased over time, occupations may be adopting Claude at different rates.
In addition to the limitations of the Claude data, there is not necessarily a direct correlation between tasks that are currently the subject of queries with LLMs, and tasks that could eventually be performed by LLMs. For example, health care professionals may be more likely to answer questions from patients based on their own knowledge, rather than query an LLM, relative to, say, software engineers. However, that does not necessarily mean that health care institutions might not, over time, be able to automate some of that work. It is notable, however, that there is some correlation between areas that are overrepresented in AI queries, and areas that have seen reductions in job postings, as noted below.
Current AI work trends
Claude usage varies significantly by occupation and task type. Overall, conversations frequently included tasks relating to software development, technical writing, and analytical tasks, while conversations about tasks involving physical actions or requiring highly specialized training were less common.
Computer and Mathematical occupations alone were responsible for 37 percent of all conversations, nearly 20 percentage points ahead of other occupations. The second most common type was Arts, Design, Entertainment, Sports, and Media occupations, largely driven by content generation tasks like writing and marketing. Educational occupations were also common, with the caveat that it can be difficult to distinguish between conversations for work and school. Business and Financial, Office and Administrative Support, and Management occupations were also significantly represented.
Occupational representation
The total number of Claude conversations observed for each occupation could be a function of the number of employees (e.g., if Occupation A and Occupation B have the same number of conversations, but Occupation A has twice as many workers as Occupation B, then Occupation B has proportionally higher usage). Table 2 shows, for each major occupation group, the percentage of total U.S. employees in that group (as of 2024) and the percentage of all Claude conversations attributed to it (as of December 2024 and January 2025). The overrepresentation factor is simply the percent of conversations divided by the percent of employees: groups with a factor greater than 1 are overrepresented in Claude relative to their size, and groups less than 1 are underrepresented.
Computer and Mathematical; Arts, Design, Entertainment, Sports, and Media; and Life, Physical, and Social Science are the most overrepresented occupations in Claude’s usage data. Architecture and Engineering; Educational Instruction and Library; Community and Social Service; and Legal are overrepresented to a lesser extent, and all other major groups are underrepresented.
Table 2
| Major occupation group | % U.S. employees | % of Claude conversations | Overrepresentation factor |
|---|---|---|---|
| Computer and Mathematical | 3.4% | 36.9% | 10.85 |
| Arts, Design, Entertainment, Sports, and Media | 1.4% | 10.2% | 7.29 |
| Life, Physical, and Social Science | 0.9% | 6.3% | 7.00 |
| Architecture and Engineering | 1.7% | 4.7% | 2.76 |
| Educational Instruction and Library | 5.8% | 9.3% | 1.60 |
| Community and Social Service | 1.6% | 2.1% | 1.31 |
| Legal | 0.8% | 0.9% | 1.12 |
| Business and Financial Operations | 6.6% | 5.9% | 0.89 |
| Management | 6.9% | 4.5% | 0.65 |
| Office and Administrative Support | 12.2% | 7.8% | 0.64 |
| Production | 5.8% | 2.9% | 0.50 |
| Healthcare Practitioners and Technical | 6.1% | 2.6% | 0.43 |
| Sales and Related | 8.8% | 2.3% | 0.26 |
| Personal Care and Service | 2.0% | 0.5% | 0.25 |
| Installation, Maintenance, and Repair | 3.9% | 0.7% | 0.18 |
| Protective Service | 2.3% | 0.4% | 0.17 |
| Construction and Extraction | 4.1% | 0.4% | 0.10 |
| Healthcare Support | 4.7% | 0.3% | 0.06 |
| Food Preparation and Serving Related | 8.7% | 0.5% | 0.06 |
| Building and Grounds Cleaning and Maintenance | 2.9% | 0.1% | 0.03 |
| Transportation and Material Moving | 9.1% | 0.3% | 0.03 |
Source: Anthropic Economic Index, U.S. Department of Labor
Because each occupation group includes a diverse set of jobs, there can be significant variation within groups. For example, the Arts, Design, Entertainment, Sports, and Media major group consists of four minor groups, but most of the major group’s contribution to Claude conversations comes from Media and Communication workers (7.1 percent of all conversations). The other minor groups (Art and Design; Entertainers and Performers, Sports and Related; and Media and Communication Equipment) are together responsible for the other 3.1 percent.
Depth of usage
The depth of usage also varies by occupation. Depth is defined as the fraction of all possible tasks in an occupation that appeared in the Claude data. For instance, Educational Instruction and Library Occupations have 650 potential tasks listed by O*NET across 61 detailed occupations, but Claude was used for only 263 of them.
Very few detailed occupations are using Claude in most of their tasks: 36 percent used Claude for at least one quarter of their tasks, 11 percent used it for at least half, and 4 percent showed usage for at least three quarters. This is the case for both all tasks and core tasks.
Chart 1 shows what percentage of tasks appear in Claude for each of the major occupation groups. It’s important to note that O*NET does not provide information about which tasks are most common or time-consuming for a given occupation. Additionally, the table only shows that a task has been performed with or by Claude at some point, not exclusively or even frequently. Because of these limitations, the proportion of tasks that are often or entirely completed with AI in each occupation is necessarily lower than what is shown. With these caveats in mind, Computer and Mathematical occupations are the only group currently using Claude for over half of their potential tasks. Educational Instruction and Library occupations have used Claude for just over 40 percent of tasks, and all other occupational groups are below 40.
Chart 1
Source: Anthropic Economic Index, U.S. Department of Labor O*NET Database
Automation and augmentation
As mentioned previously, Claude conversations can involve augmentation (collaborative with the user) or automation (working in place of the user). A single task can consist of conversations that involve one, both, or neither of these types. Although 32 percent of all tasks consisted of conversations that cannot be classified, 65.5 percent involve some augmentation, and 57 percent involve automation. However, augmentation is much more dominant: 45 percent of tasks consist of majority-augmentation conversations, while only 19 percent are majority-automation.
The chart below illustrates how tasks can be distributed, using tasks associated with Legal occupations as an example: in a typical occupation group, most tasks do not appear in the Claude data at all, but those that do are typically core tasks. A majority of tasks rely on Claude to augment the user’s work, rather than replace it.
Chart 2. Composition of tasks in Claude (Legal occupations)
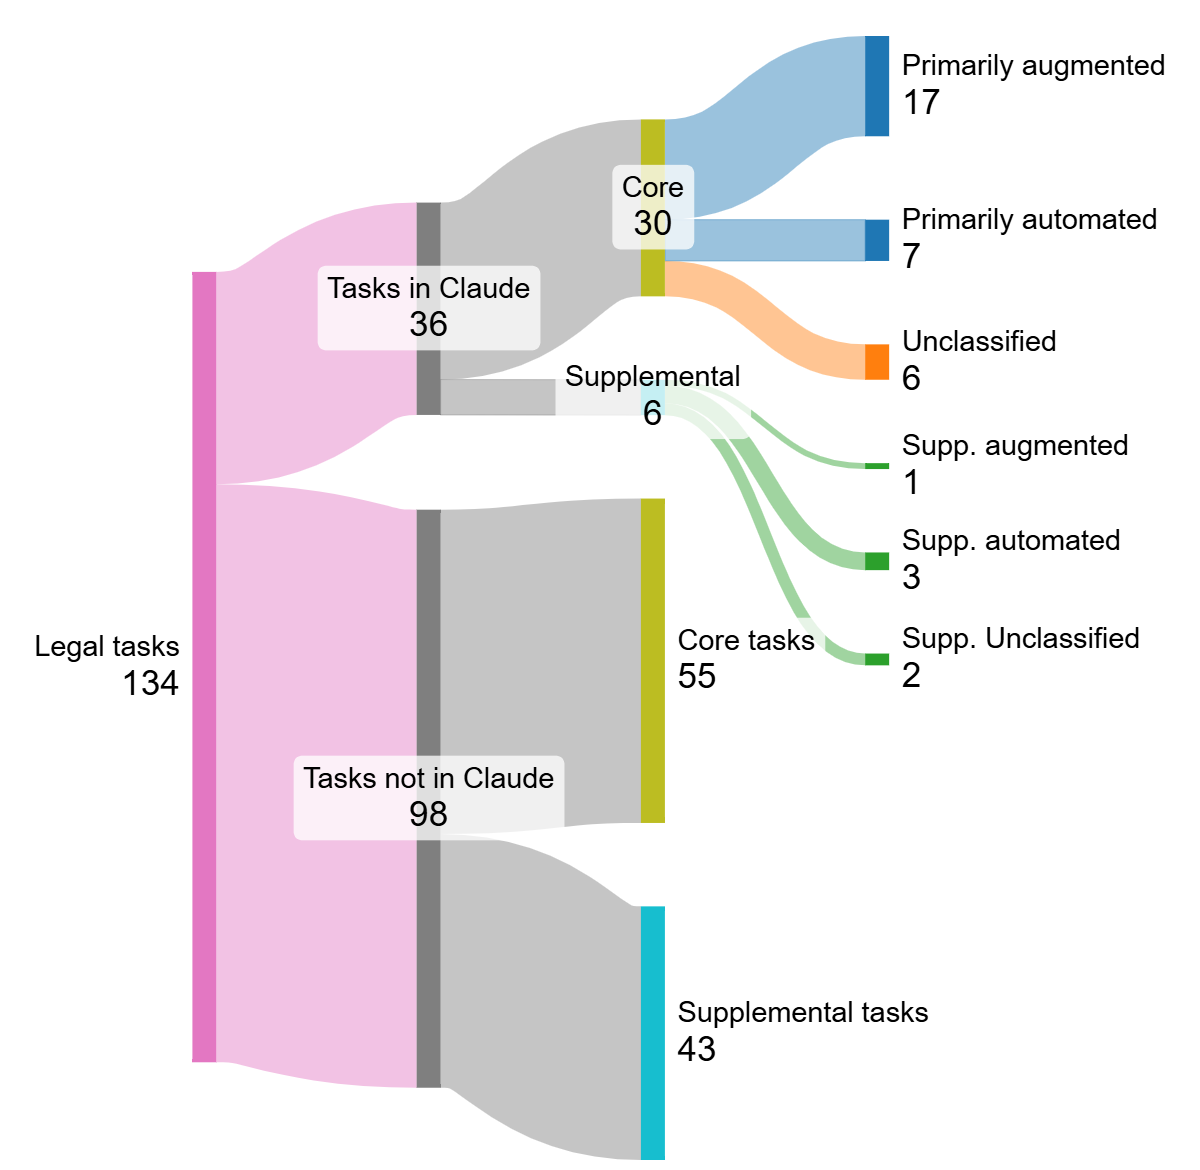
Source: Anthropic Economic Index, SankeyMATIC.com
The table below shows the percentage of Claude tasks belonging to each occupation where the majority of conversations involved augmentation or automation. This table only shows the proportion of tasks that were augmented versus automated, rather than the number of conversations or total amount of time spent on each task. Still, it suggests that people work collaboratively with Claude more than they outsource entire tasks to it. Education and Production are the only two occupation groups with equal rates of augmentation and automation, but in all other groups, augmentation is more common.
Chart 3
Source: Anthropic Economic Index
Anthropic researchers interpret the current levels of augmentation to mean that “while AI may be touching many occupations today, deep integration across most tasks within any given occupation remains rare for now. Rather than completely automating entire job roles, present-day AI appears to be primarily used for specific tasks within occupations.” However, AI is evolving quickly and becoming more adept at a variety of tasks, so levels of both augmentation and automation are expected to rise in the future. Each group in the above table also represents several detailed occupations, so individual workers may be more or less impacted depending on various other factors such as their specific role or seniority.
Implications for New York City
Because Anthropic’s Claude data is heavily anonymized, it is not currently possible to measure usage for specific locations. It may be the case that workers in New York interact with Claude differently than the rest of the U.S. However, the remainder of this section assumes that New Yorkers’ Claude usage reflects national patterns. In that case, the impact of AI usage on the city’s workforce differs from the U.S. due to variation in their occupational distributions.
NYC’s workforce
Assuming New York workers use Claude similarly to all U.S. workers, the overrepresentation factors should be similar. For example, workers in Legal occupations comprise 0.8 percent of U.S. workers and 0.9 percent of Claude conversations, so the overrepresentation factor is 1.12 (0.9 over 0.8). However, Legal workers make up 1.7 percent of the city’s workforce, so they could be expected to make up around 1.9 percent of Claude conversations.
Table 3 below shows the percentage of New York employees that work in each major occupation, based on 2024 data (the most recent available), and the U.S. overrepresentation factors from Table 2. Notably, the city’s six largest occupation groups are underrepresented in Claude. The most overrepresented groups (particularly Computer and Mathematical; Arts, Design, Entertainment, Sports, and Media; and Life, Physical, and Social Science) make up relatively small shares of the local workforce. Educational Instruction and Library occupations are the largest group to be overrepresented in Claude. Although Business and Financial Operations are underrepresented, they are closer to proportional representation than the other large occupations and likely to increase AI usage in the future, as AI platforms focus more on enterprise applications (e.g. Anthropic’s Claude for Enterprise and OpenAI’s ChatGPT for Enterprise).
Table 3. New York employment and U.S. Claude representation, by occupation
| Major occupation group | % of all NYC employees | US overrepresentation factor |
|---|---|---|
| Office and Administrative Support | 11.3% | 0.64 |
| Healthcare Support | 10.8% | 0.06 |
| Business and Financial Operations | 9.4% | 0.89 |
| Sales and Related | 8.1% | 0.26 |
| Management | 7.5% | 0.65 |
| Food Preparation and Serving Related | 7.2% | 0.06 |
| Educational Instruction and Library | 6.6% | 1.60 |
| Transportation and Material Moving | 6.3% | 0.03 |
| Healthcare Practitioners and Technical | 5.3% | 0.43 |
| Computer and Mathematical | 3.9% | 10.85 |
| Arts, Design, Entertainment, Sports, and Media | 3.4% | 7.29 |
| Protective Service | 3.1% | 0.17 |
| Installation, Maintenance, and Repair | 3.1% | 0.18 |
| Building and Grounds Cleaning and Maintenance | 3.0% | 0.03 |
| Construction and Extraction | 2.7% | 0.10 |
| Personal Care and Service | 1.9% | 0.25 |
| Community and Social Service | 1.8% | 1.31 |
| Legal | 1.7% | 1.12 |
| Production | 1.4% | 0.50 |
| Architecture and Engineering | 0.7% | 2.76 |
| Life, Physical, and Social Science | 0.7% | 7.00 |
Source: New York State Department of Labor, Anthropic Economic Index
NYC vs. U.S. employment
An occupation is considered overrepresented in New York relative to the U.S. if its employees make up a larger share of the total workforce. This difference can be represented as the New York employment share divided by the U.S. employment share (e.g. Healthcare Support workers make up 10.8 percent of New York City workers but only 4.7 percent of U.S. workers, so Healthcare Support is overrepresented in the city by a factor of 2.3).
Chart 4 shows the New York employment factor for each major occupation group. Occupations to the left of the dotted line are overrepresented relative to the U.S., and those to the right are underrepresented. The shading indicates AI usage: occupations with darker bars have more conversations in Claude’s data. Many of the occupations with high AI usage are overrepresented in the city (Arts, Design, Entertainment, Sports & Media; Computer and Mathematical; Educational Instruction and Library; Business and Financial Operations; Management), but several of its largest occupations have not seen much Claude use so far (Healthcare Support; Legal; Protective Service; Community & Social Service). If AI disrupts employment in the future in the overrepresented occupations with heavy usage, a relatively greater share of employees will be impacted in New York than in the U.S., but some of the city’s largest occupations are still relatively unexposed to AI.
Chart 4
Source: New York State Department of Labor, Bureau of Labor Statistics, Anthropic Economic Index
Wages and AI use
Chart 5a shows the relationship between the U.S. overrepresentation factor and the median U.S. wage for each occupation. Chart 5b uses median New York City wage instead of U.S. The vertical dashed lines in each chart represent median wages ($49,500 in the U.S. and $64,747 in New York). New York wages are higher than their U.S. counterparts across all occupation groups, but the trends in both locations are the same: higher AI usage is correlated with higher wages, with highest usage in the upper middle of the wage distribution. There are a few notable differences, particularly that the median Legal worker is paid much more in New York than in the U.S., but AI usage is low. However, Legal seems a likely candidate for increased AI usage going forward, because many of its tasks involve writing and analysis of documents.
Chart 5a
Source: Anthropic Economic Index, Bureau of Labor Statistics
Chart 5b
Source: Anthropic Economic Index, New York State Department of Labor
AI and the job market
NYC-area occupational trends
Chart 6 shows how employment in the New York metro area (New York City, Jersey City, and Newark) has changed since 2019 for the area’s largest occupations. Note that New York City data was available and used for 2024 employment data in Table 3, but historical data used here was only available for the metro area. The asterisks indicate overrepresentation factor. Healthcare Support, Management, and Healthcare Practitioners and Technical are the only large occupations growing in the metro area. All three are relatively underrepresented in the Claude data. The three occupations that currently contribute the most Claude conversations nationally (Computer and Mathematical; Arts, Design, Entertainment, Sports, and Media; Educational Instruction and Library) are stagnant or declining in size, and Computer and Mathematical is the only one of the three that has surpassed its pre-pandemic employment total.
Chart 6
Source: New York State Department of Labor
Job postings
The number of new job postings increased significantly shortly after the start of the pandemic in both New York and the U.S. After a brief initial drop in early 2020, employers attempted to recover their prior workforce levels amidst diminished labor force participation. However, beginning in mid-2022, these hiring needs began declining gradually across the labor market. Chart 7 shows the national change in total job postings on Indeed over time for occupations that correlate to New York’s largest occupation groups (e.g. Software Development job postings are a proxy for Computer and Mathematical occupations). The change in each occupation is measured relative to the total number of new postings on February 1, 2020, so occupations with a value above 0 have a greater number of job postings since then, and occupations below 0 have fewer.
Chart 7
Source: Indeed Hiring Insights
Most occupations’ new postings peaked in 2022. Recent job posting growth has been concentrated in occupations with low AI usage, with the exception of Education & Instruction occupations. Software Development and Arts & Entertainment, proxies for the two occupation groups with the heaviest AI usage, have seen the biggest declines. Software Development, Arts & Entertainment, Sales, and Banking & Finance have not fully recovered to their pre-pandemic posting levels. Food Preparation & Service and Administrative Assistance postings are declining back to pre-pandemic levels. Physicians & Surgeons (a proxy for Healthcare Practitioners & Technical occupations), Personal Care & Home Health (Healthcare Support), Driving (Transportation), and Education & Instruction (Education & Library) have the most postings relative to their pre-pandemic levels. Overall, AI use is correlated with lower growth in job postings, but this is not necessarily a causal relationship.
The chart below provides a closer look at mentions of AI in job postings over time, both for all types of AI (e.g. data analysis tools that do not produce new content) and specifically generative AI, which includes LLMs and image generation. AI mentions were stable before the pandemic, before dropping in 2020 and increasing steadily through mid-2022. Mentions then declined for the next year and have been rebounding since, but they still have not reached their peak from 2022. Meanwhile, mentions of generative AI were nearly nonexistent until 2023, and they have been steadily rising since, although the absolute number of mentions is still far below the mentions of all AI terms.
Chart 8
Source: Indeed Hiring Insights
It’s important to note that Chart 8 shows the frequency of AI terms in all U.S. job postings on Indeed, and it is not restricted to any particular industry. While it’s likely that many of these postings were for Software Development or other jobs that fall under Computer and Mathematical occupations, overall postings are declining (as was shown in Chart 7). Therefore, much of the growth in job posts that mention AI is likely driven by the proliferation of AI across non-technical occupations.
Although it is outside the scope of this report and Claude’s data, AI is thought to be particularly impacting new college graduates as they compete for entry-level white-collar jobs. Handshake, a career services platform for college students, released a report on the class of 2025 which states that jobs posted by employers on the platform declined 15 percent in the past year, and applications per job increased by 30 percent. The unemployment rate for new college graduates is 6.6 percent, compared to 4 percent overall. In July, Anthropic released its new Financial Analysis Solution version of Claude, which automates financial analysis tasks typically performed by entry level employees. In April, the CEO of Shopify began requiring managers to prove jobs cannot be performed by AI before hiring new employees. These cases suggest that data on AI usage in the workplace understates the impact on entry level workers and the future of hiring.
Conclusion
This report confirms several key findings from Anthropic about how AI is already impacting the workforce, while also presenting new results specific to New York. First, work-related Claude conversations are most often used for tasks in Computer and Mathematical occupations. Arts, Design, Entertainment, Sports, and Media; Life, Physical, and Social Science; Architecture and Engineering; Educational Instruction and Library; Community and Social Service; and Legal occupations also make up sizable shares. Most other occupations appear much less frequently in the data. In all occupations, workers tend to collaborate with Claude, using it more often to augment rather than replace their efforts.
Several occupations with relatively high AI usage are overrepresented in New York compared to the rest of the country: the city has high concentrations of workers in Arts, Design, Entertainment, Sports, and Media; Business and Financial Operations; Computer and Mathematical; Educational Instruction and Library; and Management occupations. However, New York’s workforce is also concentrated in Healthcare Support; Legal; and Protective Service occupations, which are low usage. In general, tasks belonging to high income occupations are more represented in Claude.
New job postings have declined in most occupations. Arts & Entertainment and Software Development, proxies for the occupations that make up the greatest shares of Claude conversations, have been hit particularly hard and have not recovered to pre-pandemic levels. In the New York metro area, Healthcare Support; Management; and Healthcare Practitioners and Technical are the only large occupations with increasing headcounts, and all three occupations have relatively low-AI usage. As mentioned in previous newsletters, the fact that most of the city’s recent job gains have been in Health & Social Assistance has been seen as a negative because wages tend to be low; however, Healthcare occupations have thus far not seen much Claude usage, which may indicate they are more insulated from potential AI-related job declines, at least for the time being.
Overall, these results suggest that New York’s workforce is already being impacted by AI, both in the number of jobs available and the tasks performed. AI usage is expected to increase across the board in the future, but its effects may vary widely depending on occupation and wages.
Acknowledgments
This report was prepared by Amber Born, Economic Development Research Analyst, with assistance from Andre Vasilyev, Assistant Director for Economic Development; Jason Bram, Director of Economic Research; Krista Olson, Deputy Comptroller for Budget; Jonathan Siegel, Chief Economist; and Francesco Brindisi, Executive Deputy Comptroller for Budget and Finance. Archer Hutchinson, Creative Director, led the report design with assistance from Danbin Weng, Multimedia Designer and Cindy Zhao, College Aide-Web Developer.
Appendix
Data
O*NET
The Occupational Information Network (O*NET) is a database of descriptions for every occupation in the U.S. O*NET bases its occupation list on the SOC system, and it currently classifies every job in the U.S. into one of 923 occupations. O*NET defines 19,530 tasks that together comprise all occupations. Each job is then assigned several tasks. For example, the web developer job (SOC code 15-1134) is made up of 27 tasks. Most are unique to the position (e.g. “select programming languages, design tools, or applications”), but a few can span multiple occupations (e.g. “develop or implement procedures for ongoing web site revision” is a task for both Web Developers and Web Administrators). However, this is relatively uncommon because of the tasks’ specificity: of the 19,530 tasks, 18,428 are mapped to a single job. Every job has between 4 and 40 tasks, with an average of 20 tasks per job. O*NET also categorizes tasks as either core (critical to the occupation) or supplemental (less relevant or important). 71.5 percent of all tasks are considered core, and 28.5 percent are supplemental.
Anthropic Economic Index
Anthropic developed an automated tool called Clio (Claude insights and observations) to analyze Claude conversations while preserving user privacy. Claude itself does not use any part of user conversations to train its models unless the user has first opted in or voluntarily provided feedback. Clio uses Claude to categorize conversations into broader categories, with only the highest-level results visible to humans. For example, a user might start a conversation with Claude by asking “How do I tie my shoes?” Claude extracts facets or attributes of the conversation (e.g. topic, conversation length, language used). A facet in this case might include “How to tie shoes” as a summary. These summaries are then grouped with similar conversations, and only the clustered attributes are preserved. In this example, “How to tie shoes” might be grouped with “Tying knots for pigtail bows,” and the broader cluster would then be “Tying various knots.” Finally, these clusters are organized into hierarchies that can be seen and analyzed by humans, e.g. a hierarchy called “Daily life skills” that contains tying knots, along with other clusters. Thus, individual conversations can be aggregated for analysis without exposing the specifics of individual interactions.
Anthropic’s analysis of how Claude is used at work relies heavily on Clio. First, conversations were graded by their likelihood of being in each of three categories: work, coursework, and personal. A conversation can be explicitly, likely, possibly, or not at all related to each category. Most Claude conversations are work-related: nonwork conversations make up only 23 percent of the data, with 5-10 percent of those likely relating to coursework. This analysis considers Claude data collected in December 2024 and January 2025. During this period, 4 million conversations were identified as work-related.
Once work conversations were identified, Anthropic researchers asked Claude to map each to the single most relevant O*NET task. To achieve this, they first asked Claude to organize O*NET tasks into a hierarchy, where the 19,530 tasks were grouped into 474 mid-level tasks and 12 top-level tasks. Claude first sorted each conversation into one of the 12 top-level tasks, then continued to the mid-level and finally base-level O*NET tasks. For privacy reasons, the analysis excluded tasks that corresponded to fewer than 5 unique user accounts or fewer than 15 total conversations. Finally, using the map between SOC codes and O*NET mentioned above, Claude conversations are mapped to both broad and specific occupations.
Automation and augmentation.
A single task can consist of conversations that involve automation, augmentation, both, or neither depending on the specifics of each conversation. There are five types of possible interactions: automation can be a feedback loop or directive, and augmentation can be validation, task iteration, or learning. Claude provides proportions for each category, e.g. conversations belonging to the task “Develop, implement, modify, and document recordkeeping and account systems, making use of current computer technology,” (a core task for the Accountants job and the Business and Financial Operations Occupations group) are 10 percent feedback loop, 34 percent directive, 32 percent task iteration, 3 percent validation, and 18 percent learning, where the remaining conversations were too idiosyncratic to be clustered and therefore filtered out (these will be referred to as “unclassified” in future discussion). Some tasks are less diverse: conversations belonging to “Gather and organize information to plan advertising campaigns,” a task for Advertising and Promotions Managers, are entirely directive.