
Executive Summary
Contracting is a powerful tool to achieve New York City’s goals and priorities – and the City has the power to use contracting strategically to make investments that support a vibrant, sustainable, and equitable City. One of the City’s responsibilities is to consider ways to more meaningfully direct portions of the City’s roughly $40 billion in annual contract spending to local businesses owned by women and people of color. Yet the City of New York has historically procured goods and services overwhelmingly from businesses owned by white men. While there are meaningful signs of effort, and some modest indications of progress, that pattern of historic discrimination largely continues: in Fiscal Year 2023 (“FY23”) only 5% of that $40 billion went to businesses owned by women and people of color.[1]
Over the past three decades, the City has developed a robust effort to support investments in Minority- and Women-owned Business Enterprises (“M/WBEs”). This Annual Report on M/WBE Procurement provides analyses to understand how effective the tools of this program are at actually moving the needle. These analyses measure “M/WBE utilization” in compliance with Local Law 174 (“LL 174”) of 2019, which established the City’s modern M/WBE program. LL 174 requires City agencies and elected offices to establish contracting goals to ensure that a designated percentage of their contracted funding is invested in M/WBEs.
LL 174 only applies to a modest slice of the City’s procurements – only a quarter of the City’s total procurement portfolio is subject to the requirement to set and comply with M/WBE participation goals. But even here, the City is falling short of its mandated objective. M/WBEs are winning more contracts than in prior fiscal years, but less than 10% of the value of even the narrowed portfolio of contracts subject to LL 174 participation goals were registered to M/WBEs. And the “disparity with the disparity” remains. The value of contracts with Black, Hispanic, or women-of-color owned businesses each hover near 1%.
In addition to presenting detailed data on the City’s M/WBE procurement, this Report also evaluates the Administration’s efforts to move the needle. It finds meaningful effort, some progress on prior recommendations, and substantial areas for continued improvement. By shining a spotlight on M/WBE contracting, the Report aims to identify progress, confront shortcomings honestly, and make recommendations for much-needed improvement to help enable the City to deliver on its commitment for M/WBEs to receive their fair share of City contracting.
Current State
- M/WBEs continue to win only a small share of City contracts. M/WBEs accounted for only 5.3% of the value of all new City contracts and Purchase Orders (“POs”) registered in FY23, and just 9.8% of the narrower universe of City contracts and POs subject to M/WBE participation goals under LL 174. Similarly, M/WBEs received only 9.5% of the City’s total spending on prime contracts subject to LL 174 goals in FY23.[2]
- M/WBEs are winning more contracts, but those contracts are, on average, for a small fraction of the value of the contracts won by firms owned by white men. Though M/WBEs accounted for 61.8% of the total number of new contract registrations and POs subject to LL 174 participation goals, these contracts only account for 9.8% of the total value. The average value of a new contract registered in FY23 to a Non-Certified firm was $4.6 million, over nine times larger than the average value of a new contract registered to a M/WBE, which was just $511,000.[3]
- The “disparity within the disparity” remains severe. The value of contracts with Black, Hispanic, or women-of-color owned businesses each hovers at just 1%.
- Only 1.16% of the value contracts and POs subject to LL 174 participation goals were registered to Black M/WBEs, and only 0.96% to Hispanic M/WBEs.
- Only a combined 1.03% of the value of contracts and POs subject to LL 174 participation goals were registered to businesses owned by women of color (and more than half of these were registered to businesses owned by Asian American women). Male-owned MBEs account for nearly 8 times the count of registered contracts and POs than women-owned MBEs.[4]
- Most M/WBEs don’t benefit from City contracting. In FY23, only about 20% of City-certified M/WBEs had a contract, PO, or approved subcontract registered by the City.[5]
- More than half of contracts awarded to M/WBEs are registered late. Approximately 61% of M/WBEs contracts registered in FY23 were retroactive. This is a particular challenge for smaller firms without sufficient working capital to endure long wait times for payment.
Findings
- Existing City tools don’t do enough to connect agencies and M/WBEs. There is no one centralized place to see planned procurement opportunities. City tools rely heavily on commodity codes that are ineffective in linking M/WBEs and agencies. In focus groups, M/WBES consistently reported this as a significant barrier.
- Agencies are not taking advantage of the increased M/WBE Noncompetitive Small Purchase method (“M/WBE NCSP method”) threshold. Despite the increases in this threshold, which was increased from $500,000 to $1 million during FY 23, and subsequently increased to $1.5 million, the average value of a contract registered using this method was merely $185,762.
- Master Agreements awarded to M/WBEs are not used anywhere near capacity. Despite both large volumes and values of master agreements registered to M/WBEs, they are less likely to be used than those registered to their Non-Certified counterparts and in many instances result in no usage at all.[6]
- Goal-setting oversight is insufficient for contract changes and modifications. As such, the City must ensure it is fully examining and taking advantage of ways to maximize getting dollars to M/WBEs, even beyond the initial contract award.
Recommendations
Recommendation #1: Streamline connections between M/WBEs and Agencies. The City must strengthen its tools to connect M/WBEs to contracting opportunities. The City should create one repository of current and planned procurement opportunities, standardize commodity code selection and searches across agencies procuring similar goods and services, and develop curated resources that simplify the ways to find procurement opportunities and eligible M/WBEs.
Recommendation #2: Assess effectiveness of certification by surveying underutilized firms. Surveys can help the City understand why the vast majority of certified M/WBEs do not do business with the City.
Recommendation #3: Strengthen goal-setting procedures, support, and oversight. The City must establish and enforce standardized expectations for setting goals and monitoring compliance for all eligible contracts, including for contract changes and modifications.
Recommendation #4: Increase utilization of M/WBEs in human services contracting. M/WBEs already offer essential human services, so the City should aim for higher contracting with M/WBEs in this sector. It must ensure that M/WBEs are not precluded from prime contracting opportunities and more effectively establish processes for M/WBE subcontracting across human services contracts.
Agency and Industry Highlights
In addition to providing analyses of the overall state of City procurement with M/WBEs, this Report provides a snapshot for each agency and examines M/WBEs participation by industry. Utilizing a new overall performance metric developed to account for difference among agencies, it examines the relative performance of agencies in doing LL 174-elgible business with M/WBEs as compared to their peers with similarly sized LL portfolios.[7] In FY23:
- Among agencies with large LL 174-eligible contracting portfolios, the Department of Environmental Protect (DEP) was ranked first and the Department of Transportation (DOT) was ranked last. The Office of Technology and Innovation (OTI) had the most relative improvement from FY22.
- Among agencies with moderate LL 174-eligible contracting portfolios, the Department of Homeless Services (DHS) was ranked first and the Department of Citywide Administrative Services (DCAS) was ranked last. DHS also had the most relative improvement from FY22.
- Among agencies with small LL 174-eligible contracting portfolios, the Law Department (LAW) was ranked first and the Department of Finance (DOF) was ranked last. LAW also had the most relative improvement from FY22.
- Among agencies with micro LL 174-eligible contracting portfolios, the Comptroller’s Office (COMP) was ranked first and the Civilian Complaint Review Board (CCRB) was ranked last. The Business Integrity Commission (BIC) had the most relative improvement from FY22.
- The Office of Technology and Innovation (140 registrations), the Department of Transportation (101 registrations), and the Department of Sanitation (62 registrations) made the most frequent use of the M/WBE Noncompetitive Small Purchase method in FY23.
- The Department of Education (“DOE”) is a non-mayoral agency and previously was not subject to LL 174 participation goals. However, in FY23 DOE’s Procurement Policy and Procedures were amended to implement a M/WBE goals program consistent with LL 174. FY23 is the first fiscal year in which the procurement Rules were legally effective. M/WBEs accounted for 8.92% of DOE prime contract and PO registrations subject to participation goals.[8]
- Contracts for construction services (7.5%) and standard services (12.2%) had lower M/WBE utilization rates than those for goods (63.6%) and professional services (21.63%).
Approach
This Annual Report provides a comprehensive review of the Fiscal Year 2023 (“FY23”) data of prime contracts registered by New York City agencies with this Office to examine if and when M/WBEs are awarded contracts, analyzing by procurement method, dollar value, and industry. Reviewing these indicators shines light on the procedural roadblocks that perpetuate inequities in how the City contracts with M/WBEs.
In preparing for this Report, the Comptroller’s Office held a series of M/WBE Round Tables in each borough to gather stakeholder feedback from small and large M/WBEs across several sectors and industries. The feedback from these M/WBEs informed the findings and recommendations included in this Report. Direct testimonies from the participants of these sessions can be heard in the video, M/WBE Firsthand Stories, found at https://www.youtube.com/watch?v=V_VdrqwJDHA.
Data
All data for this report was extracted from the City’s Financial Management System (FMS) during the summer and autumn of 2023.[9] This Report largely measures M/WBE utilization in alignment with the requirements codified in LL 174 and Section 6-129 of the New York City Administrative Code (“Administrative Code”). The requirements are applicable only for eligible contracts, which are defined in the “M/WBE Program Overview” section of this Report. Therefore, this data set is limited to the City’s utilization of City-certified vendors and does not report on the utilization of vendors certified by the State as MWBEs or as Disadvantaged Business Enterprises (“DBE”), which may be requirements tied to non-City funding sources.[10] Additionally, this Report excludes data related to the registered Renewals, given that, by definition, these are re-registrations of existing contacts that have been reported on in prior years and are not reflective of new efforts to contract for these goods or services.
Compliance with the requirements of the M/WBE Program can be achieved at both prime and subcontracting levels. However, given that the City does not have the tools to properly track and report on subcontractors, as discussed extensively in last year’s report, the ability to measure compliance with M/WBE participation goals met by subcontracts is limited. Therefore, unless otherwise stated, this Report primarily focuses on analyzing prime contract data.
City procurement systems are limited and do not include the necessary data to confirm if a contract is funded by State or Federal funds. Due to these limitations, LL 174-eligible data in this Report includes some contracts that may actually be excluded from LL 174.
Unless specified, this Report does not include data related to contracts issued by some non-mayoral entities (including at the time of this report the Department of Education, the Economic Development Corporation, NYC Health + Hospitals, and the New York City Housing Authority).[11] In an effort to share information on the use of City dollars more generally, in some circumstances data is included for contracting agencies and procurement actions not covered by LL 174. The report will specify whether analyses pertain to contracts subject to LL 174 participation goals or more generally to other specified data sets. A full list of excluded considerations is included in Appendix C of this Report.
M/WBE Program Overview
The City’s M/WBE program was developed to expand opportunities for minority and women entrepreneurs to access government contracts and grow their businesses. It is currently governed by Section 6-129(b) of the Admin Code, which codifies Local Laws 174 and 176 enacted by the City Council in 2019. This Report often focuses on procurements “subject to LL 174 participation goals”, for which city agencies have a legally mandated responsibility to meet specified M/WBE participation goals. These goals can be met by awarding a prime contract to a M/WBE, or by requiring a Non-Certified prime vendor to subcontract a specified percent of the contract value to M/WBEs. When used effectively, participation goals ensure maximum M/WBE utilization even in circumstances where the chosen procurement method does not result in a contract award to a M/WBE prime.
M/WBE Certification
The Department of Small Business Services (“SBS”) is responsible for certifying that vendors meet the criteria to be designated as a New York City M/WBE (“City-certified”)[12]. Businesses owned by people of color and women are required to be City-certified by SBS in order to be eligible to qualify for procurement opportunities exclusively targeted to M/WBEs such as those via the M/WBE NCSP method[13]. Similarly, agencies may only avail themselves of M/WBE-targeted nimble tools and receive credit towards participation goals when contracting with City-certified M/WBEs. As discussed throughout this report, Certification is a significant first step that M/WBEs take towards their City contracting journey. Unfortunately, throughout the M/WBE Round Tables, M/WBEs expressed frustration at the length and complicated nature of the process[14].
Businesses that want to certify as M/WBEs with other municipalities to either further expand their contracting portfolio or to be eligible for non-City funding opportunities are also required to also be independently certified as a M/WBE with those entities. Given that certification reciprocity does not exist among local public contracting entities, including New York State, Port Authority of New York and New Jersey, and the New York City School Construction Authority, vendors experience the burdens of these time-consuming and mostly duplicative processes many times over. As a member of the Capital Process Reform Task Force, this Office supported the proposal for State Legislation that established certification reciprocity between New York City and New York State. Although the legislation passed in both the State House and Assembly during the 2023-2024 legislative session, the legislation was ultimately vetoed by the Governor in December 2023[15]. This Office remains in support of certification reciprocity and looks forward to its successful passage during the upcoming legislative session.
Procurements Subject to LL 174 Participation Goals
Agencies are required to ensure that M/WBE participation goals are met for all eligible procurements in the following industries[16]:
- Professional services: the provision of various kinds of expert advice and consulting, including legal services, medical services, and information technology and construction-related consulting services
- Standard services: services other than professional services and human services such as custodial services, security guard services, stenography services and office machine repair
- Construction services: dealing in the planning, design, or construction of real property or other public improvements
- Goods (valued up to $1 million): all personal property, including but not limited to equipment, materials, printing, and insurance, excluding land or a permanent interest in land
These goals include specific contracting participation goals for each individual M/WBE category: “Black Americans, Asian Americans, Hispanic Americans, Native Americans, Women, and Emerging”. While LL 174 permits agencies to set an “unspecified goal,” which a vendor may meet by using an M/WBE regardless of certification category, when setting participation goals, agencies are required to consider the potential for the purchase to provide opportunities for specific categories of M/WBEs to develop greater capacity and to increase competition for city procurements.[17]
Specified Exclusions
In some specified circumstances, agencies are exempt from establishing M/WBE participation goals for contracts procured through the following methods. As a result of these exclusions, less than 25% of total City procurement value for FY23 was subject to LL 174 M/WBE participation goals.[18]
Chart 1: FY23 Value of Contracts and PO Subject to LL 174 Participation Goals
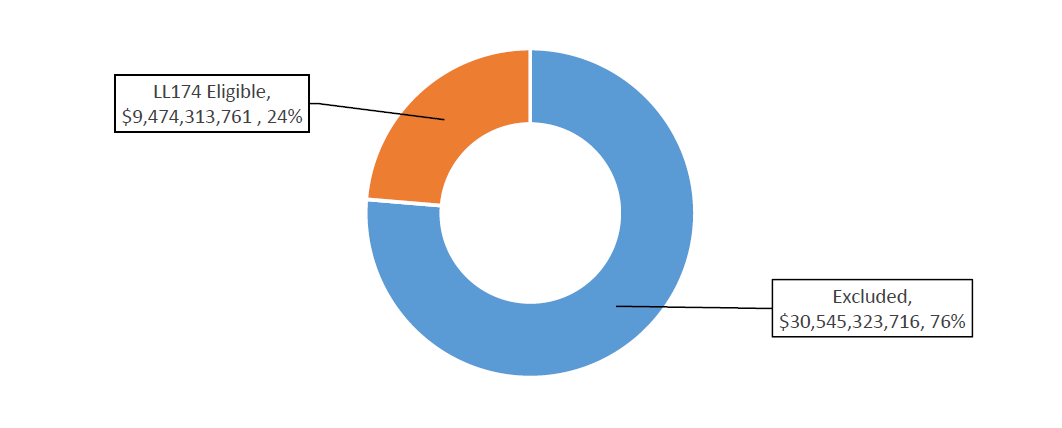
Excluded procurement categories include:
- Human services procurements: in FY23, the $15.8 billion in contract and PO value under the human services industry accounted for nearly 40% of all procurements.
- Any procurement that results in an award to a not-for-profit entity: Contracts and POs registered to not-for-profit entities totaled over $15.14 billion in FY23, accounting for 37.85% of all procurement value.[19]
- Sole source contracts: the $3.4 billion in Sole Source contract and PO value registered in FY23 represents 8.5% of all procurement value in the fiscal year.
- Government-to-Government procurements: Totaling $1.9 billion in contracts and POs in FY23, this method accounted for nearly 5% of all FY23 procurement value.
- Emergency procurements: Totaling $1.1 billion in contracts and POs in FY23, this method accounted for nearly 3% of all FY23 procurement value.
- Intergovernmental procurements (NY State Office of General Services (OGS)/U.S. General Services Administration (GSA)): Totaling $1.4 billion in contracts and POs in FY23, this method accounted for 3.5% of all FY23 procurement value.
- Contracts subject to federal or state funding requirements that preclude the City from imposing M/WBE participation goals or impose their own Disadvantaged Business Enterprise (DBE), MBE, or WBE goals.[20]
- Any procurement that is not competitively awarded (i.e., Required Authorized Sources, etc.)
Exemption for human services contracts is particularly significant, as human services contracts made up the largest share by both volume of contracts and contract value in FY23. Many of these contracts include substantial subcontracting to for-profit firms, which could be subject to M/WBE participation goals. Later sections of this Report detail the impact of excluding nearly half of the City’s procurement portfolio from M/WBE participation goals and offers recommendations to increase utilization in this critical sector.
This Office released “Rethinking Emergency Procurements”[21] on November 30, 2023, which included a focused analysis on M/WBE utilization in emergency procurements. M/WBEs were awarded just 15% of the count of contracts included in the Report’s lookback period, amounting to only 3.5% of the total emergency procurement value.
Additional context and information about the City’s M/WBE participation goals program and governing legislation can be found in Appendix A of this Report.
Assessing the City’s Progress on FY22 Recommendations
While there is no magic wand solution to the decades of systemic racism that continue to perpetuate in NYC’s contracting practices, there are real, tangible steps the City can take to address some of the biggest problems contributing to the inequity. Last year’s FY22 Annual Report on M/WBE Procurement set forth a series of recommendations for procedural updates, systematic enhancements, and legislative reforms. While the City has made progress in some of these areas, much work remains.
This FY23 Report includes updates on key performance indicators presented in last year’s Report as well as an assessment of the City’s progress towards implementing the FY22 recommendations. This Report also includes some additional, focused analyses and offers additional recommendations developed to move the contracting needle in a manner that results in more impactful M/WBE utilization. Taken together, these steps will address some of the key underlying problems that prevent the City from increasing its contracting portfolio with M/WBEs.
| FY22 Report Recommendation | Progress | |
| 1. Ensure that M/WBEs have access to higher value contracts through competitive procurements | 1.1 Establish more PQLs | In progress |
| 1.2 Utilize “Best Value” preferences | In progress | |
| 2. Bolster agencies’ use of existing discretionary procurement methods | 2.1 Achieve broader and higher dollar use of the M/WBE NCSP method | In progress |
| 2.2 Raise the M/WBE NCSP method threshold to $1.5 million | Complete | |
| 2.3 Ensure that discretionary micropurchases and small purchases are more fairly distributed to M/WBEs | In progress | |
| 3. Reform the subcontracting process and incorporate it into PASSPort | No progress | |
| 4. Provide stronger tools to City agencies | 4.1 Update the training and guidance that agencies receive to reflect changes in procurement methods, markets, City goals, and best practices | In progress |
| 4.2 Make data relevant to M/WBE procurement more easily accessible across City data tools and contracting systems | In progress | |
| 4.3 Validate commodity codes so agencies can find the right M/WBEs | No progress | |
| 5. Improve the timeliness of City M/WBE contract registration | No progress | |
Projects Completed
One recommendation from the FY22 Report is complete. Following advocacy by the Mayor’s Office, the Capital Process Reform Task Force (in which the Comptroller’s Office is a participant), and stakeholders, the State Legislature passed and the Governor signed S.7563, which increases the threshold for eligible procurements from M/WBEs from $1 million to $1.5 million. Due to proactive measures by the Procurement Policy Board (“PPB”), which includes representatives appointed by the Mayor’s Office of Contract Services and the Comptroller’s Office, the City was able to quickly operationalize and implement this threshold change. This increased threshold for the M/WBE Noncompetitive Small Purchase method (“M/WBE NCSP method”) offers an avenue for M/WBEs to more effectively compete for larger contracts. This Report offers an assessment of the effectiveness of the City’s use of the procurement method at the thresholds in existence during the reporting period.
The 2023-2024 legislative session yielded more wins that stem out of the work of the Capital Process Task Force. The Task Force was successful in securing legislative approval of Bill S7526 that allows for an expansion of the City’s construction mentorship program to all City agencies.[22] Mentorship has long proven to be a key tool to develop small M/WBEs and support their growth to undertake larger projects and prime contracts. The NYC School Construction Authority has run a successful program for many decades and the State authority was recently granted to DDC during the 2019 session. The DDC mentorship program, although in early stages, is similarly showing the promise of success. The newest legislation will now allow for all NYC construction contracting agencies to establish pathways that provide M/WBEs training, networking, and bidding opportunities to support and increase business opportunities. Additionally, Bill S7385 allows agencies to use Owner-Controller Insurance Programs (OCIP) and Contractor-Controlled Insurance Programs (CCIP).[23] This new way of securing insurance will create greater access to projects for M/WBEs and small contractors by removing the hurdle of prohibitively high insurance costs that have historically prevented M/WBEs from successfully bidding on City projects.
Work In Progress
City agencies have made some progress across many of the other recommendations set forth in last year’s Report, but significant work remains.
In Fiscal Year 2023, the City established 6 new M/WBE-specific Pre-Qualified Lists (“PQLs”). Since then, two agencies released opportunities for M/WBEs to qualify for inclusion on 10 PQLs. This Office will continue to monitor the number of approved M/WBEs in established PQLs and track the City’s issuance of solicitations and contract awards using PQLs to determine if these efforts are effective in increasing M/WBE utilization.
The Mayor’s Office of Contract Services (“MOCS”) issued guidance and training on “best value” in 2023. Analyses in this Report show that 90% of contracts registered via competitive sealed proposal method (CSP) were registered to Non-Certified firms. Better enforcement and utilization of “best value” point or price preferences for competitive procurements remains a critically important priority for the City to address.
This Report includes a specialized focus on the M/WBE NCSP method in Finding #2. Agencies utilized this method more frequently in FY23, but the average value of a contract registered using this method was only $185,762 – far below the maximum threshold of $500,000 (and up to $1 million at some points in the year). This Office will continue to monitor the use of this method to ensure that agencies are maximizing the State-authorized threshold and utilize it to direct higher dollar value opportunities to M/WBEs.
In FY23 the relative share of the value of small purchases registered to M/WBEs (26%) increased from the prior fiscal year (14%). The share of micropurchases (18%) registered to M/WBEs did not increase from FY22 (17.9%).
This Office has been closely working with the Department of Small Business Services (“SBS”) on integrating key City systems that will streamline M/WBE procurement data. Through these efforts, M/WBE Vendor Profiles are expected to be updated in the SBS Directory to include a link to Checkbook NYC that provides real-time registration and spend data that more accurately reflects the vendor’s contracting capacity. This integration is anticipated to launch in February 2024, and offers agencies up-to-date information to support vendor market research and capacity that are key when targeting vendors for prime contracting opportunities and establishing aggressive and realistic subcontracting goals. Later sections of this Report discuss additional system enhancements that remain unaddressed.
Work Not Started
There are several essential Recommendations in last year’s Report that the City has not begun to address. The City has not effectively validated commodity codes or released any updated guidance to support M/WBE goal-setting, both of which are key to supporting agencies and M/WBEs to connect on contracting opportunities.
As discussed in last year’s Report, as well as emphasized in the Rethinking Emergency Procurements Report[24], reforming the City’s subcontracting process is critical for M/WBE participation as well as to hold the city accountable for vendor integrity and transparency measures. MOCS has announced a planned enhancement to PASSPort to “streamline subcontractor approval and subcontractor payment submission processes”, anticipated to be released in Spring of 2024.
This Report includes a focused section on retroactivity rates for M/WBEs, which have not improved since FY22 (In FY23, 61% of new M/WBE contracts were registered after their contract start date, compared to 55% in FY22). M/WBEs to continue to advance funding, borrow to cover those advances, adjust or delay work, and in some cases provide City services without any guarantee of pay.
Current State
This Annual Report presents data on City procurements that is essential to evaluating efforts to achieve measurable progress in increasing M/WBE utilization. As mentioned in last year’s Report, to better understand the current state of utilization, this Report analyzes trends and progress across 5 key areas of the City’s contracting portfolio:
- The share of contract registration value that was registered to M/WBEs[25]
- The average value of contracts registered to M/WBEs, in comparison to the average value of contracts registered to firms owned by white men
- A disaggregated analysis of key indicators to understand the disparate impacts across racial and gender categories
- The number of unique M/WBEs that do business with the City
- The retroactivity of contract registration for M/WBEs
Taken together, these areas of analysis can demonstrate a more comprehensive understanding of the current state of the City’s utilization of M/WBEs.
It is important to note that the impacts of some newly implemented policies and systems may take some time before they begin to demonstrate measurable value. That said, this Report’s analyses demonstrate that the City and its agencies are still falling short of goals to contract with diverse businesses.
M/WBEs only won 5% of the value of City contracts
In FY23, the City registered 147,196 new prime contracts and POs valued at over $40,019,637,477. This includes many areas of contracting that are not subject to LL 174 participation goals as outlined in the “M/WBE Program Overview” section of this Report, including human services contracts (which account for approximately 40% of the registered contract value citywide). Across all City contracts and POs, 27,070 were registered to M/WBEs, representing 5.33% of the value and 18.39% of the volume. This relative share of registered contracts remains generally stagnant with the share from the prior fiscal year.
Table 1: Volume of All Registered New Contracts and POs Citywide, FY21-23
| FY21 | FY22 | FY23 | ||||
|---|---|---|---|---|---|---|
| Certification Type | # of Contracts | % Share of Contracts | # of Contracts | % Share of Contracts | # of Contracts | % Share of Contracts |
| M/WBE | 21,373 | 22.41% | 24,696 | 18.12% | 27,070 | 18.39% |
| Non-Certified | 74,005 | 77.59% | 111,574 | 81.88% | 120,126 | 81.61% |
| Grand Total | 95,378 | 100.00% | 136,270 | 100.00% | 147,196 | 100.00% |
Table 2: Value of All Registered New Contracts and POs Citywide, FY21-23
| FY21 | FY22 | FY23 | ||||
|---|---|---|---|---|---|---|
| Certification Type | Total Registered Value | % Share of Value | Total Registered Value | % Share of Value | Total Registered Value | % Share of Value |
| M/WBE | $1,465,189,854 | 4.63% | $2,657,207,856 | 5.96% | $2,132,177,536 | 5.33% |
| Non-Certified | $30,198,591,820 | 95.37% | $41,903,392,903 | 94.04% | $37,887,459,942 | 94.67% |
| Grand Total | $31,663,781,674 | 100.00% | $44,560,600,759 | 100.00% | $40,019,637,477 | 100.00% |
The numbers are somewhat better for new contract registrations and POs subject to LL 174 M/WBE participation goals. Per Tables 3 and 4, M/WBEs accounted for 60.32% of new contracts and POs subject to LL 174 participation goals by count, and 9.82% of the associated value.[26] The 9.82% share reflects a decrease from prior fiscal years.
This small share is especially disappointing, given the actual diversity and demographics of the City. For reference throughout this report: According to the U.S. Census, in 2022, New York City was 31.9% non-Hispanic white, 28.9% Hispanic or Latino, 23.4% Black, 14.3% Asian or Pacific Islander, 0.5% Native American, and 7.1% two or more races. 52% of New Yorkers identify as female, and 48% male.[27]
Chart 2: FY23 Value of Contracts and POs Subject to LL 174 Participation Goals
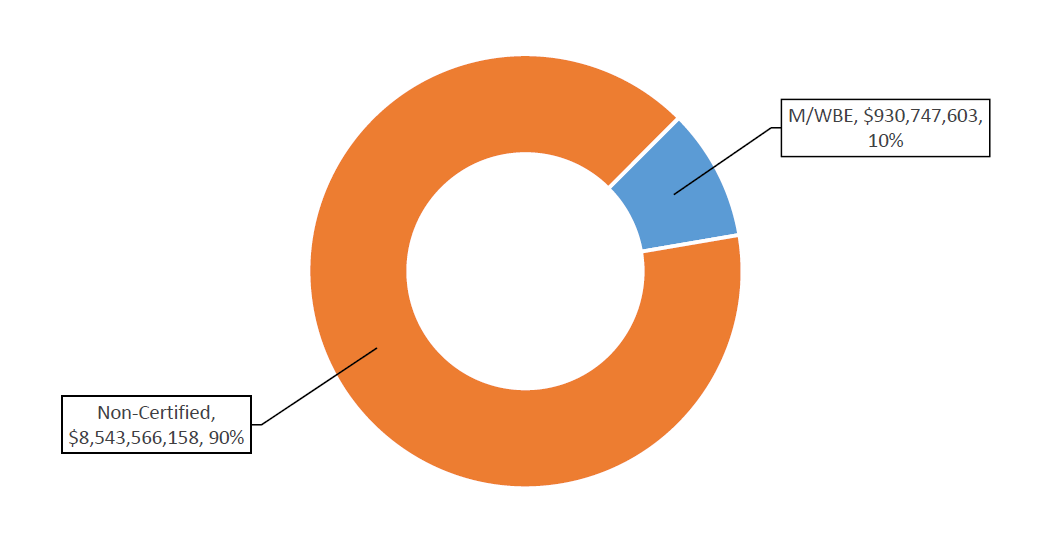
Table 3: Volume of Contracts and POs Subject to LL 174 Participation Goals, FY21-23
| FY21 | FY22 | FY23 | ||||
|---|---|---|---|---|---|---|
| Certification Type | # of Contracts | % Share of Contracts | # of Contracts | % Share of Contracts | # of Contracts | % Share of Contracts |
| M/WBE | 16,072 | 61.77% | 16,900 | 58.54% | 16,641 | 60.32% |
| Non-Certified | 9,948 | 38.23% | 11,970 | 41.46% | 10,947 | 39.68% |
| Grand Total | 26,020 | 100.00% | 28,870 | 100.00% | 27,588 | 100.00% |
Table 4: Value of Prime Contracts and POs Subject to LL 174 Participation Goals, FY21-23[28]
| FY21 | FY22 | FY23 | ||||
|---|---|---|---|---|---|---|
| Certification Type | Total Registered Value | % Share of Value | Total Registered Value | % Share of Value | Total Registered Value | % Share of Value |
| M/WBE | $881,827,424 | 16.83% | $972,368,134 | 16.01% | $930,747,603 | 9.82% |
| Non-Certified | $4,357,238,649 | 83.17% | $5,100,754,332 | 83.99% | $8,543,566,158 | 90.18% |
| Grand Total | $5,239,066,073 | 100.00% | $6,073,122,466 | 100.00% | $9,474,313,761 | 100.00% |
For a number of reasons, including the pervasive underreporting of subcontract data in PIP, this Report’s primary focus is on the utilization of M/WBEs within prime contracting. Mayoral agencies approved subcontract records against just 380 (~13%) of the 2,927 LL 174-eligible prime contracts registered in FY23 at the time the data for this report was pulled from FMS.[29] The 1,246 subcontract records entered for M/WBEs accounted for $539.79 million (44.90%) of the $1.2 billion in recorded subcontract value, significantly exceeding the ratio among prime contracts. It is important to note that subcontract values are not additive to the value of prime contract registrations given that they reflect a subset of the reported prime values. As such, this Report does not combine prime and subcontract utilization figures.
Table 5: FY23 Volume and Value of Subcontracts in PIP Subject to LL 174 Participation Goals
| Certification Type | # of Subcontracts | % Share of Subcontracts | Total Subcontract Value | % Share of Subcontract Value |
| M/WBE | 1,246 | 61.87% | $539,799,664 | 44.90% |
| Non-Certified | 768 | 38.13% | $662,509,594 | 55.10% |
| Grand Total | 2,014 | 100.00% | $1,202,309,258 | 100.00% |
Among the 36 rated agencies in this Report (Mayoral agencies, the Office of the Comptroller, and the DOE), 23 had zero approved subcontract records in PIP against LL 174-eligible prime contracts. DOE was the holder of the largest number of LL 174-eligible contracts in FY23 among this group. Without subcontract records in PIP, there is insufficient detail for oversight agencies to measure that agencies and vendors are both compliant with and progressing towards achieving required M/WBE participation goals.
Spend
In addition to analyzing contract registration data, this Report also summarizes data relating to the City’s actual payments to vendors. This includes all payments made to both prime and sub vendors in FY23 (regardless of the year the contract was registered in).
To determine what spending was subject to LL 174 performance goals, individual transactions were mapped their corresponding contract or purchase order. LL 174 exclusions were then applied based on the characteristics of the contracts or POs associated with vendor payments.
The City spent a total of $11.79 billion in FY23 (prime contracts registered in FY23 and prior fiscal years subject to LL 174 participation goals), 9.51% of which ($1.12 billion) was spent with M/WBE primes.
Table 6: Prime Spend Subject to LL 174 Participation Goals, FY21-23[30]
| FY21 | FY22 | FY23 | ||||
|---|---|---|---|---|---|---|
| Certification Type | Total Registered Value | % Share of Value | Total Registered Value | % Share of Value | Total Registered Value | % Share of Value |
| M/WBE | $551,356,188 | 9.84% | $531,495,571 | 9.45% | $1,122,110,711 | 9.51% |
| Non-Certified | $5,053,372,286 | 90.16% | $5,091,193,324 | 90.55% | $10,676,634,838 | 90.49% |
| Grand Total | $5,604,728,473 | 100.00% | $5,622,688,895 | 100.00% | $11,798,745,549 | 100.00% |
By Industry
M/WBE utilization varies depending on the industry. The construction services and standard services industries see some of the lowest spending and registration values to M/WBEs. Only 7.50% of construction services and 12.20% of standard services prime contract registration value subject to LL 174 participation goals were registered to M/WBEs. Similarly, only 10.80% of prime construction services spending and less than 6.14% of prime standard services spending was with M/WBEs. Additional details analyzing M/WBE utilization at the industry level can be found in the “M/WBE Utilization by Industry” section of this Report.
Table 7: FY23 Value of M/WBE Contracts and POs Subject to LL 174 Participation Goals, by Industry
| M/WBE | Non-Certified | |||
|---|---|---|---|---|
| Industry | Total Contract and PO Value | % Share of Contract and PO Value | Total Contract and PO Value | % Share of Contract and PO Value |
| Construction[31] | $244,140,108 | 7.50% | $3,010,027,727 | 92.50% |
| Goods <$1 million | $108,509,861 | 63.88% | $61,346,485 | 36.12% |
| Professional Services | $463,911,348 | 21.63% | $1,681,146,490 | 78.37% |
| Standard Services | $111,198,858 | 12.20% | $800,249,022 | 87.80% |
| Grand Total | $927,760,175 | 14.32% | $5,552,769,725 | 85.68% |
The M/WBE prime vendor share of FY23 spending shows similar variations across industries.
Table 8: FY23 Prime Vendor Spend Subject to LL 174 Participation Goals, by Industry
| M/WBE | Non-Certified | |||
|---|---|---|---|---|
| Industry | Total Value | % Share of Value | Total Value | % Share of Value |
| Construction | $401,936,812 | 10.80% | $3,318,175,322 | 89.20% |
| Goods <$1 million | $111,379,347 | 43.40% | $145,227,630 | 56.60% |
| Professional Services | $366,770,386 | 19.69% | $1,495,804,018 | 80.31% |
| Standard Services | $228,697,563 | 6.14% | $3,498,268,712 | 93.86% |
| Grand Total | $1,108,784,107 | 11.59% | $8,457,475,681 | 88.41% |
It is important to note that these trends look different for subcontracted spending across industries. M/WBEs receive higher shares of subcontracted spending than Non-Certified firms in construction, professional services, and standard services. M/WBEs only receive a very small share of Goods subcontracted spending, as there is little subcontracting in this industry generally.
Table 9: FY23 Subcontractor Spend Subject to LL 174 Participation Goals, by Industry
| M/WBE | Non-Certified | |||
|---|---|---|---|---|
| Industry | Total Value | % Share of Value | Total Value | % Share of Value |
| Construction | $184,291,683 | 51.48% | $173,696,842 | 48.52% |
| Goods <$1 million | $2,993,891 | 42.85% | $3,992,454 | 57.15% |
| Professional Services | $50,874,280 | 64.59% | $27,886,145 | 35.41% |
| Standard Services | $37,147,293 | 48.50% | $39,449,582 | 51.50% |
| Grand Total | $275,307,147 | 52.91% | $245,025,022 | 47.09% |
M/WBEs are winning more business, but their contracts are for a small fraction of the value of the contracts won by firms owned by white men
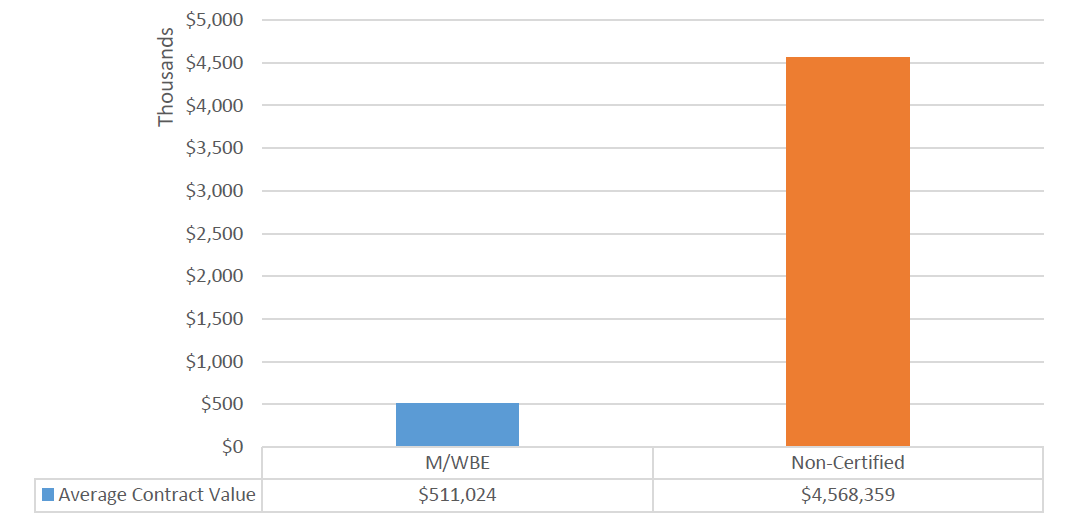
In FY23, M/WBEs accounted for 60.32% of the volume of new contract registrations and POs subject to LL 174 participation goals. However, these contracts only account for 9.82% of the respective value.[32]
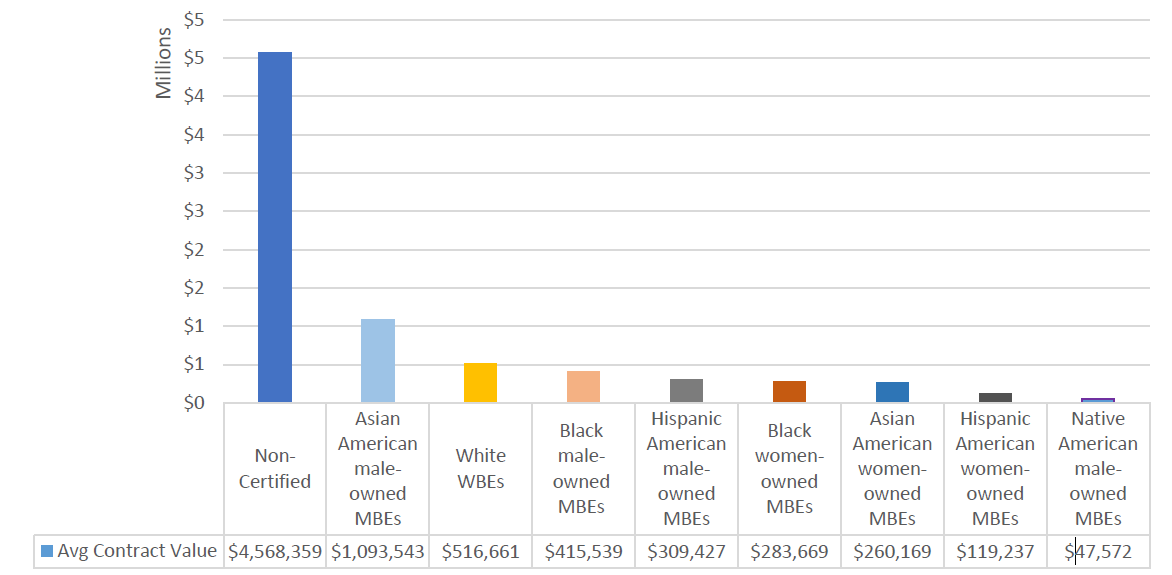
Year-over-year analyses show a key factor contributing to the City’s underutilization of M/WBEs: among FY23 registrations subject to LL 174 participation goals, the average dollar value of a prime contract registered to a M/WBE ($511,000), was approximately 11% of the average dollar value of a prime contract registered to a Non-Certified firm ($4.56 million).[33]
Chart 3: FY23 Average Value of Contracts Subject to LL 174 Participation Goals[34]
Award Method Analyses
A tension exists in the City’s M/WBE procurement: Award methods with agency discretion – such as Micro purchase, Small Purchase, and the M/WBE NCSP method – are more likely to result in a prime contract with an M/WBE; however, these discretionary methods generally result in lower-dollar-value contracts. That said, even within competitive methods – both Competitive Sealed Bid (CSB) and Competitive Sealed Proposal (CSP) – the average contract value for M/WBEs is far lower than for Non-Certified firms.
This analysis also underscores the need for more stringent goal setting and subcontractor tracking and reporting. In FY23, 94.14 % of Negotiated Acquisition contracts were registered to Non-Certified firms. While the basis for using the Negotiated Acquisition method is largely dictated by a limited availability of vendors which therefore makes it difficult to implement policy directives to encourage increased prime contracting, it highlights procurement opportunities where the City could achieve higher M/WBE utilization through subcontracting.
Additional information about each of these procurement methods can be found in Appendix A of this Report.
Table 10: FY23 Contracts by Award Method, Citywide[35]
| Award Method Category | M/WBE | Non-Certified | ||
|---|---|---|---|---|
| # of Contracts | % Share of Contracts | # of Contracts | % Share of Contracts | |
| CSB | 150 | 23.08% | 500 | 76.92% |
| CSP | 81 | 9.82% | 744 | 90.18% |
| Accelerated Procurement | 9 | 14.06% | 55 | 85.94% |
| Demonstration Project | 0 | 0.00% | 8 | 100.00% |
| Innovative Procurement | 2 | 1.87% | 105 | 98.13% |
| Micropurchase | 24,380 | 18.00% | 111,069 | 82.00% |
| Negotiated Acquisition | 41 | 5.86% | 659 | 94.14% |
| Small Purchase Contracts – General | 1,127 | 25.92% | 3,221 | 74.08% |
| M/WBE NCSP method | 1,042 | 100.00% | 0[36] | 0.00% |
| Grand Total | 26,556 | 18.51% | 116,884 | 81.49% |
All of the major procurement methods result in far less than a third of the contracts going to M/WBEs. While M/WBEs fare better in some discretionary procurement methods that have specified maximum values, those do not yield meaningful spend given the low value of the thresholds. For example, M/WBEs account for 18% of micro-purchase contracts that have a threshold cap of $35,000 for construction and $20,000 for all other procurements.
Even within these lower-value methods, M/WBEs are registering contracts at average values far below the caps. During FY23, the M/WBE NCSP method was capped at a maximum value of $500,000 or $1,000,000. But the average value of a contract registered using this method was only $185,762.
Table 11: FY23 Average Value of Contracts by Award Method, Citywide
| Award Method | M/WBE – Avg Contract Value | Non-Certified – Avg Contract Value |
| CSB | $3,156,492 | $9,581,813 |
| CSP | $5,292,247 | $14,930,265 |
| Accelerated Procurement | $237,915 | $2,988,859 |
| Demonstration Project | $0 | $1,427,562 |
| Innovative Procurement | $980,659 | $1,739,332,847 |
| Micropurchase[37] | $3,715 | $2,858 |
| Negotiated Acquisition | $1,163,580 | $3,001,350 |
| Small Purchase Contracts – General[38] | $32,363 | $28,824 |
| M/WBE NCSP method[39] | $185,762 | $0 |
Disaggregated By Race
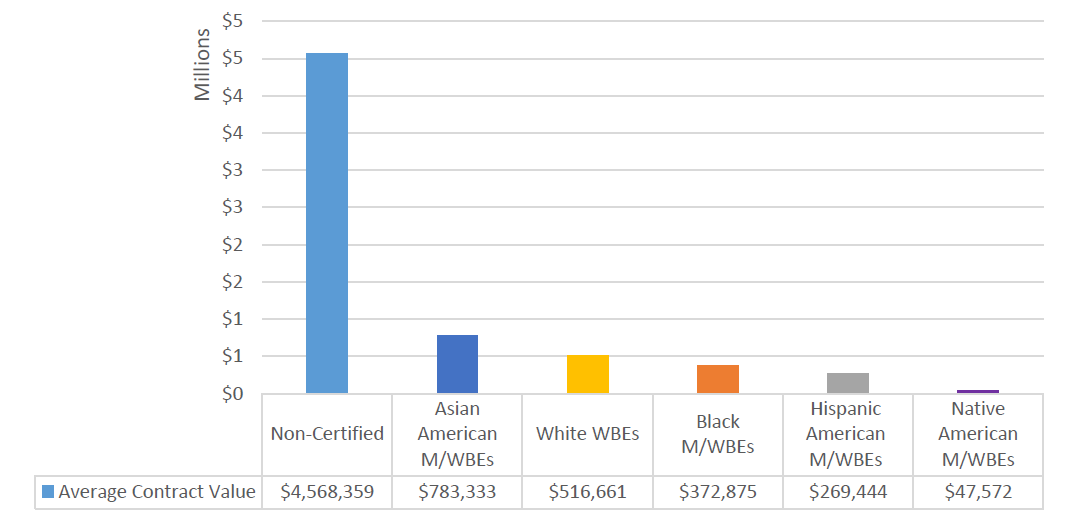
Certain underutilized M/WBE categories earn less lucrative contracts than others. Businesses owned by white women and Asian American males have much higher average values than those owned by Black people, Hispanic people, and Native American people. Though, it is worth noting that the higher average contract value for Asian American M/WBEs is driven by several high-value MMA1 contracts registered to Asian American male-owned MBEs under OTI. As this Report will discuss further in Findings #3, the full value of MMA1 contracts is often underused, if at all.
Chart 4: FY23 Average Value of Contracts Subject to LL 174 Participation Goals, by M/WBE Category
The “disparity within the disparity” remains severe. The value of contracts with Black, Hispanic, or women-of-color owned businesses each hovers at just 1%
The City underutilizes all M/WBEs across all racial and gender categories. Therefore, in order to meaningfully support all M/WBEs, the overall share of the City’s contracting portfolio going to M/WBEs must be increased. Otherwise, it will continue to assess mere pennies across M/WBEs.
When there is utilization within the M/WBE community, the data reveals that certain M/WBE categories are positively impacted less successfully. Only 1.16% of the value contracts and POs subject to LL 174 participation goals were registered to Black M/WBEs, and only 0.96% to Hispanic M/WBEs.
Overall, the City’s utilization of MBEs owned by women is significantly less than the low utilization of MBEs owned by males. Within each racial category, male certified firms consistently represent larger shares of the counts and value of registered contracts and POs. Male-owned MBEs account for nearly 8 times (11,244) the count of registered contracts and POs than women-owned MBEs (1,465). Only 10.52% of the value of contracts and POs subject to LL 174 that were registered to M/WBEs were registered to MBEs owned by women.
In a completely lone state, the City remains largely unsuccessful in contracting with businesses owned by Native Americans. The SBS Online Directory of Certified Businesses (“SBS Directory”) only includes 3 firms certified as Native American WBEs of which none had a contract or PO registered since FY21. [40]
Table 12: FY23 Contracts and POs Subject to LL 174 Participation Goals, by M/WBE Category and Gender
| M/WBE Category | # of LL Contracts and POs | % Share of LL Contracts and POs | Total LL Contract and PO Value | % Share of LL Contract and PO Value | % Share of All M/WBE LL Value |
| Asian American male-owned MBEs | 9,237 | 33.48% | $357,149,048 | 3.77% | 38.37% |
| Asian American women-owned MBEs | 776 | 2.81% | $50,593,556 | 0.53% | 5.44% |
| Black male-owned MBEs | 857 | 3.11% | $109,563,850 | 1.16% | 11.77% |
| Black women-owned MBEs | 368 | 1.33% | $36,498,152 | 0.39% | 3.92% |
| Hispanic American male-owned MBEs | 1,145 | 4.15% | $91,243,143 | 0.96% | 9.80% |
| Hispanic American women-owned MBEs | 321 | 1.16% | $10,782,402 | 0.11% | 1.16% |
| Native American male-owned MBEs | 5 | 0.02% | $150,509 | 0.00% | 0.02% |
| Native American women-owned MBEs | 0 | 0% | 0 | 0% | 0% |
| White WBEs | 3,932 | 14.25% | $274,766,943 | 2.90% | 29.52% |
| M/WBE ALL (Excluding Non-Certified) | 16,641 | 60.32% | $930,747,603 | 9.82% | 100.00% |
| Non-Certified | 10,947 | 39.68% | $8,543,566,158 | 90.18% | N/A |
| Grand Total | 27,588 | 100.00% | $9,474,313,761 | 100.00% | N/A |
Chart 5: Value of Contracts and POs Subject to LL 174 Participation Goals, by M/WBE Category, FY21-23[41]
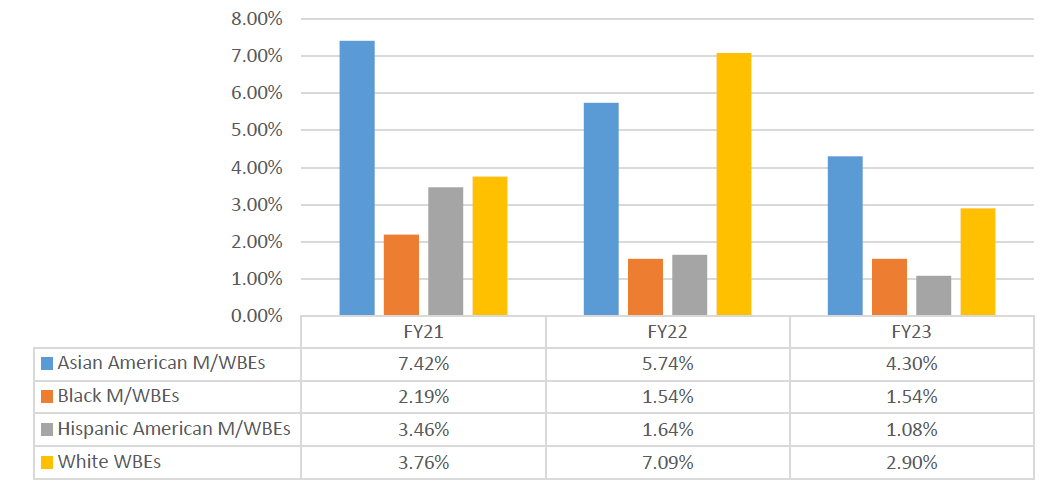
Table 13: FY23 M/WBE Contracts and POs Subject to LL 174 Participation Goals, as a Share of Total M/WBE Contracts, by M/WBE Category
| M/WBE Category | # of Contracts and POs | % of M/WBE Contracts and POs | Total Value | % Share of M/WBE value | % Share of All LL Value |
| Asian American M/WBEs | 10,013 | 60.17% | $407,742,604 | 43.81% | 4.30% |
| Black M/WBEs | 1,225 | 7.36% | $146,062,002 | 15.69% | 1.54% |
| Hispanic American M/WBEs | 1,466 | 8.81% | $102,025,546 | 10.96% | 1.08% |
| Native American M/WBEs | 5 | 0.03% | $150,509 | 0.02% | 0.00% |
| White WBEs | 3,932 | 23.63% | $274,766,943 | 29.52% | 2.90% |
| Grand Total | 16,641 | 100.00% | $930,747,603 | 100.00% | 9.82% |
These trends are true in analyzing both contract registrations and spend data – though, Black M/WBEs received an even smaller portion of prime spending in comparison to other M/WBE categories.
Table 14: FY23 Prime Spending Subject to LL 174 Participation Goals, by M/WBE Category
| M/WBE Category | Total Spend | % Share of Total LL 174 Spending | % Share of Total M/WBE Spending |
| Asian American M/WBE | $461,341,167 | 3.91% | 41.11% |
| Black M/WBEs | $99,820,024 | 0.85% | 8.90% |
| Hispanic American M/WBEs | $247,067,825 | 2.09% | 22.02% |
| Native American M/WBEs | $19,976 | 0.00% | 0.00% |
| White WBEs | $313,861,719 | 2.66% | 27.97% |
| Non-Certified | $10,676,634,838 | 90.49% | N/A |
| Grand Total | $11,798,745,549 | 100.00% | 100% |
As noted earlier in this Report, Asian American male-owned MBEs and white women-owned WBEs have higher average contract values compared to the remaining M/WBE categories. Excepting Native American M/WBEs, women-owned MBEs consistently have lower average contract values than their male counterparts within racial categories.
Chart 6: FY23 Average Value of Contracts Subject to LL 174 Participation Goals, by Race and Gender
Most M/WBEs don’t benefit from City contracting
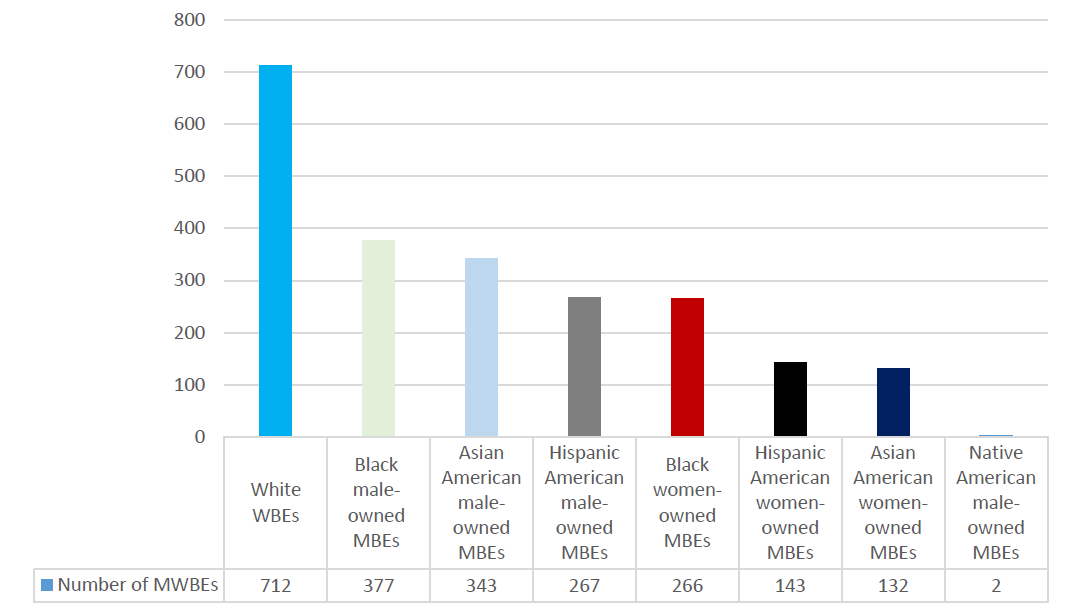
As of June 30, 2023 there were 10,992 City-certified M/WBEs in the SBS Directory. 2,242 of these certified M/WBEs entered a new contract, subcontract, or PO with the City in FY23. Though this is the highest number of unique M/WBEs with a new registration in any year on record, this still only represents 20% of all certified M/WBEs. White WBEs made up the largest share of vendors with a new contract, subcontract, or PO in FY23.
Table 15: Unique M/WBEs with New Prime Contracts, POs, or Subcontracts, FY21-23
| M/WBE Category | FY21 | FY22 | FY23 |
| Asian American male-owned MBEs | 305 | 344 | 343 |
| Asian American women-owned MBEs | 110 | 150 | 132 |
| Black male-owned MBEs | 268 | 324 | 377 |
| Black women-owned MBEs | 173 | 244 | 266 |
| Hispanic American male-owned MBEs | 221 | 244 | 267 |
| Hispanic American women-owned MBEs | 104 | 136 | 143 |
| Native American male-owned MBEs | 2 | 3 | 2 |
| Native American women-owned MBEs | 0 | 0 | 0 |
| White WBEs | 679 | 733 | 712 |
| All Male-Owned MBEs (Not Reflected in “Total”) | 796 | 915 | 989 |
| All Women-Owned MBEs (Not Reflected in “Total”) | 387 | 530 | 541 |
| Total | 1,862 | 2,178 | 2,242 |
Chart 7: FY23 Unique M/WBEs with New Prime Contracts, Purchase Orders, or Subcontracts
More than half of contracts awarded to M/WBEs are registered late
In FY23, over 61% of new contracts with M/WBEs were registered retroactively, after the beginning of their contract term, compared with the 65.94% rate for procurement contracts citywide. This forces M/WBEs to advance funds out of limited working capital, to seek to borrow in order to start the project, or to delay work. In some circumstances, it means M/WBEs are providing City services without any guarantee of pay. This is especially challenging given that average M/WBE contract sizes are smaller, and that many M/WBEs are small businesses that lack sufficient working capital and may have a more challenging time borrowing from traditional lending institutions.
Table 16: FY23 New M/WBE Contract Registrations by Retroactive Category, Citywide
| Retroactive Category | # of Contracts | % Share of Contracts | Total Contract Value | % Share of Contract Value |
| On Time or Early | 1,110 | 38.73% | $891,021,844 | 44.24% |
| Late – Within 30 Days | 655 | 22.85% | $331,736,207 | 16.47% |
| Later – Between 31-180 Days | 925 | 32.27% | $590,567,782 | 29.32% |
| Very Late – Between 181-365 Days | 126 | 4.40% | $159,695,276 | 7.93% |
| Latest – More than 1-Year | 50 | 1.74% | $41,024,601 | 2.04% |
| Grand Total | 2,866 | 100.00% | $2,014,045,710 | 100.00% |
Retroactivity rates are even higher for contracts registered using the M/WBE NCSP method, despite the fact that this Office has delegated authority to allow agencies, with appropriate oversight measures, to self-register contracts procured pursuant to this method. In doing so, M/WBEs that have been awarded contracts procured by agencies through this method do not wait up to 30 calendar days for their contract to be reviewed and registered by this Office which helps to reduce potential delays in payment. Yet, despite the time savings this delegation provides, agencies are still self-registering contracts after their start date at an even greater rate than for M/WBE contracts that are registered by this Office.
Table 17: FY23 M/WBE NCSP Method Registrations by Retroactive Category, Citywide
| Retroactive Category | # of Contracts | % Share of Contracts | Total Contract Value | % Share of Contract Value |
| On Time or Early | 314 | 30.13% | $56,981,117 | 29.44% |
| Late – Within 30 Days | 320 | 30.71% | $56,108,648 | 28.99% |
| Later – Between 31-180 Days | 359 | 34.45% | $71,551,726 | 36.97% |
| Very Late – Between 181-365 Days | 38 | 3.65% | $7,239,413 | 3.74% |
| Latest – More than 1-Year | 11 | 1.06% | $1,683,132 | 0.87% |
| Grand Total | 1,042 | 100.00% | $193,564,035 | 100.00% |
Table 18: FY23 Volume of Retroactive M/WBE Contracts, by Award Method
| Award Method | # of Contracts | % of contracts are registered late |
| NCSP | 1,042 | 69.87% |
| CSB | 150 | 45.33% |
| CSP | 81 | 71.60% |
| Innovative | 2 | 50% |
| Negotiated Acquisition | 41 | 95.12% |
Specialized Focus: Department of Education
In prior years, the Department of Education (“DOE”), which is not a mayoral agency, was not subject to LL 174 participation goals. However, in 2023 the DOE’s Panel for Education Policy approved changes to their Procurement Policy and Procedures (“PPP”) that require the DOE to implement a M/WBE goals program consistent with LL 174. FY23 is the first fiscal year in which these new procurement Rules were legally effective. As such, and given that DOE has the largest procurement portfolio in the City, this year’s Report includes a focused analysis on its M/WBE utilization and compliance with LL 174. This Office is not able to fully assess the DOE’s compliance with M/WBE goals, as DOE failed to record any subcontract records in PIP at the time data for this Report was pulled.[42]
Table 19: Volume of DOE Contracts and POs Subject to LL 174 Participation Goals, FY21-23 (DOE ONLY)
| FY21 | FY22 | FY23 | ||||
|---|---|---|---|---|---|---|
| Certification Type | # of Contracts | % Share of Contracts | # of Contracts | % Share of Contracts | # of Contracts | % Share of Contracts |
| M/WBE | 3,780 | 7.30% | 5,690 | 7.03% | 8,382 | 8.92% |
| Non-Certified | 47,967 | 92.70% | 75,296 | 92.97% | 85,560 | 91.08% |
| Grand Total | 51,747 | 100.00% | 80,986 | 100.00% | 93,942 | 100.00% |
52.36% of the DOE LL 174-eligible value in FY23 (for both M/WBEs and Non-Certified vendors) was from master agreements (MA1s). The largest of these contracts, accounting for nearly half of the value going to M/WBEs in FY23, was a $58.84 million agreement to Pro Con Group Inc. for the installation, repair, and replacement of steel doors for buildings under the DOE’s jurisdiction.[43] As of January 2023, nearly a full year into its five-year term, only $374,000 of this contract’s value has been expended.
Table 20: Value of DOE Contracts and POs Subject to LL 174 Participation Goals, FY21-23 (DOE ONLY)
| FY21 | FY22 | FY23 | ||||
|---|---|---|---|---|---|---|
| Certification Type | Total Registered Value | % Share of Value | Total Registered Value | % Share of Value | Total Registered Value | % Share of Value |
| M/WBE | $30,746,783 | 15.97% | $80,183,075 | 14.62% | $121,963,905 | 21.36% |
| Non-Certified | $161,762,580 | 84.03% | $468,348,025 | 85.38% | $448,913,015 | 78.64% |
| Grand Total | $192,509,362 | 100.00% | $548,531,100 | 100.00% | $570,876,920 | 100.00% |
Findings
In addition to the year-over-year analyses that develop an understanding of the Current State of M/WBE utilization, this Report has also undertaken additional targeted analyses to identify specific areas of focus.
Finding #1: Existing City tools don’t do enough to connect agencies and M/WBEs
There were over 147,000 prime contract and PO opportunities and over 2,000 subcontracting opportunities subject to M/WBE participation goals in FY23, yet only 2,242 M/WBEs ended up with a registered contract, PO, or subcontract. There are thousands of businesses that go through the time- and resource-intensive process to become M/WBE-certified that never see a dollar of City funded contracts for the goods or services they provide—even if the City purchases that same good or service. The City is not doing enough to connect M/WBEs to the right agencies, and vice versa.
1.1 There is not one centralized place to see planned procurement opportunities
The City’s contracting is managed across dozens of different Agencies, mayoral Offices, and handfuls of non-mayoral Elected Officials. As such, M/WBEs struggle to figure out when and which agencies purchase the types of goods and services that they can offer. Yet M/WBEs are encouraged and expected to create and manage relationships with procurement officials across this complicated web. Without setting a clearer, easier path, M/WBEs remain disconnected from the City agencies that need them to provide critical goods and services and support the growth of M/WBE utilization. The City should do more to help connect M/WBEs to the agencies who are looking for them.
Although in some circumstances City agencies are already required to publish lists of their planned contracting opportunities for each fiscal year, navigating across the lists is tedious, and it would take anyone hours to comb through hundreds of discrete spreadsheets across many dozen websites:
- M/WBE Procurement Plans: Pursuant to Administrative Code §6-129(g), for each upcoming fiscal year the City publishes an annual plan for each agency that details the anticipated contracting opportunities that are subject to M/WBE participation goals. Although the plans include information that may help an M/WBE find a relevant procurement opportunity (e.g., description of services/goods, procurement method, and industry), MOCS publishes this information in a discrete file for each of the 32 represented Agencies. These Plans are not available in PASSPort, the procurement sourcing tool that all vendors are encouraged to use to connect with relevant procurement opportunities, adding layers to the cumbersome search. Furthermore, these plans are published only once annually, therefore are not reflective of any new opportunities that develop during the course of the year.
- Annual Contracting Plans: Local Law 63 (“LL 63”) amended §312(a) of the City Charter in 2011 and requires that the Mayor, through MOCS, publishes an Annual Contracting Plan and schedule for standard and professional services contracts valued above $200,000. These Annual Contracting Plans offer a baseline of anticipated procurement opportunities and can be a helpful resource for M/WBEs who offer these types of services. However, as with the M/WBE Plans, MOCS also publishes each agency’s Annual Contracting Plans as a discrete Excel file. Unlike the M/WBE Plans, amendments to Agency Plans are required to be posted, and appear as yet another separate file. To put this in perspective, to review the FY24 Citywide procurement standard and professional services opportunities, an M/WBE must manually review thousands of rows of data across 105 unique files.
- Human Services Plans: The City also publishes annual plans for human services agencies that set forth agencies’ anticipated human services procurement actions for the fiscal year. Although human services contracts are exempt from LL 174 M/WBE participation goals, these Plans are helpful to M/WBEs that may be capable of providing the service as a prime or to pursue contracting as a subcontractor to the prime vendor. Once again, MOCS publishes two discrete files for each human services agency, requiring vendors to review 20 individual spreadsheets just to understand the portfolio of these opportunities.
In all, these Plans (which do not even cover non-mayoral agencies or certain goods and construction procurements) run counter to their intended goal to help facilitate the transparency of City contracting opportunities. Navigating the City’s contracting processes is difficult enough and M/WBEs should not be expected to encounter challenges with first even understanding the procurement ecosystem.
1.2 Commodity codes are ineffective in linking M/WBEs and agencies
Agencies rely on the SBS Directory to find eligible M/WBEs to target their outreach. They primarily search for M/WBEs using a commodity code. A commodity code is a standardized number for a product or service that a vendor might offer to the City. Commodity codes are national, standardized indices used across many municipalities and are not unique to New York City. City procurement portals PASSPort and FMS also rely on commodity codes as the basis for alerting vendors about relevant open procurement opportunities.
Commodity codes are often too general and cast too wide of a net, leading to challenges for agencies to find M/WBEs that are truly capable of providing the goods or services that are being procured. Other times, commodity codes may be so narrow that they incidentally fail to include M/WBEs in the procurement competition pools for goods and services they are able to provide. Furthermore, the sheer volume of commodity codes is unruly. The New York City Commodity Code Listing offers thousands upon thousands of code options across 250 main categories, amassing 161 pages. While maybe helpful at some time, the Listing includes a column that indicates whether the Commodity Code was used on a New York City contract or purchase order “in the recent past”– but the document has not been updated in over a decade.
Furthermore, the Commodity Codes available for M/WBEs to select for their PASSPort accounts are different than the Codes available to them in their SBS Directory Vendor Profile.
M/WBEs are set up to fail if one of their essential links to learn about procurement opportunities is as cumbersome and convoluted as selecting the appropriate Commodity Codes.
Finding #2: Agencies are not taking advantage of the increased M/WBE NCSP method threshold
The M/WBE NCSP method has a threshold that is significantly higher than those for micro- and small purchases and should be one of the City’s most effective tools in driving prime contract awards to M/WBEs.[44] This Office has been closely monitoring the use of this method, as it makes up a significant share of new contract registrations for M/WBEs (36.36% in FY23). In FY23 city agencies registered 1,042 contracts via the M/WBE NCSP method, valued at over $193 million.[45] Despite being able to use this method up to $500,000 (or $1 million at some points of the year), the average value of a contract registered using this method was merely $185,762.[46]
Table 21: Contracts Registered via M/WBE NCSP Method, Citywide, FY21-23
| Fiscal Year | # of M/WBE NCSP Registrations | NCSP % Share of All M/WBE Registrations | Total Value of M/WBE NCSPs | AVG Contract Value of M/WBE NCSP |
| FY21 | 814 | 38.80% | $85,565,524 | $105,117 |
| FY22 | 928 | 33.29% | $124,946,120 | $134,640 |
| FY23 | 1,042 | 36.36% | $193,564,035 | $185,762 |
| Grand Total | 2,784 | 35.91% | $404,075,679 | $145,142 |
In FY23, city agencies used the M/WBE NCSP method more, and for a slightly higher individual contract total value, than in prior fiscal years. However, FY23 registration data illustrates that many agencies focused their use of this method at values far below the maximum threshold. In FY23, 74.38% of contracts registered using this method were below $250,000, at least half of the maximum value permitted by the Rule[47]. Only 25 contracts registered using this method in FY23 were valued over $500,000[48]. Nearly two thirds (60.75%) of the contracts registered using this method did not exceed $150,000, the initial cap set back in 2017 and which is only $50,000 more than the Small Purchase method, which already has latitude for discretion to award to M/WBEs.
Chart 8: Volume of Contracts Registered via M/WBE NCSP Method, Citywide, FY21-FY23
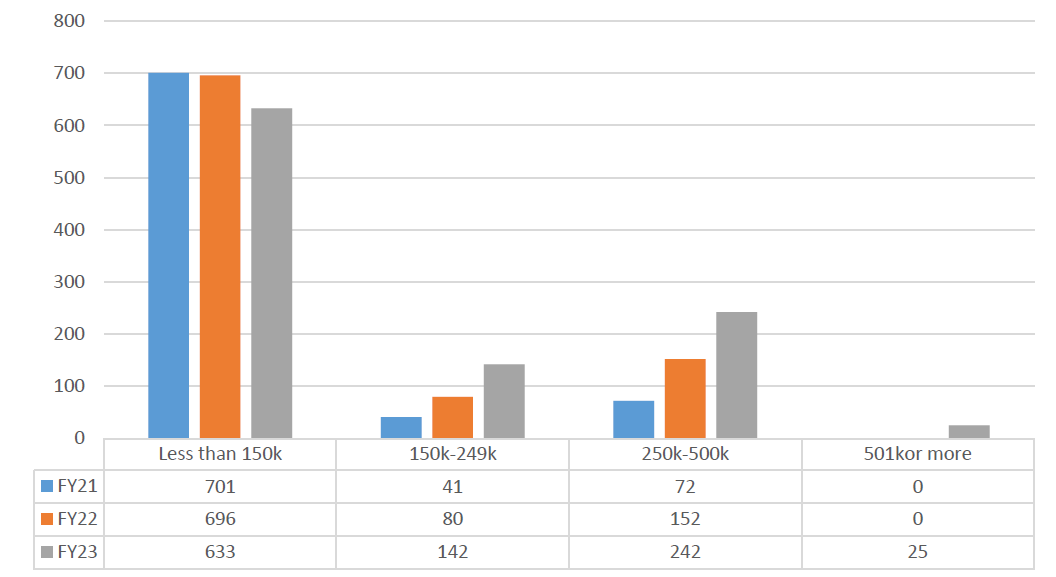
Table 22: FY23 Value of Contracts Registered via M/WBE NCSP Method, Citywide, by M/WBE Category[49]
| Contract Value | Asian American | Black | Hispanic American | White WBE | Native American | Total | Percent |
| Less Than $150K | 161 | 168 | 184 | 117 | 3 | 633 | 60.64% |
| $150K – $250K | 42 | 36 | 33 | 31 | 0 | 142 | 13.67% |
| $250K – $500K | 69 | 50 | 35 | 31 | 0 | 185 | 17.81% |
| $500K – $1M | 19 | 28 | 7 | 28 | 0 | 82 | 7.89% |
| Grand Total | 291 | 282 | 259 | 207 | 3 | 1,042 | 100% |
Compared to Citywide registration data, agencies’ use of the M/WBE NCSP method in FY23 was more evenly distributed across M/WBE categories. However, within Black and Hispanic American M/WBEs, male-owned firms represent much larger shares of the counts of registered contracts then woman-owned firms. The City only registered 3 contracts total to male-owned Native American MBEs in FY23. All three of these contracts were registered through the M/WBE NCSP method.
A disaggregated analysis of the average value of contracts registered using this method reveals similar disparities as average value analyses of all award methods – the average value of contracts registered to Asian American male-owned MBEs and White woman-owned WBEs are higher than those of other underrepresented M/WBE categories.
Table 23: FY23 Contracts Registered via the M/WBE NCSP Method, Citywide, by M/WBE Category
| M/WBE Category | # of NCSP Contracts | NCSP Share of Total M/WBE Category Registrations | Percent of All M/WBE NCSP Registrations | AVG M/WBE NCSP Value |
| Asian American male-owned MBEs | 135 | 28.07% | 12.96% | $229,888 |
| Asian American women-owned MBEs | 156 | 54.17% | 14.97% | $184,976 |
| Black male-owned MBEs | 208 | 46.53% | 19.96% | $186,890 |
| Black women-owned MBEs | 74 | 24.67% | 7.10% | $189,982 |
| Hispanic American male-owned MBEs | 208 | 47.71% | 19.96% | $138,722 |
| Hispanic American women-owned MBEs | 51 | 40.48% | 4.89% | $158,901 |
| Native American male-owned MBEs | 3 | 100.00% | 0.29% | $47,572 |
| White WBEs | 207 | 26.37% | 19.86% | $210,822 |
| Grand Total | 1,042 | N/A | 100% | 168,469 |
This Office will continue to closely monitor the citywide use of this method to ensure that it is being utilized to the maximum extent possible to direct high dollar-value contracts and take affirmative steps to eliminate bias and the underutilization of certain M/WBE groups. As one of the conditions for delegating agencies the ability to self-register contracts awarded pursuant to this method, this Office mandated additional oversight and reporting requirements aimed at ensuring that agencies are using the threshold to its fullest potential. As of this calendar year, the City must publish quarterly reports that set forth its review of 10% of new or modified contract awards that were made pursuant to other methods even though they were otherwise eligible to be made via the discretionary method or at its fullest capacity. The analysis will highlight whether agencies are strategically reviewing procurement portfolios and identifying all potential opportunities for use of the method. In instances where agencies have failed to maximize the use of the NCSP, MOCS and OM/WBE must identify the reasons for its lack of utilization and either address systemic roadblocks and/or develop enhanced training. Similarly, this Office will use the information to determine whether the delegation of registration authority remains appropriate.
Along with City and private sector partners on the Capital Process Reform Taskforce, this Office advocated for State legislation to further increase the NCSP threshold. As of December 2023, and due to proactive measures taken by the PPB of which this Office is a voting member, the City now has the ability to use the method for eligible procurements that do not exceed $1.5 million. Therefore, these recommends are especially important moving forward to position agencies to most effectively utilize the increased threshold.
Finding #3: Master Agreements awarded to M/WBEs are not used anywhere near capacity
Multiple Master Agreements (MMA1s) are a class of contracts used by agencies to establish a pool of prime vendors that can be kept “on call” to provide services on an as-needed basis. The actual utilization of the contract is processed through a task order, which is separately registered with this Office. The City’s use of this framework is warranted when the City anticipates regularly needing a particular contracted service, but the level to which it may be needed is unclear. MMA1s are commonly used for as-needed legal services or managerial or IT consulting services. This framework is more efficient than the processing of individual, months-long procurements. MMA1s are generally awarded to multiple vendors, and task orders may be issued through either a “mini-bid/proposal” competition or on a rotational basis.
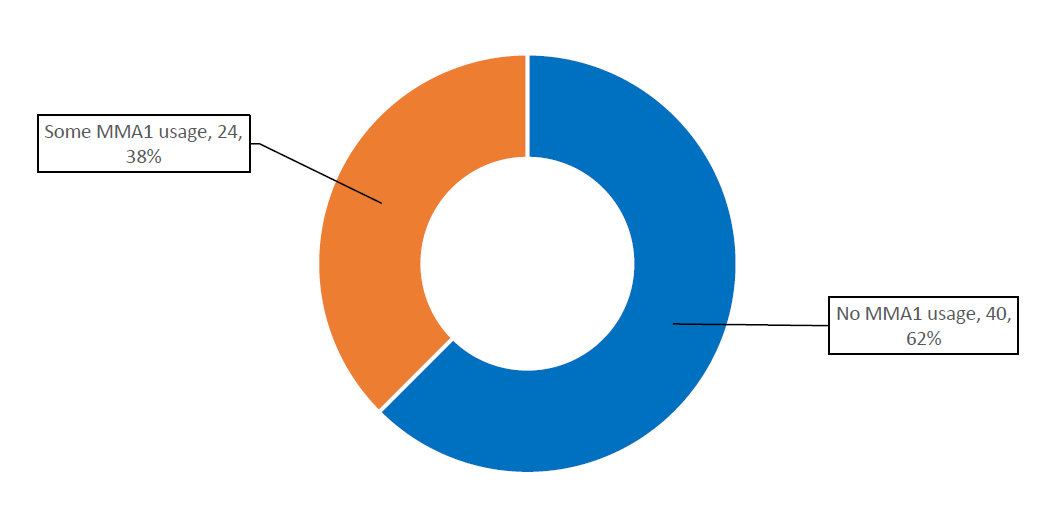
Given the unknown need, MMA1s typically establish a high maximum value capacity. As such, it is common for MMA1s to be underused relative to their maximum value capacity, or not used at all. The LL 174-mandated M/WBE utilization reports that are released by MOCS and SBS rely solely on contract award data to determine utilization and MMA1s awarded to M/WBEs are counted as awards valued at the maximum value capacity. However, more detailed analysis reveals the actual truth –despite both large volumes and values of MMA1 contracts registered to M/WBEs, these contracts are less likely to be used than those registered to their non-certified counterparts and in many instances result in no utilization at all.
It is important to take a closer look to understand how these underused MMA1 contracts may be incidentally misrepresenting actual M/WBE utilization. These analyses examine LL 174-eligible MMA1 contracts that were registered between FY16-FY23 (and have since expired) to best confirm final rates of use.[50] “Usage rate” is calculated by comparing the final value of a given MMA1 contract against the sum of funds issued against all corresponding task orders.[51]
M/WBE MMA1s were less likely to be utilized
Of the 625 MMA1 contracts in the specified dataset, less than 30% were registered to M/WBEs. The share of MMA1s that were not used (i.e. no task orders were issued, or no funds were issued against associated task orders) was 8% higher for contracts awarded to M/WBEs than their non-certified counterparts. The average value of these unused MMA1s was $6.32 million, resulting in over $485 million that was inaccurately reported toward M/WBE utilization totals.
Table 24: Usage of MMA1s, FY16-FY23
| Usage | # of MMA1s | % Share of MMA1s | Avg MMA1 Value | Total Original Contract Value |
| M/WBE | 178 | 28.48% | $8,016,322 | $1,306,139,752 |
| No Usage | 77 | 43.26% | $6,324,352 | $485,024,980 |
| Up to 33% Use | 56 | 31.46% | $8,468,027 | $448,196,994 |
| Between 33-66% Use | 15 | 8.43% | $7,068,701 | $93,024,638 |
| Between 66-99% Use | 30 | 16.85% | $11,989,675 | $279,893,140 |
| Non-Certified | 447 | 71.52% | $16,911,107 | $5,640,516,736 |
| No Usage | 158 | 35.35% | $6,356,666 | $1,064,953,252 |
| Up to 33% Use | 152 | 34.00% | $17,966,072 | $2,664,936,355 |
| Between 33-66% Use | 56 | 12.53% | $40,390,730 | $766,145,311 |
| Between 66-99% Use | 72 | 16.11% | $21,275,565 | $1,108,583,026 |
| 100% Use or More | 9 | 2.01% | $3,371,924 | $35,898,792 |
Table 25 examines LL 174-eligible MMA1 usage rates for contracts held by M/WBEs and Non-Certified vendors by agency. Agency-specific analyses show that OTI, DSS, and DCAS each utilized M/WBE MMA1s at higher rates than their Non-Certified counterparts.
Table 25: MMA1 Usage Rates by Agency
| M/WBE | Non-Certified | |||
|---|---|---|---|---|
| Agency | Total # of MMA1s | Average Usage Rate of MMA1 Contract | Total # of MMA1s | Average Usage Rate of MMA1 Contract |
| COMP | 0 | N/A | 6 | 4.02% |
| DCAS | 3 | 48.37% | 12 | 27.91% |
| DCP | 1 | 23.87% | 6 | 44.65% |
| DDC | 124 | 17.73% | 161 | 19.23% |
| DHS | 1 | 0.00% | 0 | N/A |
| DOC | 1 | 0.00% | 4 | 23.14% |
| DOT | 1 | 1.57% | 10 | 30.14% |
| DPR | 17 | 14.85% | 70 | 32.27% |
| DSS | 7 | 42.59% | 60 | 23.38% |
| FDNY | 1 | 0.00% | 0 | N/A |
| DOF | 0 | N/A | 2 | 2.07% |
| HHC | 0 | N/A | 1 | 0.00% |
| HPD | 0 | N/A | 2 | 100.00% |
| LAW | 0 | N/A | 2 | 57.03% |
| MAYOR | 2 | 0.00% | 35 | 10.43% |
| NYCEM | 2 | 4.00% | 8 | 32.23% |
| OTI | 18 | 50.12% | 68 | 33.33% |
M/WBE MMA1 Contract Value is Consolidated Among Fewer Vendors
Analyses found that half of M/WBEs awarded MMA1s saw little to no value from them. Of the 130 unique M/WBEs that were awarded LL 174-eligible MMA1s, 64 had only one such contract in the seven-year lookback period. Moreover, 40 of these contracts were totally unused, meaning that the awarded vendors never saw a dollar of their MMA1 contract value. Chart 9 provides a breakdown of contract usage among M/WBEs that were awarded a single MMA1.
Chart 9: Usage of Contracts Awarded to M/WBEs with One MMA1
While it is known that the maximum contract capacity for MMA1s may never be met, the City must be more transparent in its use of this MMA1 structure. M/WBEs are required to dedicate a lot of time and valuable resources to respond to procurement opportunities (and if successful, to manage the award and contract execution processes). Similarly, resource-strapped agencies expend significant time on reviewing proposals and processing contracts through the City’s complicated procurement processes. In the interest of targeting resources to results that add value, agencies should be more mindful of establishing MMA1 contracts with measure. To do otherwise not only wastes resources, but also gives M/WBEs the false hope of ever receiving true dollars from the City.
Unused MMA1 contracts also give the City the unfair benefit of claiming utilization that is not in fact real. Unused MMA1s impact the City’s data by overinflating utilization figures, focusing attention away from areas of City contracting that continue to be unsuccessful in getting real dollars to M/WBEs. More effective and efficient use of these contracts is necessary to ensure that the City’s projections and planning for M/WBE utilization more accurately reflect the reality of the contracts’ impact.
Finding #4: Goal-setting oversight is insufficient for contract changes and modifications
Last year’s Report discussed the gaps in the City’s ability to effectively monitor participation goals set on prime contracts. As a result, the City is not only unable to assess compliance with the requirements set forth in LL 174, but it also is unable to measure the utilization of M/WBEs at the subcontract level where most participation goals are set to be achieved. The City has failed to address several findings included in that Report—the goal-setting process remains onerous, the subcontractor tracking system has not been digitized for transparency, and reporting processes remain paper-based–all of which remain a barrier for meaningful M/WBE utilization.
This lack of oversight is exacerbated for certain contract changes and modifications subject to LL 174 participation goals. While not as visible as prime contracts, these contract management actions are additional avenues by which the City spend money. As such, the City must ensure it is fully examining and taking advantage of ways to maximize getting dollars to M/WBEs in these areas.
Contract changes (such as amendments and construction change orders) occur after the initial solicitation and procurement of a prime contract and are triggered by a need for new, additional scope. This additional scope typically results in adding more value to the prime contract. However, by the time changes are issued, the original contract M/WBE participation goal is no longer sufficient, as the market and contract value may have changed. Yet goal-setting at the time of contract modification is not enforced or a standard part of the change process. This is a missed opportunity to assess whether the original goal remains suitable. Revised goals could also refocus attention to address disparities among M/WBE Categories.
In some circumstances, the practice of adjusting goals at the time of contract modification is not at an agency’s discretion. LL 174 requires agencies to review “the scope of work for the contract, and the scale and types of work involved” for any change order which exceeds the greater of ten percent of the contract or $500,00 to determine whether a participation goal should be modified[52]. However, there are no checks and balances currently in place to ensure that agencies comply with this requirement. This impacts many contracts – in FY22 alone, the City registered 1,748 value-associated modifications.
There are similar compliance concerns for task or work orders associated with eligible master agreements, some of which are discussed in Finding #3 of this Report. Because the scope of the work is unknown at the time of the procurement of the prime contract (and work is not, in fact, guaranteed), LL 174 requires that M/WBE participation goals be set on any issued task orders. Task order goals compliance is difficult to evaluate and enforce because task orders are not generally subject to most City oversight reviews. City systems provide limited insight into participation goals on individual task orders, so there is inconsistency in how goals are set by different agencies against the same (or similar) master agreements. This issue becomes compounded with master agreements used by multiple agencies that do not have one central agency responsible for management.
Recommendations
Recommendation #1: Streamline connections between M/WBEs and Agencies
1.1 Create one repository of current and planned procurement opportunities
PASSPort is touted as the transparency portal that allows visibility into contracting opportunities. To deliver on its branding, PASSPort must be the one-stop shop that M/WBEs use to access not only information on current and planned procurement opportunities, but everything they need to know to do business with the City. Each of the City’s required procurement Plans should be into PASSPort to streamline the current burdensome process outlined in Finding 1 of this Report. The City must eliminate the onerous hurdles in the pathway to opportunities by developing search functionality in PASSPort that allows M/WBEs to easily target agencies and their procurements so as not to miss out on the chance to contract with the City.
1.2 Standardize commodity code selection and searches across agencies procuring similar goods and services
As discussed earlier in this Report, the City’s primary procurement and M/WBE systems rely on commodity codes to both categorize vendors by what they offer and help agencies target procurement opportunities to relevant vendors. However, what these systems do not offer is clear or consistent guidance to M/WBEs or agencies, as evidenced by the fact that the New York City Commodity Code Listing is misaligned with the options available in PASSPort and the SBS Directory, which in and of themselves are not in sync. Selecting the appropriate codes is one of the first and most critical steps an M/WBE takes after certification. Therefore, an updated New York City Commodity Code Listing will save M/WBEs time and confusion and create a more effective pathway between Agencies and M/WBEs.
1.3 Develop curated resources that demystify and uncomplicate finding procurement opportunities and eligible M/WBEs
This Office’s Annual Summary Contracts Report[53] reveals that individual agencies procure a wide range of goods and services, some of which may be quite specific to their operational needs. However, in many instances, procurement needs are common across agencies. In certain circumstances, unless appropriately delegated, the Charter mandates the centralized procurement of citywide needs within DCAS. In other cases, agencies are authorized to process their own procurements but for goods or services that are also needed by others. The City should canvas these categories to both support M/WBEs in more effectively selecting Commodity Codes that are commonly used across agencies to procure similar goods and services, as well as to provide agencies a base pool of M/WBEs to target solicitation requests.
Given that the selection of commodity codes is such an integral start on the path toward identifying relevant procurement opportunities, the City should publicize a standard set of commodity codes that agencies use, citywide, when procuring for the same or similar services. Agencies do not have to be limited to only those codes if a particular procurement is more nuanced, but this publication would at the very least offer M/WBEs some sense for whether they are selecting commodity codes that are actually used by purchasing staff. The City can gather the information through survey or the convening of purchasing staff, then compile, organize, and share with M/WBEs in an easy to find public location.
The City should also take steps to proactively support agency staff with procurement needs. When citywide contracts may not be appropriate, and particularly for procurements that are at or below discretionary thresholds (such as the M/WBE NCSP method), curated lists can be a timely and effective procurement tool. By developing non-exhaustive lists that are regularly updated of M/WBEs able to provide common and recurring goods and services, the City would not only speed up the time it takes purchasing staff to develop vendor outreach but also ensure that agencies are exposed to unique vendors with which they may not have yet done business. Taking the extra effort to front-load this information for agency and prime vendor searches will allow M/WBEs to highlight their specialized offerings and will streamline to processes needed to match purchasers to the right vendors.
Recommendation #2: Assess effectiveness of certification by surveying underutilized firms
The SBS Directory contains 10,992 certified M/WBEs. An earlier section of this Report reveals that in FY23 only 20% of these vendors received a new contract, subcontract, or purchase order. The City pays a lot of attention to certifying new vendors as M/WBEs and increasing utilization rates. The City should direct more focused attention to better understand why the vast majority of certified vendors do no business with the City. Understanding the reasons so many certified M/WBEs don’t have contracts could reveal additional unknown roadblocks that prevent M/WBEs from contracting with agencies. It may also reveal that the City is oversaturating its Directory with M/WBEs that provides goods and services that the City does not typically purchase. For both M/WBEs and SBS, especially in resource-strapped times, this may offer a way to intentional redirect resources to more effectively support the program.
On the other hand, there are some sectors and industries that the City does substantial contracting, but for which there is not a proportionate share of unique M/WBEs. The analysis would confirm whether enough M/WBEs are certified to meet the City’s needs. By relieving SBS of certification workload that neither benefits M/WBEs nor the City, resources could be made available to instead bolster certification initiatives for those goods and services for which there is a need. Targeted outreach to support intentional certification would support both the City’s goal to contract with more unique M/WBEs and to address disparities within underutilized categories. These efforts could also encourage M/WBE entrepreneurs to pursue a real market with an unmet need.
Recommendation #3: Strengthen goal-setting procedures, support, and oversight for contract changes and modifications
The City must exhaust every avenue to ensure that the City effectively meets its ambitious goals for M/WBE utilization. Finding #3 of this Report details the shortcomings of the City’s oversight and management of M/WBE goals on contract modifications.
As part of ongoing work on the Capital Process Reform Taskforce, the Comptroller’s Office insisted on an update to existing construction change order forms that will require agencies to affirmatively certify compliance with these mandated goal assessments. The City should consider additional measures to certify compliance in other sectors and industries, including to establish standardized guidance and forms to ensure that agencies are complying with LL 174 requirements for all contract changes and master agreement task orders. Given the City’s reliance on master agreements, and the Findings outlined earlier that show underutilization of M/WBE prime master agreements, the City must also set aggressive goals on task orders to maximize actual M/WBE utilization, especially when achieved through subcontracting.
Recommendation #4: Increase Utilization of M/WBEs in Human Services Contracting
Human services contracts, most often awarded to non-profit organizations, account for nearly half of the volume and value of registered contracts in FY23, amounting to $15.8 billion. LL 174 prescribes two important legal parameters tied to this large subset of City contracting: (1) non-profit organizations are precluded from City M/WBE certification, therefore (2) contracts awarded to non-profit organizations as well as contracts for human services (regardless of the awarded vendor’s legal structure) are exempt from participation goals.[54] As a result, each year M/WBEs are denied access to half of the City’s multi-billion dollar contracting portfolio.
Absent legislative change to modify these exclusions, the City must take all efforts to maximize the use of M/WBEs in this sector, as human services are not exclusively provided by non-profit organizations. [55] M/WBEs are an essential partner in helping the City deliver key areas of human services, including for childcare and early childhood education. City procurement tools target most human services prime contracting opportunities to prequalified vendors. As such, the City should ensure that the prequalification process is not implementing barriers that could inadvertently limit an M/WBE’s ability to qualify
That said, M/WBE utilization in this sector will largely live in the subcontracting space. The City must first start with enforcing subcontractor tracking on human service contracts. Last year’s Report found that the City largely fails to monitor compliance with subcontractor approval and tracking requirements for all areas of contracting, but it is essentially non-existent for human services contracts. This report analyzed subcontract records against over 4,400 active human services contracts registered since Jan 1, 2010. 94% of these contracts did not have a single approved subcontract record in PIP.
Chart 10: Active Human Services Contracts with Approved Subcontract Records in PIP
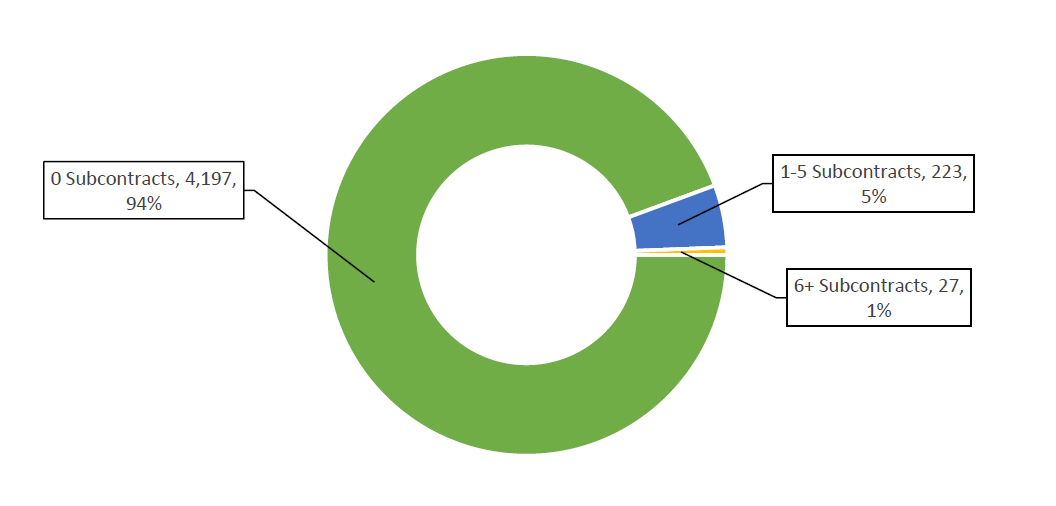
The lack of compliance exposes the City to many vulnerabilities, including the risk of working with unaccredited vendors or the legal liability of unmet contract terms and conditions. In addition, the City is unable to effectively evaluate the opportunities available to M/WBEs without an inventory of the scope and nature of subcontracting on its contracts.
Agencies already have access to information they need to identify areas to target for M/WBE subcontracting participation, and progress on this recommendation need not wait for the City to conduct a comprehensive assessment of human services subcontracting. For example, a human services prime contract for a homeless shelter often includes obligations that require the subcontracting of related services like the provision of food, security, translation services, laundry services and/or or hygiene and PPE supplies. M/WBEs already directly support the City in meeting these needs through other contracts and are available to do the same through human services contracts.
Many advocates in the human services industry already work closely with M/WBEs and small businesses and have done important work to strengthen connections across this industry. A group of non-profit organizations, the NY Equitable Economies Coalition (NYEEC), recently developed a Black, Indigenous, People of Color (BIPOC) Vendor Database.[56] This database aims to streamline connections across non-profit organizations and BIPOC vendors and includes a tool to filter directly for NYC M/WBE Certified vendors. The City should expand upon these efforts to support non-profit organizations (and other human services prime contractors) hoping to partner with M/WBEs as subcontractors.
Some non-profit organizations may be unfamiliar with the specifics of the City’s M/WBE participation goals program. To be effective in maximizing M/WBE utilization for these contracts, the City must arm the sector with the tools and resources it needs to successfully identify and target M/WBEs for contracting opportunities.
M/WBE Utilization by Agency
This Section includes individual analyses for mayoral City agencies and non-mayoral Elected Officials with LL 174-eligible contract registrations and spend. Though not subject to LL 174 participation goals, this Section also includes the same analyses for the Department of Education (DOE).
These analyses provide a detailed understanding into the contract registration data, spend data and other procurement trends of each individual agency. It is important to note that each agency procures different goods and services, has different operating budgets, and different priorities – so a one for one comparison may not always be appropriate. The Annual Summary Contracts Report includes more helpful information about contracting across agencies.
However, it can be helpful and informative to note patterns and trends across agencies, including the count and value of contracting opportunities across similar industries. Agencies are encouraged to review data pertaining to sister agencies that procure similar goods and services for best practices or to identify areas where they can share context or resources to improve their utilization. These analyses are intended to be reviewed in combination with the findings throughout the rest of the Report, including in the next Section by industry.
Ranked Measures:
This section presents a comprehensive evaluation of city agencies’ engagement with M/WBEs over the past several fiscal years. Last year’s Report compared the share of LL 174-eligible contract volume and value that was registered to M/WBEs across rated agencies, regardless of the size of their procurement portfolio. While informative, this approach had the effect of overrepresenting results in smaller agencies where just one or two contracts could have a massive impact on their overall ratio. To assess agency performance more fairly, this year’s analysis examines how much LL 174-eligible business (as a function of value and volume) each agency did with M/WBEs relative to their peers with similar-sized LL 174 portfolios.
First, LL 174-eligible procurement data from the prior four fiscal years was aggregated to classify agencies into value and volume cohorts. Subsequently, a statistical tool known as a Z-Score was applied to measure how much business each agency did with M/WBEs as compared to their cohort average.[57] Agencies with Z-Scores greater than zero did more business with M/WBEs than the average among agencies with similar sized contract portfolios. Agencies with Z-Scores below zero did less M/WBE business than the average among agencies with similar sized contract portfolios. Additional information and data regarding the process for calculating Z-scores can be found in Appendix D of this Report.
Cohorts
Value and volume cohorts were established by aggregating LL 174-eligible contract and PO data for each agency over a four-year period (FY20-23). The extended timeframe accommodates the fluctuations in each agency’s procurement cycle, accounting for both heavier and lighter years. The cohorts were established as follows:
Value Cohorts
- Large Value: total aggregated LL 174-eligible value over $100 million
- Medium Value: total aggregated LL 174-eligible value between $50 million and $100 million
- Small Value: total aggregated LL 174-eligible value between $10 million and $50 million
- Micro Value: total aggregated LL 174-eligible value under $10 million
Volume Cohorts
- Large Volume: Over 10,000 contracts and POs
- Moderate Volume: Between 1,000 and 10,000 contracts and POs
- Small Volume: Between 100 and 1,000 contracts and POs
- Very Small Volume: Less than 100 contracts and POs
Z-Score Rankings, by Value Cohort
Tables 26-29 rank agencies from highest to lowest Z-score within each of the four value cohorts. For additional context, these tables also include the volume cohort assigned to each agency when calculating their Z-score.
Table 26: FY23 – Large Value Cohort, Ranked
| Agency | Volume Cohort | FY23 Z-Score |
| Department of Environmental Protection (DEP) |
Between 1,000-10,000 contracts and POs | 1.01 |
| Office of Technology and Innovation (OTI) | Over 10,000 contracts and POs | 0.78 |
| Department of Design and Construction (DDC) |
Between 100-1,000 contracts and POs | 0.27 |
| Department of Parks and Recreation (DPR) |
Between 1,000-10,000 contracts and POs | -0.10 |
| Department of Education (DOE) | Between 1,000-10,000 contracts and POs | -0.67 |
| Department of Transportation (DOT) | Between 1,000-10,000 contracts and POs | -1.29 |
Table 27: FY23 – Moderate Value Cohort, Ranked
| Agency | Volume Cohort | FY23 Z-Score |
| Department of Homeless Services (DHS) | Less than 100 contracts and POs | 1.48 |
| Department of Health and Mental Hygiene (DOHMH) | Between 1,000-10,000 contracts and POs | 0.60 |
| Department of Sanitation (DSNY) | Between 1,000-10,000 contracts and POs | -0.27 |
| Department of Housing Preservation and Development (HPD) | Between 100-1,000 contracts and POs | -0.37 |
| NYC Office of Emergency Management (NYCEM) | Between 100-1,000 contracts and POs | -0.42 |
| New York Police Department (NYPD) | Over 10,000 contracts and POs | -0.44 |
| Department of Citywide Administrative Services (DCAS) | Between 100-1,000 contracts and POs | -0.58 |
Table 28: FY23 – Small Value Cohort, Ranked
| Agency | Volume Cohort | FY23 Z-Score |
| Law Department (LAW) | Between 100-1,000 contracts and POs | 1.40 |
| Mayoralty (MAYOR) | Between 100-1,000 contracts and POs | 1.03 |
| Administration for Children’s Services (ACS) | Between 100-1,000 contracts and POs | 0.25 |
| Department of Correction (DOC) | Between 1,000-10,000 contracts and POs | 0.20 |
| New York City Fire Department (FDNY) | Between 100-1,000 contracts and POs | -0.46 |
| Small Business Services (SBS) | Between 100-1,000 contracts and POs | -0.66 |
| Human Resources Administration (DSS/HRA) | Between 100-1,000 contracts and POs | -0.73 |
| Department of Finance (DOF) | Between 100-1,000 contracts and POs | -1.03 |
Table 29: FY23 – Micro Value Cohort, Ranked
| Agency | Volume Cohort | FY23 Z-Score |
| Comptroller (COMP) | Between 100-1,000 contracts and POs | 2.17 |
| Taxi & Limousine Commission (TLC) | Between 100-1,000 contracts and POs | 1.28 |
| Department of Buildings (DOB) | Between 100-1,000 contracts and POs | 1.18 |
| Business Integrity Commission (BIC) | Less than 100 contracts and POs | 0.57 |
| Department for the Aging (DFTA) | Between 100-1,000 contracts and POs | 0.39 |
| Office of Administrative Trials and Hearings (OATH) | Between 100-1,000 contracts and POs | 0.38 |
| Department of Records and Information Systems (DORIS) | Between 100-1,000 contracts and POs | 0.03 |
| Department of City Planning (DCP) | Between 100-1,000 contracts and POs | -0.06 |
| Department of Probation (DOP) | Between 100-1,000 contracts and POs | -0.14 |
| Department of Consumer and Worker Protection (DCWP) | Between 100-1,000 contracts and POs | -0.39 |
| Department of Youth and Community Development (DYCD) | Between 100-1,000 contracts and POs | -0.42 |
| Department of Cultural Affairs (DCLA) | Less than 100 contracts and POs | -0.85 |
| Landmarks Preservation Committee (LPC) | Less than 100 contracts and POs | -0.87 |
| City Commission on Human Rights (CCHR) | Between 100-1,000 contracts and POs | -1.04 |
| Department of Investigation (DOI) | Between 100-1,000 contracts and POs | -1.09 |
| Civilian Complaint Review Board (CCRB) | Less than 100 contracts and POs | -1.16 |
Rankings: Year Over Year Z-Score Changes, by Cohort
Tables 30-33 rank agencies based on the magnitude of change between their FY22 and FY23 Z-scores. Agencies with a positive year-over-year percent change did more business with M/WBEs, relative to their cohorts, in FY23 than they did in FY22. The opposite is true for agencies with a negative year-over-year percentage.
Table 30: Large Value Cohort – Year-over-Year Z-Score Changes
| Agency | Volume Cohort | FY22 Z-score |
FY23 Z-score |
Year over Year % Change |
| Office of Technology and Innovation (OTI) |
Over 10,000 contracts and POs | 0.16 | 0.78 | 62.35% |
| Department of Environmental Protection (DEP) | Between 1,000-10,000 contracts and POs | 0.42 | 1.01 | 58.88% |
| Department of Parks and Recreation (DPR) |
Between 1,000-10,000 contracts and POs | -0.35 | -0.10 | 25.14% |
| Department of Education (DOE) | Between 1,000-10,000 contracts and POs | -0.69 | -0.67 | 2.03% |
| Department of Transportation (DOT) | Between 1,000-10,000 contracts and POs | -0.68 | -1.29 | -61.33% |
| Department of Design and Construction (DDC) | Between 100-1,000 contracts and POs | 1.15 | 0.27 | -87.08% |
Table 31: Moderate Value Cohort Year-over-Year Z-Score Changes
| Agency | Volume Cohort | FY22 Z-score |
FY23 Z-score |
Year over Year % Change |
| Department of Homeless Services (DHS) | Less than 100 contracts and POs | 0.17 | 1.48 | 131.37% |
| NYC Office of Emergency Management (NYCEM) | Between 100-1,000 contracts and POs | -0.95 | -0.42 | 52.29% |
| Department of Sanitation (DSNY) | Between 1,000-10,000 contracts and POs | -0.78 | -0.27 | 50.23% |
| Department of Citywide Administrative Services (DCAS) | Between 100-1,000 contracts and POs | -0.83 | -0.58 | 25.64% |
| Department of Health and Mental Hygiene (DOHMH) | Between 1,000-10,000 contracts and POs | 0.95 | 0.60 | -34.64% |
| Department of Housing Preservation and Development (HPD) | Between 100-1,000 contracts and POs | 0.49 | -0.37 | -86.45% |
| New York Police Department (NYPD) | Over 10,000 contracts and POs | 0.95 | -0.44 | -138.44% |
Table 32: Small Value Cohort Year-over-Year Z-Score Changes
| Agency | Volume Cohort | FY22
Z-score |
FY23
Z-score |
Year over Year % Change |
| Law Department (LAW) | Between 100-1,000 contracts and POs | 0.48 | 1.40 | 91.79% |
| Mayoralty (MAYOR) | Between 100-1,000 contracts and POs | 0.43 | 1.03 | 59.83% |
| Small Business Services (SBS) | Between 100-1,000 contracts and POs | -1.03 | -0.66 | 37.37% |
| Department of Finance (DOF) | Between 100-1,000 contracts and POs | -1.35 | -1.03 | 32.28% |
| Department of Correction (DOC) | Between 1,000-10,000 contracts and POs | 0.41 | 0.20 | -21.35% |
| New York City Fire Department (FDNY) | Between 100-1,000 contracts and POs | -0.08 | -0.46 | -37.84% |
| Administration for Children’s Services (ACS) | Between 100-1,000 contracts and POs | 0.91 | 0.25 | -66.35% |
| Human Resources Administration (DSS/HRA) | Between 100-1,000 contracts and POs | 0.23 | -0.73 | -95.71% |
Table 33: Micro Value Cohort Year-over-Year Z-Score Changes
| Agency | Volume Cohort | FY22 Z-score |
FY23 Z-score |
Year over Year % Change |
| Business Integrity Commission (BIC) | Less than 100 contracts and POs | -0.18 | 0.57 | 74.96% |
| Taxi & Limousine Commission (TLC) | Between 100-1,000 contracts and POs | 0.69 | 1.28 | 59.33% |
| Department of Probation (DOP) | Between 100-1,000 contracts and POs | -0.68 | -0.14 | 53.56% |
| Comptroller (COMP) | Between 100-1,000 contracts and POs | 1.83 | 2.17 | 33.83% |
| Department of Records and Information Systems (DORIS) | Between 100-1,000 contracts and POs | -0.28 | 0.03 | 30.47% |
| Landmarks Preservation Committee (LPC) |
Less than 100 contracts and POs | -1.08 | -0.87 | 21.56% |
| City Commission on Human Rights (CCHR) |
Between 100-1,000 contracts and POs | -1.21 | -1.04 | 16.91% |
| Department for the Aging (DFTA) | Between 100-1,000 contracts and POs | 0.28 | 0.39 | 11.16% |
| Office of Administrative Trials and Hearings (OATH) | Between 100-1,000 contracts and POs | 0.37 | 0.38 | 1.70% |
| Civilian Complaint Review Board (CCRB) | Less than 100 contracts and POs | -1.06 | -1.16 | -9.64% |
| Department of Investigation (DOI) | Between 100-1,000 contracts and POs | -0.91 | -1.09 | -17.70% |
| Department of Consumer and Worker Protection (DCWP) | Between 100-1,000 contracts and POs | -0.21 | -0.39 | -17.95% |
| Department of Cultural Affairs (DCLA) |
Less than 100 contracts and POs | -0.62 | -0.85 | -22.96% |
| Department of Buildings (DOB) | Between 100-1,000 contracts and POs | 1.72 | 1.18 | -53.80% |
| Department of City Planning (DCP) | Between 100-1,000 contracts and POs | 0.73 | -0.06 | -78.93% |
| Department of Youth and Community Development (DYCD) | Between 100-1,000 contracts and POs | 0.61 | -0.42 | -102.50% |
Agency Rankings: Utilization of M/WBE NCSP Method by Volume
Tables 34 and 35 examine the agencies with the greatest and fewest numbers of registered M/WBE NCSP contracts in FY23. Table 36 captures which agencies registered the most M/WBE NCSPs in FY23, relative to their FY22 totals.
Table 34: FY23 Top Five Agencies by Volume of M/WBE NCSP Method Registrations
| Agency | Total Number of NCSP Contracts |
| Office of Technology and Innovation (OTI) | 140 |
| Department of Transportation (DOT) | 101 |
| Department of Sanitation (DSNY) | 62 |
| Department of Environmental Protection (DEP) | 56 |
| Department of Citywide Administrative Services (DCAS) | 50 |
Table 35: FY23 Bottom Five Agencies by Volume of M/WBE NCSP Method Registrations
| Agency | Total Number of NCSP Contracts |
| Department of City Planning (DCP) | 1 |
| Business Integrity Commission (BIC) | 1 |
| Department of Records and Information Systems (DORIS) | 1 |
| Landmarks Preservation Committee (LPC) | 2 |
| Department of Consumer and Worker Protection (DCWP) | 2 |
Table 36: Five Most Improved Agencies by Volume of M/WBE NCSP Method Registrations, FY22-23
| Agency | FY22 Number of NCSP contracts | FY23 Number of NCSP contracts | Year-Over-Year Change |
| Office of Technology and Innovation (OTI) | 99 | 140 | 41 |
| Department of Transportation (DOT) | 63 | 101 | 38 |
| Department of Housing Preservation and Development (HPD) | 12 | 27 | 15 |
| Department of Sanitation (DSNY) | 14 | 62 | 14 |
| Human Resources Administration (DSS/HRA) | 29 | 42 | 13 |
Agency Rankings: Utilization of M/WBE NCSP Method by Average Contract Value
As previously mentioned, the average value of a contract registered using the M/WBE NCSP method in FY23 was $185,762. The agencies in Table 37 utilized the M/WBE NCSP method to register contracts with the highest average contract value in FY23. Most of these agencies generally tend to procure high-dollar-value contracts.
Table 37: FY23 Highest Ranked Agencies – M/WBE NCSP Method Average Value
| Agency | M/WBE NCSP AVG Value |
| Department of Education (DOE) | $465,623 |
| Department of Homeless Services (DHS) | $369,366 |
| Department of Parks and Recreation (DPR) | $328,901 |
| Department of Sanitation (DSNY) | $270,317 |
| Law Department (LAW) | $253,358 |
Table 38 displays agencies with the lowest relative average value for contracts registered using the M/WBE NCSP method in FY23.
Table 38: FY23 Lowest Ranked Agencies – M/WBE NCSP Method Average Value
| Agency | M/WBE NCSP AVG Value |
| Department of City Planning (DCP) | $24,998 |
| Landmarks Preservation Committee (LPC) | $33,615 |
| Business Integrity Commission (BIC) | $38,129 |
| Department of Records and Information Systems (DORIS) | $63,390 |
| Department of Investigation (DOI) | $71,023 |
Table 39 ranks the agencies whose relative average value for contracts registered using the M/WBE NCSP method increased the most since FY22.
Table 39: FY22-23 Most Improved Agencies – M/WBE NCSP Method Average Value
| Agency | FY22 | FY23 | Difference |
| Department of Parks and Recreation (DPR) | $143,454 | $328,901 | $185,447 |
| Department of Homeless Services (DHS) | $206,250 | $369,366 | $163,115 |
| Department of Health and Mental Hygiene (DOHMH) | $112,892 | $244,566 | $131,674 |
| Department of Sanitation (DSNY) | $149,468 | $270,317 | $120,849 |
| Department of Housing Preservation and Development (HPD) | $96,841 | $215,525 | $118,684 |
All Agencies: Summarized Indicators
These analyses share insights into several key indicators across mayoral agencies, the DOE, and the Comptroller’s Office.
M/WBE Retroactivity
As discussed earlier in this Report, over 61% of new contracts with M/WBEs were registered retroactively. Of all rated agencies, only 6 agencies registered more than half of their contracts on time or early.
Table 40: FY23 M/WBE Contract Retroactivity by Agency
| Agency | Registered on Time or Early | Retroactive Registrations | ||
|---|---|---|---|---|
| # of Contracts | % Share of Contracts | # of Contracts | % Share of Contracts | |
| Citywide* – All Contracts | 4,303 | 34.06% | 8,333 | 65.94% |
| Citywide* – All M/WBE Contracts | 1,110 | 38.73% | 1,756 | 61.27% |
| ACS | 23 | 28.75% | 57 | 71.25% |
| BIC | 1 | 100.00% | 0 | 0.00% |
| CCHR | 0 | 0.00% | 3 | 100.00% |
| COMP | 7 | 25.93% | 20 | 74.07% |
| CCRB | 1 | 12.50% | 7 | 87.50% |
| DCAS | 41 | 28.28% | 94 | 71.72% |
| DCLA | 6 | 66.67% | 3 | 33.33% |
| DCP | 1 | 25.00% | 3 | 75.00% |
| DCWP | 0 | 0.00% | 2 | 100.00% |
| DDC | 28 | 57.14% | 21 | 42.86% |
| DEP | 33 | 39.29% | 51 | 60.71% |
| DFTA | 1 | 6.67% | 14 | 93.33% |
| DOB | 4 | 25.00% | 12 | 75.00% |
| DOC | 14 | 29.79% | 33 | 70.21% |
| DOE | 482 | 84.41% | 89 | 15.59% |
| DOF | 12 | 46.15% | 14 | 53.85% |
| DOHMH | 54 | 11.56% | 413 | 88.44% |
| DOI | 3 | 75.00% | 1 | 25.00% |
| DOP | 3 | 42.86% | 4 | 57.14% |
| DORIS | 0 | 0.00% | 2 | 100.00% |
| DOT | 53 | 42.40% | 72 | 57.60% |
| DPR | 106 | 63.47% | 61 | 36.53% |
| DSNY | 26 | 37.14% | 44 | 62.86% |
| DSS/DHS | 3 | 10.34% | 26 | 89.66% |
| DSS/HRA | 6 | 5.50% | 103 | 94.50% |
| DYCD | 1 | 5.26% | 18 | 94.74% |
| FDNY | 22 | 44.90% | 27 | 55.10% |
| HPD | 12 | 11.65% | 91 | 88.35% |
| LAW | 2 | 7.14% | 26 | 92.86% |
| LPC | 0 | 0.00% | 2 | 100.00% |
| MAYOR | 7 | 31.82% | 15 | 68.18% |
| NYCEM | 3 | 13.04% | 20 | 86.96% |
| NYPD | 37 | 29.13% | 90 | 70.87% |
| OATH | 1 | 7.14% | 13 | 92.86% |
| OTI | 29 | 18.13% | 131 | 81.88% |
| SBS | 1 | 5.00% | 19 | 95.00% |
| TLC | 0 | 0.00% | 7 | 100.00% |
M/WBE NCSP Method
With a threshold significantly higher than those for micro- and small purchases, the method should be one of the City’s most effective tools in driving prime contract awards to M/WBEs. Table 41 shows how each agency took advantage of this method over the past three fiscal years, examining both the frequency of use and the average value of contracts registered using this method.
Table 41: M/WBE NCSP Registrations by Agency, FY21-23
| Agency | FY21 | FY22 | FY23 | ||||
|---|---|---|---|---|---|---|---|
| # of Contracts | Avg Contract Value | # of Contracts | Avg Contract Value | # of Contracts | Avg Contract Value | ||
| Total Rated Agencies | 721 | $106,546 | 837 | $138,220 | 919 | $197,513 | |
| ACS | 10 | $116,300 | 44 | $186,187 | 46 | $192,227 | |
| BIC | 0 | $0 | 3 | $26,613 | 1 | $38,129 | |
| CCHR | 3 | $37,767 | 4 | $52,500 | 3 | $74,616 | |
| CCRB | 2 | $153,192 | 3 | $55,840 | 4 | $82,974 | |
| COMP | 23 | $109,398 | 14 | $87,807 | 18 | $77,327 | |
| DCAS | 46 | $104,184 | 53 | $79,095 | 50 | $150,819 | |
| DCLA | 2 | $42,695 | 6 | $138,982 | 9 | $192,158 | |
| DCP | 2 | $77,500 | 1 | $23,167 | 1 | $24,998 | |
| DCWP | 4 | $232,488 | 7 | $164,323 | 2 | $91,300 | |
| DDC | 22 | $165,385 | 27 | $197,322 | 17 | $198,979 | |
| DEP | 23 | $105,634 | 49 | $170,205 | 56 | $185,354 | |
| DFTA | 13 | $53,744 | 5 | $179,495 | 5 | $85,566 | |
| DOB | 14 | $71,544 | 13 | $95,440 | 14 | $108,922 | |
| DOC | 5 | $60,667 | 24 | $127,966 | 37 | $134,238 | |
| DOE | 1 | $200,200 | 10 | $417,833 | 13 | $465,623 | |
| DOF | 13 | $192,700 | 13 | $77,610 | 19 | $120,787 | |
| DOHMH | 93 | $74,137 | 72 | $112,892 | 45 | $244,566 | |
| DOI | 0 | $0 | 3 | $58,731 | 3 | $71,023 | |
| DOP | 7 | $106,107 | 2 | $51,968 | 2 | $98,305 | |
| DORIS | 3 | $35,833 | 4 | $48,964 | 1 | $63,390 | |
| DOT | 42 | $85,856 | 63 | $123,566 | 101 | $226,508 | |
| DPR | 43 | $147,543 | 49 | $143,454 | 32 | $328,901 | |
| DSNY | 80 | $90,296 | 48 | $149,468 | 62 | $270,317 | |
| DSS/DHS | 1 | $143,475 | 9 | $206,250 | 14 | $369,366 | |
| DSS/HRA | 11 | $104,912 | 29 | $123,597 | 42 | $112,679 | |
| DYCD | 8 | $83,432 | 20 | $88,617 | 17 | $83,153 | |
| FDNY | 60 | $95,145 | 56 | $104,097 | 43 | $144,204 | |
| HPD | 10 | $90,081 | 12 | $96,841 | 27 | $215,525 | |
| LAW | 9 | $219,964 | 4 | $185,300 | 12 | $253,358 | |
| LPC | 1 | $22,500 | 1 | $22,500 | 2 | $33,615 | |
| MAYOR | 36 | $103,809 | 23 | $96,196 | 20 | $144,095 | |
| NYCEM | 7 | $41,092 | 10 | $89,873 | 13 | $145,386 | |
| NYPD | 23 | $173,556 | 23 | $171,233 | 13 | $216,073 | |
| OATH | 3 | $72,849 | 7 | $70,837 | 13 | $116,637 | |
| OTI | 85 | $112,534 | 99 | $175,631 | 140 | $229,429 | |
| SBS | 13 | $186,876 | 23 | $199,352 | 15 | $118,890 | |
| TLC | 3 | $85,169 | 4 | $117,303 | 7 | $156,031 | |
This additional layer of analysis shows how each agency’s registrations via the M/WBE NCSP method were distributed across unique vendors. For example, OTI registered 140 contracts using the M/WBE NCSP method in FY23, but these contracts were only to 55 different M/WBEs.
Table 42: M/WBE NCSP Method Unique Vendors, FY21-23
| Agency | FY21 # of Unique Vendors |
FY22 # of Unique Vendors |
FY23 # of Unique Vendors |
| Total Citywide | 504 | 539 | 602 |
| ACS | 9 | 25 | 32 |
| BIC | 0 | 1 | 0 |
| CCHR | 3 | 4 | 1 |
| CCRB | 2 | 3 | 3 |
| COMP | 19 | 13 | 12 |
| DCAS | 36 | 38 | 43 |
| DCLA | 2 | 5 | 8 |
| DCP | 2 | 1 | 1 |
| DCWP | 4 | 4 | 2 |
| DDC | 17 | 19 | 12 |
| DEP | 17 | 33 | 43 |
| DFTA | 8 | 3 | 4 |
| DHS | 1 | 5 | 9 |
| DOB | 11 | 11 | 10 |
| DOC | 5 | 16 | 22 |
| DOE | 0 | 3 | 3 |
| DOF | 13 | 7 | 12 |
| DOHMH | 58 | 50 | 30 |
| DOI | 0 | 3 | 2 |
| DOP | 5 | 1 | 2 |
| DORIS | 3 | 3 | 1 |
| DOT | 28 | 40 | 68 |
| DPR | 32 | 23 | 21 |
| DSNY | 48 | 26 | 33 |
| DSS/HRA | 7 | 18 | 18 |
| DYCD | 4 | 10 | 6 |
| FDNY | 40 | 35 | 32 |
| HPD | 9 | 8 | 20 |
| LAW | 7 | 3 | 10 |
| LPC | 1 | 1 | 2 |
| MAYOR | 27 | 20 | 18 |
| NYCEM | 7 | 7 | 9 |
| NYPD | 17 | 17 | 11 |
| OATH | 2 | 5 | 7 |
| OTI | 30 | 38 | 55 |
| SBS | 12 | 18 | 13 |
| TLC | 3 | 3 | 4 |
Mayoral Agencies and the DOE
Administration for Children’s Services (ACS)
The LL 174 totals below represent just 2% of ACS’ total procurement portfolio, as ACS predominantly contracts with vendors for human services, which are exempt from LL 174 participation goals. ACS’ $77 million in LL 174-eligible value represents less than 1% of the City’s total LL 174-eligible contracting portfolio.
Table 43: FY23 LL 174-Eligible Contracts and POs
| Certification Status | # of Contracts | % Share of Contracts | Total Registered Contract Value | % Share of Contract Value |
| All Contracts and POs | 701 | 100.00% | $3,657,540,606 | 100.00% |
| M/WBE | 141 | 20.11% | $22,376,032 | 0.61% |
| Non-Certified | 560 | 79.89% | $3,635,164,573 | 99.39% |
| LL174 Contracts and POs | 309 | 100.00% | $77,054,132 | 100.00% |
| M/WBE | 125 | 40.45% | $21,281,784 | 27.62% |
| Non-Certified | 184 | 59.55% | $55,772,348 | 72.38% |
| LL174 Subcontracts | 14 | 100.00% | $9,208,500 | 100.00% |
| M/WBE | 8 | 57.14% | $3,340,000 | 36.27% |
| Non-Certified | 6 | 42.86% | $5,868,500 | 63.73% |
Chart 11: FY23 Value of LL 174-Eligible Prime Contracts and POs
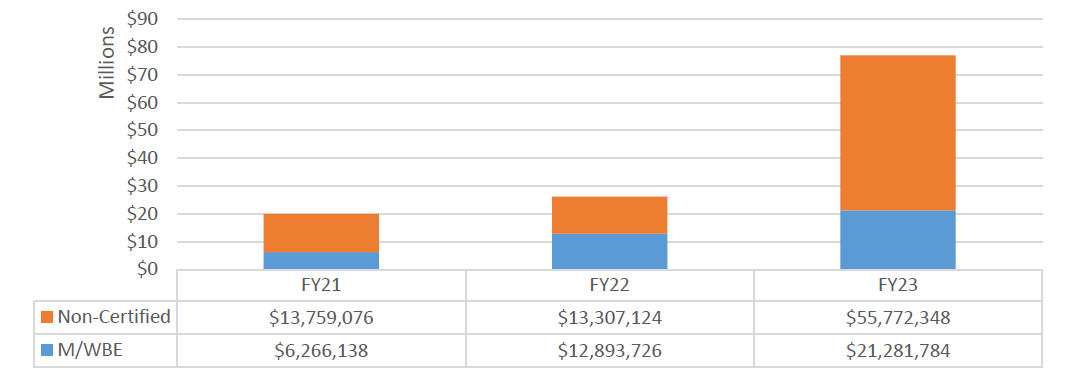
Chart 12: FY23 Value of LL 174-Eligible Contracts and POs, by Race and Gender
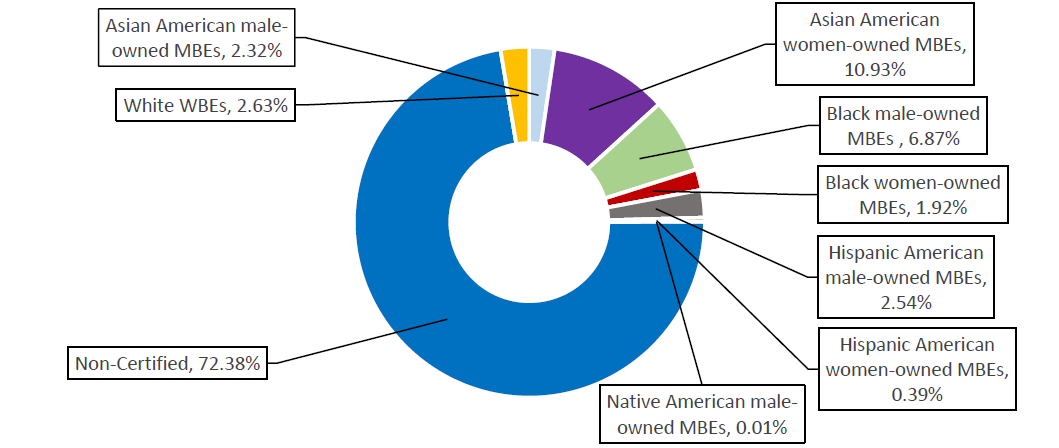
Chart 13: FY23 Share of LL 174-Eligible Contracts and PO Value, by M/WBE Category and Industry
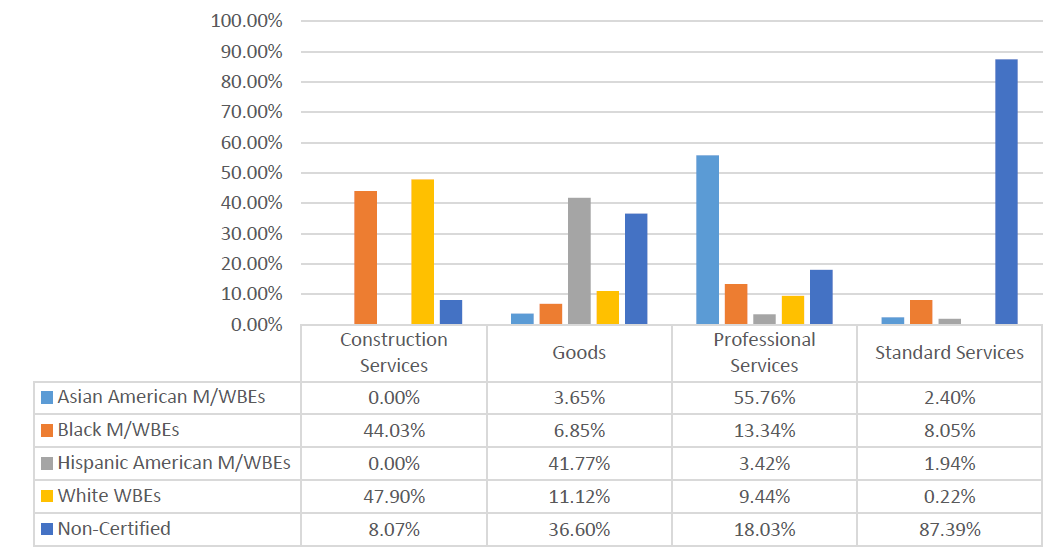
Business Integrity Commission (BIC)
Although much of BIC’s procurement portfolio was subject to LL 174 participation goals in FY23, over $133,000 in value was excluded due to government mandate and subscription contracts. BIC’s $168,415 in LL 174-eligible value represents less than .01% of the City’s LL 174-eligible contracting portfolio.
Table 44: FY23 LL 174-Eligible Contracts and POs
| Certification Status | # of Contracts | % Share of Contracts | Total Registered Contract Value | % Share of Contract Value |
| All Contracts and POs | 83 | 100.00% | $349,458 | 100.00% |
| M/WBE | 19 | 22.89% | $106,335 | 30.43% |
| Non-Certified | 64 | 77.11% | $243,123 | 69.57% |
| LL174 Contracts and POs | 69 | 100.00% | $168,415 | 100.00% |
| M/WBE | 17 | 24.64% | $51,784 | 30.75% |
| Non-Certified | 52 | 75.36% | $116,631 | 69.25% |
| LL174 Subcontracts | 0 | 0.00% | 0 | 0.00% |
| M/WBE | 0 | 0.00% | 0 | 0.00% |
| Non-Certified | 0 | 0.00% | 0 | 0.00% |
Chart 14: FY23 Value of LL 174-Eligible Prime Contracts and POs
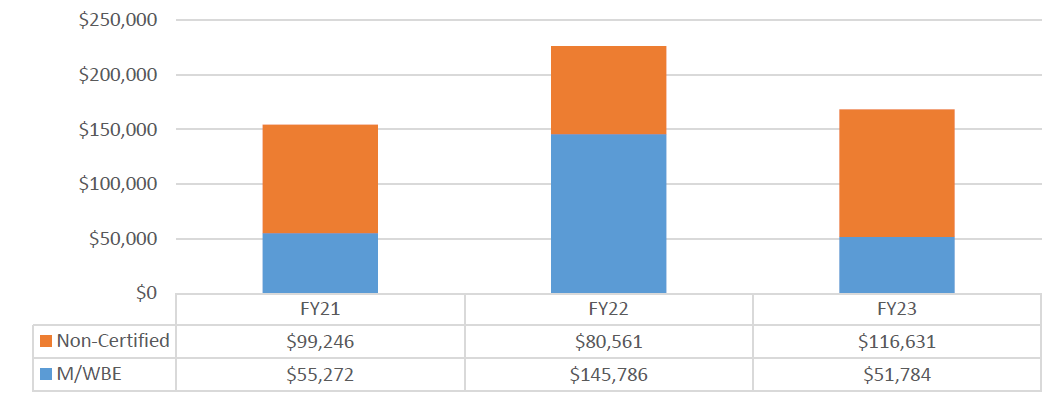
Chart 15: FY23 Value of LL 174-Eligible Contracts and POs, by Race and Gender
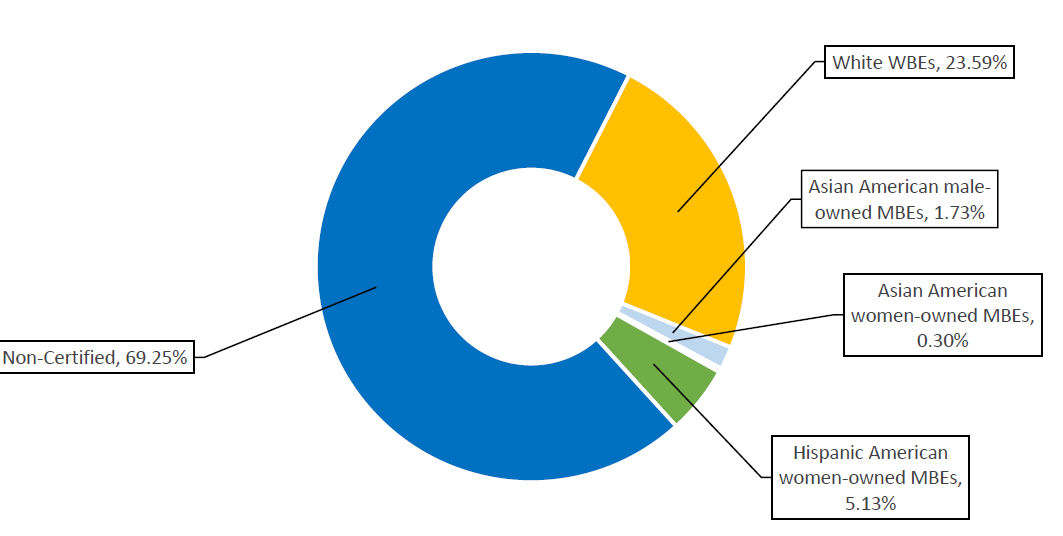
Chart 16: FY23 Share of LL 174-Eligible Contracts and PO Value, by M/WBE Category and Industry
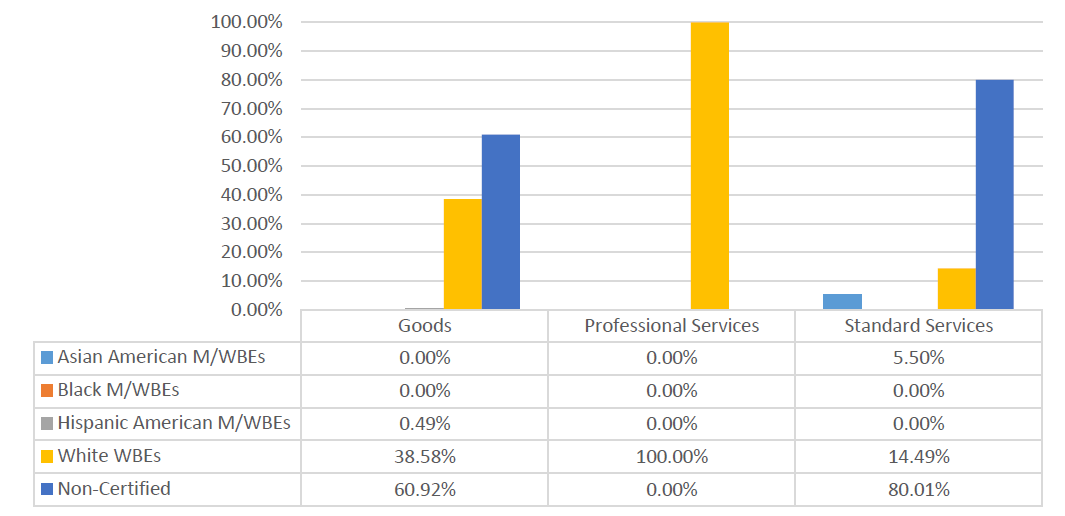
City Commission on Human Rights (CCHR)
The LL 174 totals below represent a small portion of CCHR’s procurement portfolio, as CCHR registered a $1.56 million Renewal contract, which is exempt from this analysis. CCHR’s $470,082 in LL 174-eligible value represents less than .01% of the City’s LL 174-eligible contracting portfolio.
Table 45: FY23 LL 174-Eligible Contracts and POs
| Certification Status | # of Contracts | % Share of Contracts | Total Registered Contract Value | % Share of Contract Value |
| All Contracts and POs | 70 | 100.00% | $2,219,794 | 100.00% |
| M/WBE | 34 | 48.57% | $452,207 | 20.37% |
| Non-Certified | 36 | 51.43% | $1,767,587 | 79.63% |
| LL174 Contracts and POs | 63 | 100.00% | $470,082 | 100.00% |
| M/WBE | 32 | 50.79% | $298,207 | 63.44% |
| Non-Certified | 31 | 49.21% | $171,875 | 36.56% |
| LL174 Subcontracts | 0 | 0.00% | $0 | 0.00% |
| M/WBE | 0 | 0.00% | $0 | 0.00% |
| Non-Certified | 0 | 0.00% | $0 | 0.00% |
Chart 17: FY23 Value of LL 174-Eligible Prime Contracts and POs
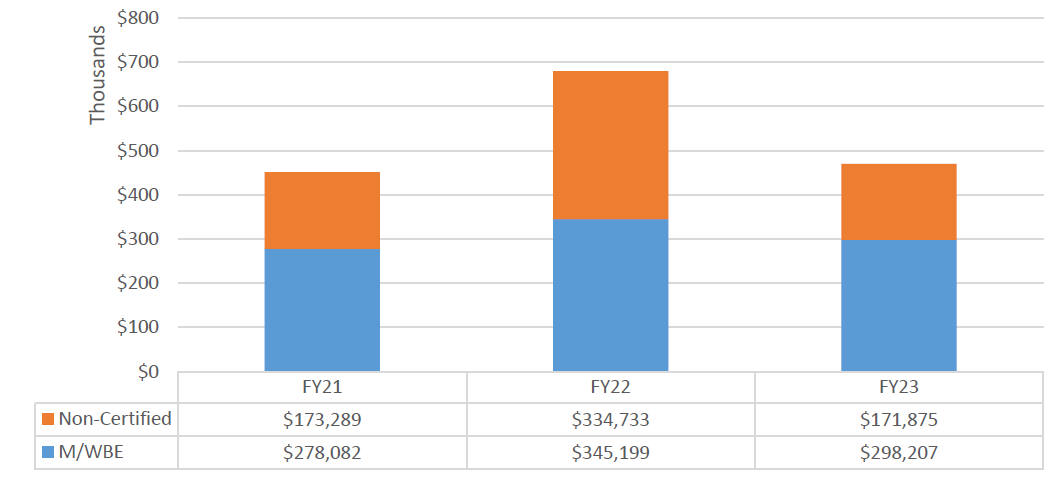
Chart 18: FY23 Value of LL 174-Eligible Contracts and POs, by Race and Gender
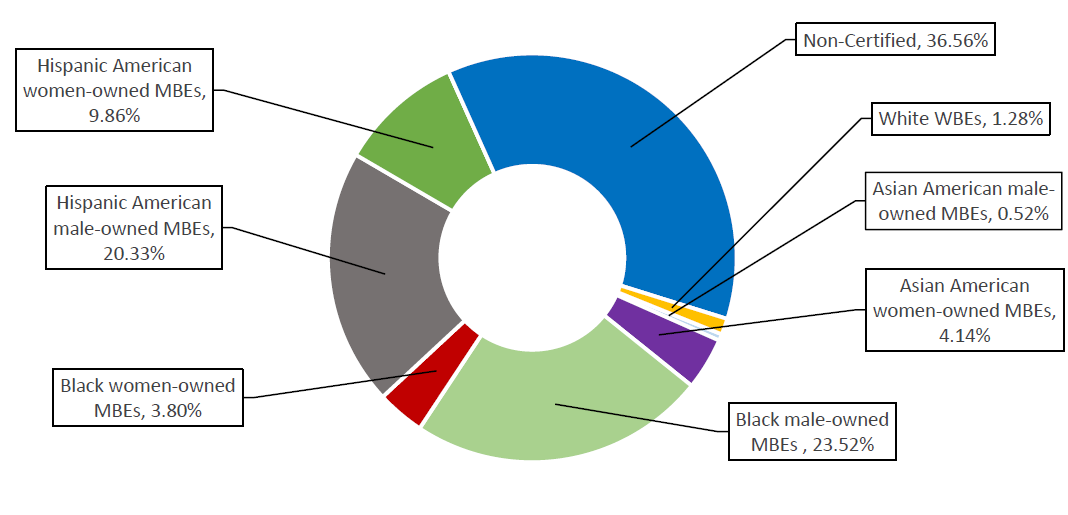
Chart 19: FY23 Share of LL 174-Eligible Contracts and PO Value, by M/WBE Category and Industry
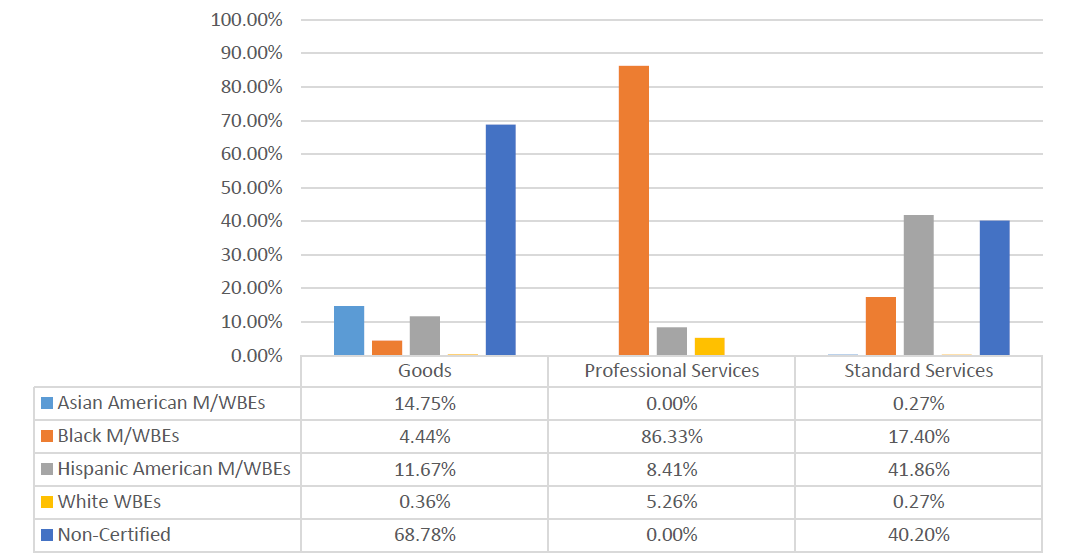
Civilian Complaint Review Board (CCRB)
All of CCRB’s procurement actions in FY23 were subject to LL 174 participation goals. These account for just .01% of the City’s LL 174-eligible contracting portfolio.
Table 46: FY23 LL 174-Eligible Contracts and POs
| Certification Status | # of Contracts | % Share of Contracts | Total Registered Contract Value | % Share of Contract Value |
| All Contracts and POs | 52 | 100.00% | $695,874 | 100.00% |
| M/WBE | 18 | 34.62% | $462,800 | 66.51% |
| Non-Certified | 34 | 65.38% | $233,074 | 33.49% |
| LL174 Contracts and POs | 52 | 100.00% | $695,874 | 100.00% |
| M/WBE | 18 | 34.62% | $462,800 | 66.51% |
| Non-Certified | 34 | 65.38% | $233,074 | 33.49% |
| LL174 Subcontracts | 0 | 0% | $0 | 0% |
| M/WBE | 0 | 0.00% | $0 | 0.00% |
| Non-Certified | 0 | 0% | $0 | 0% |
Chart 20: FY23 Value of LL 174-Eligible Prime Contracts and POs
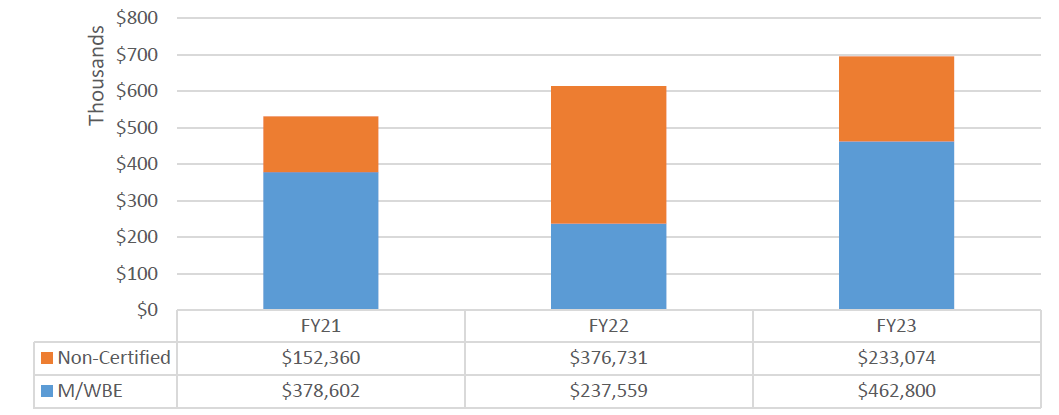
Chart 21: FY23 Value of LL 174-Eligible Contracts and POs, by Race and Gender
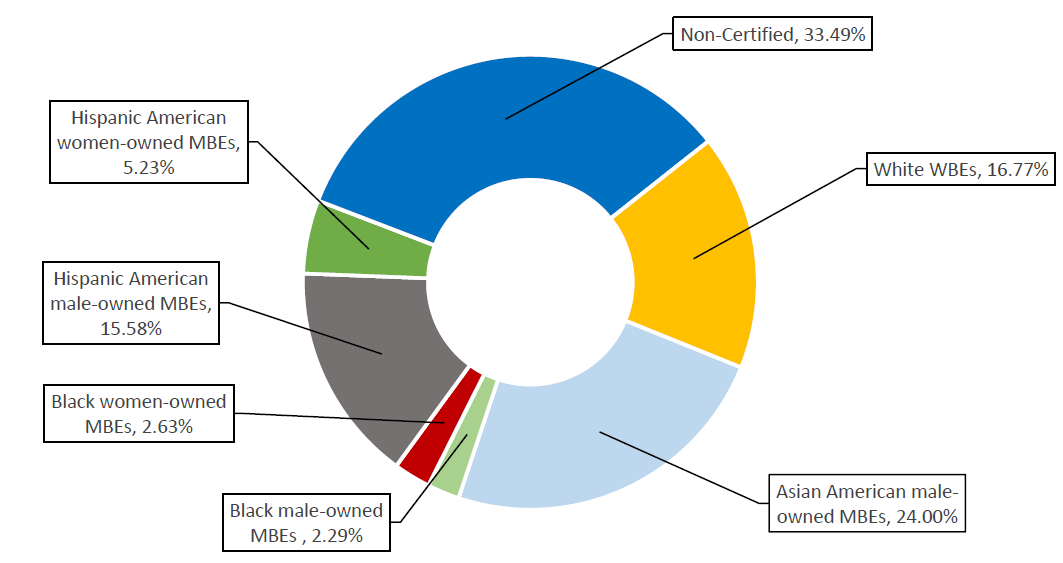
Chart 22: FY23 Share of LL 174-Eligible Contracts and PO Value, by M/WBE Category and Industry
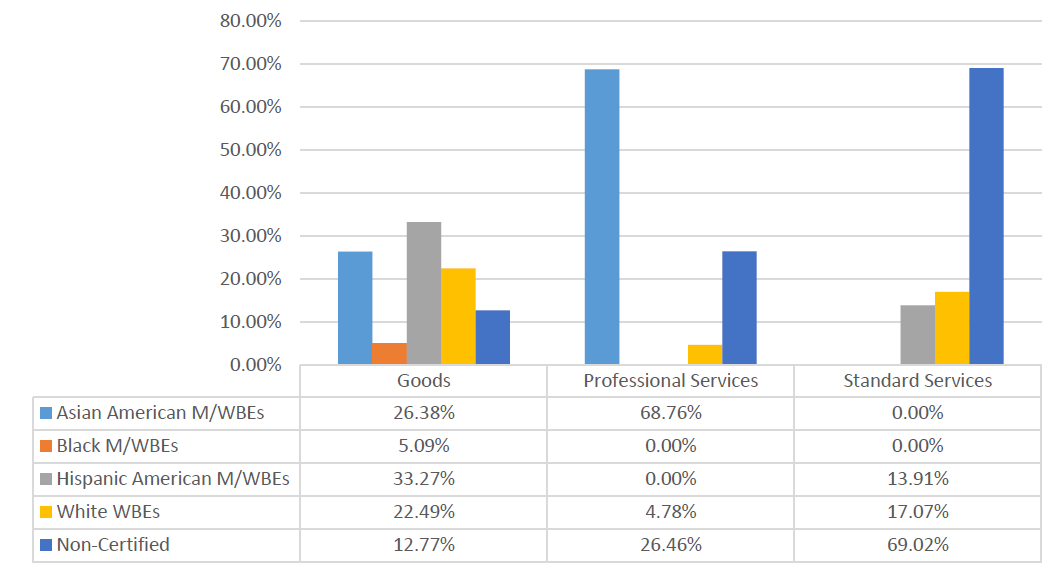
Department of Citywide Administrative Services (DCAS)
The LL 174 data below represents a relatively small share of DCAS’ total procurement portfolio, as DCAS manages high-value contracts with vendors for goods (over $1 million) which are exempt from LL 174 participation goals. DCAS’ $76.87 million in LL 174-eligible value represents less than 1% of the City’s LL 174-eligible contracting portfolio.
Table 47: FY23 LL 174-Eligible Contracts and POs
| Certification Status | # of Contracts | % Share of Contracts | Total Registered Contract Value | % Share of Contract Value |
| All Contracts and POs | 954 | 100.00% | $2,485,828,178 | 100.00% |
| M/WBE | 319 | 33.44% | $68,589,604 | 2.76% |
| Non-Certified | 635 | 66.56% | $2,417,238,574 | 97.24% |
| LL174 Contracts and POs | 509 | 100.00% | $76,877,233 | 100.00% |
| M/WBE | 287 | 56.39% | $17,906,237 | 23.29% |
| Non-Certified | 222 | 43.61% | $58,970,996 | 76.71% |
| LL174 Subcontracts | 3 | 100.00% | $844,000 | 100.00% |
| M/WBE | 3 | 100.00% | $844,000 | 100.00% |
| Non-Certified | 0 | 0.00% | $0 | 0.00% |
Chart 23: FY23 Value of LL 174-Eligible Prime Contracts and POs
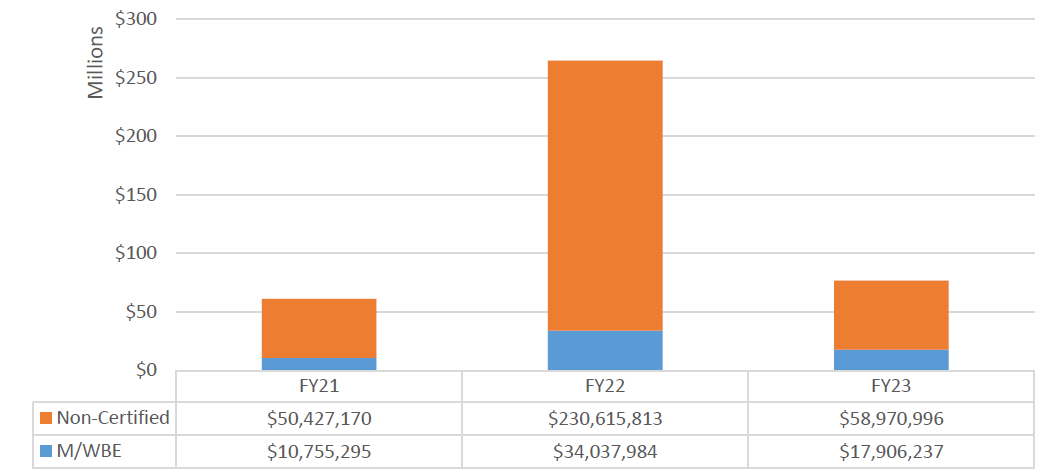
Chart 24: FY23 Value of LL 174-Eligible Contracts and POs, by Race and Gender
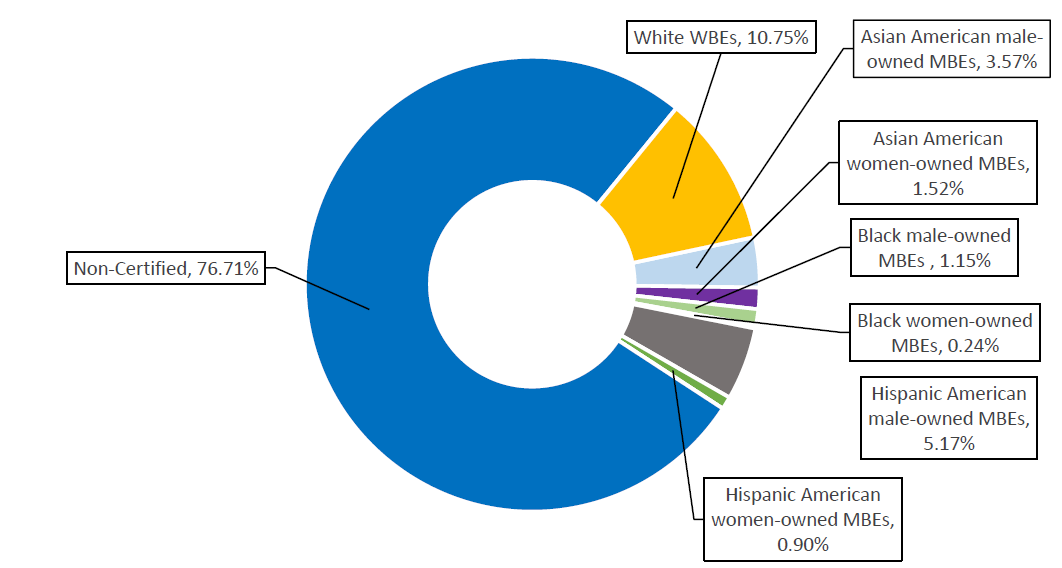
Chart 25: FY23 Share of LL 174-Eligible Contracts and PO Value, by M/WBE Category and Industry
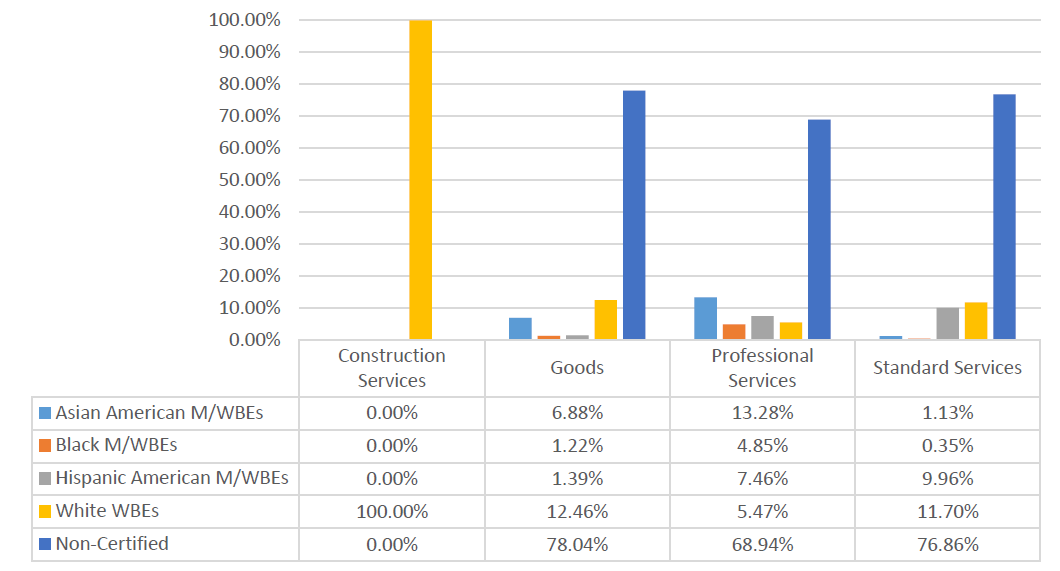
Department of Cultural Affairs (DCLA)
DCLA has a relatively small procurement portfolio that includes a $4.3 million Assignment contract and $2.22 million in City Council Discretionary Funded contracts which are exempt from LL 174 participation goals. DCLA’s $2.03 million in LL 174-eligible value represents less than 0.1% of the City’s LL 174-eligible contracting portfolio.
Table 48: FY23 LL 174-Eligible Contracts and POs
| Certification Status | # of Contracts | % Share of Contracts | Total Registered Contract Value | % Share of Contract Value |
| All Contracts and POs | 166 | 100.00% | $8,621,900 | 100.00% |
| M/WBE | 18 | 10.84% | $1,772,476 | 20.56% |
| Non-Certified | 148 | 89.16% | $6,849,425 | 79.44% |
| LL174 Contracts and POs | 157 | 100.00% | $2,035,945 | 100.00% |
| M/WBE | 18 | 11.46% | $1,772,476 | 87.06% |
| Non-Certified | 139 | 88.54% | $263,469 | 12.94% |
| LL174 Subcontracts | 0 | 0.00% | $0 | 0% |
| M/WBE | 0 | 0.00% | $0 | 0% |
| Non-Certified | 0 | 0.00% | $0 | 0% |
Chart 26: FY23 Value of LL 174-Eligible Prime Contracts and POs
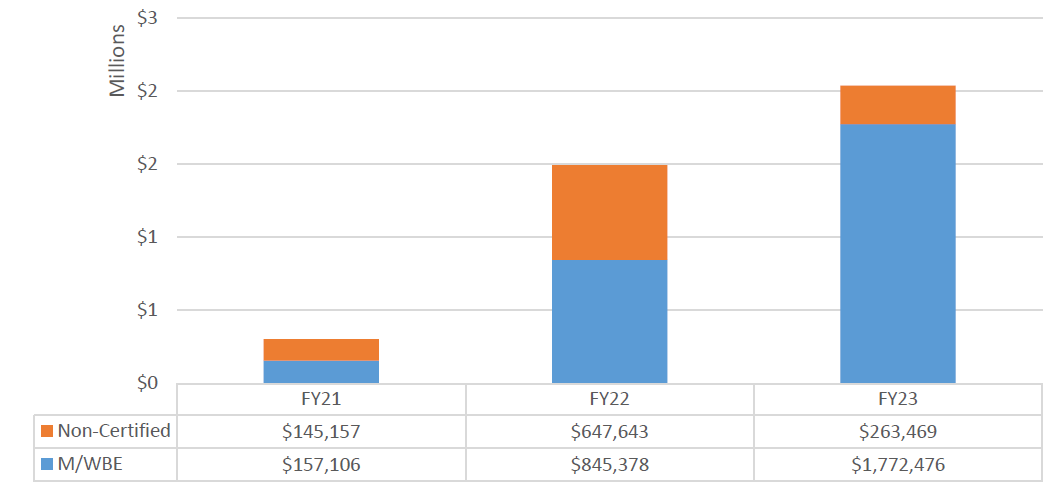
Chart 27: FY23 Value of LL 174-Eligible Contracts and POs, by Race and Gender
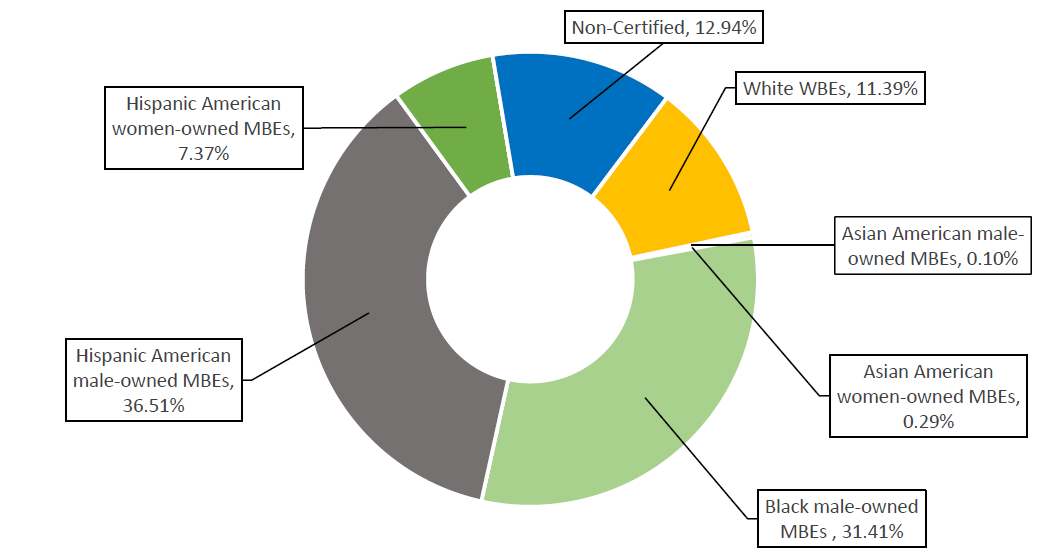
Chart 28: FY23 Share of LL 174-Eligible Contracts and PO Value, by M/WBE Category and Industry
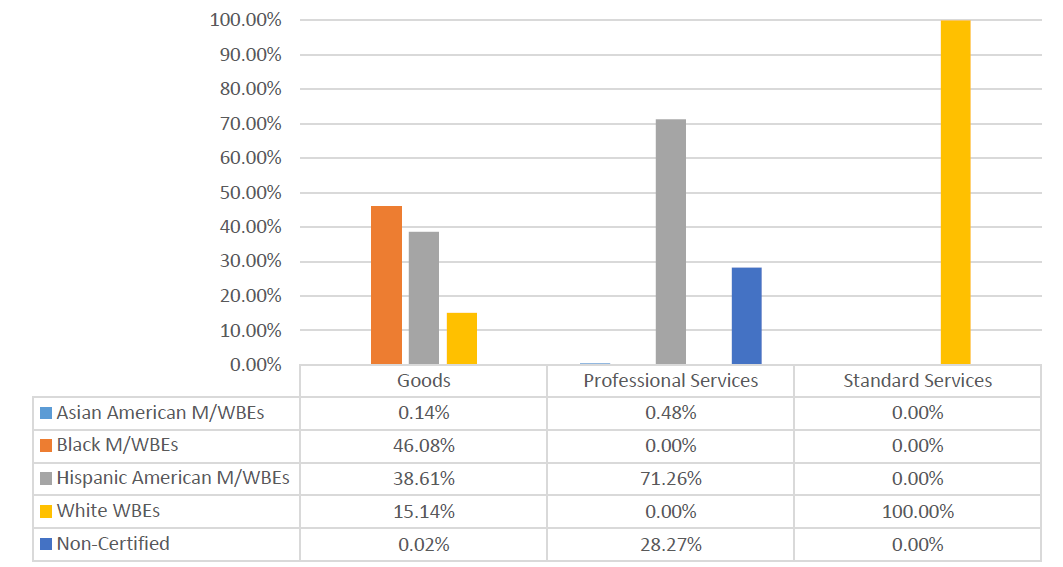
Department of City Planning (DCP)
Most of DCP’s procurement portfolio in FY23 was subject to LL 174 participation goals. Its $13.29 million in LL 174-eligible value accounted for 0.14% of the City’s LL 174-eligible contracting portfolio.
Table 49: FY23 LL 174-Eligible Contracts and POs
| Certification Status | # of Contracts | % Share of Contracts | Total Registered Contract Value | % Share of Contract Value |
| All Contracts and POs | 126 | 100.00% | $13,453,319 | 100.00% |
| M/WBE | 75 | 59.52% | $1,835,247 | 13.64% |
| Non-Certified | 51 | 40.48% | $11,618,072 | 86.36% |
| LL174 Contracts and POs | 118 | 100.00% | $13,299,884 | 100.00% |
| M/WBE | 74 | 62.71% | $1,808,272 | 13.60% |
| Non-Certified | 44 | 37.29% | $11,491,611 | 86.40% |
| LL174 Subcontracts | 0 | 0.00% | $0 | 0% |
| M/WBE | 0 | 0.00% | $0 | 0% |
| Non-Certified | 0 | 0.00% | $0 | 0% |
Chart 29: FY23 Value of LL 174-Eligible Prime Contracts and POs
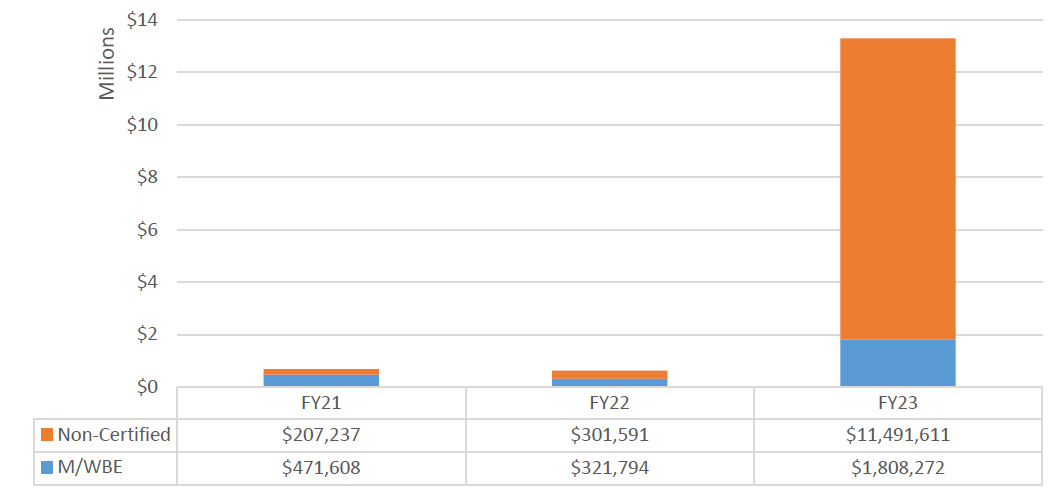
Chart 30: FY23 Value of LL 174-Eligible Contracts and POs, by Race and Gender
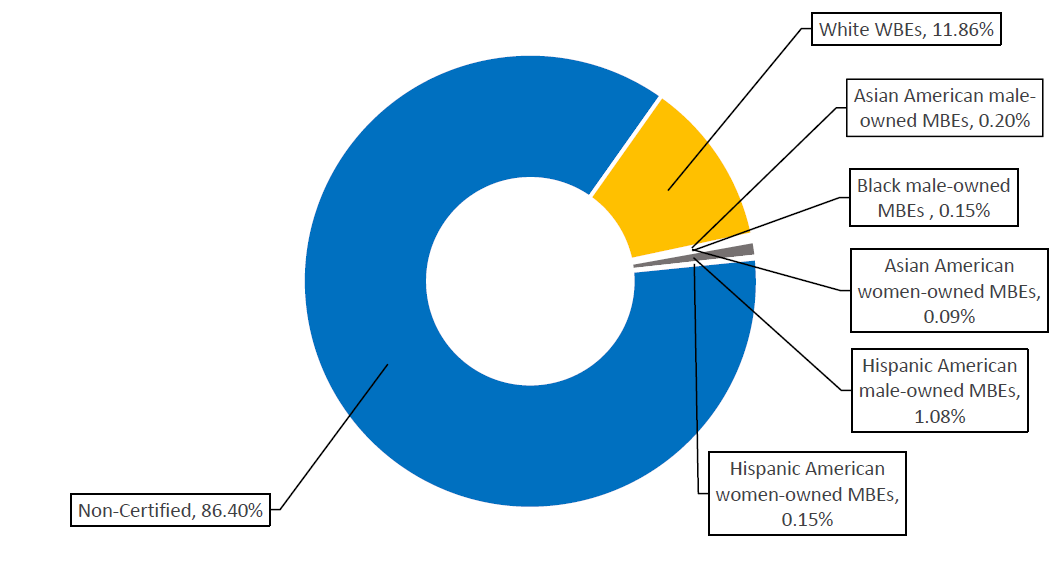
Chart 31: FY23 Share of LL 174-Eligible Contracts and PO Value, by M/WBE Category and Industry
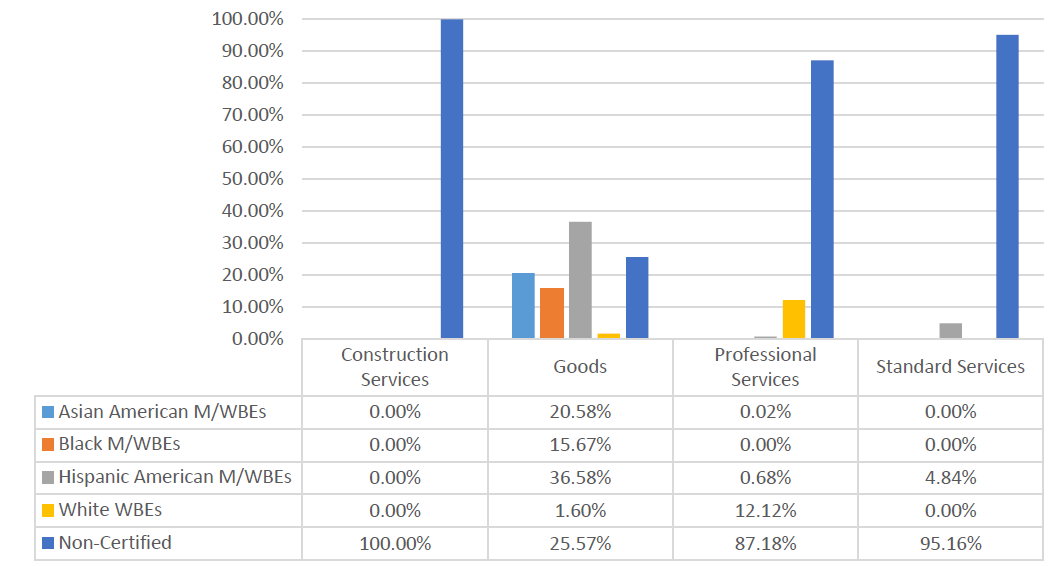
Department of Consumer and Worker Protection (DCWP)
The LL 174 totals below represent only a small share of DCWP’s procurement portfolio, as DCWP predominantly contracts with vendors for human services, which are exempt from LL 174 participation goals. DCWP’s $1.2 million in LL 174-eligible value represents less than 0.1% of the City’s LL 174-eligible contracting portfolio.
Table 50: FY23 LL 174-Eligible Contracts and POs
| Certification Status | # of Contracts | % Share of Contracts | Total Registered Contract Value | % Share of Contract Value |
| All Contracts and POs | 157 | 100.00% | $12,668,955 | 100.00% |
| M/WBE | 56 | 35.67% | $603,134 | 4.76% |
| Non-Certified | 101 | 64.33% | $12,065,822 | 95.24% |
| LL174 Contracts and POs | 135 | 100.00% | $1,266,565 | 100.00% |
| M/WBE | 56 | 41.48% | $603,134 | 47.62% |
| Non-Certified | 79 | 58.52% | $663,431 | 52.38% |
| LL174 Subcontracts | 0 | 0.00% | $0 | 0% |
| M/WBE | 0 | 0.00% | $0 | 0% |
| Non-Certified | 0 | 0.00% | $0 | 0% |
Chart 32: FY23 Value of LL 174-Eligible Prime Contracts and POs
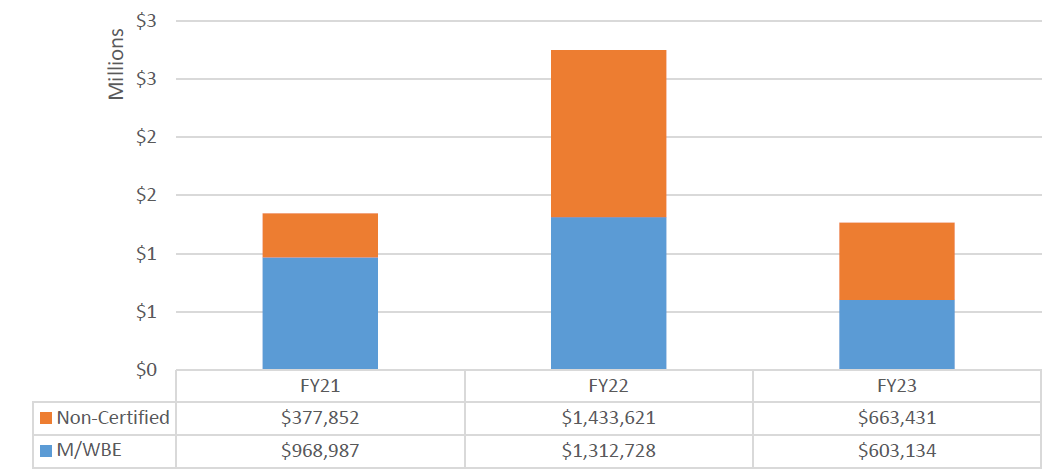
Chart 33: FY23 Value of LL 174-Eligible Contracts and POs, by Race and Gender
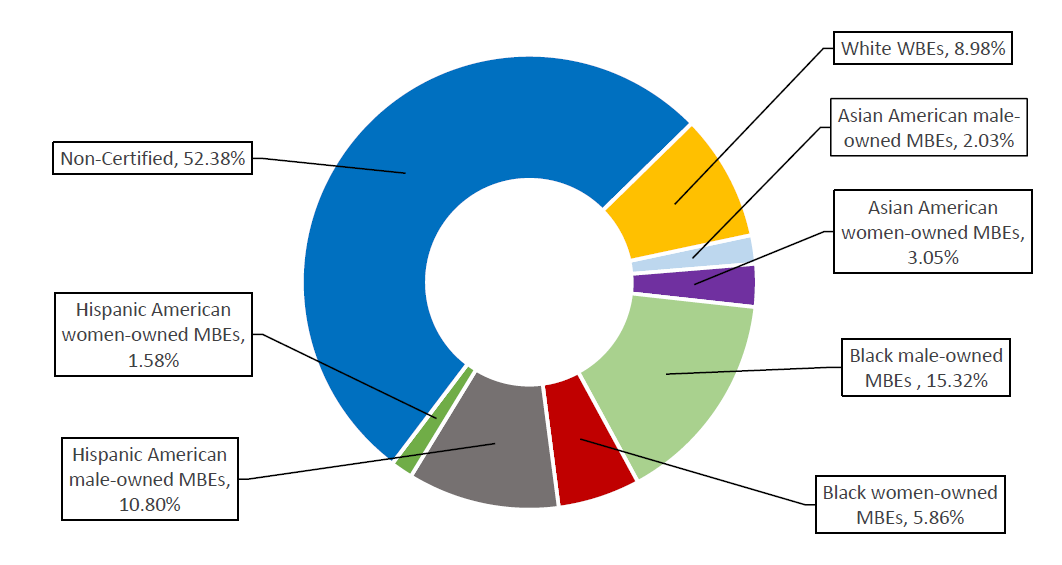
Chart 34: FY23 Share of LL 174-Eligible Contracts and PO Value, by M/WBE Category and Industry
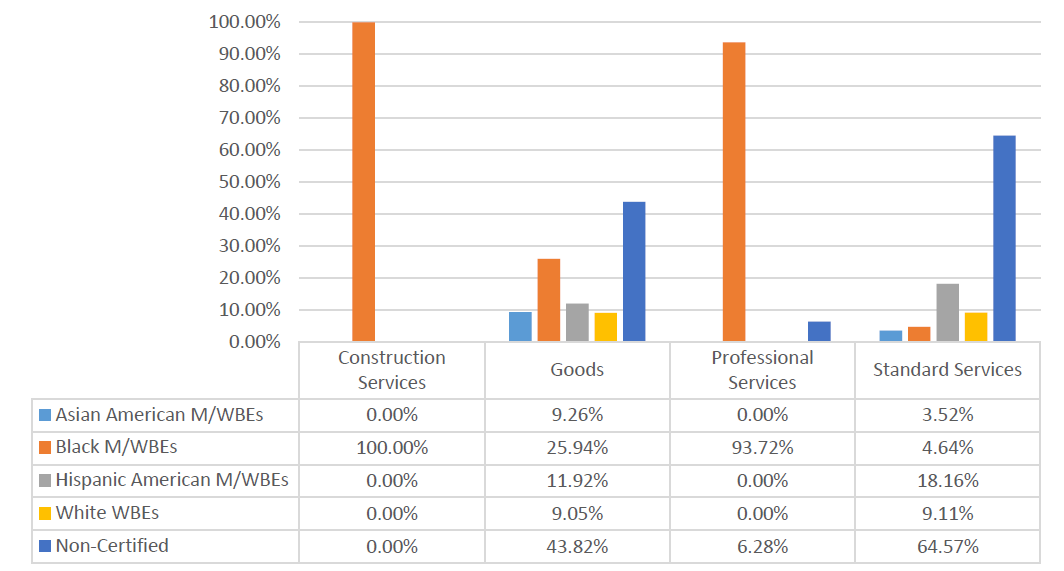
Department of Design and Construction (DDC)
DDC has one of the largest procurement portfolios across the City and most of its procurement portfolio is subject to LL 174 participation goals. DDC also accounts for over half of the City’s overall LL 174-eligible contracting portfolio. In FY23, DDC registered a $3 billion contract to a Non-Certified firm for the design-build construction of the Brooklyn borough-based jail (referred to as “the DDC BBJ contract”). Contracts procured via design-build are expected to comply with the objectives and goals of LL 174, and as such are included in this analysis. This contract significantly impacted the City’s (and DDC’s) M/WBE utilization rate.[58]
Table 51: FY23 LL 174-Eligible Contracts and POs
| Certification Status | # of Contracts | % Share of Contracts | Total Registered Contract Value | % Share of Contract Value |
| All Contracts and POs | 395 | 100.00% | $5,279,742,094 | 100.00% |
| M/WBE | 101 | 25.57% | $177,843,348 | 3.37% |
| Non-Certified | 294 | 74.43% | $5,101,898,746 | 96.63% |
| LL174 Contracts and POs | 300 | 100.00% | $4,938,051,782 | 100.00% |
| M/WBE | 94 | 31.33% | $138,281,625 | 2.80% |
| Non-Certified | 206 | 68.67% | $4,799,770,156 | 97.20% |
| LL174 Subcontracts | 749 | 100.00% | $556,190,930 | 100.00% |
| M/WBE | 472 | 63.02% | $182,312,496 | 32.78% |
| Non-Certified | 277 | 36.98% | $373,878,434 | 67.22% |
Chart 35: FY23 Value of LL 174-Eligible Prime Contracts and POs
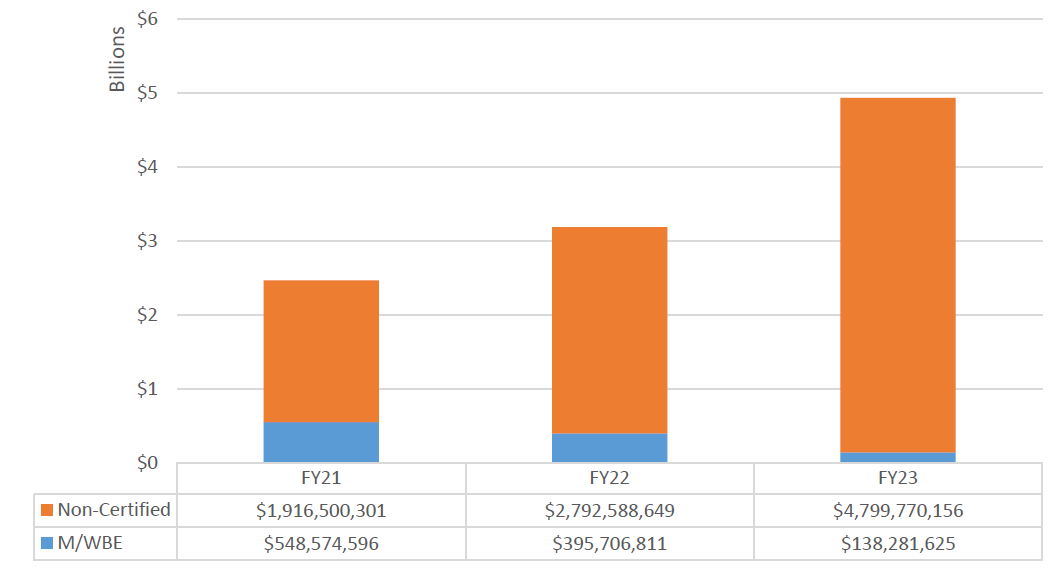
Chart 36: FY23 Value of LL 174-Eligible Contracts and POs, by Race and Gender
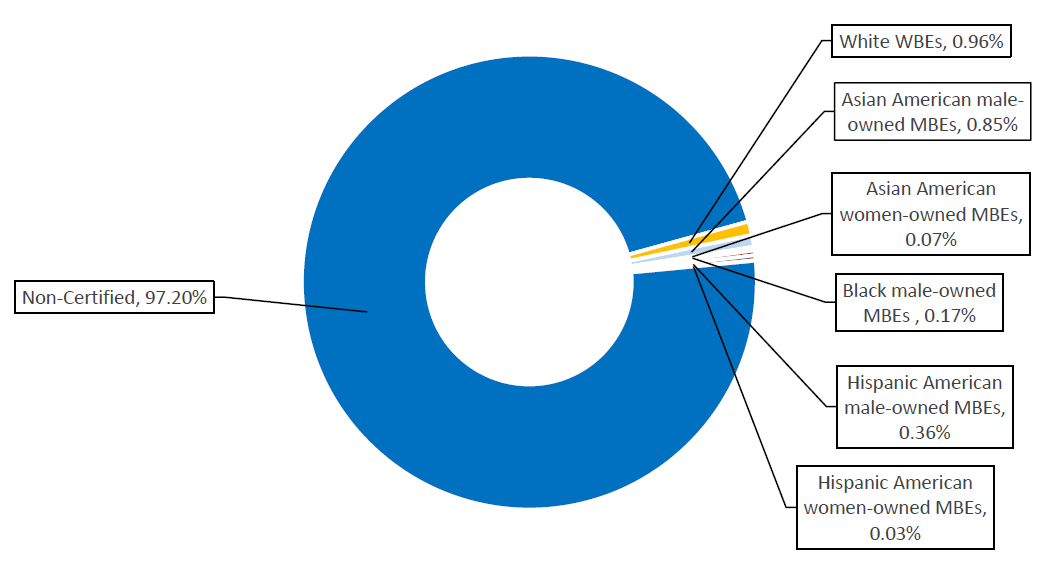
Chart 37: FY23 Share of LL 174-Eligible Contracts and PO Value, by M/WBE Category and Industry
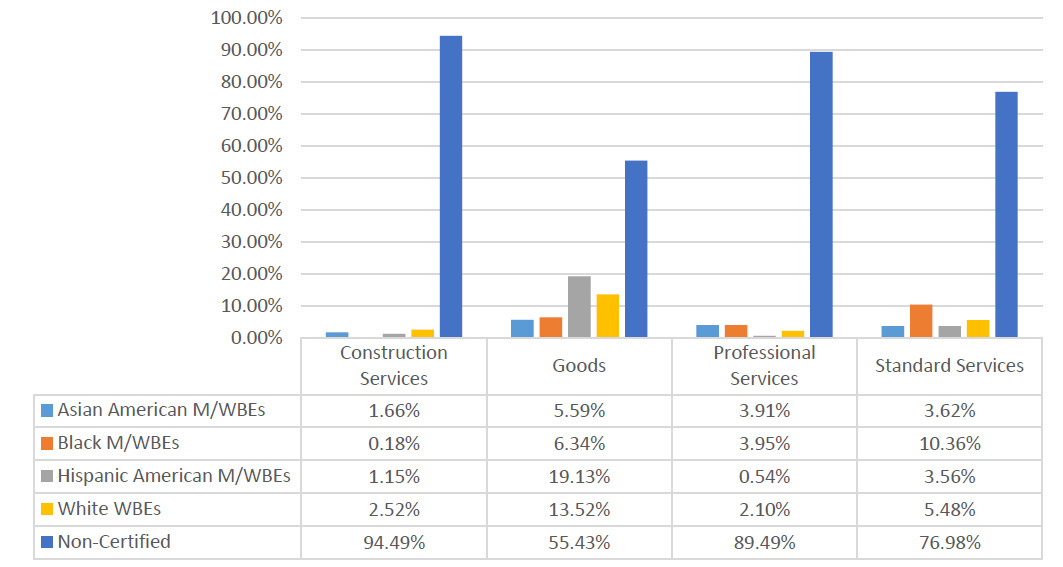
Department of Environmental Protection (DEP)
The majority of DEP’s FY23 procurement portfolio is subject to LL 174 participation goals. However, many of DEP’s contracts are funded, at least in part, by non-City sources, which are excluded from the local law.[59] DEP represents nearly a fifth of the City’s total LL 174-eligible contracting portfolio (acknowledging that this total may include some excluded contracts).
Table 52: FY23 LL 174-Eligible Contracts and POs
| Certification Status | # of Contracts | % Share of Contracts | Total Registered Contract Value | % Share of Contract Value |
| All Contracts and POs | 2,069 | 100.00% | $1,886,725,551 | 100.00% |
| M/WBE | 1,227 | 59.30% | $124,787,063 | 6.61% |
| Non-Certified | 842 | 40.70% | $1,761,938,488 | 93.39% |
| LL174 Contracts and POs | 1,945 | 100.00% | $1,566,789,126 | 100.00% |
| M/WBE | 1,211 | 62.26% | $99,918,729 | 6.38% |
| Non-Certified | 734 | 37.74% | $1,466,870,397 | 93.62% |
| LL174 Subcontracts | 367 | 100.00% | $376,101,706 | 100.00% |
| M/WBE | 261 | 71.12% | $177,599,386 | 47.22% |
| Non-Certified | 106 | 28.88% | $198,502,320 | 52.78% |
Chart 38: FY23 Value of LL 174-Eligible Prime Contracts and POs
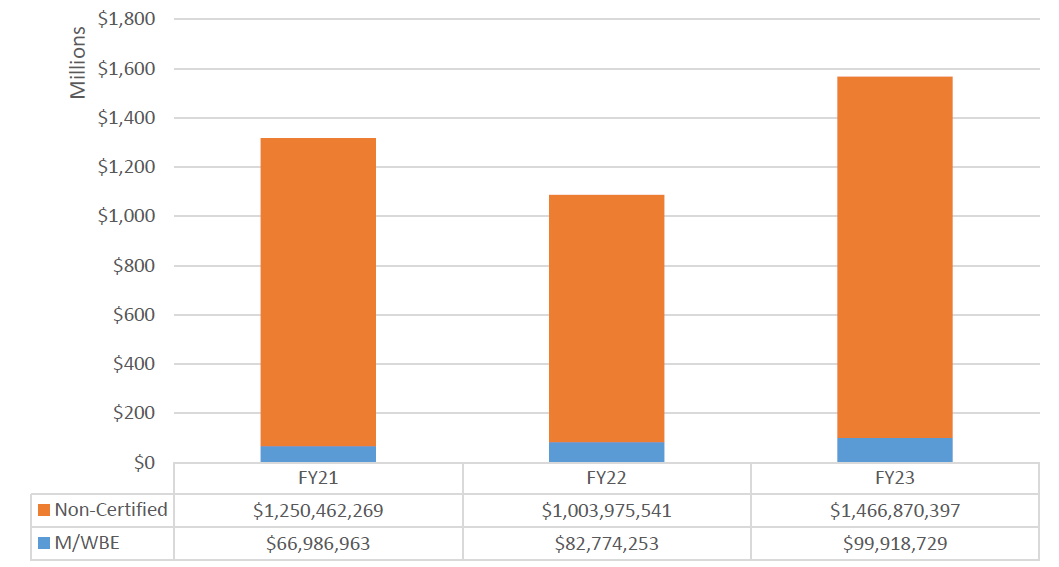
Chart 39: FY23 Value of LL 174-Eligible Contracts and POs, by Race and Gender
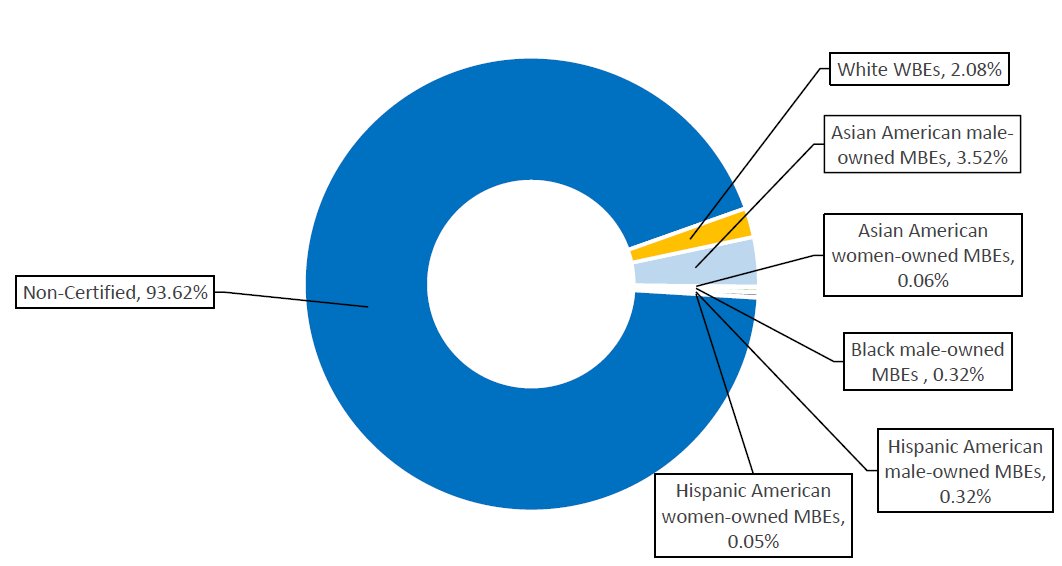
Chart 40: FY23 Share of LL 174-Eligible Contracts and PO Value, by M/WBE Category and Industry
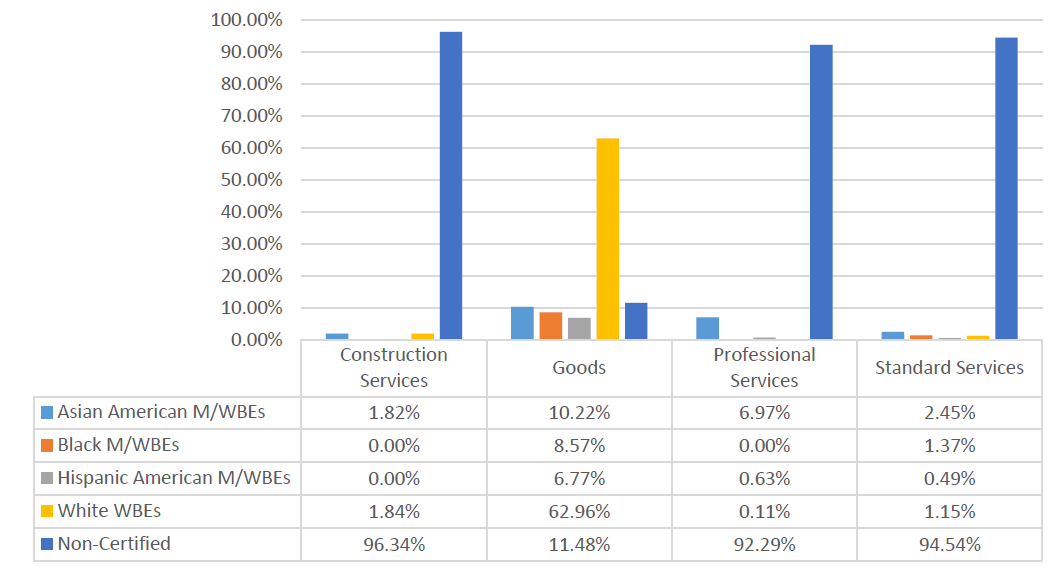
Department for the Aging (DFTA)
The LL 174 totals below represent a relatively small share of DFTA’s total procurement portfolio, as DFTA predominantly contracts for human services, which are exempt from LL 174 participation goals. DFTA’s $1.32 million in LL 174-eligible value represents less than .01% of the City’s LL 174-eligible contracting portfolio.
Table 53: FY23 LL 174-Eligible Contracts and POs
| Certification Status | # of Contracts | % Share of Contracts | Total Registered Contract Value | % Share of Contract Value |
| All Contracts and POs | 810 | 100.00% | $266,994,421 | 100.00% |
| M/WBE | 90 | 11.11% | $1,914,676 | 0.72% |
| Non-Certified | 720 | 88.89% | $265,079,745 | 99.28% |
| LL174 Contracts and POs | 182 | 100.00% | $1,328,483 | 100.00% |
| M/WBE | 87 | 47.80% | $698,931 | 52.61% |
| Non-Certified | 95 | 52.20% | $629,552 | 47.39% |
| LL174 Subcontracts | 0 | 0.00% | $0 | 0.00% |
| M/WBE | 0 | 0.00% | $0 | 0.00% |
| Non-Certified | 0 | 0.00% | $0 | 0.00% |
Chart 41: FY23 Value of LL 174-Eligible Prime Contracts and POs
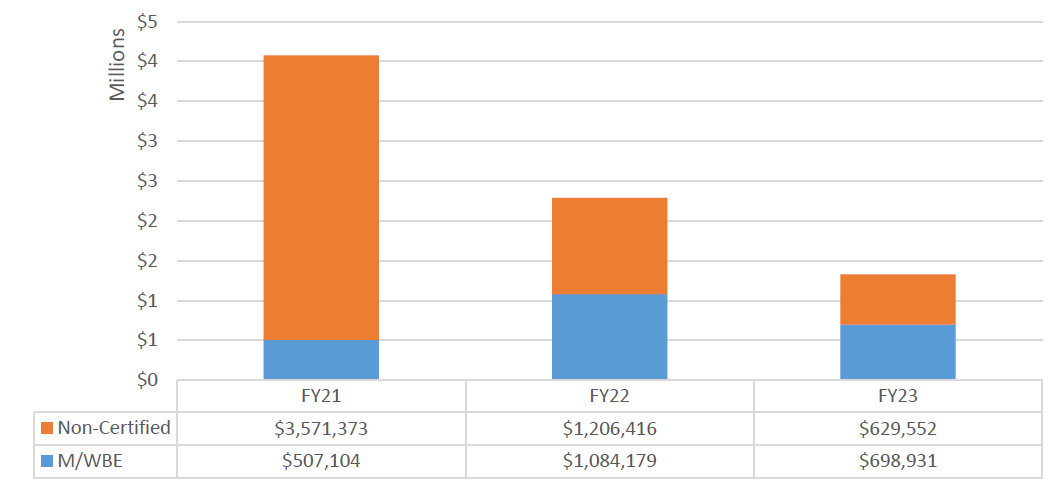
Chart 42: FY23 Value of LL 174-Eligible Contracts and POs, by Race and Gender
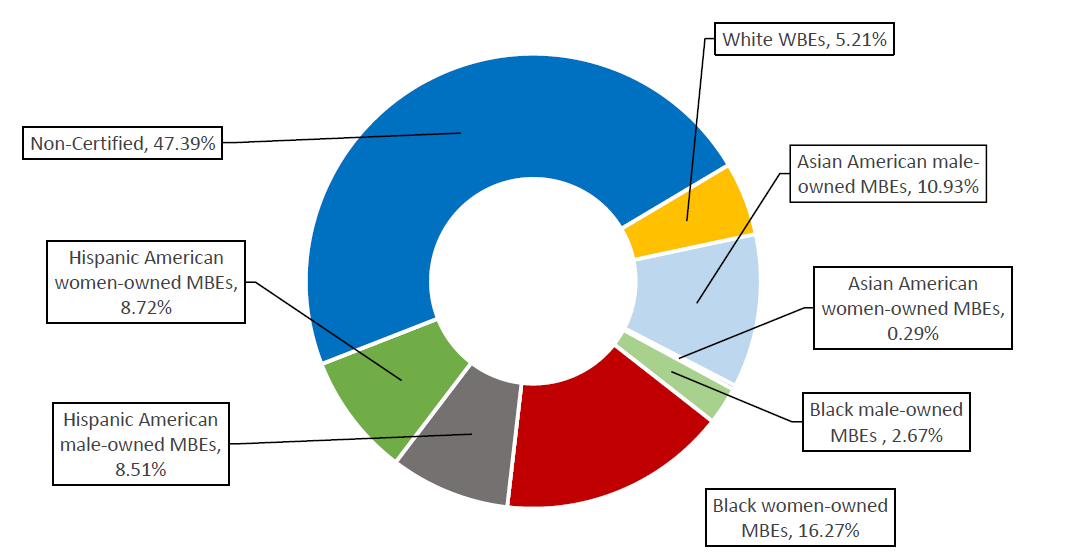
Chart 43: FY23 Share of LL 174-Eligible Contracts and PO Value, by M/WBE Category and Industry
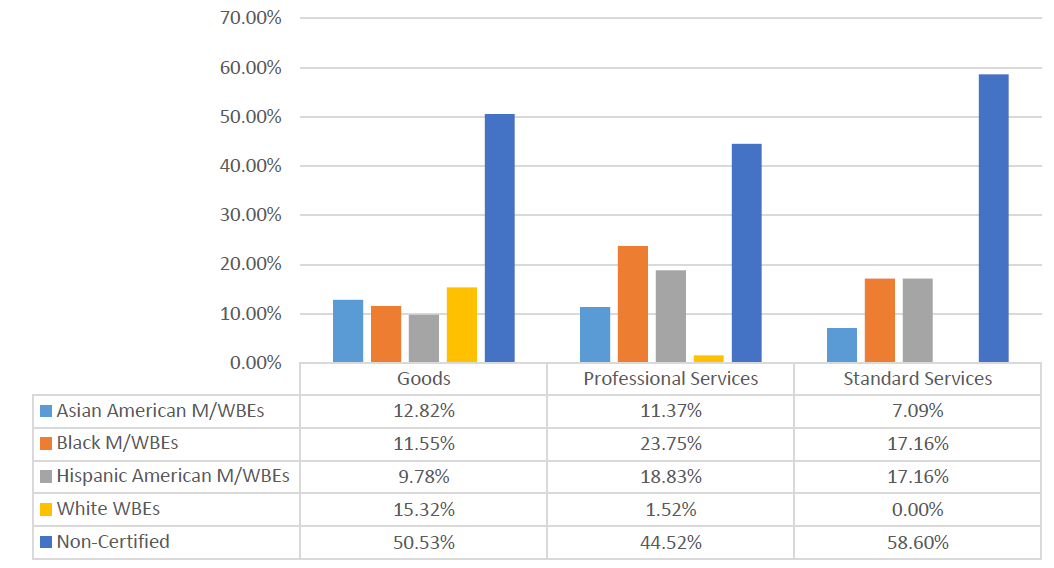
Department of Buildings (DOB)
The LL 174 totals below represent a relatively small share of DOB’s total contracting portfolio. DOB registered $6.5 million in Renewal contracts, which are excluded from this analysis. DOB’s $6.5 million in LL 174-eligible value represents less than 0.1% of the City’s LL 174-eligible contracting portfolio.
Table 54: FY23 LL 174-Eligible Contracts and POs
| Certification Status | # of Contracts | % Share of Contracts | Total Registered Contract Value | % Share of Contract Value |
| All Contracts and POs | 218 | 100.00% | $14,551,338 | 100.00% |
| M/WBE | 116 | 53.21% | $4,214,814 | 28.97% |
| Non-Certified | 102 | 46.79% | $10,336,524 | 71.03% |
| LL174 Contracts and POs | 199 | 100.00% | $6,506,243 | 100.00% |
| M/WBE | 115 | 57.79% | $3,584,814 | 55.10% |
| Non-Certified | 84 | 42.21% | $2,921,429 | 44.90% |
| LL174 Subcontracts | 0 | 0.00% | $0 | 0% |
| M/WBE | 0 | 0.00% | $0 | 0% |
| Non-Certified | 0 | 0.00% | $0 | 0% |
Chart 44: FY23 Value of LL 174-Eligible Prime Contracts and POs
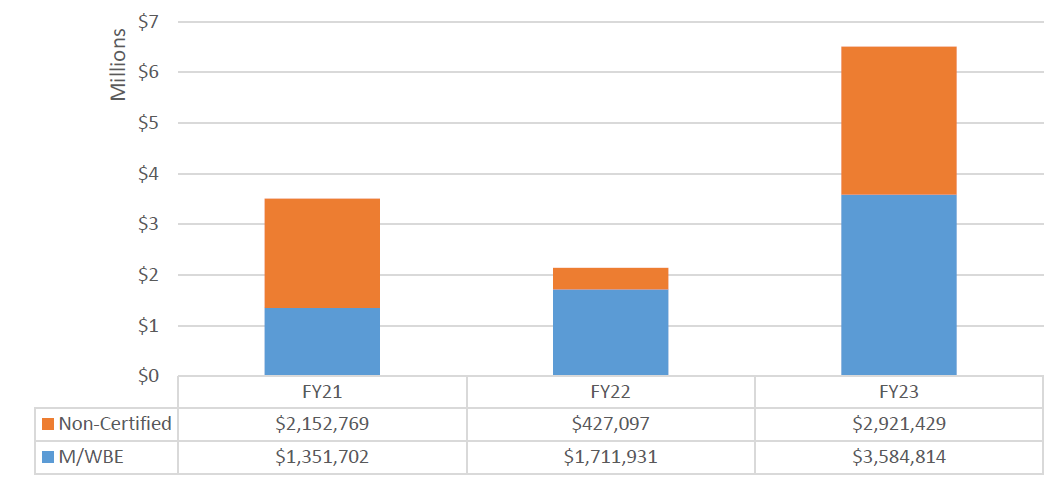
Chart 45: FY23 Value of LL 174-Eligible Contracts and POs, by Race and Gender
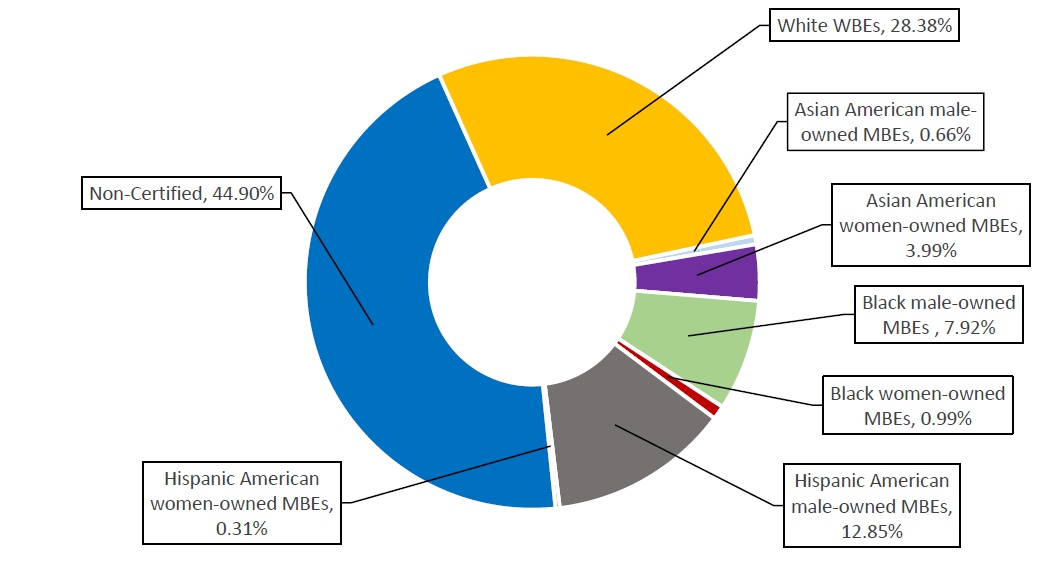
Chart 46: FY23 Share of LL 174-Eligible Contracts and PO Value, by M/WBE Category and Industry
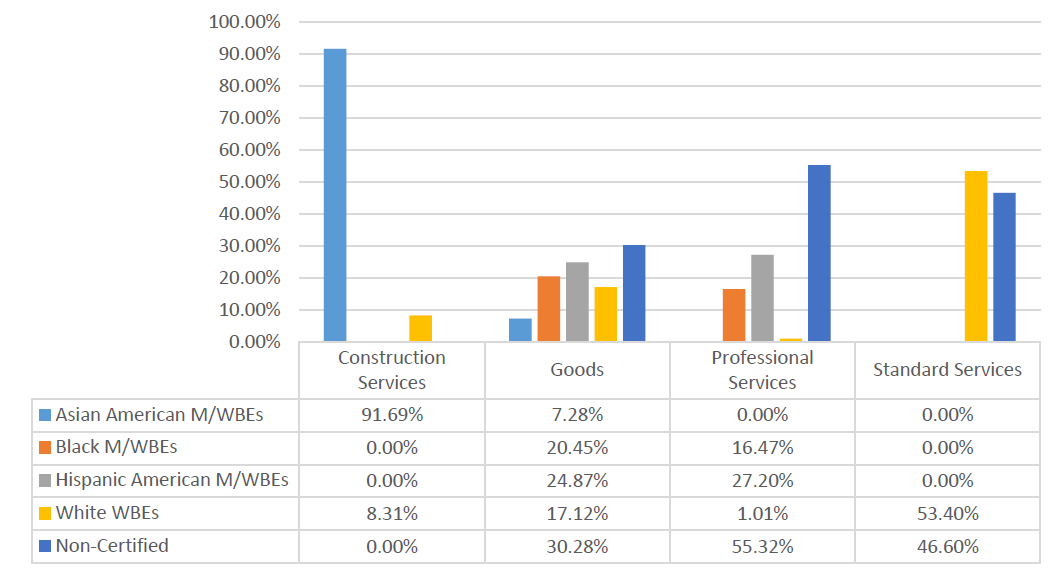
Department of Correction (DOC)
Most of DOC’s procurement portfolio in FY23 was subject to LL 174 participation goals. DOC’s $70.38 million in LL 174-eligible value represents less than 1% of the City’s LL 174-eligible contracting portfolio.
Table 55: FY23 LL 174-Eligible Contracts and POs
| Certification Status | # of Contracts | % Share of Contracts | Total Registered Contract Value | % Share of Contract Value |
| All Contracts and POs | 596 | 100.00% | $108,130,633 | 100.00% |
| M/WBE | 353 | 59.23% | $10,821,374 | 10.01% |
| Non-Certified | 243 | 40.77% | $97,309,260 | 89.99% |
| LL174 Contracts and POs | 491 | 100.00% | $70,387,597 | 100.00% |
| M/WBE | 331 | 67.41% | $10,088,642 | 14.33% |
| Non-Certified | 160 | 32.59% | $60,298,956 | 85.67% |
| LL174 Subcontracts | 0 | 0.00% | $0 | 0.00% |
| M/WBE | 0 | 0.00% | $0 | 0.00% |
| Non-Certified | 0 | 0.00% | $0 | 0.00% |
Chart 47: FY23 Value of LL 174-Eligible Prime Contracts and POs
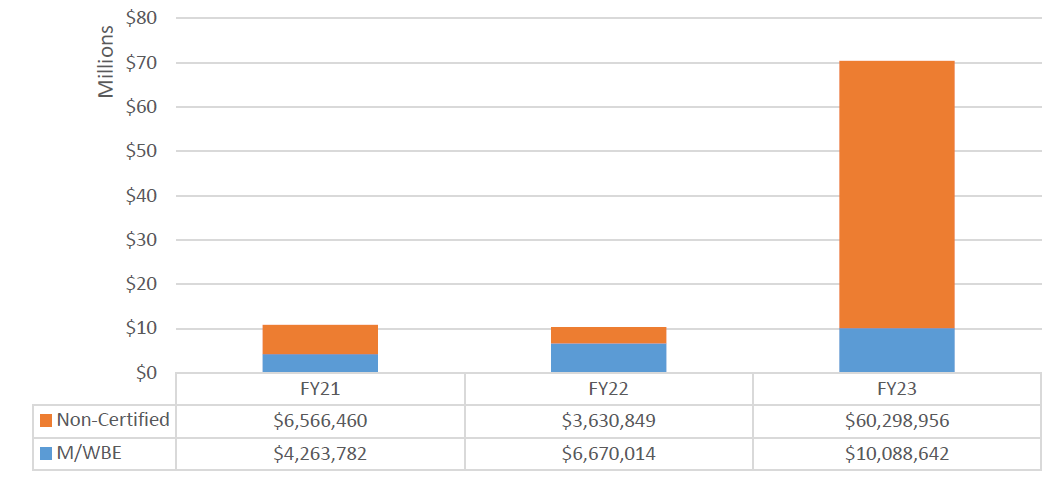
Chart 48: FY23 Value of LL 174-Eligible Contracts and POs, by Race and Gender
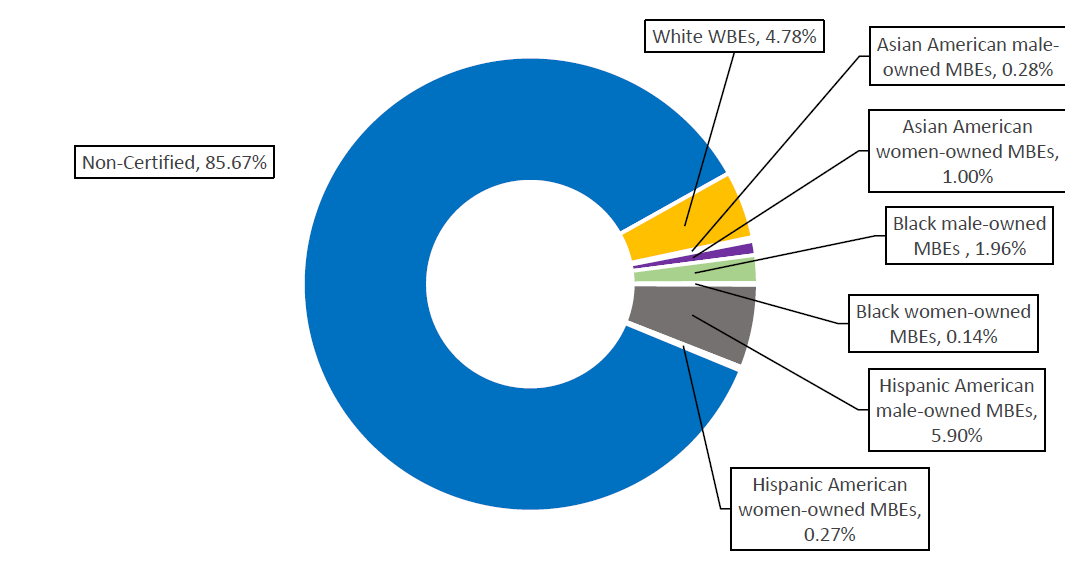
Chart 49: FY23 Share of LL 174-Eligible Contracts and PO Value, by M/WBE Category and Industry
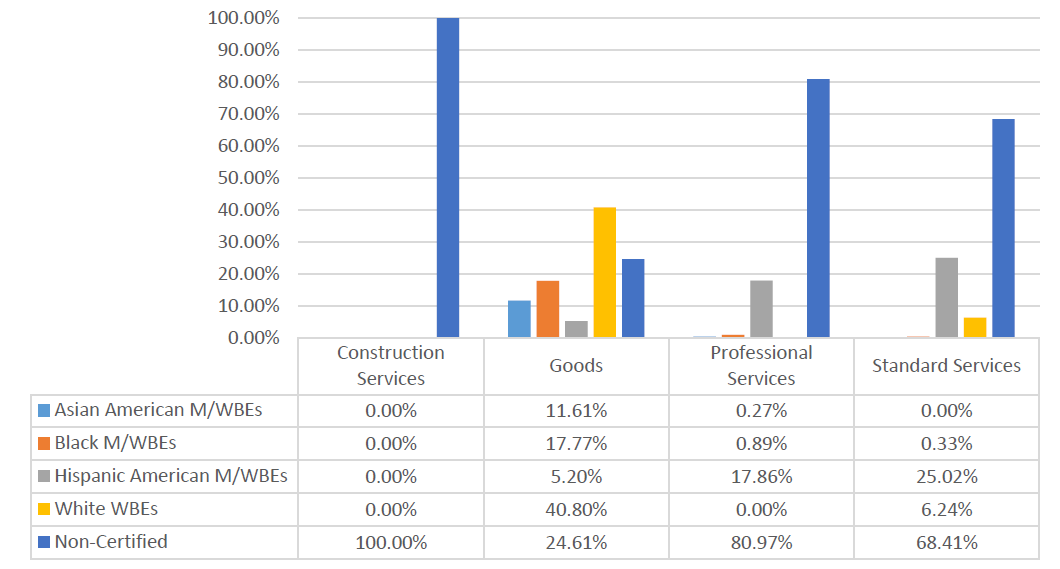
Department of Education (DOE)
Although the DOE is not a mayoral agency, the DOE implemented its own M/WBE participation goals program in FY23. A detailed analysis on the DOE’s M/WBE utilization and more information on the goals program can be found in the Specialized Focus: Department of Education section of this Report.
The LL 174 totals below represent only a small fraction of the DOE’s total procurement portfolio, as the DOE’s contracts for valuable human services contracts, which are not subject to M/WBE participation goals. The DOE has one of the largest procurement portfolios in the City—its $570.87 million in LL 174-eligible value represents over 6% of the City’s total LL 174-eligible contracting portfolio.
Table 56: FY23 LL 174-Eligible Contracts and POs
| Certification Status | # of Contracts | % Share of Contracts | Total Registered Contract Value | % Share of Contract Value |
| All Contracts and POs | 105,512 | 100.00% | $3,200,351,894 | 100.00% |
| M/WBE | 8,721 | 8.27% | $382,918,353 | 11.96% |
| Non-Certified | 96,791 | 91.73% | $2,817,433,542 | 88.04% |
| LL174 Contracts and POs | 93,942 | 100.00% | $570,876,920 | 100.00% |
| M/WBE | 8,382 | 8.92% | $121,963,905 | 21.36% |
| Non-Certified | 85,560 | 91.08% | $448,913,015 | 78.64% |
| LL174 Subcontracts | 0 | 0% | $0 | 0% |
| M/WBE | 0 | 0% | $0 | 0% |
| Non-Certified | 0 | 0% | $0 | 0% |
Chart 50 FY23 Value of LL 174-Eligible Prime Contracts and POs
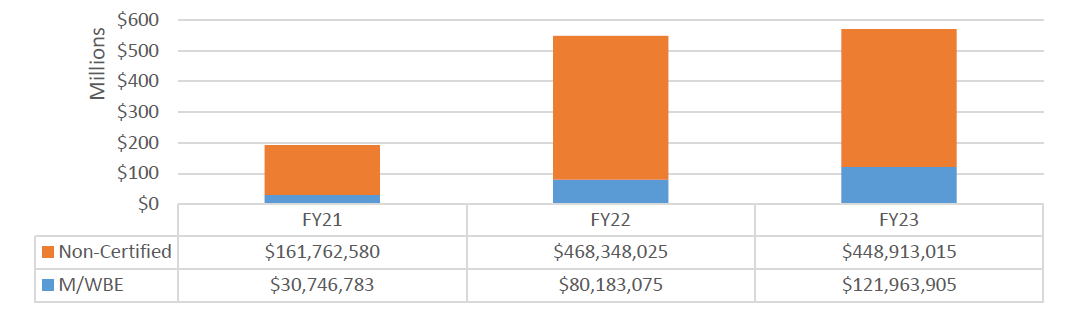
Chart 51: FY23 Value of LL 174-Eligible Contracts and POs, by Race and Gender
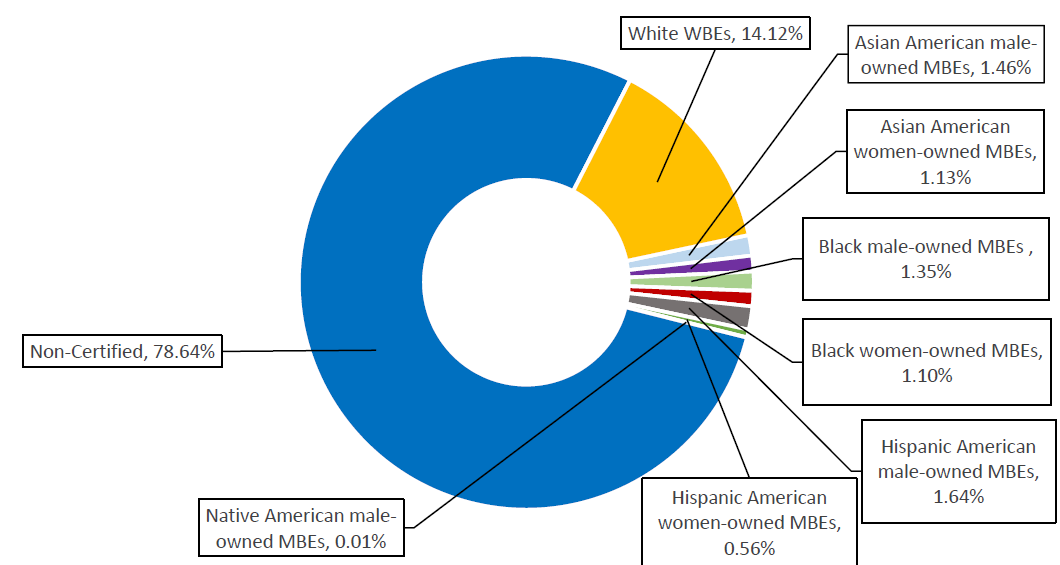
Chart 52: FY23 Share of LL 174-Eligible Contracts and PO Value, by M/WBE Category and Industry
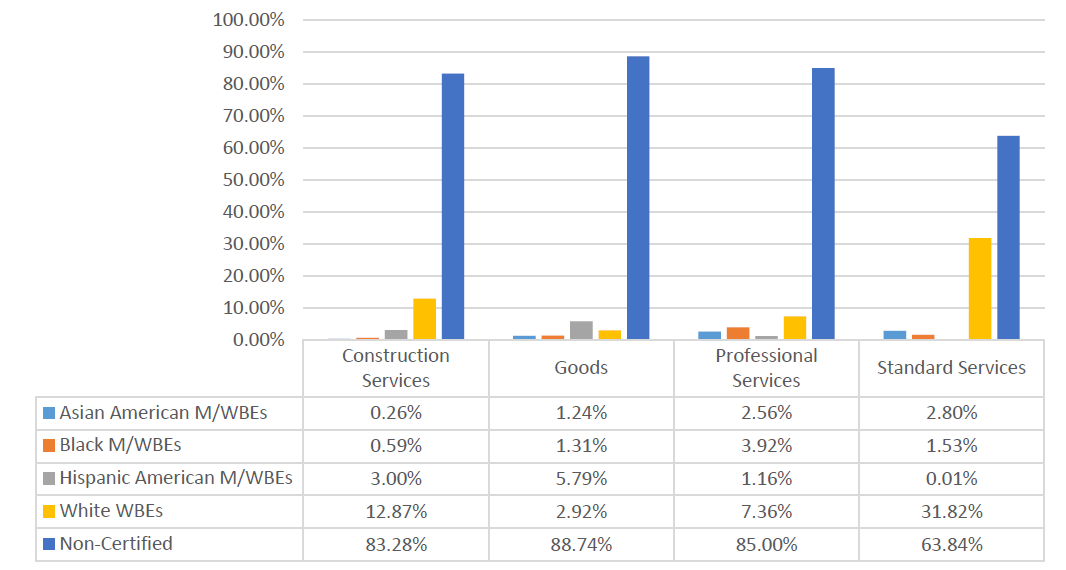
Department of Finance (DOF)
The LL 174 totals below represent just over half of DOF’s procurement portfolio. DOF registered valuable contracts via Sole Source and Intergovernmental which are not subject to LL 174 participation goals. DOF also registered valuable Renewals in FY23, which were excluded from this analysis. The $158.97 million in LL 174-eligible value accounts for roughly 2% of the City’s total LL 174-eligible contracting portfolio.
Table 57: FY23 LL 174-Eligible Contracts and POs
| Certification Status | # of Contracts | % Share of Contracts | Total Registered Contract Value | % Share of Contract Value |
| All Contracts and POs | 304 | 100.00% | $270,497,967 | 100.00% |
| M/WBE | 93 | 30.59% | $3,658,430 | 1.35% |
| Non-Certified | 211 | 69.41% | $266,839,537 | 98.65% |
| LL174 Contracts and POs | 223 | 100.00% | $158,979,826 | 100.00% |
| M/WBE | 87 | 39.01% | $2,666,866 | 1.68% |
| Non-Certified | 136 | 60.99% | $156,312,961 | 98.32% |
| LL174 Subcontracts | 5 | 100.00% | $2,629,206 | 100.00% |
| M/WBE | 5 | 100.00% | $2,629,206 | 100.00% |
| Non-Certified | 0 | 0% | $0 | 0% |
Chart 53: FY23 Value of LL 174-Eligible Prime Contracts and POs
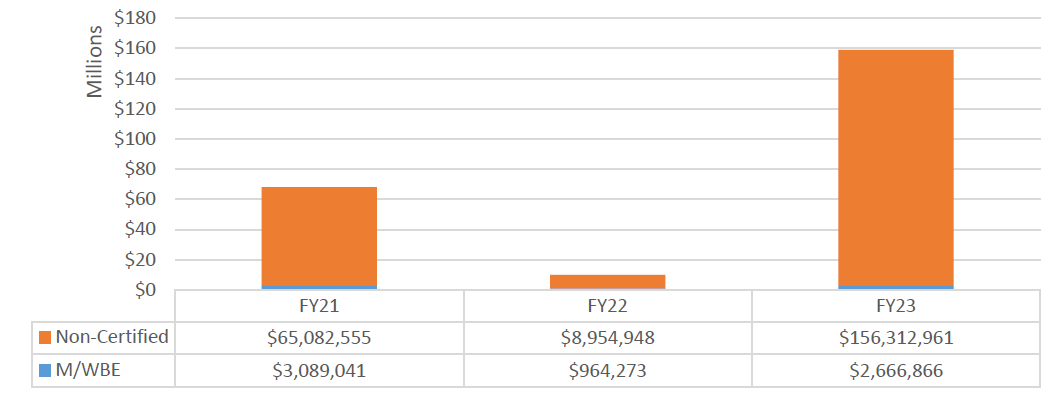
Chart 54: FY23 Value of LL 174-Eligible Contracts and POs, by Race and Gender
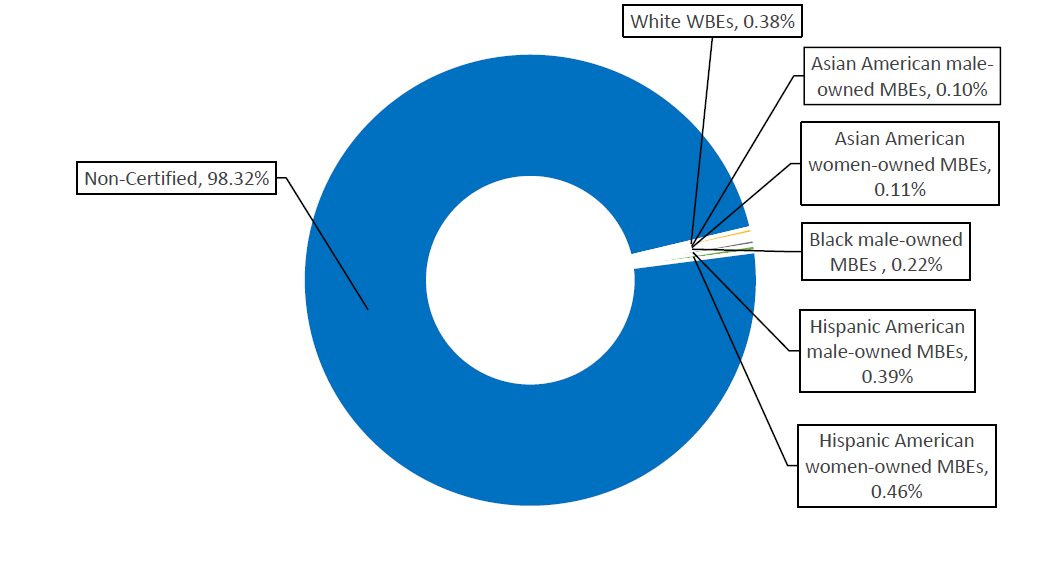
Chart 55: FY23 Share of LL 174-Eligible Contracts and PO Value, by M/WBE Category and Industry
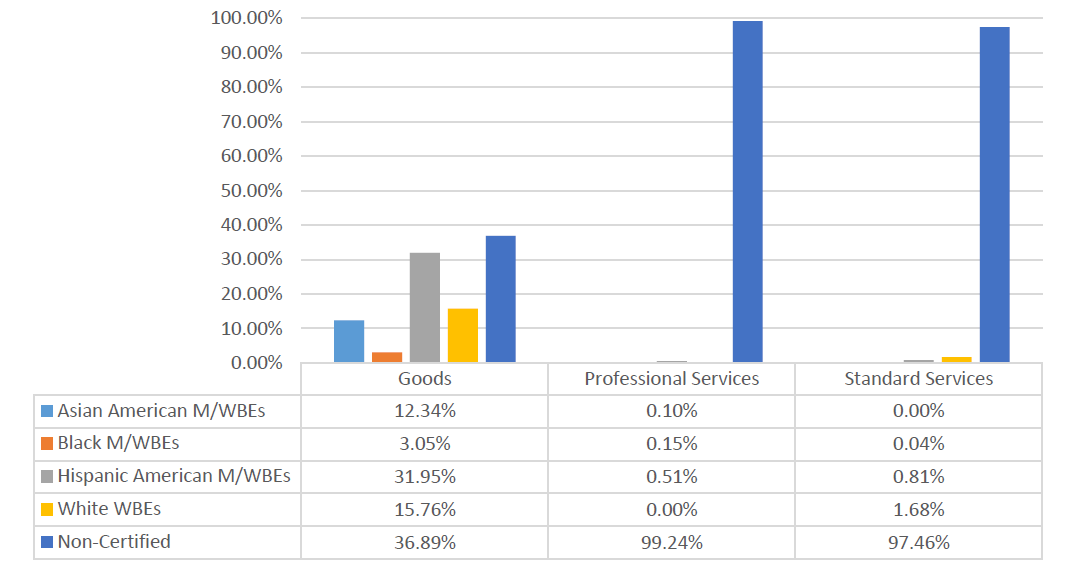
Department of Health and Mental Hygiene (DOHMH)
The LL 174 totals below represent just a quarter of DOHMH’s total procurement portfolio, as it predominantly contracts with vendors for human services, which are exempt from LL 174 participation goals. DOHMH’s $29.32 million in LL 174-eligible value accounts for less than 0.5% of the City’s total LL 174-eligible contracting portfolio.
Table 58: FY23 LL 174-Eligible Contracts and POs
| Certification Status | # of Contracts | % Share of Contracts | Total Registered Contract Value | % Share of Contract Value |
| All Contracts and POs | 1,748 | 100.00% | $1,357,576,137 | 100.00% |
| M/WBE | 586 | 33.52% | $269,660,316 | 19.86% |
| Non-Certified | 1,162 | 66.48% | $1,087,915,821 | 80.14% |
| LL174 Contracts and POs | 1,073 | 100.00% | $29,792,560 | 100.00% |
| M/WBE | 484 | 47.31% | $14,541,439 | 49.59% |
| Non-Certified | 539 | 52.69% | $14,784,717 | 50.41% |
| LL174 Subcontracts | 0 | 0.00% | $0 | 0.00% |
| M/WBE | 0 | 0.00% | $0 | 0.00% |
| Non-Certified | 0 | 0.00% | $0 | 0.00% |
Chart 56: FY23 Value of LL 174-Eligible Prime Contracts and POs
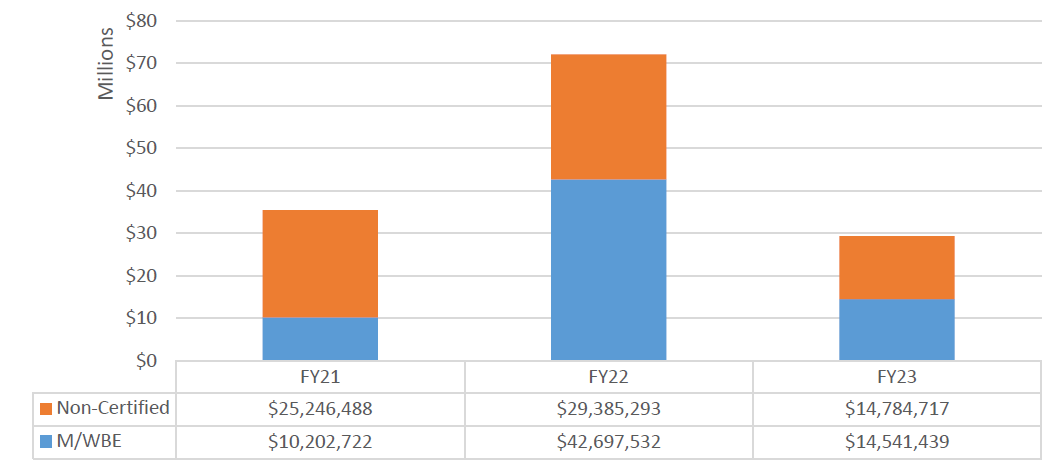
Chart 57: FY23 Value of LL 174-Eligible Contracts and POs, by Race and Gender
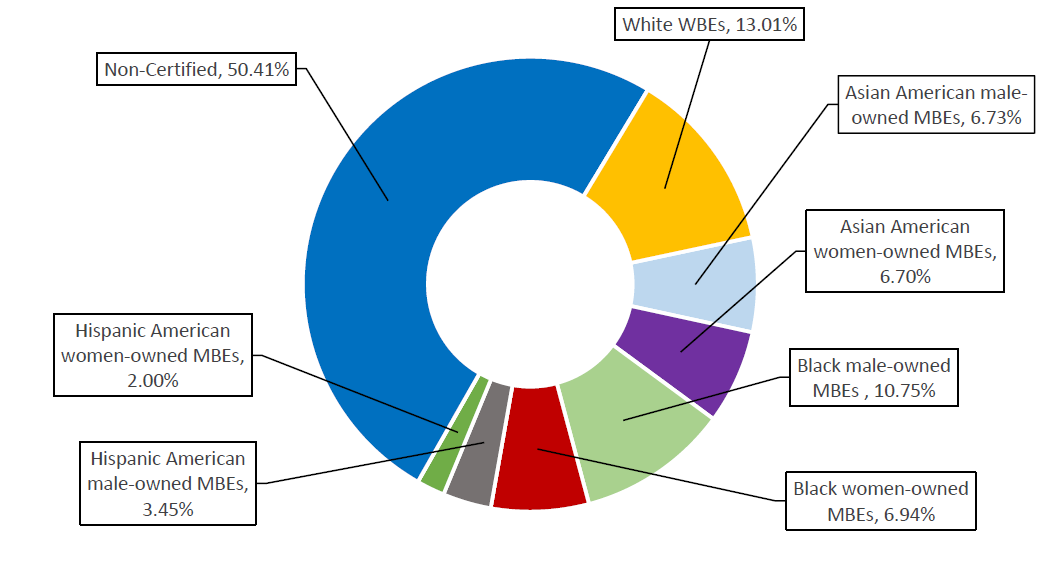
Chart 58: FY23 Share of LL 174-Eligible Contracts and PO Value, by M/WBE Category and Industry
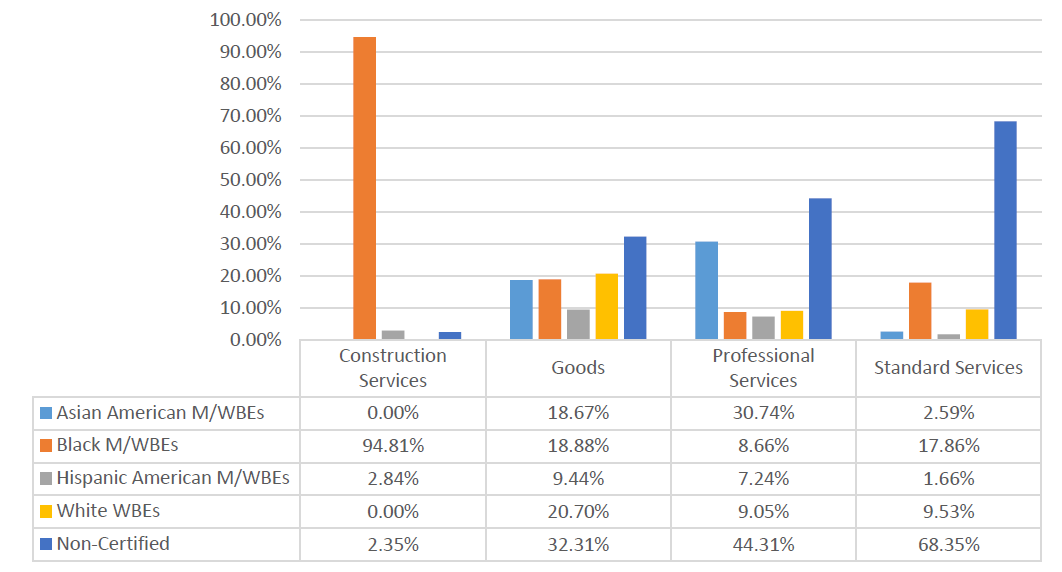
Department of Investigation (DOI)
Most of DOI’s FY23 procurement portfolio was subject to LL 174 participation goals in FY23. Its $1.18 million in LL 174-eligible value represents just 0.01% of the City’s total LL 174-eligible contracting portfolio.
Table 59: FY23 LL 174-Eligible Contracts and POs
| Certification Status | # of Contracts | % Share of Contracts | Total Registered Contract Value | % Share of Contract Value |
| All Contracts and POs | 194 | 100.00% | $1,788,745 | 100.00% |
| M/WBE | 64 | 32.99% | $531,570 | 29.72% |
| Non-Certified | 130 | 67.01% | $1,257,175 | 70.28% |
| LL174 Contracts and POs | 182 | 100.00% | $1,181,180 | 100.00% |
| M/WBE | 64 | 35.16% | $531,570 | 45.00% |
| Non-Certified | 118 | 64.84% | $649,610 | 55.00% |
| LL174 Subcontracts | 0 | 0.00% | $0 | 0.00% |
| M/WBE | 0 | 0.00% | $0 | 0.00% |
| Non-Certified | 0 | 0.00% | $0 | 0.00% |
Chart 59: FY23 Value of LL 174-Eligible Prime Contracts and POs
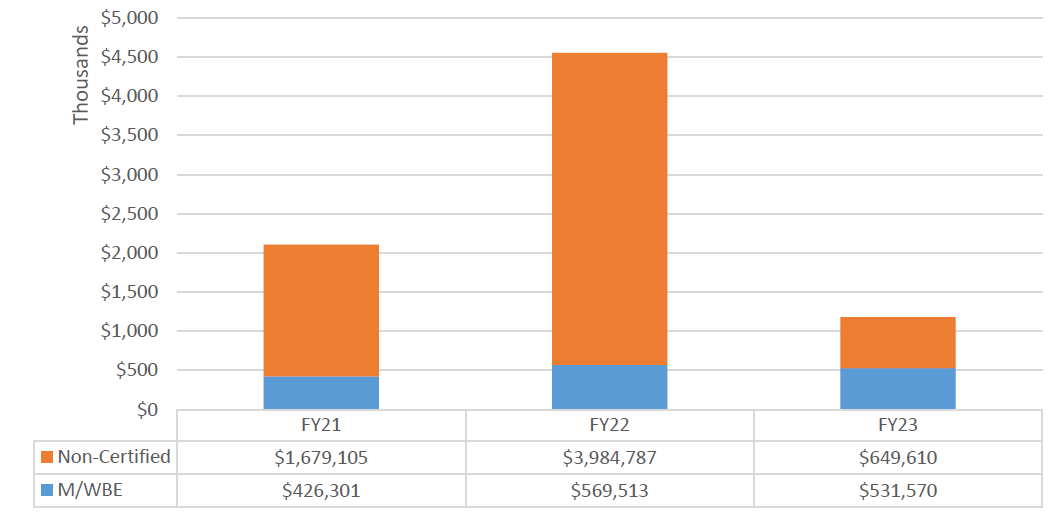
Chart 60: FY23 Value of LL 174-Eligible Contracts and POs, by Race and Gender
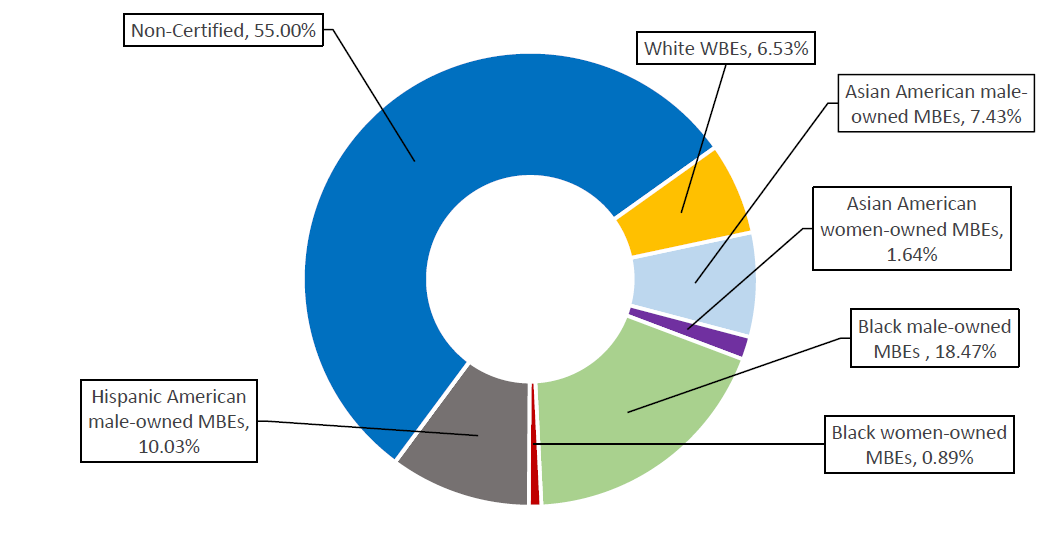
Chart 61: FY23 Share of LL 174-Eligible Contracts and PO Value, by M/WBE Category and Industry
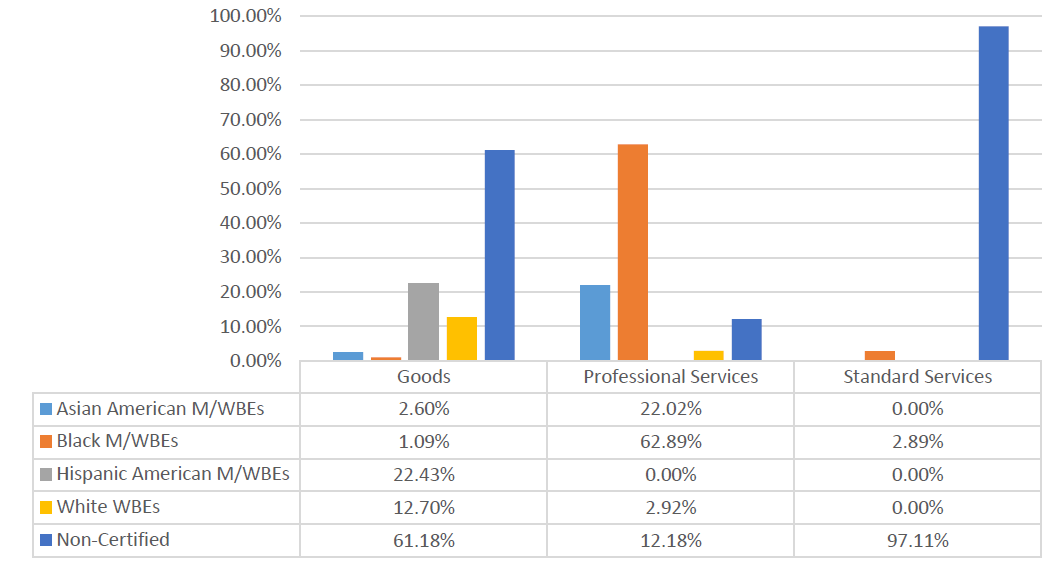
Department of Probation (DOP)
The LL 174 totals below represents a relatively small share of DOP’s total procurement portfolio, as DOP predominantly contracts with vendors for human services, which are exempt from LL 174 participation goals. Its $1.95 million in LL 174-eligible value represents just 0.02% of the City’s total LL 174-eligible contracting portfolio.
Table 60: FY23 LL 174-Eligible Contracts and POs
| Certification Status | # of Contracts | % Share of Contracts | Total Registered Contract Value | % Share of Contract Value |
| All Contracts and POs | 280 | 100.00% | $29,336,978 | 100.00% |
| M/WBE | 69 | 24.64% | $973,971 | 3.32% |
| Non-Certified | 211 | 75.36% | $28,363,008 | 96.68% |
| LL174 Contracts and POs | 189 | 100.00% | $1,959,801 | 100.00% |
| M/WBE | 66 | 34.92% | $870,597 | 44.42% |
| Non-Certified | 123 | 65.08% | $1,089,204 | 55.58% |
| LL174 Subcontracts | 0 | 0.00% | $0 | 0.00% |
| M/WBE | 0 | 0.00% | $0 | 0.00% |
| Non-Certified | 0 | 0.00% | $0 | 0.00% |
Chart 62: FY23 Value of LL 174-Eligible Prime Contracts and POs
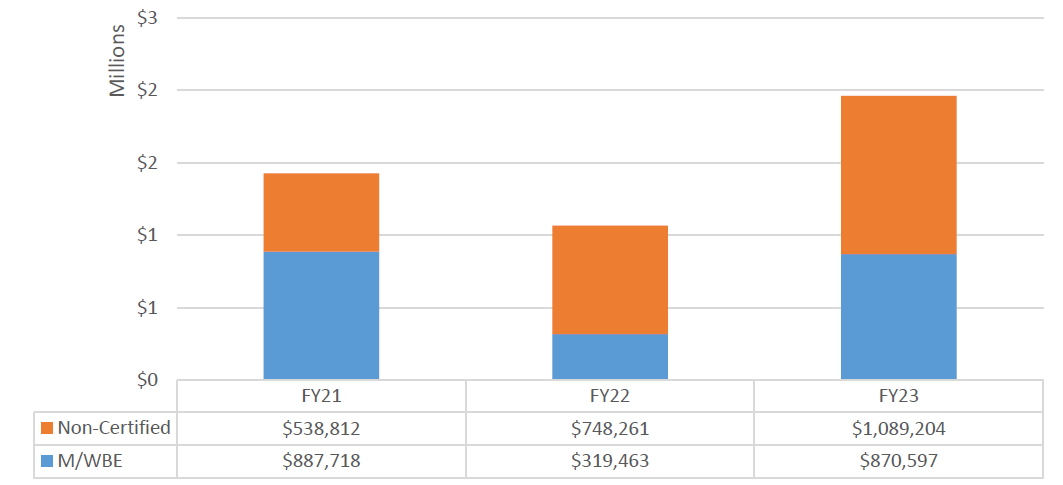
Chart 63: FY23 Value of LL 174-Eligible Contracts and POs, by Race and Gender
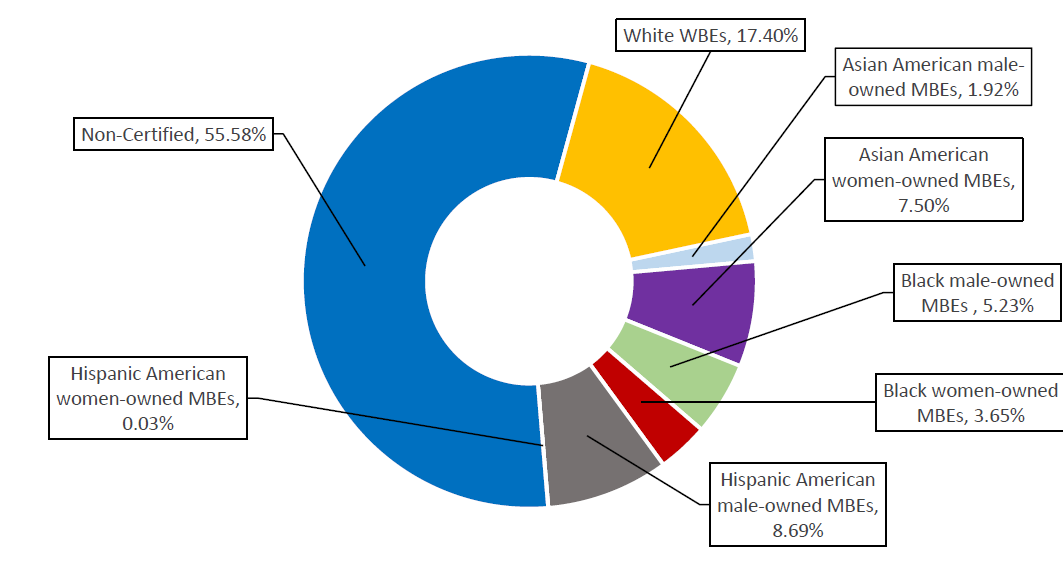
Chart 64: FY23 Share of LL 174-Eligible Contracts and PO Value, by M/WBE Category and Industry
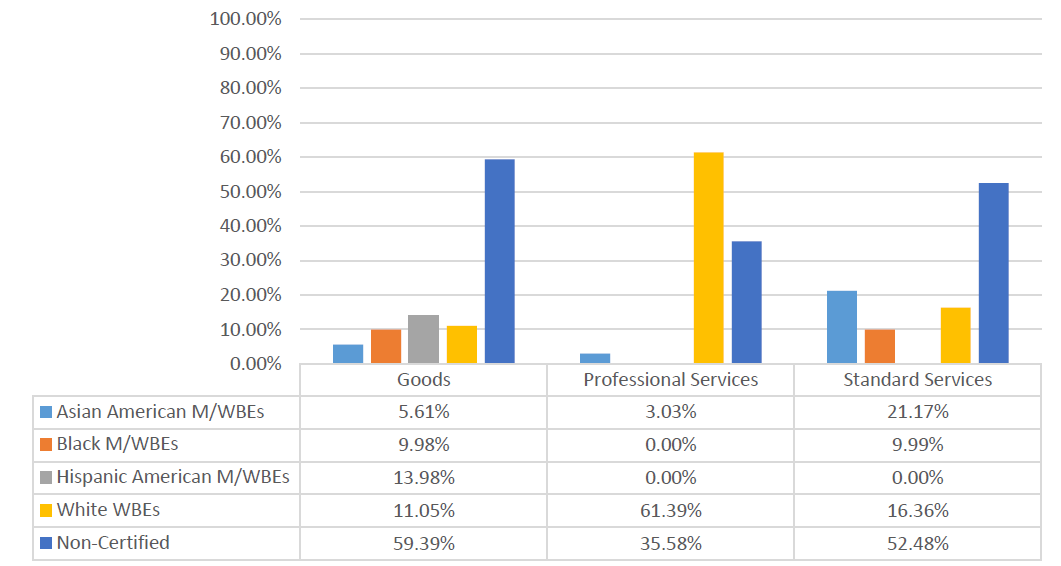
Department of Records and Information Services (DORIS)
Most of DORIS’ procurement portfolio was subject to LL 174 participation goals in FY23. However, DORIS registered a valuable Renewal contract and another valuable Sole Source contract, which together accounted for most of its excluded value. DORIS’ $433,583 in LL 174-eligible value represents under 0.01% of the City’s total LL 174-eligible contracting portfolio.
Table 61: FY23 LL 174-Eligible Contracts and POs
| Certification Status | # of Contracts | % Share of Contracts | Total Registered Contract Value | % Share of Contract Value |
| All Contracts and POs | 92 | 100.00% | $777,812 | 100.00% |
| M/WBE | 19 | 20.65% | $283,780 | 36.48% |
| Non-Certified | 73 | 79.35% | $494,033 | 63.52% |
| LL174 Contracts and POs | 85 | 100.00% | $433,583 | 100.00% |
| M/WBE | 18 | 21.18% | $132,720 | 30.61% |
| Non-Certified | 67 | 78.82% | $300,864 | 69.39% |
| LL174 Subcontracts | 0 | 0.00% | $0 | 0.00% |
| M/WBE | 0 | 0.00% | $0 | 0.00% |
| Non-Certified | 0 | 0.00% | $0 | 0.00% |
Chart 65: FY23 Value of LL 174-Eligible Prime Contracts and POs
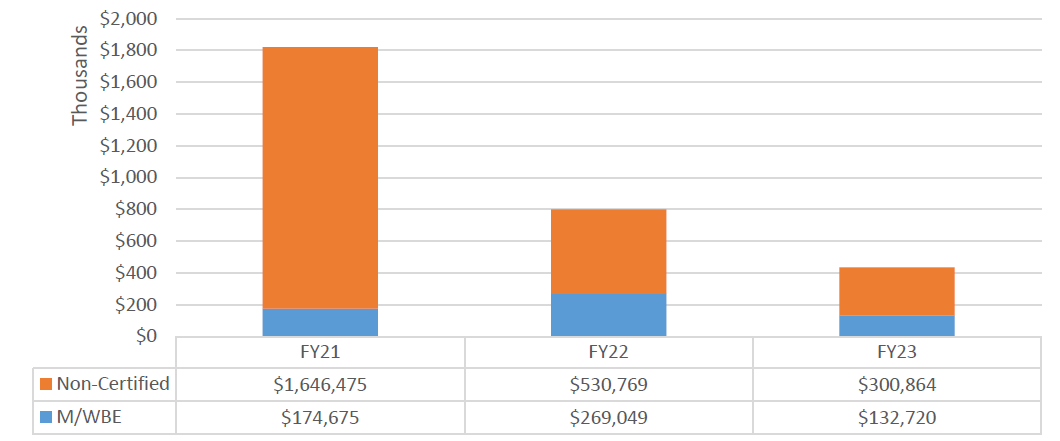
Chart 66: FY23 Value of LL 174-Eligible Contracts and POs, by Race and Gender
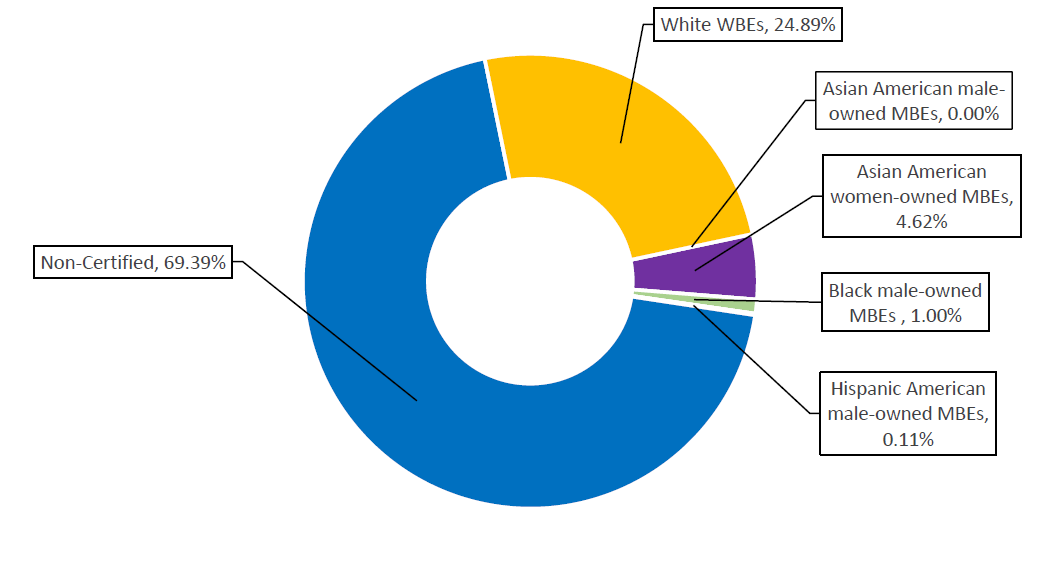
Chart 67: FY23 Share of LL 174-Eligible Contracts and PO Value, by M/WBE Category and Industry
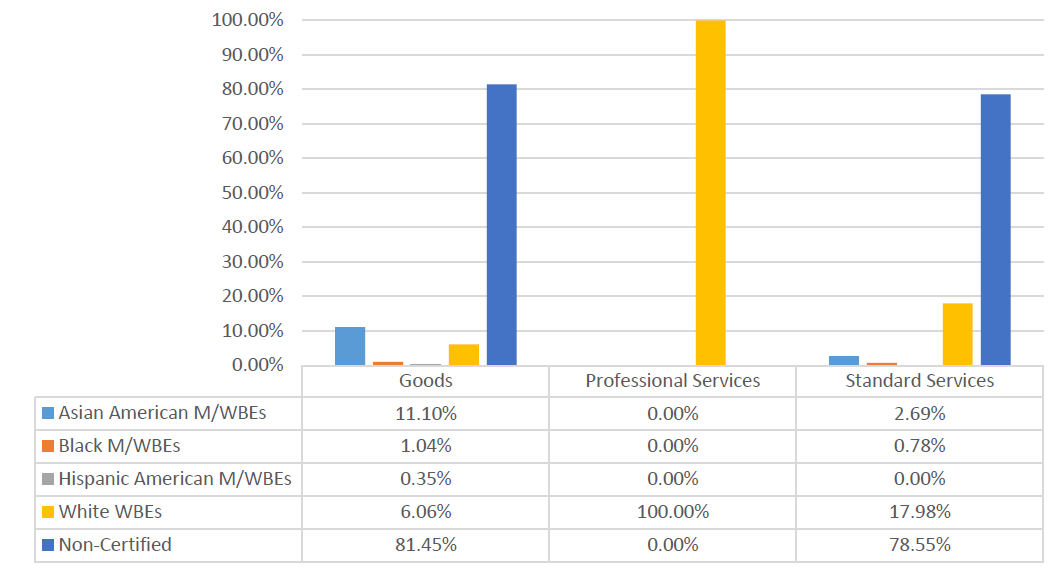
Department of Transportation (DOT)
While the majority of DOT’s FY23 contract portfolio is subject to LL 174 participation goals, many of DOT’s contracts are funded, at least in part, by non-City sources, which would not actually be covered under the local law.[60] Its $918 million in LL 174-eligible value accounts for nearly 10% of the City’s total LL 174-eligible contracting portfolio.
Table 62: LL 174-Eligible Contracts and POs – FY23
| Certification Status | # of Contracts | % Share of Contracts | Total Registered Contract Value | % Share of Contract Value |
| All Contracts and POs | 818 | 100.00% | $1,031,629,789 | 100.00% |
| M/WBE | 375 | 45.84% | $80,890,489 | 7.84% |
| Non-Certified | 443 | 54.16% | $950,739,300 | 92.16% |
| LL174 Contracts and POs | 662 | 100.00% | $918,496,696 | 100.00% |
| M/WBE | 367 | 55.44% | $62,930,498 | 6.85% |
| Non-Certified | 295 | 44.56% | $855,566,198 | 93.15% |
| LL174 Subcontracts | 151 | 100.00% | $108,299,389 | 100.00% |
| M/WBE | 117 | 77.48% | $104,202,672 | 96.22% |
| Non-Certified | 34 | 22.52% | $4,096,717 | 3.78% |
Chart 68: FY23 Value of LL 174-Eligible Prime Contracts and POs
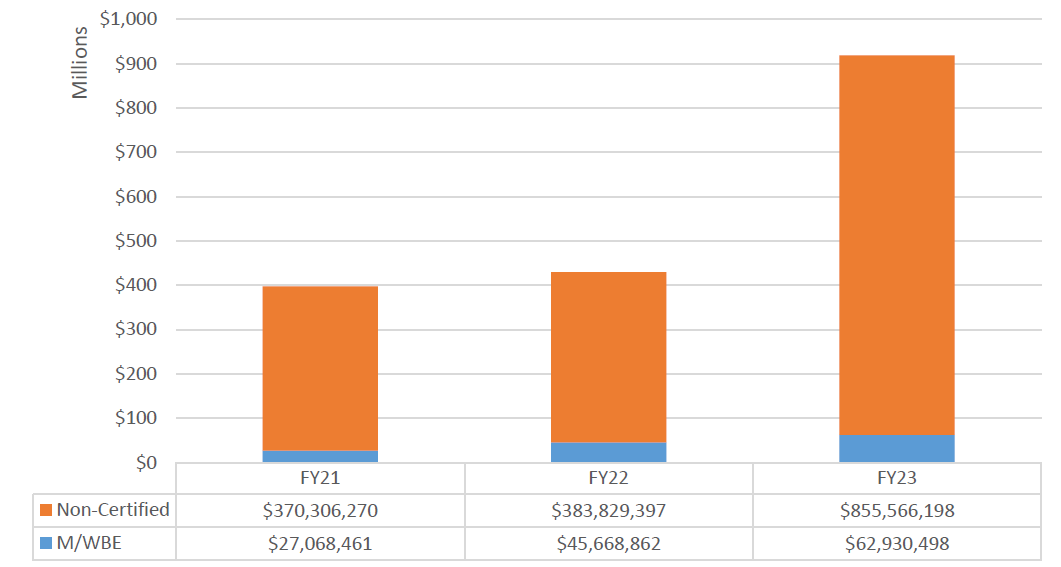
Chart 69: FY23 Value of LL 174-Eligible Contracts and POs, by Race and Gender
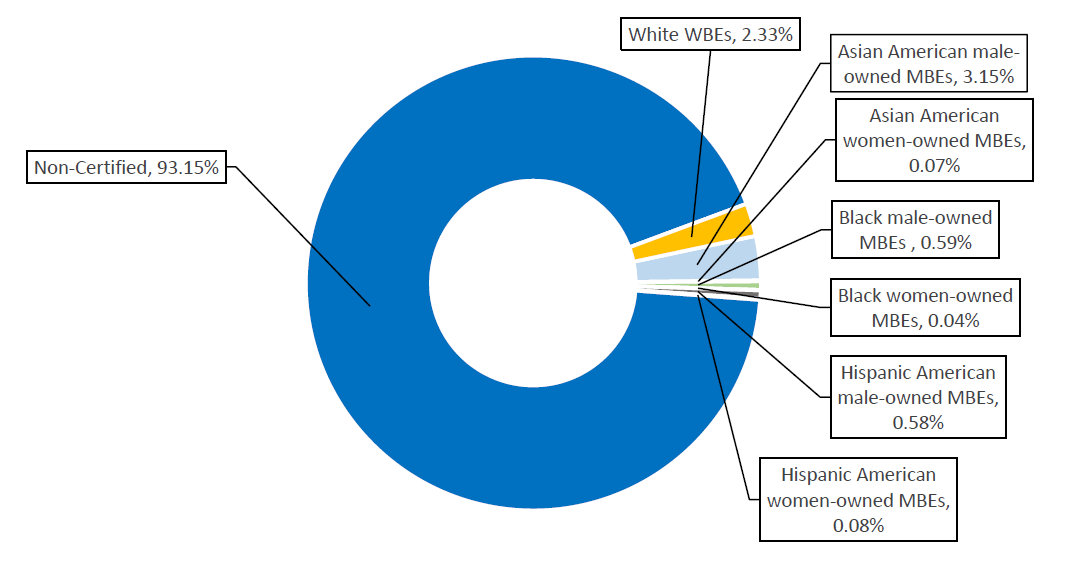
Chart 70: FY23 Share of LL 174-Eligible Contracts and PO Value, by M/WBE Category and Industry
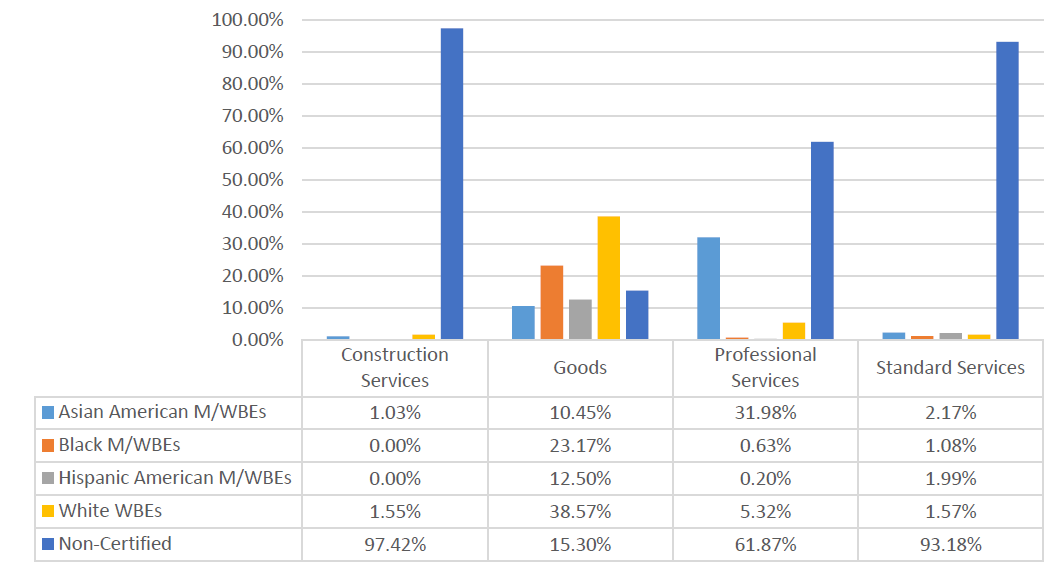
Department of Parks and Recreation (DPR)
Most of DPR’s contract portfolio was subject to LL 174 participation goals in FY23. Its $626.9 million in LL 174-eligible value represents over 6.6% of the City’s total LL 174-eligible contracting portfolio.
Table 63: FY23 LL 174-Eligible Contracts and POs
| Certification Status | # of Contracts | % Share of Contracts | Total Registered Contract Value | % Share of Contract Value |
| All Contracts and POs | 1,946 | 100.00% | $737,438,079 | 100.00% |
| M/WBE | 730 | 37.51% | $178,473,760 | 24.20% |
| Non-Certified | 1,216 | 62.49% | $558,964,319 | 75.80% |
| LL174 Contracts and POs | 1,809 | 100.00% | $626,905,660 | 100.00% |
| M/WBE | 726 | 40.13% | $171,774,176 | 27.40% |
| Non-Certified | 1,083 | 59.87% | $455,131,484 | 72.60% |
| LL174 Subcontracts | 582 | 100.00% | $111,641,604 | 100.00% |
| M/WBE | 306 | 52.58% | $45,256,241 | 40.54% |
| Non-Certified | 276 | 47.42% | $66,385,363 | 59.46% |
Chart 71: FY23 Value of LL 174-Eligible Prime Contracts and POs
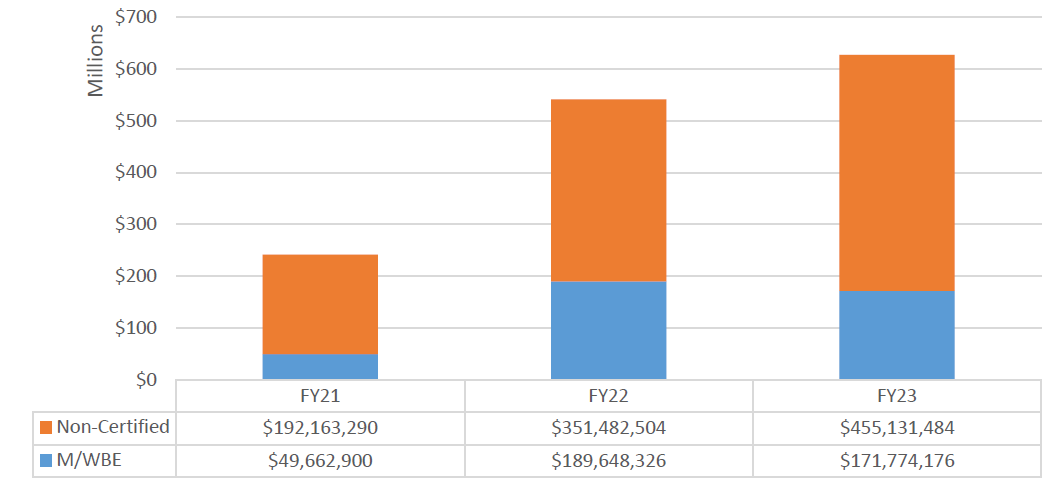
Chart 72: FY23 Value of LL 174-Eligible Contracts and POs, by Race and Gender
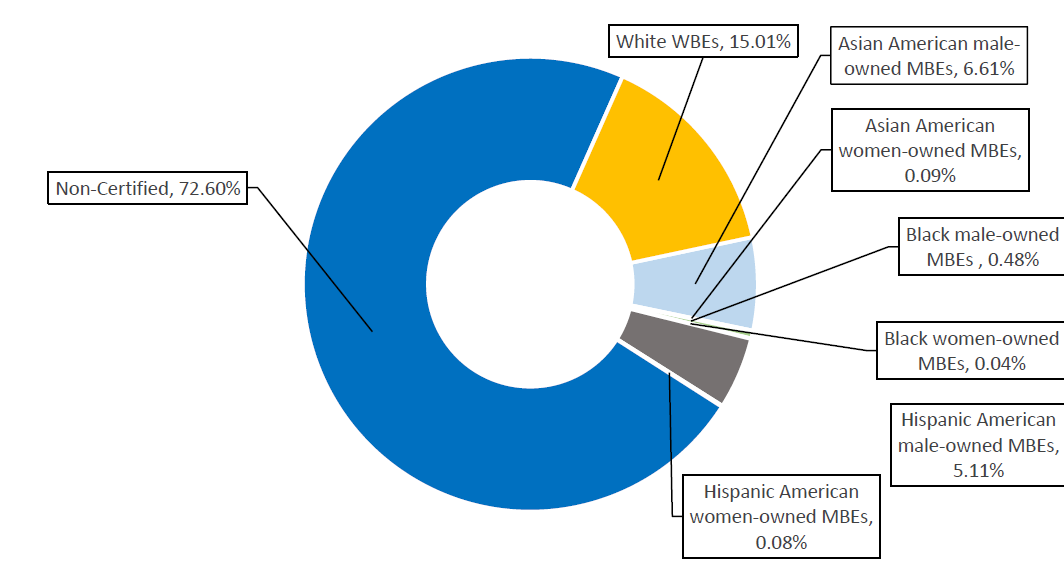
Chart 73: FY23 Share of LL 174-Eligible Contracts and PO Value, by M/WBE Category and Industry
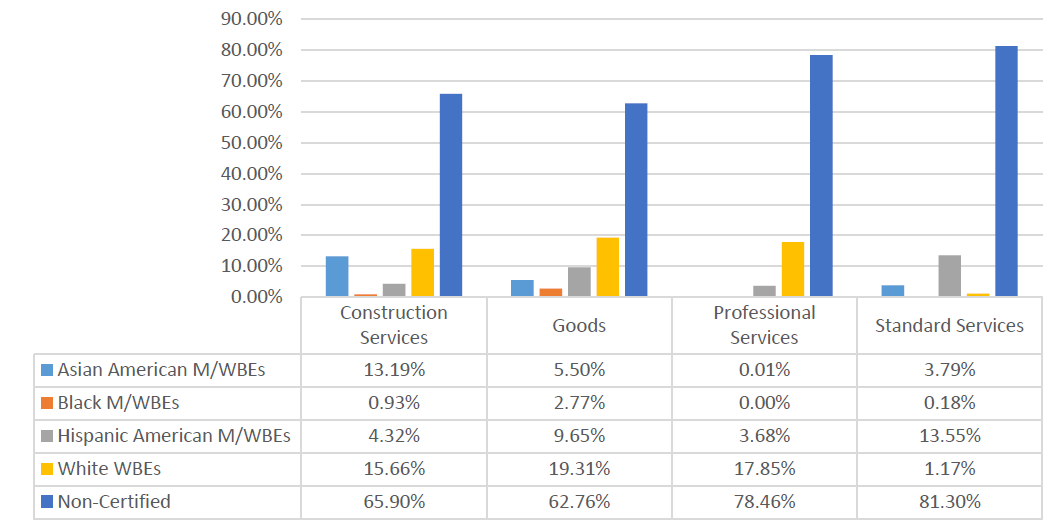
Department of Sanitation (DSNY)
Most of DSNY’s procurement portfolio was subject to LL 174 participation goals. The LL 174 value below does not include large Renewals, which were excluded from this analysis. Its $152.64 million in LL 174-eligible value accounts for about 2% of the City’s total LL 174-eligible procurement portfolio.
Table 64: FY23 LL 174-Eligible Contracts and POs
| Certification Status | # of Contracts | % Share of Contracts | Total Registered Contract Value | % Share of Contract Value |
| All Contracts and POs | 960 | 100.00% | $238,615,680 | 100.00% |
| M/WBE | 347 | 36.15% | $39,744,535 | 16.66% |
| Non-Certified | 613 | 63.85% | $198,871,145 | 83.34% |
| LL174 Contracts and POs | 881 | 100.00% | $152,646,981 | 100.00% |
| M/WBE | 333 | 37.80% | $36,363,192 | 23.82% |
| Non-Certified | 548 | 62.20% | $116,283,789 | 76.18% |
| LL174 Subcontracts | 14 | 100.00% | $6,045,425 | 100.00% |
| M/WBE | 5 | 35.71% | $2,425,000 | 40.11% |
| Non-Certified | 9 | 64.29% | $3,620,425 | 59.89% |
Chart 74: FY23 Value of LL 174-Eligible Prime Contracts and POs
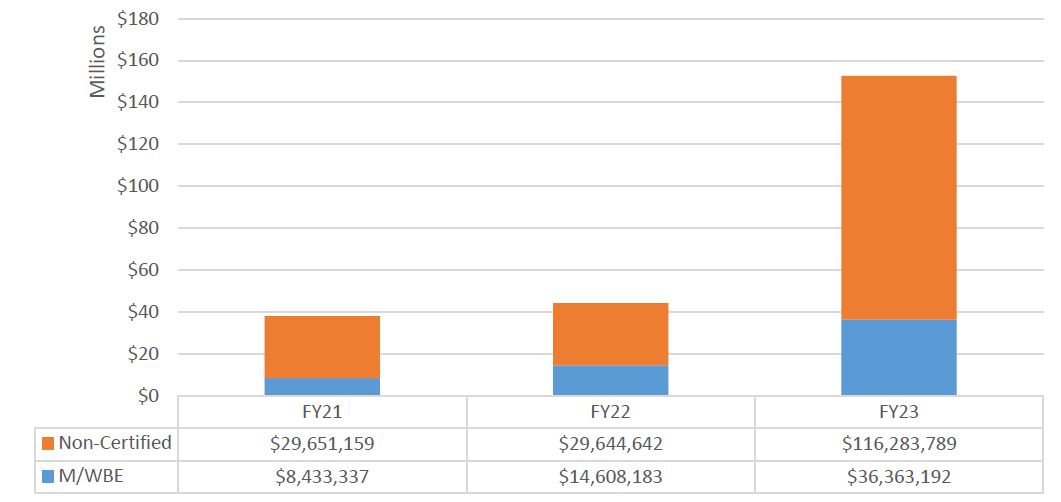
Chart 75: FY23 Value of LL 174-Eligible Contracts and POs, by Race and Gender
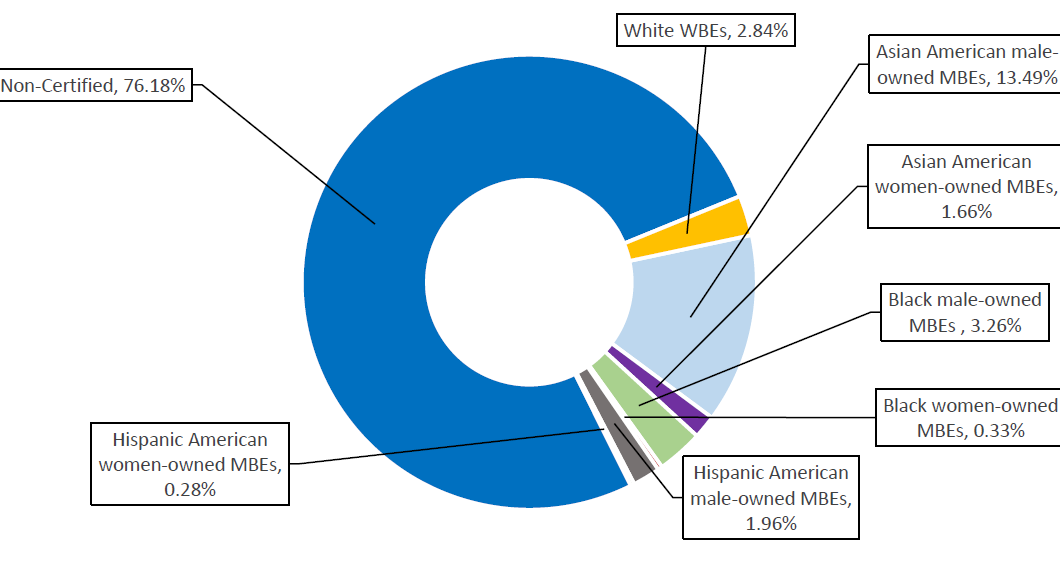
Chart 76: FY23 Share of LL 174-Eligible Contracts and PO Value, by M/WBE Category and Industry
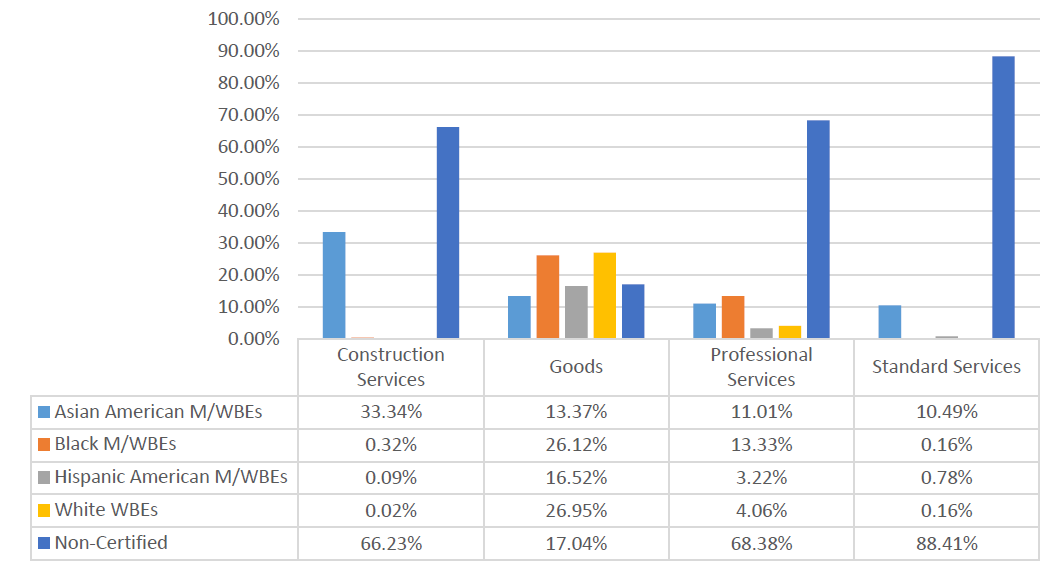
Department of Homeless Services (DSS/DHS)
The LL 174 totals below represents a relatively small share of DHS’ total procurement portfolio, as DHS predominantly contracts with vendors for human services, which are exempt from LL 174 participation goals. Its $26.63 million in LL 174-eligible value accounts for less than 0.5% of the City’s total LL 174-eligible portfolio.
Table 65: FY23 LL 174-Eligible Contracts and POs
| Certification Status | # of Contracts | % Share of Contracts | Total Registered Contract Value | % Share of Contract Value |
| All Contracts and POs | 296 | 100.00% | $7,132,536,949 | 100.00% |
| M/WBE | 58 | 19.59% | $22,898,774 | 0.32% |
| Non-Certified | 238 | 80.41% | $7,109,638,175 | 99.68% |
| LL174 Contracts and POs | 81 | 100.00% | $26,635,612 | 100.00% |
| M/WBE | 44 | 54.32% | $11,238,680 | 42.19% |
| Non-Certified | 37 | 45.68% | $15,396,932 | 57.81% |
| LL174 Subcontracts | 5 | 100.00% | $255,000 | 100.00% |
| M/WBE | 3 | 60.00% | $175,000 | 68.63% |
| Non-Certified | 2 | 40.00% | $80,000 | 31.37% |
Chart 77: FY23 Value of LL 174-Eligible Prime Contracts and POs
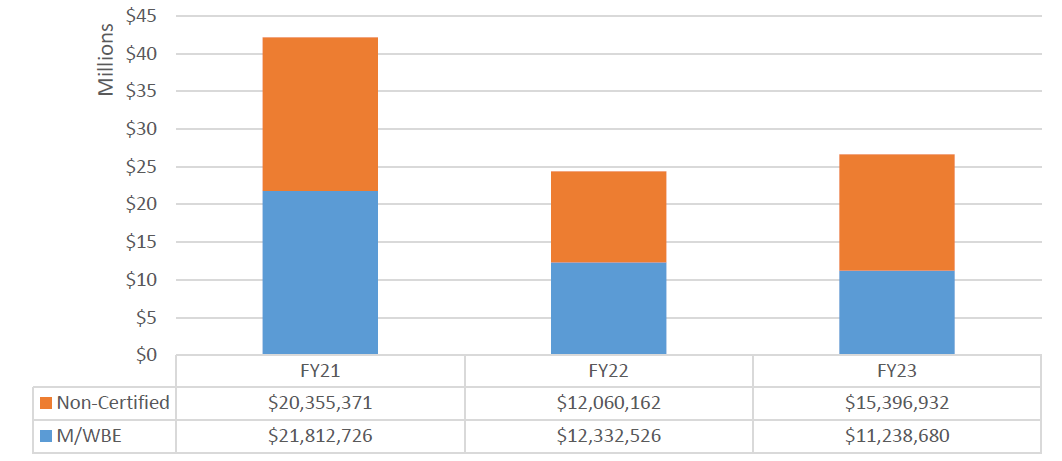
Chart 78: FY23 Value of LL 174-Eligible Contracts and POs, by Race and Gender
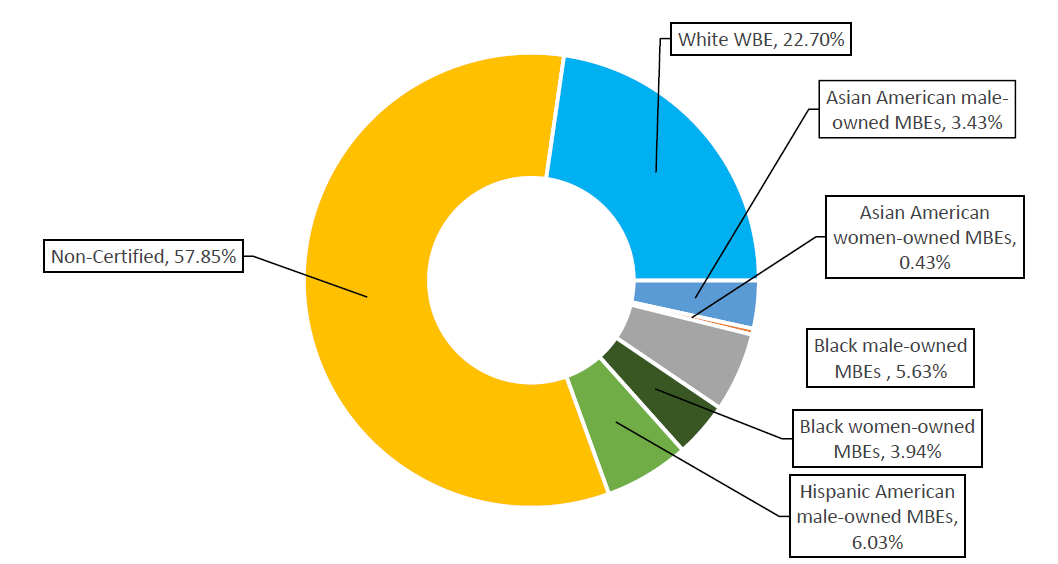
Chart 79: FY23 Share of LL 174-Eligible Contracts and PO Value, by M/WBE Category and Industry
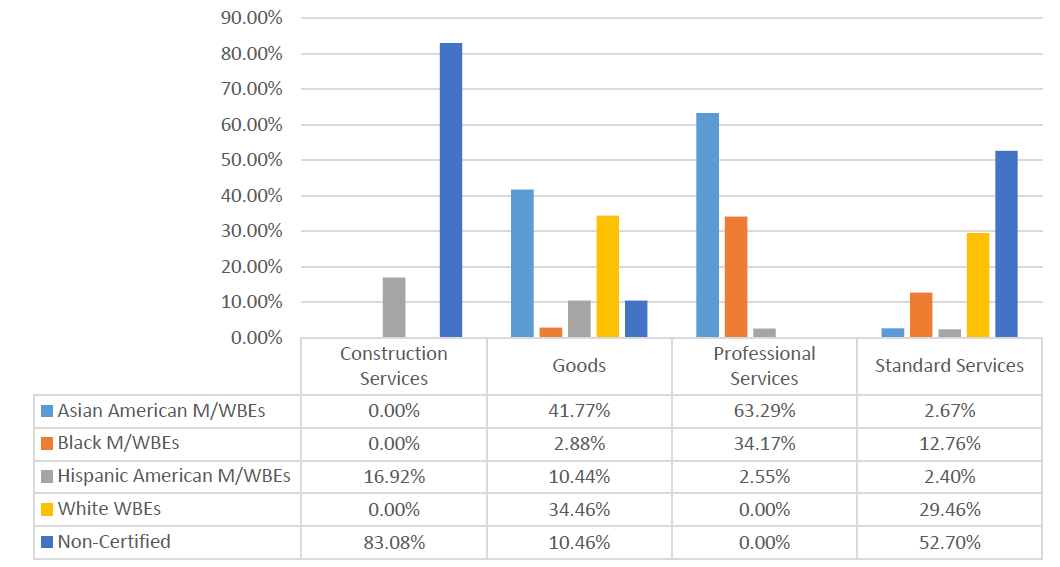
Human Resources Administration (DSS/HRA)
The LL 174 totals below represent a relatively small share of HRA’s total procurement portfolio, as HRA predominantly contracts with vendors for human services, which are exempt from LL 174 participation goals. Its $17.74 million in LL 174-eligible value accounts for less than 0.5% of the City’s total LL 174-eligible contracting portfolio.
Table 66: FY23 LL 174-Eligible Contracts and POs
| Certification Status | # of Contracts | % Share of Contracts | Total Registered Contract Value | % Share of Contract Value |
| All Contracts and POs | 827 | 100.00% | $1,069,888,735 | 100.00% |
| M/WBE | 331 | 40.02% | $86,999,064 | 8.13% |
| Non-Certified | 496 | 59.98% | $982,889,671 | 91.87% |
| LL174 Contracts and POs | 383 | 100.00% | $17,748,300 | 100.00% |
| M/WBE | 268 | 69.97% | $6,382,432 | 35.96% |
| Non-Certified | 115 | 30.03% | $11,365,868 | 64.04% |
| LL174 Subcontracts | 0 | 0.00% | $0 | 0.00% |
| M/WBE | 0 | 0.00% | $0 | 0.00% |
| Non-Certified | 0 | 0.00% | $0 | 0.00% |
Chart 80: FY23 Value of LL 174-Eligible Prime Contracts and POs
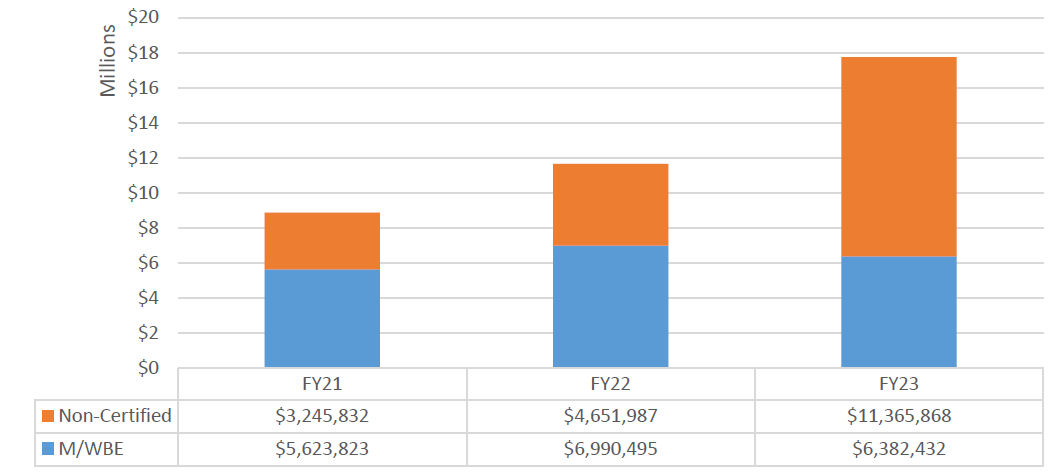
Chart 81: FY23 Value of LL 174-Eligible Contracts and POs, by Race and Gender
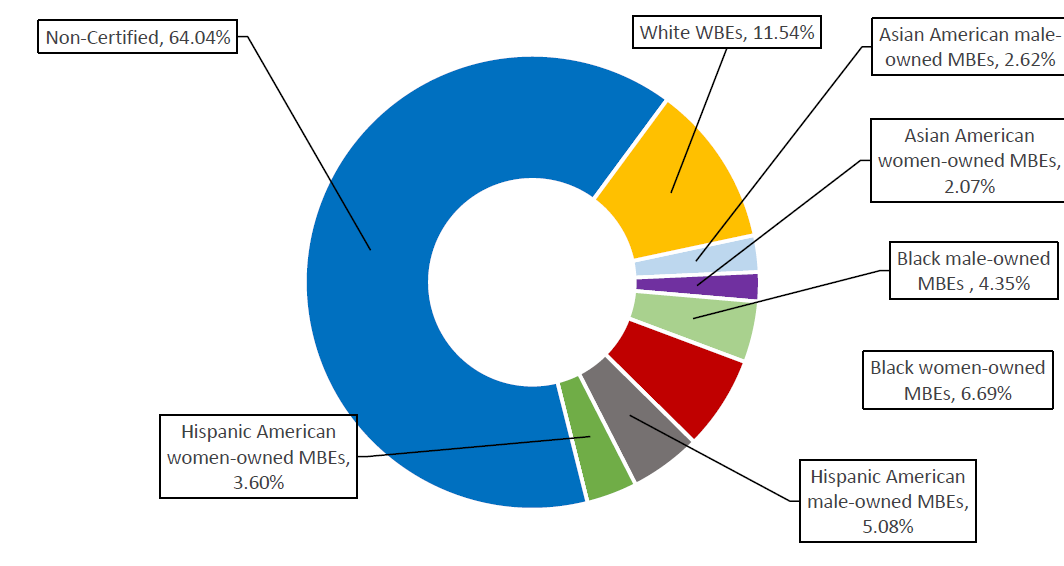
Chart 82: FY23 Share of LL 174-Eligible Contracts and PO Value, by M/WBE Category and Industry
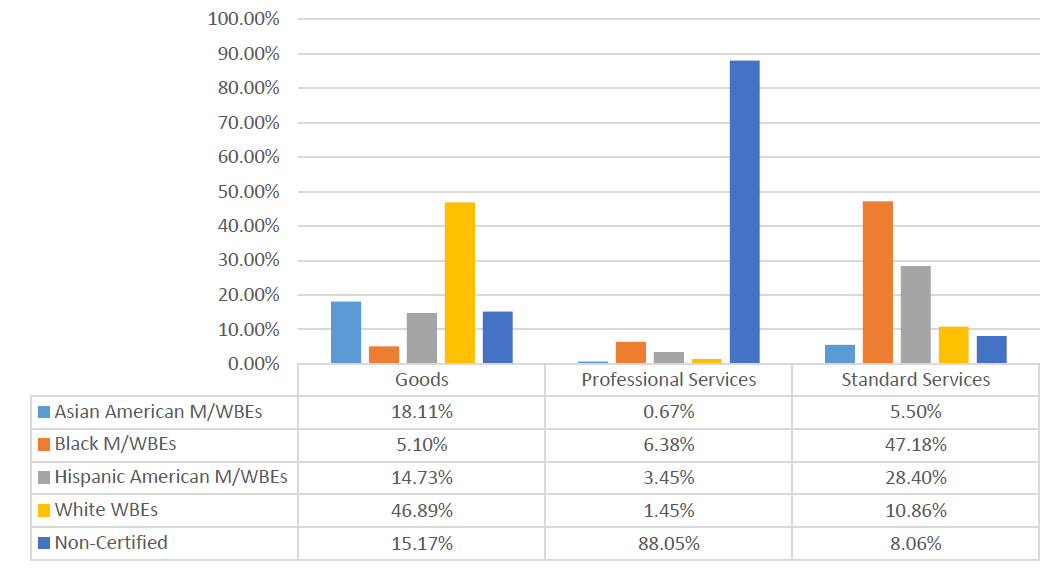
Department of Youth and Community Development (DYCD)
The LL 174 totals below represent a small portion of DYCD’s total procurement portfolio, as DYCD predominantly contracts with vendors for human services, which are exempt from LL 174 participation goals. Its $3 million in LL 174-eligible value reflects less than 0.1% of the City’s total LL 174- eligible contracting portfolio.
Table 67: FY23 LL 174-Eligible Contracts and POs
| Certification Status | # of Contracts | % Share of Contracts | Total Registered Contract Value | % Share of Contract Value |
| All Contracts and POs | 1,837 | 100.00% | $438,349,580 | 100.00% |
| M/WBE | 163 | 8.87% | $56,421,235 | 12.87% |
| Non-Certified | 1,674 | 91.13% | $381,928,345 | 87.13% |
| LL174 Contracts and POs | 246 | 100.00% | $3,063,945 | 100.00% |
| M/WBE | 151 | 61.38% | $1,363,065 | 44.49% |
| Non-Certified | 95 | 38.62% | $1,700,880 | 55.51% |
| LL174 Subcontracts | 0 | 0.00% | $0 | 0.00% |
| M/WBE | 0 | 0.00% | $0 | 0.00% |
| Non-Certified | 0 | 0.00% | $0 | 0.00% |
Chart 83: FY23 Value of LL 174-Eligible Prime Contracts and POs
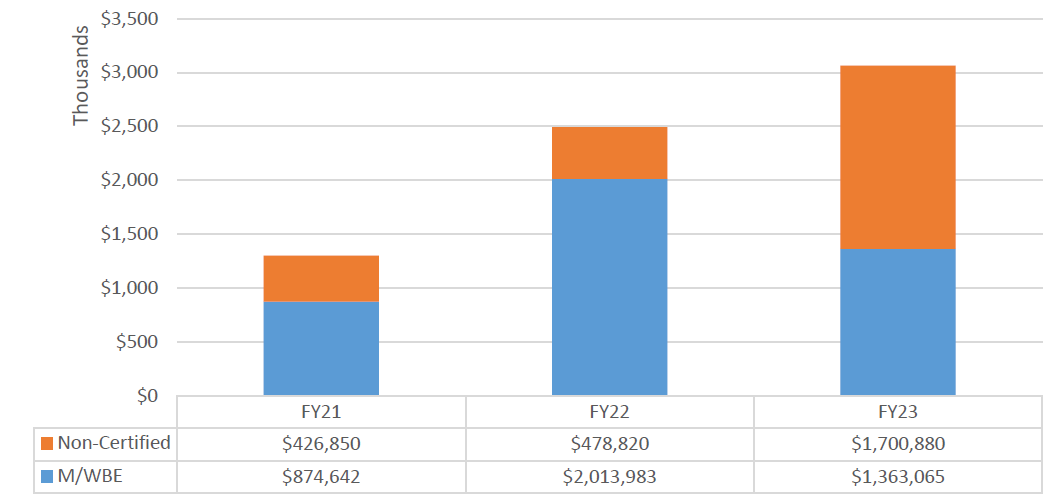
Chart 84: FY23 Value of LL 174-Eligible Contracts and POs, by Race and Gender
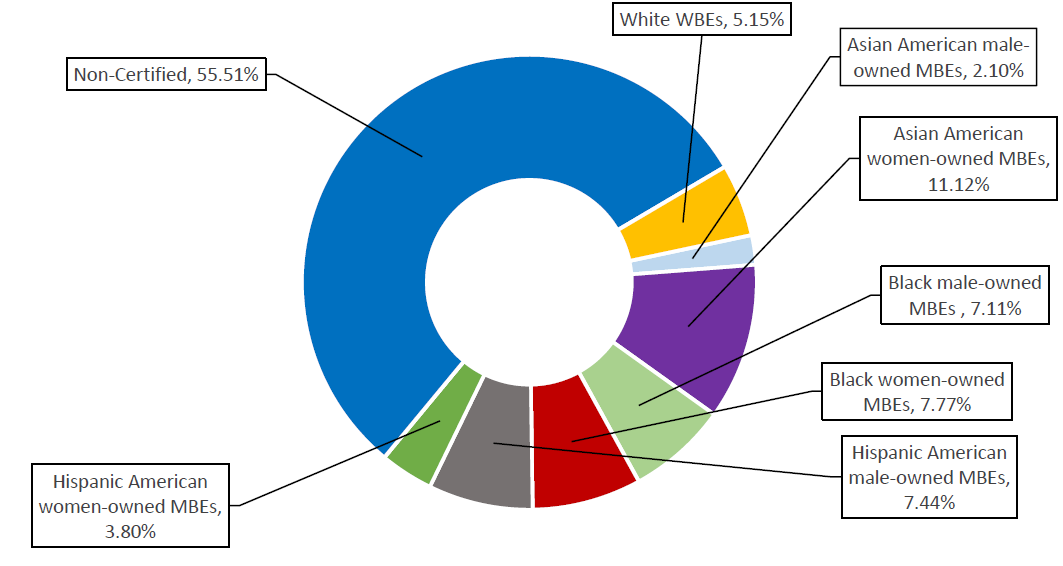
Chart 85: FY23 Share of LL 174-Eligible Contracts and PO Value, by M/WBE Category and Industry
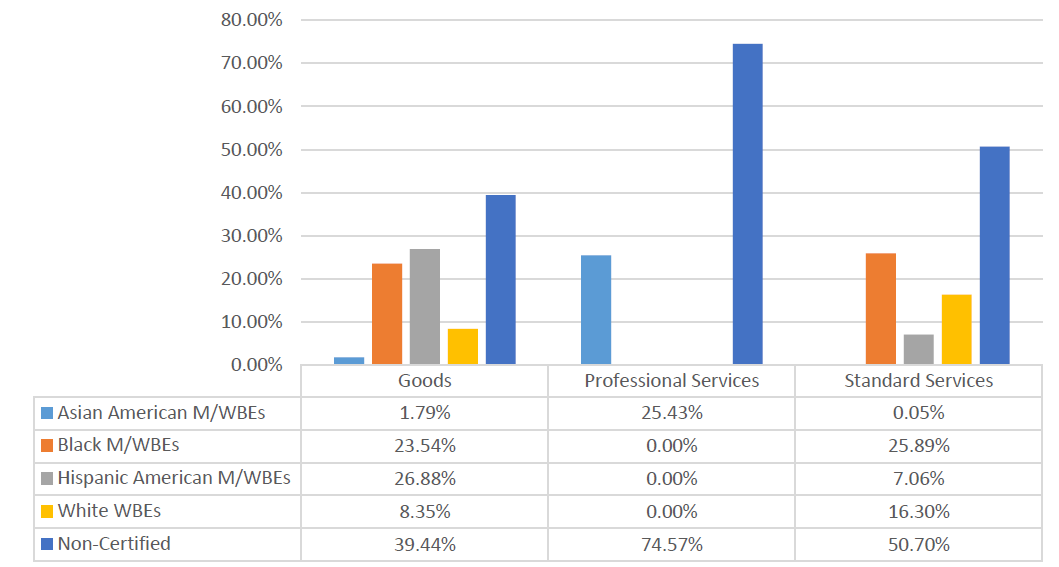
New York City Fire Department (FDNY)
The LL 174 data below excludes nearly half of FDNY’s FY23 procurement portfolio. A large share was for contracts procured via Government Mandate or Sole Source, which are exempt from LL 174 participation goals. FDNY also procured valuable Renewals, which are excluded from this analysis. FDNY’s $80.5 million in LL 174-eligible contracts represents less than 1% of the City’s overall LL 174-eligible contracting portfolio.
Table 68: FY23 LL 174-Eligible Contracts and POs
| Certification Status | # of Contracts | % Share of Contracts | Total Registered Contract Value | % Share of Contract Value |
| All Contracts and POs | 280 | 100.00% | $156,885,354 | 100.00% |
| M/WBE | 91 | 32.50% | $7,165,750 | 4.57% |
| Non-Certified | 189 | 67.50% | $149,719,605 | 95.43% |
| LL174 Contracts and POs | 190 | 100.00% | $80,570,571 | 100.00% |
| M/WBE | 87 | 45.79% | $6,097,910 | 7.57% |
| Non-Certified | 103 | 54.21% | $74,472,660 | 92.43% |
| LL174 Subcontracts | 47 | 100.00% | $25,603,429 | 100.00% |
| M/WBE | 25 | 53.19% | $15,229,784 | 59.48% |
| Non-Certified | 22 | 46.81% | $10,373,645 | 40.52% |
Chart 86: FY23 Value of LL 174-Eligible Prime Contracts and POs
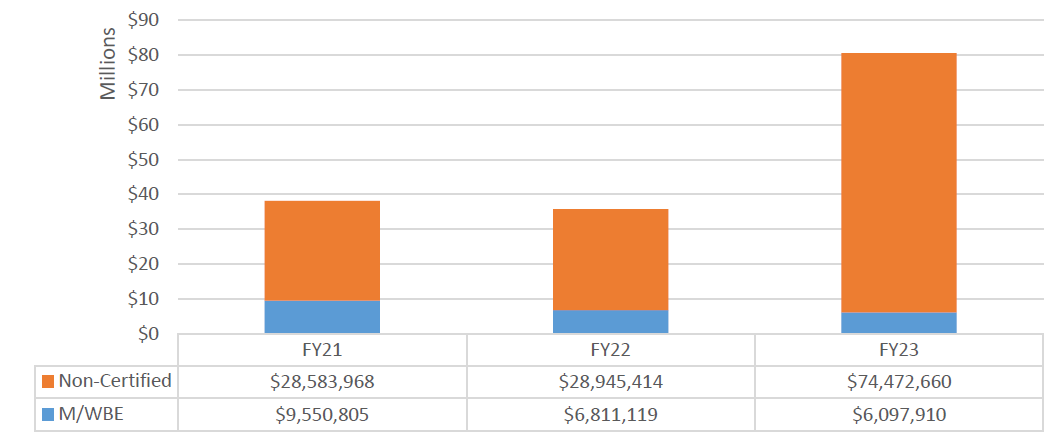
Chart 87: FY23 Value of LL 174-Eligible Contracts and POs, by Race and Gender
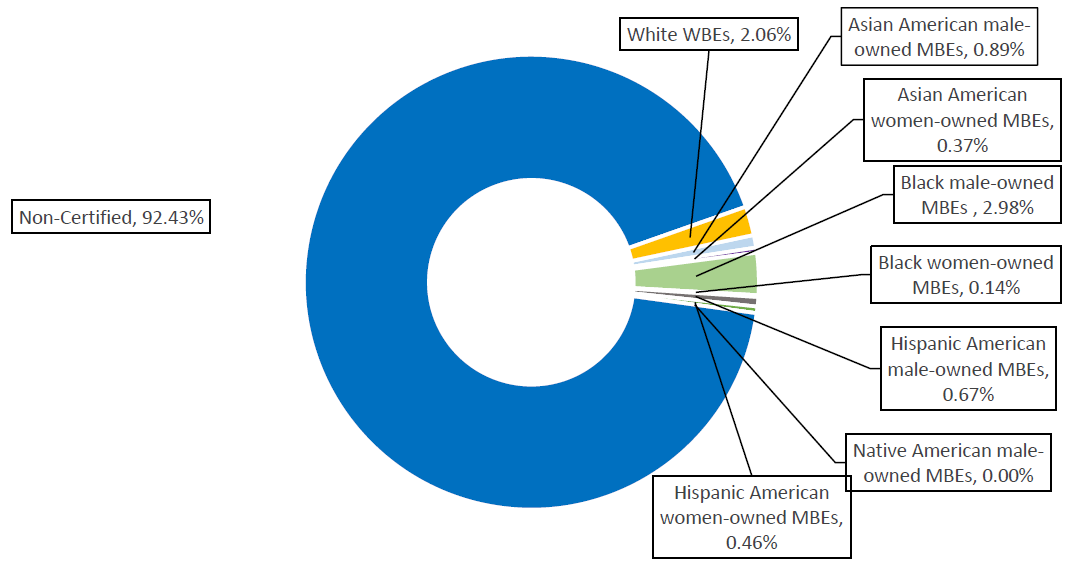
Chart 88: FY23 Share of LL 174-Eligible Contracts and PO Value, by M/WBE Category and Industry
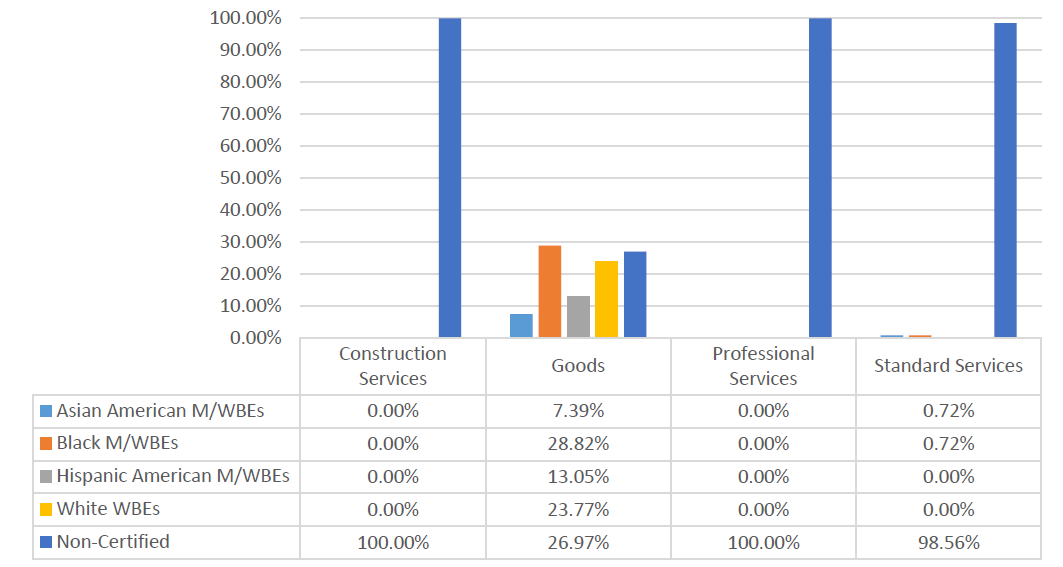
Department of Housing Preservation and Development (HPD)
The LL 174 totals below represent a relatively small share of HPD’s total procurement portfolio, as HPD manages high-value emergency procurements and condemnations which are exempt from LL 174 participation goals. Its $43.22 million in LL 174-eligible value accounts for under 0.5% of the City’s total LL 174-eligible contracting portfolio.
Table 69: FY23 LL 174-Eligible Contracts and POs
| Certification Status | # of Contracts | % Share of Contracts | Total Registered Contract Value | % Share of Contract Value |
| All Contracts and POs | 12,254 | 100.00% | $2,077,969,158 | 100.00% |
| M/WBE | 9,514 | 77.64% | $59,847,945 | 2.88% |
| Non-Certified | 2,740 | 22.36% | $2,018,121,214 | 97.12% |
| LL174 Contracts and POs | 11,883 | 100.00% | $43,224,829 | 100.00% |
| M/WBE | 9,494 | 79.90% | $27,714,059 | 64.12% |
| Non-Certified | 2,389 | 20.10% | $15,510,769 | 35.88% |
| LL174 Subcontracts | 27 | 100.00% | $754,657 | 100.00% |
| M/WBE | 16 | 59.26% | $611,502 | 81.03% |
| Non-Certified | 11 | 40.74% | $143,155 | 18.97% |
Chart 89: FY23 Value of LL 174-Eligible Prime Contracts and POs
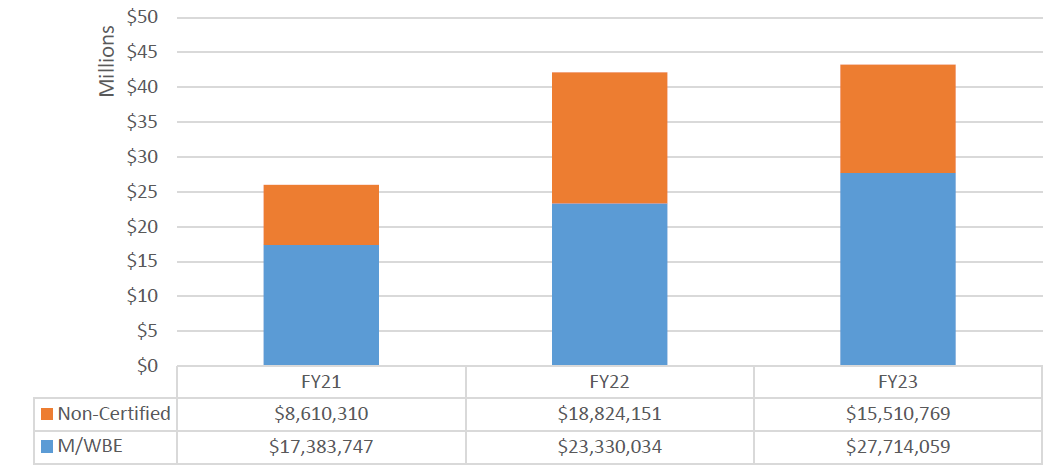
Chart 90: FY23 Value of LL 174-Eligible Contracts and POs, by Race and Gender
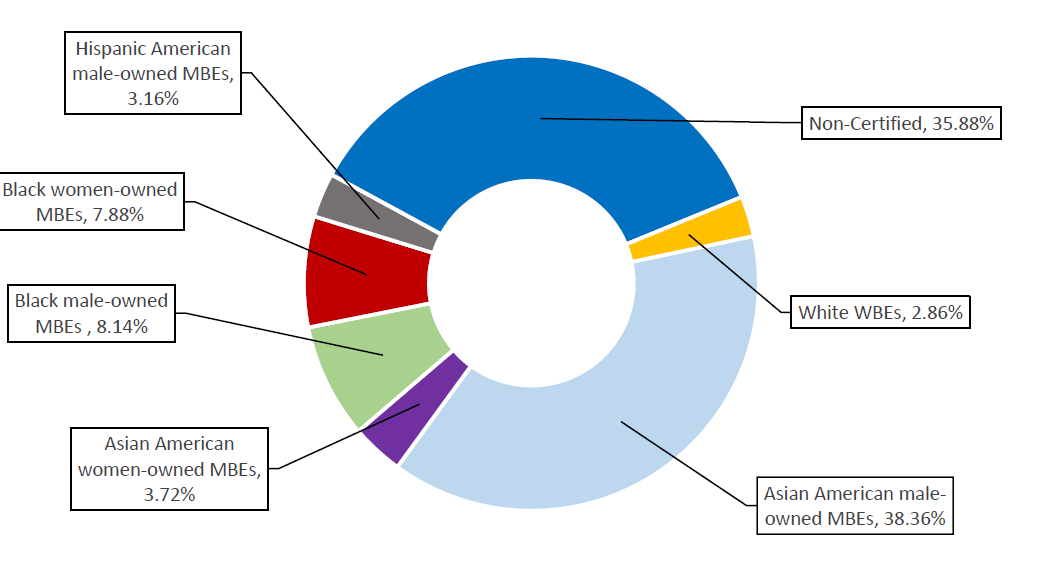
Chart 91: FY23 Share of LL 174-Eligible Contracts and PO Value, by M/WBE Category and Industry
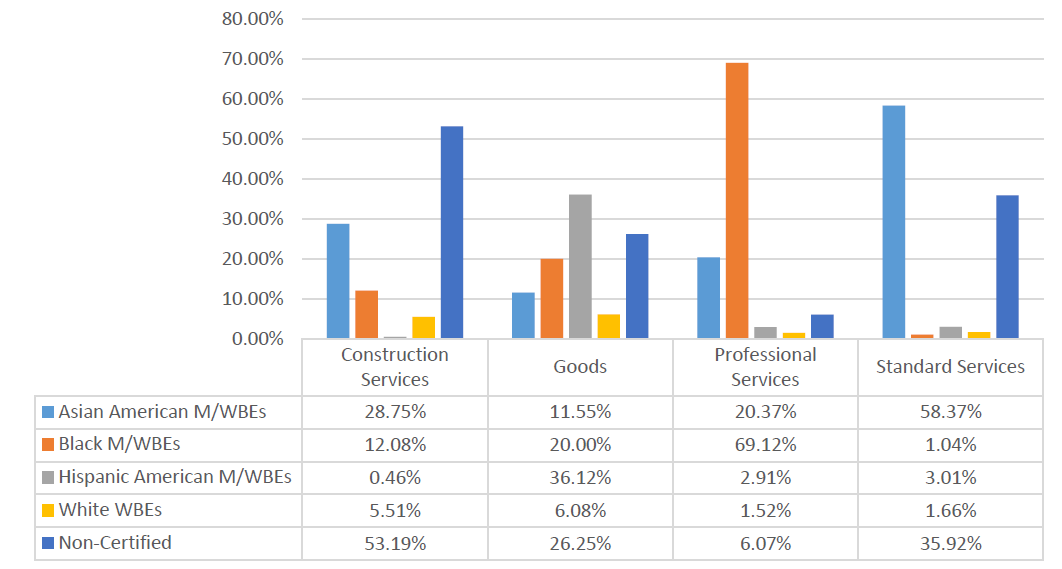
Law Department (LAW)
The majority of the Law Department’s FY23 procurement portfolio was subject to LL 174 participation goals. Its $70.7 million in LL 174-eligible value represents less than 1% of the City’s total LL 174-eligible contracting portfolio.
Table 70: FY23 LL 174-Eligible Contracts and POs
| Certification Status | # of Contracts | % Share of Contracts | Total Registered Contract Value | % Share of Contract Value |
| All Contracts and POs | 925 | 100.00% | $92,072,411 | 100.00% |
| M/WBE | 232 | 25.08% | $14,782,104 | 15.85% |
| Non-Certified | 693 | 74.92% | $78,492,762 | 84.15% |
| LL174 Contracts and POs | 831 | 100.00% | $70,765,154 | 100.00% |
| M/WBE | 230 | 27.68% | $14,349,349 | 20.28% |
| Non-Certified | 601 | 72.32% | $56,415,806 | 79.72% |
| LL174 Subcontracts | 0 | 0.00% | $0 | 0.00% |
| M/WBE | 0 | 0.00% | $0 | 0.00% |
| Non-Certified | 0 | 0.00% | $0 | 0.00% |
Chart 92: FY23 Value of LL 174-Eligible Prime Contracts and POs
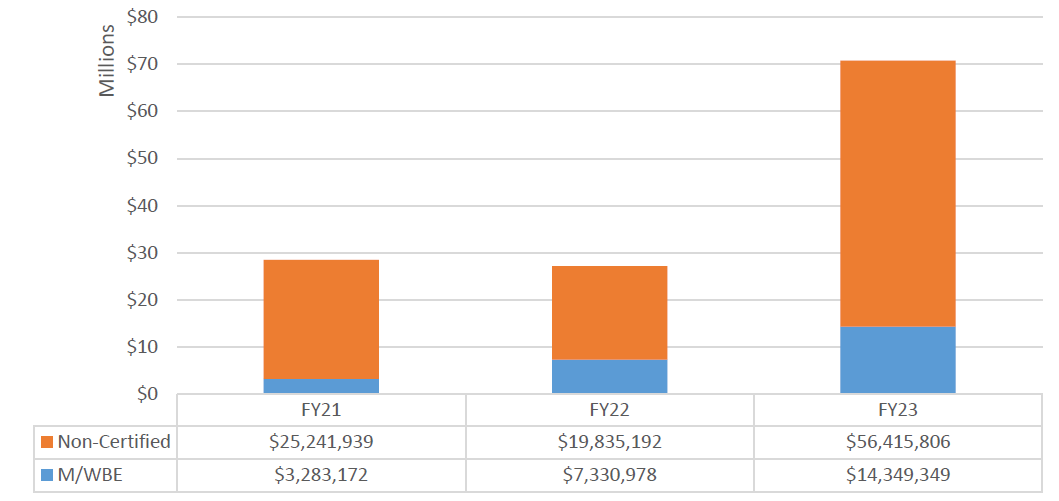
Chart 93: FY23 Value of LL 174-Eligible Contracts and POs, by Race and Gender
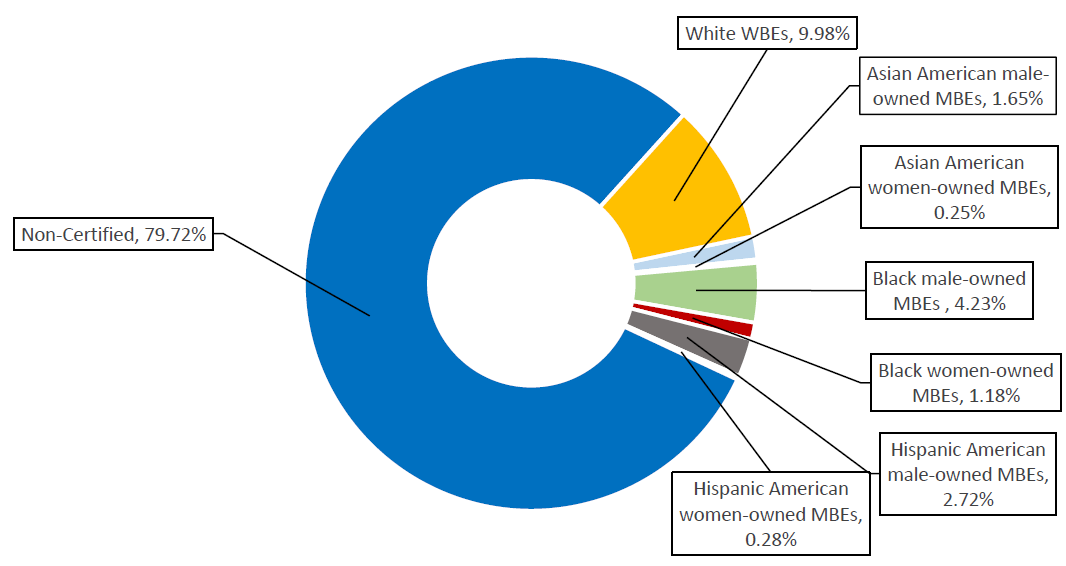
Chart 94: FY23 Share of LL 174-Eligible Contracts and PO Value, by M/WBE Category and Industry
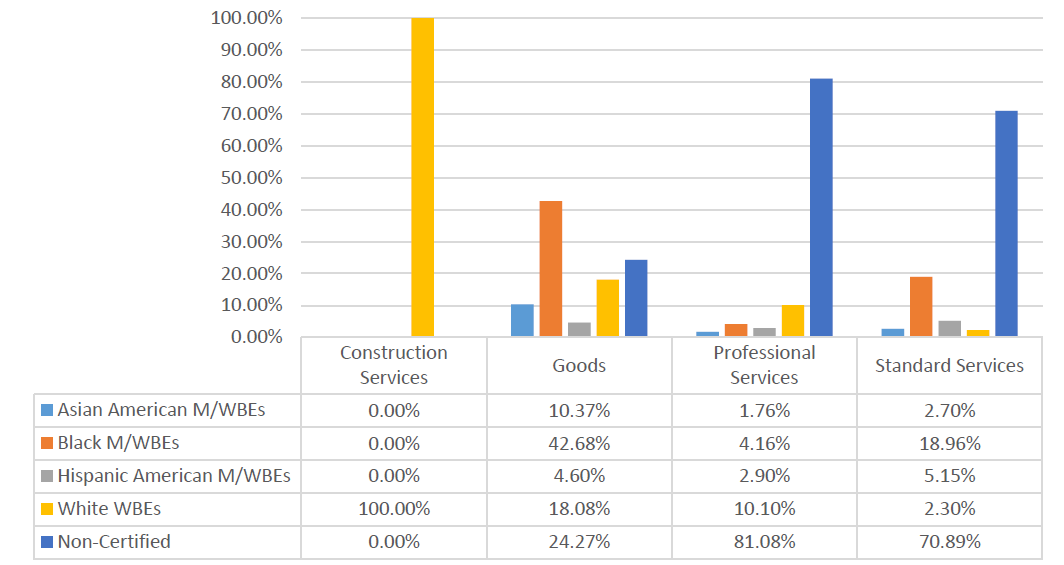
Landmarks Preservation Commission (LPC)
The vast majority of LPC’s FY23 procurement portfolio was subject to LL 174 participation goals. Its $536,000 in LL 174-eligible value represents less than 1% of the City’s total LL 174-eligible contracting portfolio.
Table 71: FY23 LL 174-Eligible Contracts and POs
| Certification Status | # of Contracts | % Share of Contracts | Total Registered Contract Value | % Share of Contract Value |
| All Contracts and POs | 57 | 100.00% | $547,321 | 100.00% |
| M/WBE | 16 | 28.07% | $236,108 | 43.14% |
| Non-Certified | 41 | 71.93% | $311,213 | 56.86% |
| LL174 Contracts and POs | 55 | 100.00% | $536,619 | 100.00% |
| M/WBE | 16 | 29.63% | $236,108 | 44.00% |
| Non-Certified | 38 | 70.37% | $300,511 | 56.00% |
| LL174 Subcontracts | 0 | 0.00% | $0 | 0.00% |
| M/WBE | 0 | 0.00% | $0 | 0.00% |
| Non-Certified | 0 | 0.00% | $0 | 0.00% |
Chart 95: FY23 Value of LL 174-Eligible Prime Contracts and POs
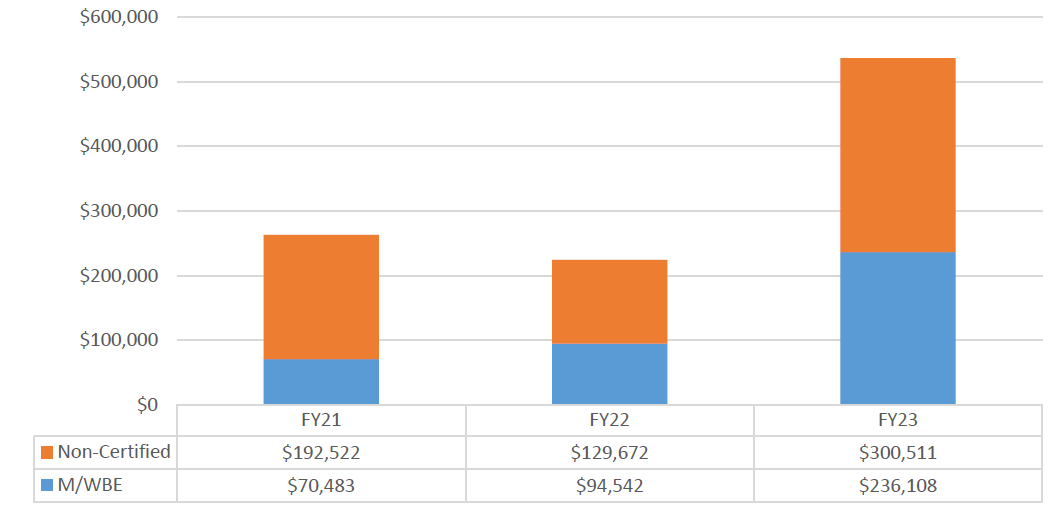
Chart 96: FY23 Value of LL 174-Eligible Contracts and POs, by Race and Gender
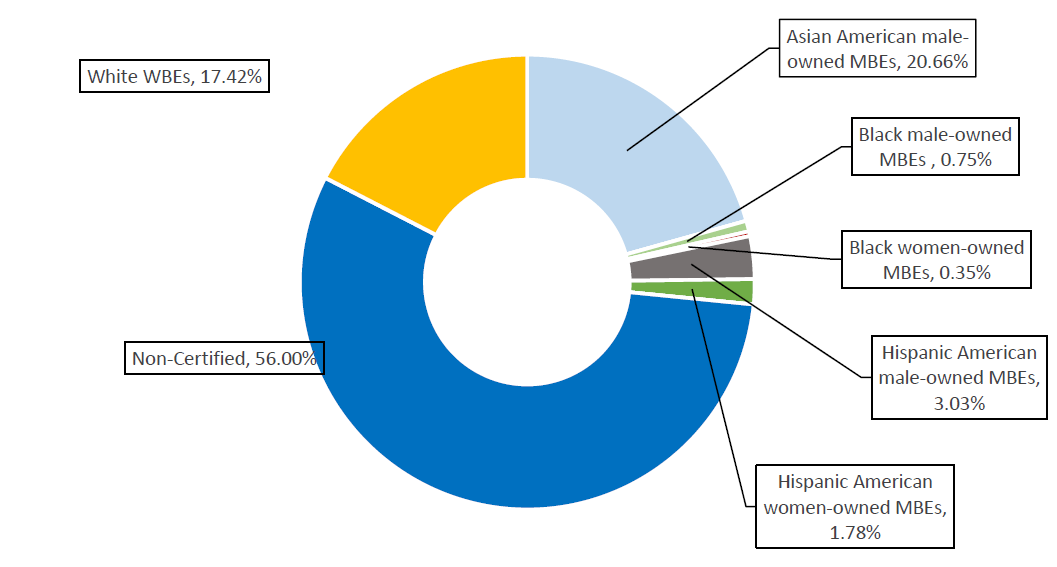
Chart 97: FY23 Share of LL 174-Eligible Contracts and PO Value, by M/WBE Category and Industry
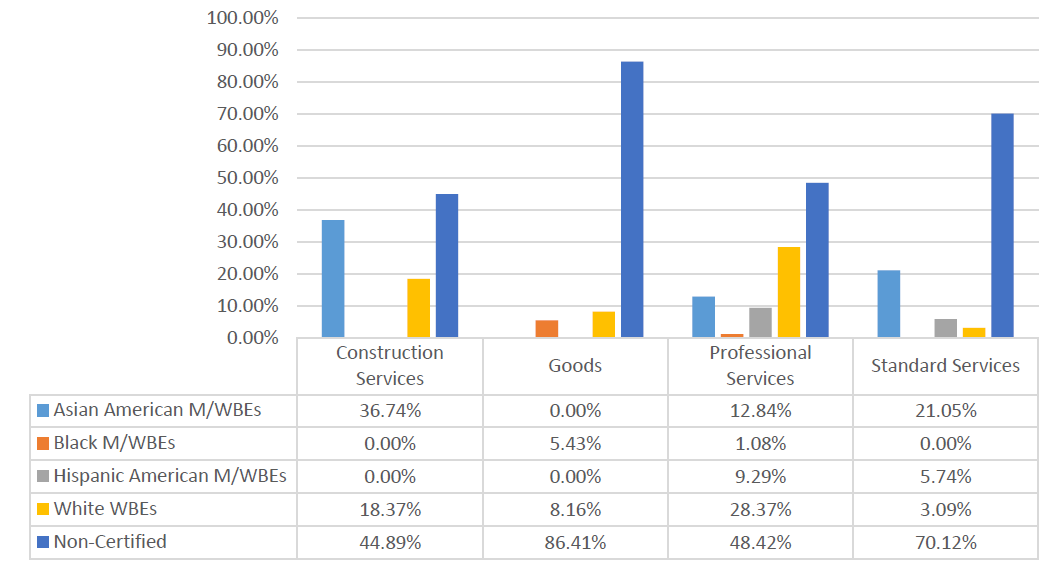
Mayoralty (MAYOR)
The LL 174 totals below represent a small portion of the Mayoralty’s total procurement portfolio, as it largely contracts with vendors for human services, which are exempt from LL 174 participation goals. Its $4.98 million in LL 174-eligible value accounts for just 0.5% of the City’s total LL 174-eligible contracting portfolio.
Table 72: FY23 LL 174-Eligible Contracts and POs
| Certification Status | # of Contracts | % Share of Contracts | Total Registered Contract Value | % Share of Contract Value |
| All Contracts and POs | 736 | 100.00% | $1,627,016,582 | 100.00% |
| M/WBE | 158 | 21.47% | $3,659,077 | 0.22% |
| Non-Certified | 578 | 78.53% | $1,623,357,506 | 99.78% |
| LL174 Contracts and POs | 361 | 100.00% | $4,988,497 | 100.00% |
| M/WBE | 141 | 39.06% | $3,402,451 | 68.21% |
| Non-Certified | 220 | 60.94% | $1,586,046 | 31.79% |
| LL174 Subcontracts | 22 | 100.00% | $496,697 | 100.00% |
| M/WBE | 7 | 31.82% | $124,863 | 25.14% |
| Non-Certified | 15 | 68.18% | $371,835 | 74.86% |
Chart 98: FY23 Value of LL 174-Eligible Prime Contracts and POs
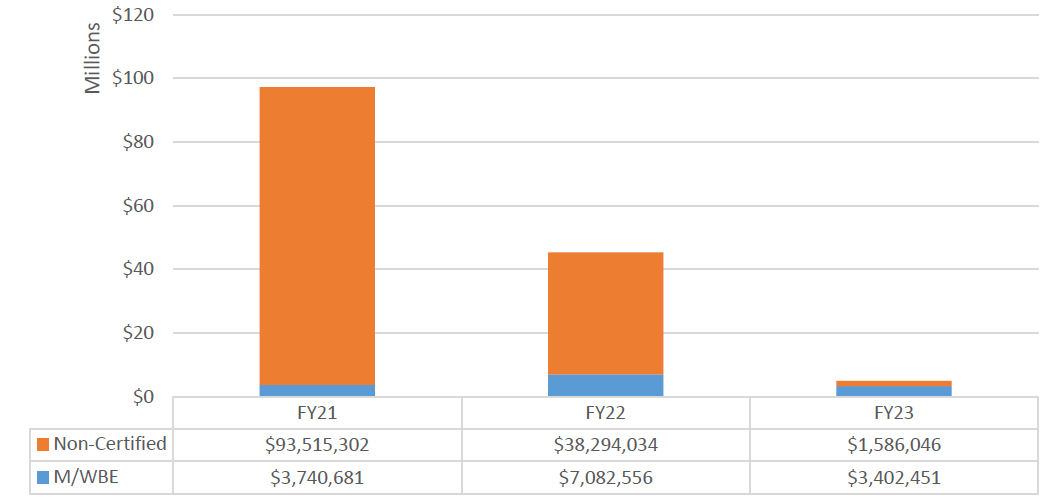
Chart 99: FY23 Value of LL 174-Eligible Contracts and POs, by Race and Gender
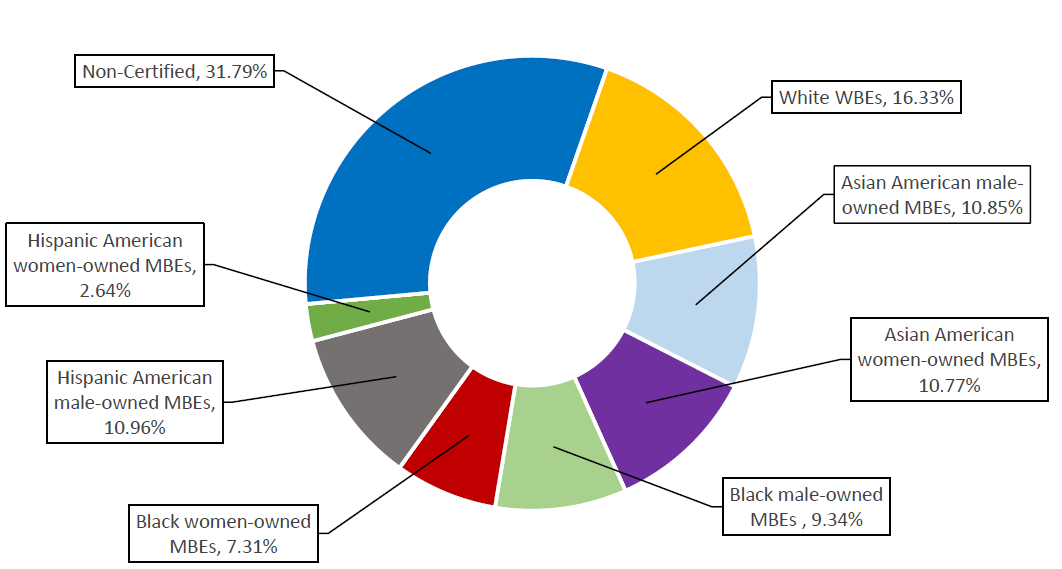
Chart 100: FY23 Share of LL 174-Eligible Contracts and PO Value, by M/WBE Category and Industry
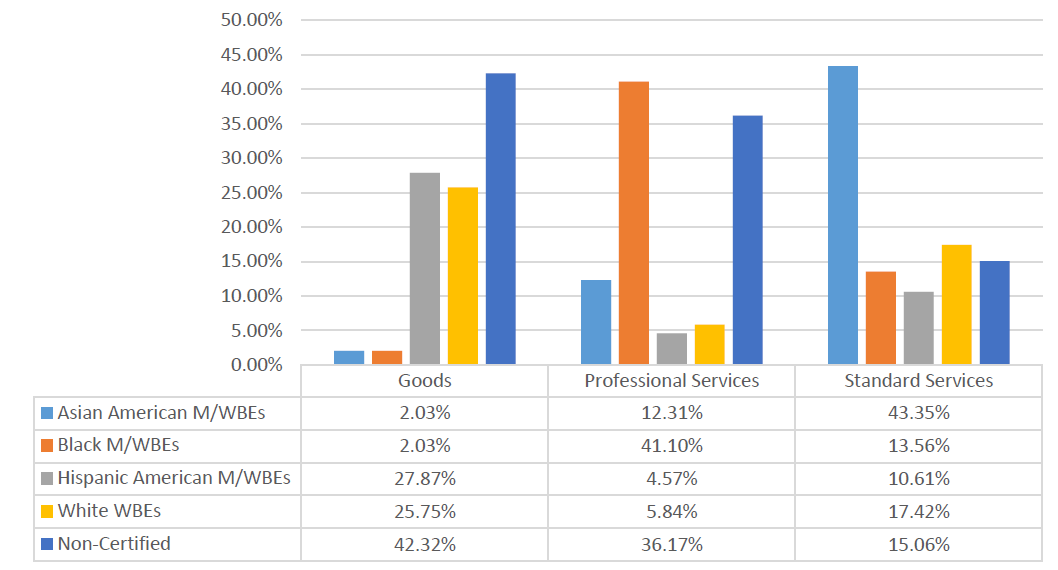
NYC Office of Emergency Management (NYCEM)
The LL 174 totals below here represent a relatively small share of NYCEM’s total procurement portfolio, as NYCEM manages high-value emergency procurements which are exempt from LL 174 participation goals. Its $34.93 million in LL 174-eligible value accounts for less than 0.5% of the City’s total LL 174-eligible contracting portfolio.
Table 73: FY23 LL 174-Eligible Contracts and POs
| Certification Status | # of Contracts | % Share of Contracts | Total Registered Contract Value | % Share of Contract Value |
| All Contracts and POs | 367 | 100.00% | $330,770,121 | 100.00% |
| M/WBE | 145 | 39.51% | $3,471,743 | 1.05% |
| Non-Certified | 222 | 60.49% | $327,298,378 | 98.95% |
| LL174 Contracts and POs | 336 | 100.00% | $34,935,231 | 100.00% |
| M/WBE | 141 | 41.96% | $2,879,961 | 8.24% |
| Non-Certified | 195 | 58.04% | $32,055,270 | 91.76% |
| LL174 Subcontracts | 0 | 0.00% | $0 | 0.00% |
| M/WBE | 0 | 0.00% | $0 | 0.00% |
| Non-Certified | 0 | 0.00% | $0 | 0.00% |
Chart 101: FY23 Value of LL 174-Eligible Prime Contracts and POs
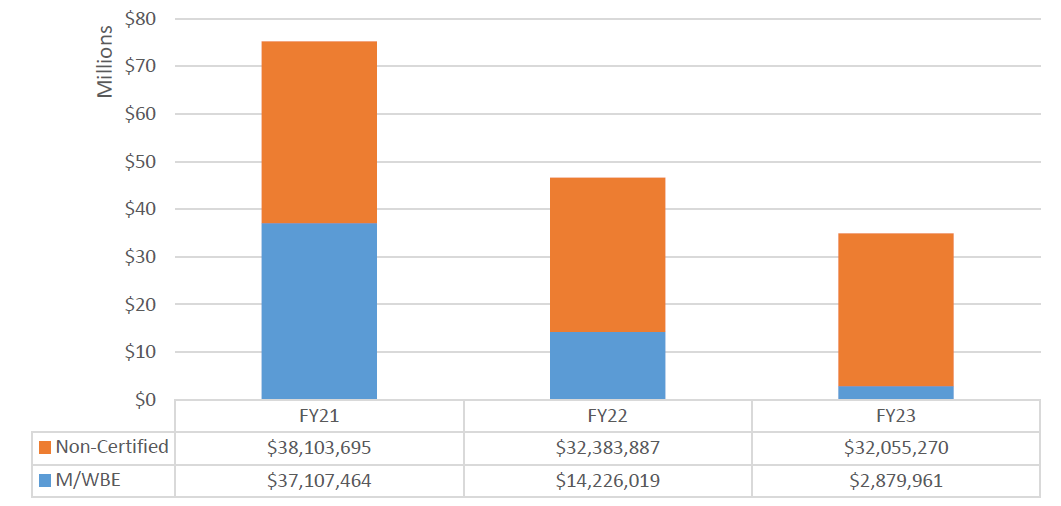
Chart 102: FY23 Value of LL 174-Eligible Contracts and POs, by Race and Gender
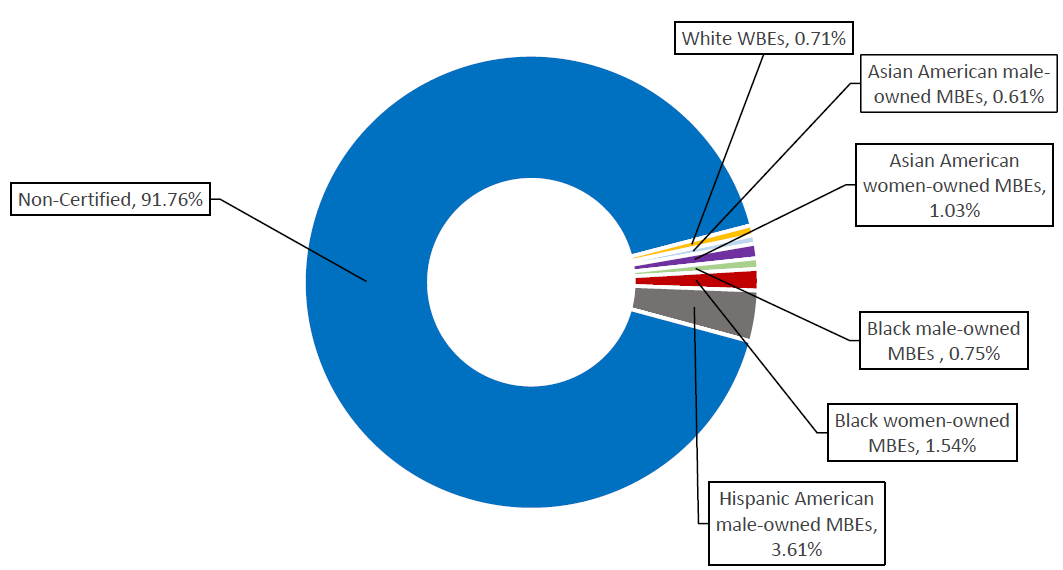
Chart 103: FY23 Share of LL 174-Eligible Contracts and PO Value, by M/WBE Category and Industry
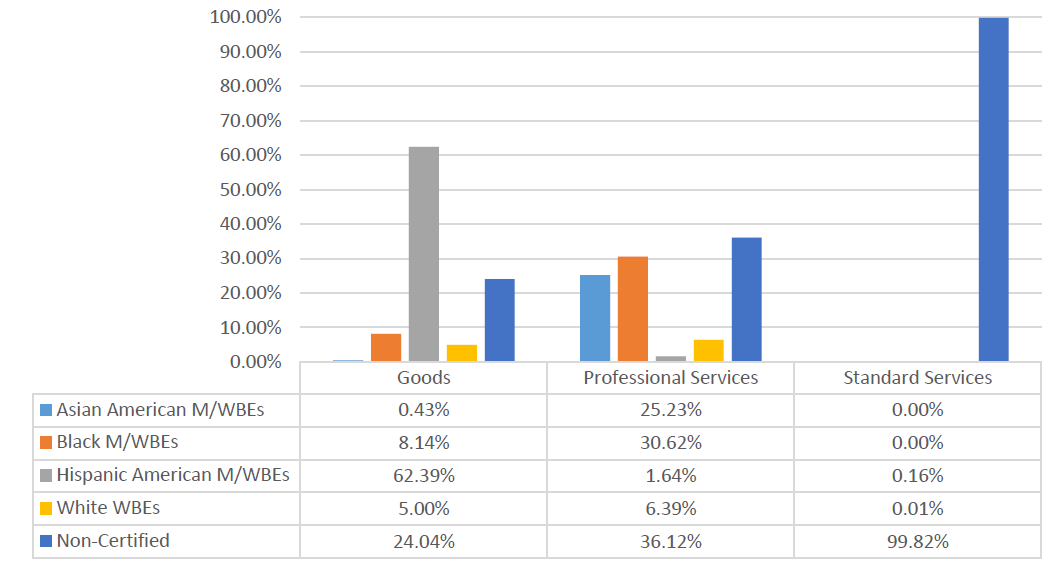
New York Police Department (NYPD)
The LL 174 data below does not include valuable Renewals, which accounted for a large share of NYPD’s FY23 procurement portfolio. NYPD’s $65.6 million in LL 174-eligible value accounts for less than 1% of the City’s total LL 174-eligible contracting portfolio.
Table 74: FY23 LL 174-Eligible Contracts and POs
| Certification Status | # of Contracts | % Share of Contracts | Total Registered Contract Value | % Share of Contract Value |
| All Contracts and POs | 2,900 | 100.00% | $176,467,703 | 100.00% |
| M/WBE | 979 | 33.76% | $23,405,576 | 13.26% |
| Non-Certified | 1,921 | 66.24% | $153,062,127 | 86.74% |
| LL174 Contracts and POs | 2,774 | 100.00% | $65,674,317 | 100.00% |
| M/WBE | 973 | 35.08% | $16,767,505 | 25.53% |
| Non-Certified | 1,801 | 64.92% | $48,906,812 | 74.47% |
| LL174 Subcontracts | 26 | 100.00% | $2,236,724 | 100.00% |
| M/WBE | 17 | 65.38% | $1,908,774 | 85.34% |
| Non-Certified | 9 | 34.62% | $327,950 | 14.66% |
Chart 104: FY23 Value of LL 174-Eligible Prime Contracts and POs
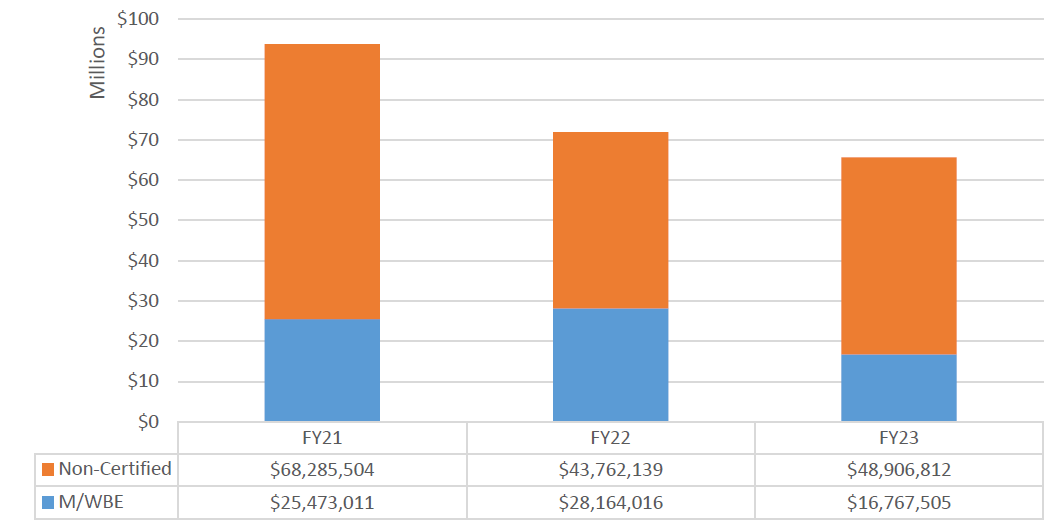
Chart 105 FY23 Value of LL 174-Eligible Contracts and POs, by Race and Gender
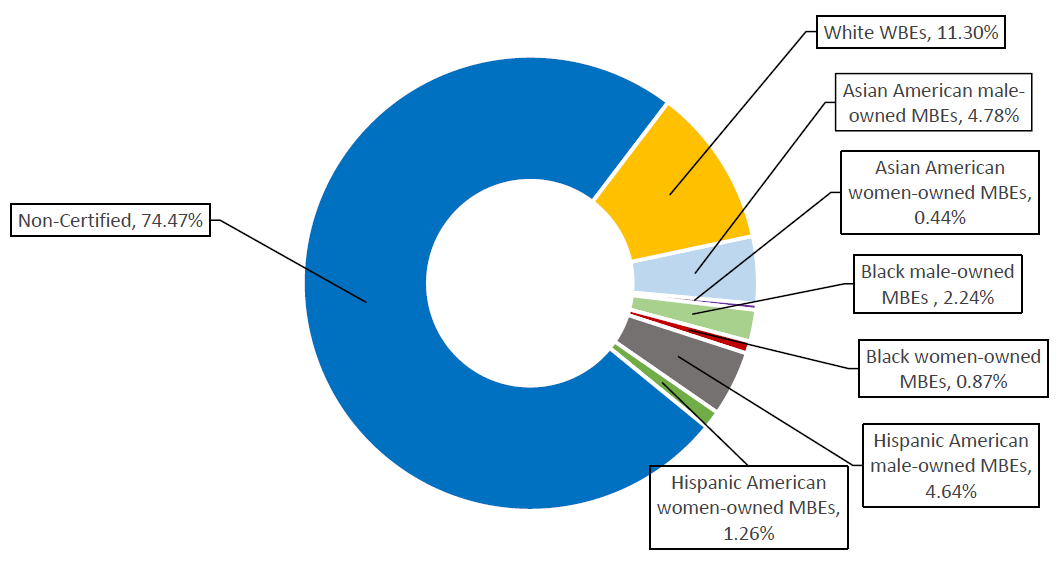
Chart 106: FY23 Share of LL 174-Eligible Contracts and PO Value by M/WBE Category and Industry
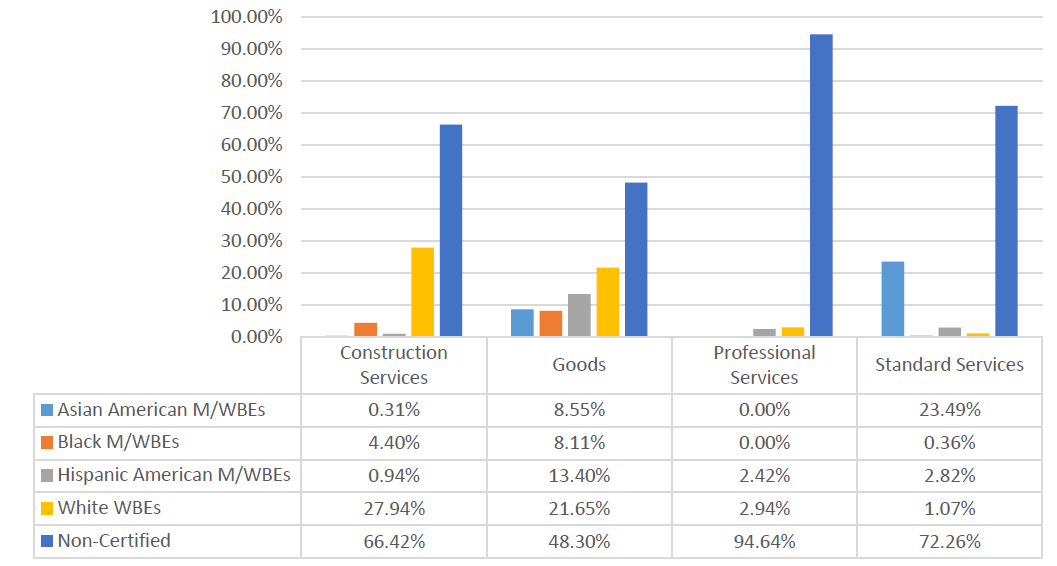
Office of Administrative Trials and Hearings (OATH)
Most of OATH’s procurement portfolio was subject to LL 174 participation goals in FY23. Its $3.8 million in LL 174-eligible value represents less than 1% of the City’s total LL 174-eligible contracting portfolio.
Table 75: FY23 LL 174-Eligible Contracts and POs
| Certification Status | # of Contracts | % Share of Contracts | Total Registered Contract Value | % Share of Contract Value |
| All Contracts and POs | 109 | 100.00% | $4,617,958 | 100.00% |
| M/WBE | 62 | 56.88% | $1,749,853 | 37.89% |
| Non-Certified | 47 | 43.12% | $2,868,105 | 62.11% |
| LL174 Contracts and POs | 100 | 100.00% | $3,888,713 | 100.00% |
| M/WBE | 61 | 61.00% | $1,718,651 | 44.20% |
| Non-Certified | 39 | 39.00% | $2,170,061 | 55.80% |
| LL174 Subcontracts | 0 | 0.00% | $0 | 0.00% |
| M/WBE | 0 | 0.00% | $0 | 0.00% |
| Non-Certified | 0 | 0.00% | $0 | 0.00% |
Chart 107: FY23 Value of LL 174-Eligible Prime Contracts and POs
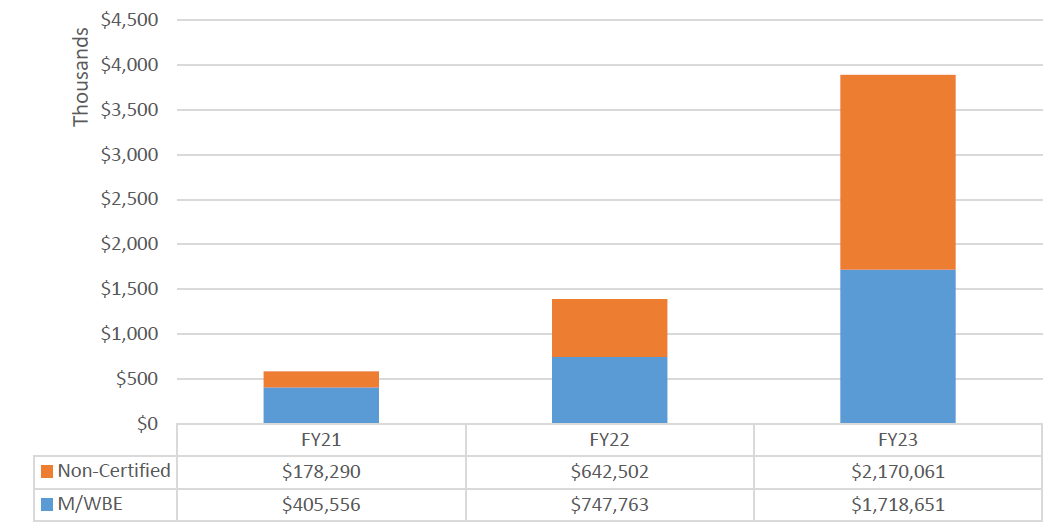
Chart 108: FY23 Value of LL 174-Eligible Contracts and POs, by Race and Gender
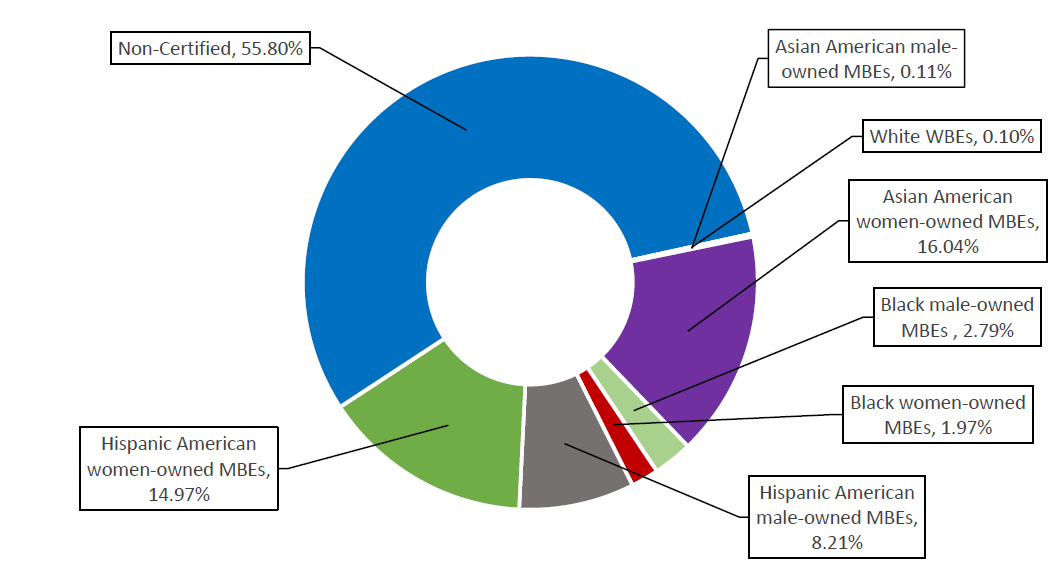
Chart 109: FY23 Share of LL 174-Eligible Contracts and PO Value, by M/WBE Category and Industry
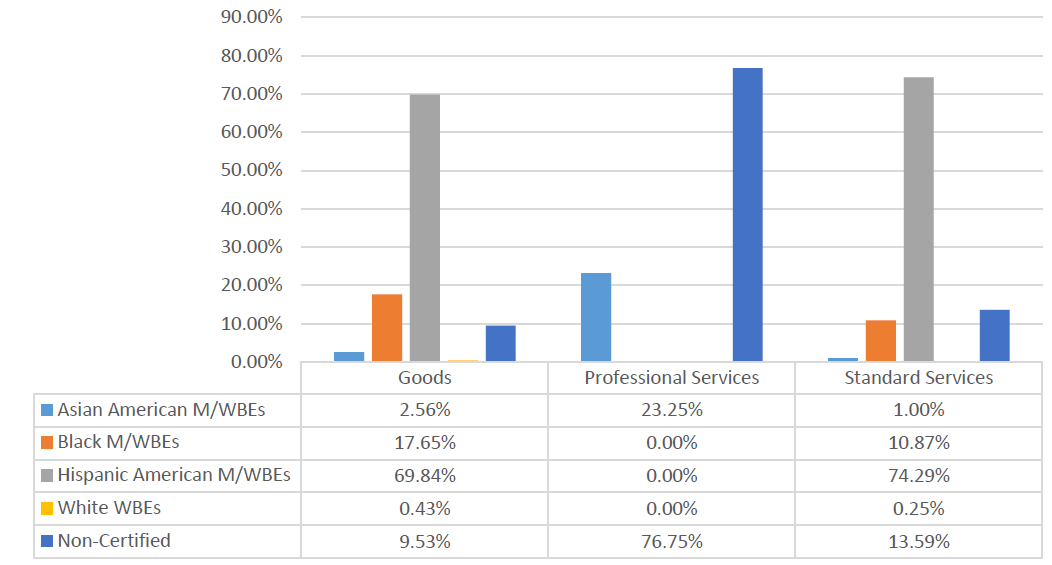
Office of Technology and Innovation (OTI)
OTI has a very large procurement portfolio, and the LL 174 data below only represents a small share. OTI procured high-value Sole Source contracts that are exempt from LL 174 participation goals, as well as valuable Renewals that were excluded from this analysis. That said, OTI’s $468 million in LL 174-eligible value still represents nearly 5% of the City’s total LL 174-eligible contracting portfolio.
Table 76: FY23 LL 174-Eligible Contracts and POs
| Certification Status | # of Contracts | % Share of Contracts | Total Registered Contract Value | % Share of Contract Value |
| All Contracts and POs | 576 | 100.00% | $1,379,050,280 | 100.00% |
| M/WBE | 320 | 55.56% | $305,255,782 | 22.14% |
| Non-Certified | 256 | 44.44% | $1,073,794,498 | 77.86% |
| LL174 Contracts and POs | 455 | 100.00% | $468,960,447 | 100.00% |
| M/WBE | 304 | 66.81% | $244,798,829 | 52.20% |
| Non-Certified | 151 | 33.19% | $224,161,618 | 47.80% |
| LL174 Subcontracts | 0 | 0.00% | $0 | 0.00% |
| M/WBE | 0 | 0.00% | $0 | 0.00% |
| Non-Certified | 0 | 0.00% | $0 | 0.00% |
Chart 110: FY23 Value of LL 174-Eligible Prime Contracts and POs
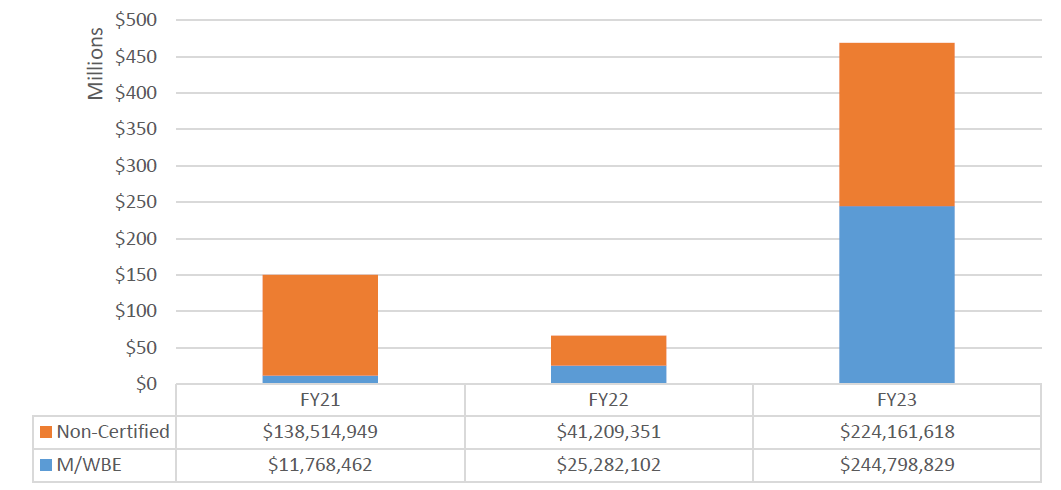
Chart 111: FY23 Value of LL 174-Eligible Contracts and POs, by Race and Gender
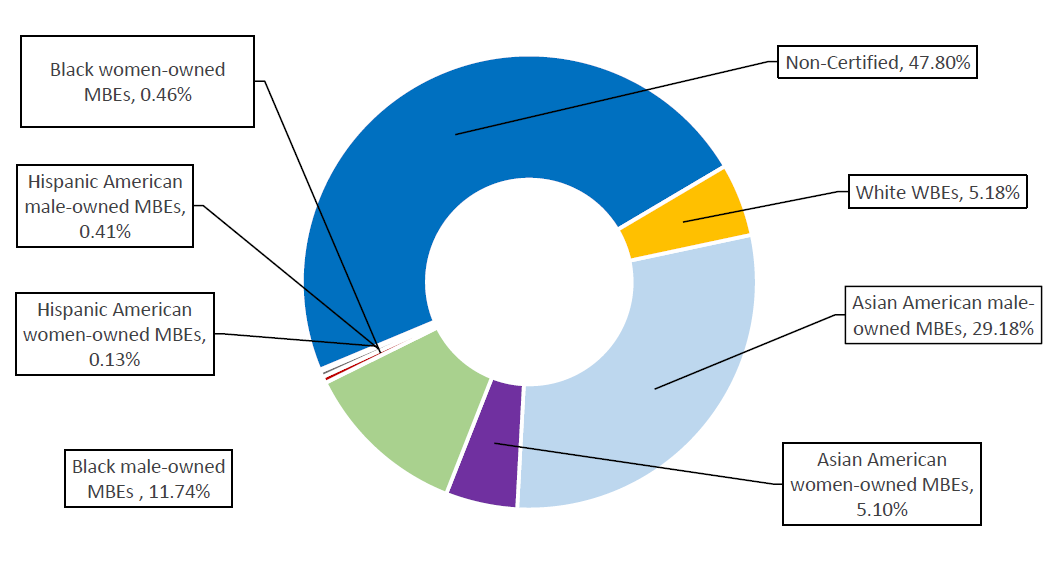
Chart 112: FY23 Share of LL 174-Eligible Contracts and PO Value, by M/WBE Category and Industry
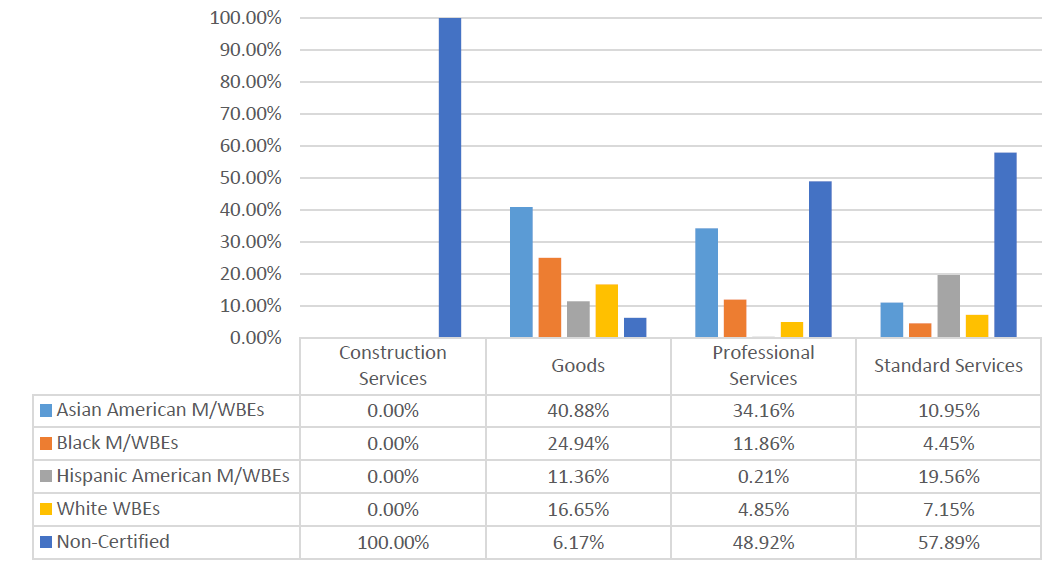
Small Business Services (SBS)
SBS has one of the City’s largest procurement portfolios by value due to high-dollar Sole Source agreements with the New York City Economic Development Corporation (NYCEDC) to function as a development consultant and provide economic development-related services on behalf of the City. NYCEDC is a nonprofit organization incorporated under the Not-for-Profit Corporation Law of the State of New York, and as such these contracts are not subject to LL 174 participation goals.[61] SBS’ $6.11 million in LL 174-eligible value represents less than 0.1% of the City’s total LL 174-eligible contracting portfolio.
Table 77: FY23 LL 174-Eligible Contracts and POs
| Certification Status | # of Contracts | % Share of Contracts | Total Registered Contract Value | % Share of Contract Value |
| All Contracts and POs | 296 | 100.00% | $2,977,844,148 | 100.00% |
| M/WBE | 53 | 17.91% | $10,488,763 | 0.35% |
| Non-Certified | 243 | 82.09% | $2,967,355,385 | 99.65% |
| LL174 Contracts and POs | 105 | 100.00% | $6,118,581 | 100.00% |
| M/WBE | 49 | 46.67% | $5,675,477 | 92.76% |
| Non-Certified | 56 | 53.33% | $443,104 | 7.24% |
| LL174 Subcontracts | 0 | 0.00% | $0 | 0.00% |
| M/WBE | 0 | 0.00% | $0 | 0.00% |
| Non-Certified | 0 | 0.00% | $0 | 0.00% |
Chart 113: FY23 Value of LL 174-Eligible Prime Contracts and POs
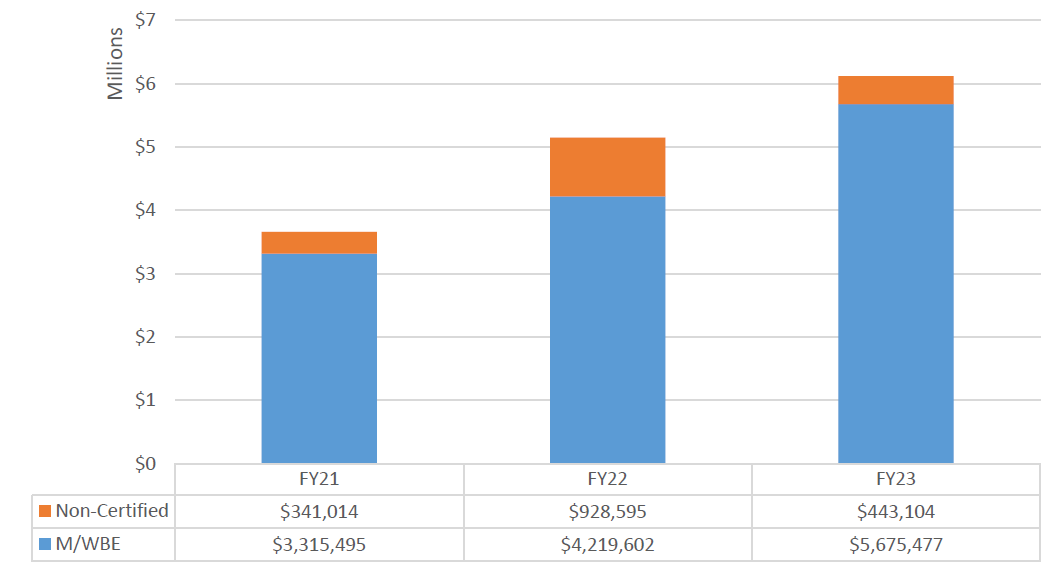
Chart 114 FY23 Value of LL 174-Eligible Contracts and POs, by Race and Gender
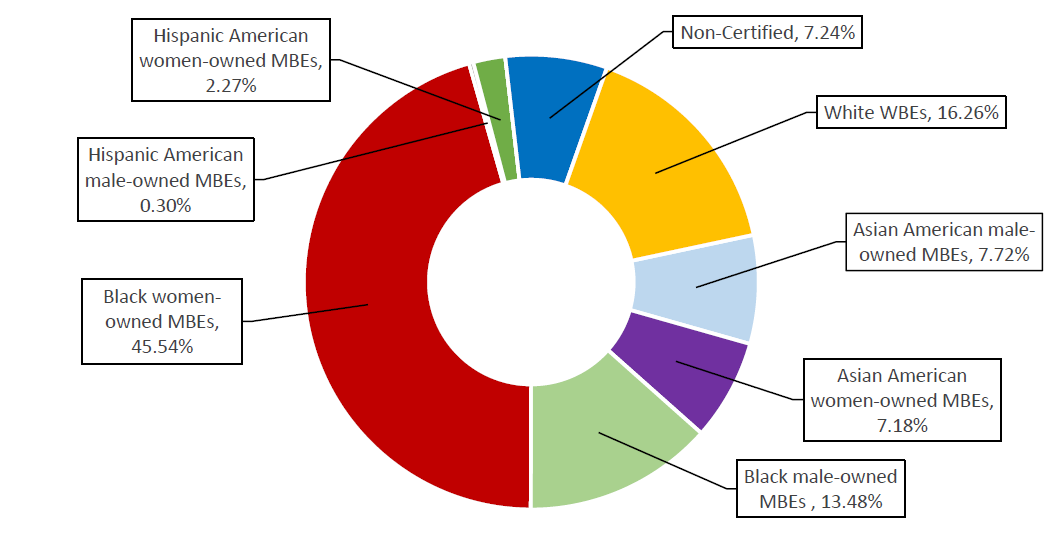
Chart 115: FY23 Share of LL 174-Eligible Contracts and PO Value, by M/WBE Category and Industry
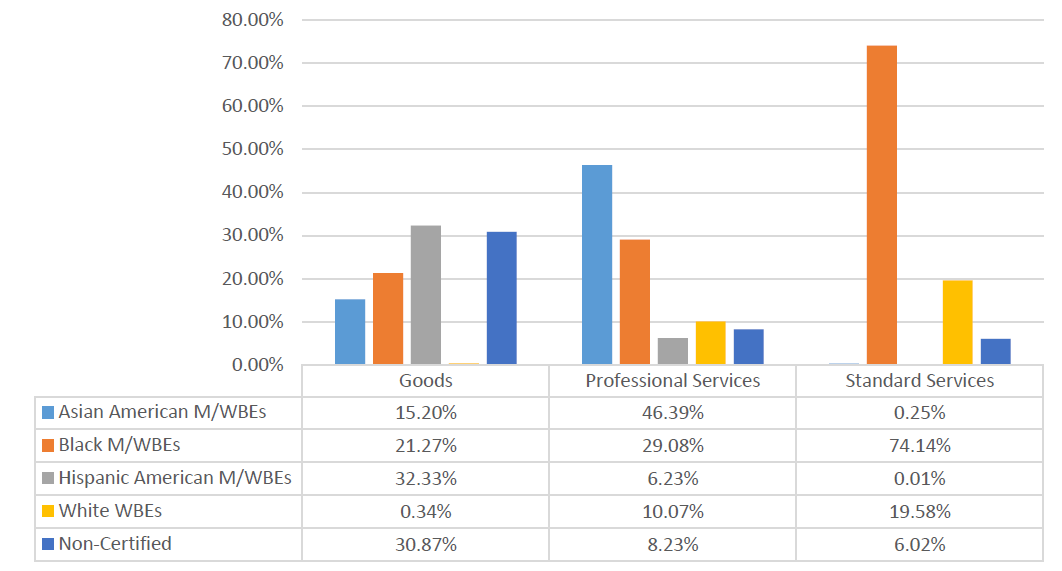
Taxi and Limousine Commission (TLC)
The majority of TLC’s FY23 procurement value was excluded from the LL 174 totals below due to a high-value Assignment contract. TLC’s $2.3 million in LL 174-eligible value represents less than 1% of the City’s total LL 174-eligible contracting portfolio.
Table 78: FY23 LL 174-Eligible Contracts and POs
| Certification Status | # of Contracts | % Share of Contracts | Total Registered Contract Value | % Share of Contract Value |
| All Contracts and POs | 242 | 100.00% | $105,784,918 | 100.00% |
| M/WBE | 73 | 30.17% | $1,604,631 | 1.52% |
| Non-Certified | 169 | 69.83% | $104,180,287 | 98.48% |
| LL174 Contracts and POs | 206 | 100.00% | $2,341,700 | 100.00% |
| M/WBE | 72 | 34.95% | $1,554,631 | 66.39% |
| Non-Certified | 134 | 65.05% | $787,069 | 33.61% |
| LL174 Subcontracts | 0 | 0.00% | $0 | 0.00% |
| M/WBE | 0 | 0.00% | $0 | 0.00% |
| Non-Certified | 0 | 0.00% | $0 | 0.00% |
Chart 116: FY23 Value of LL 174-Eligible Prime Contracts and POs
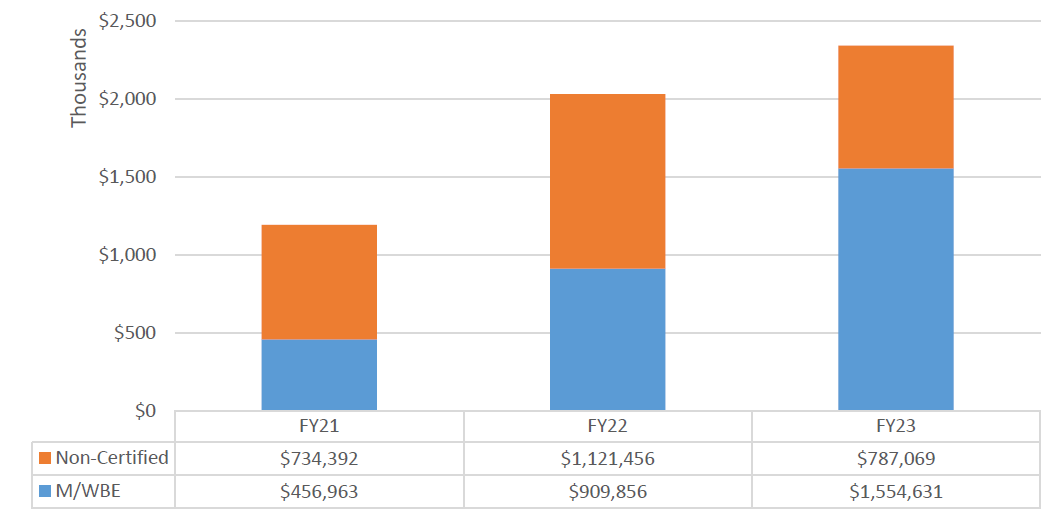
Chart 117: FY23 Value of LL 174-Eligible Contracts and POs, by Race and Gender
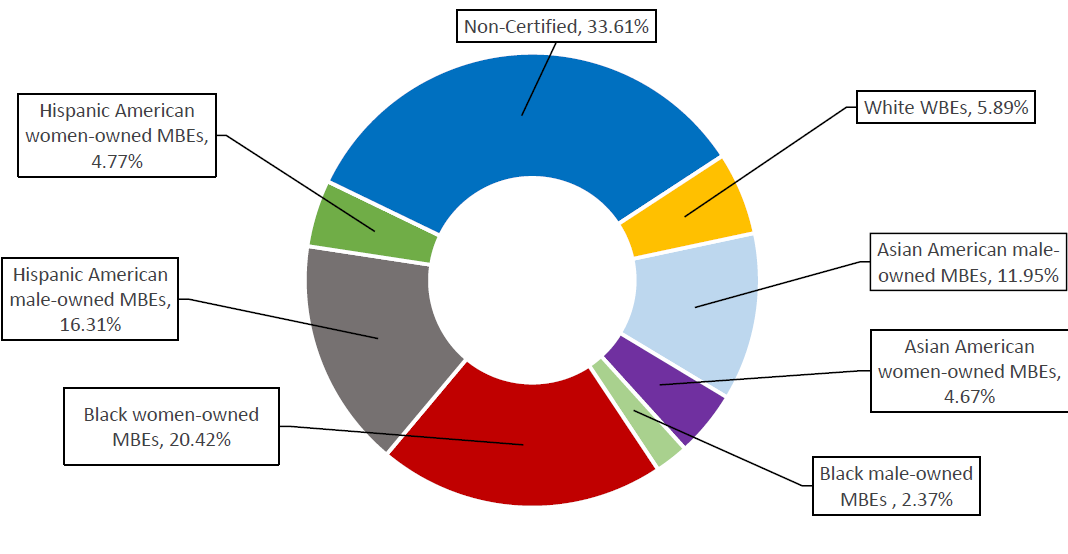
Chart 118: FY23 Share of LL 174-Eligible Contracts and PO Value, by M/WBE Category and Industry
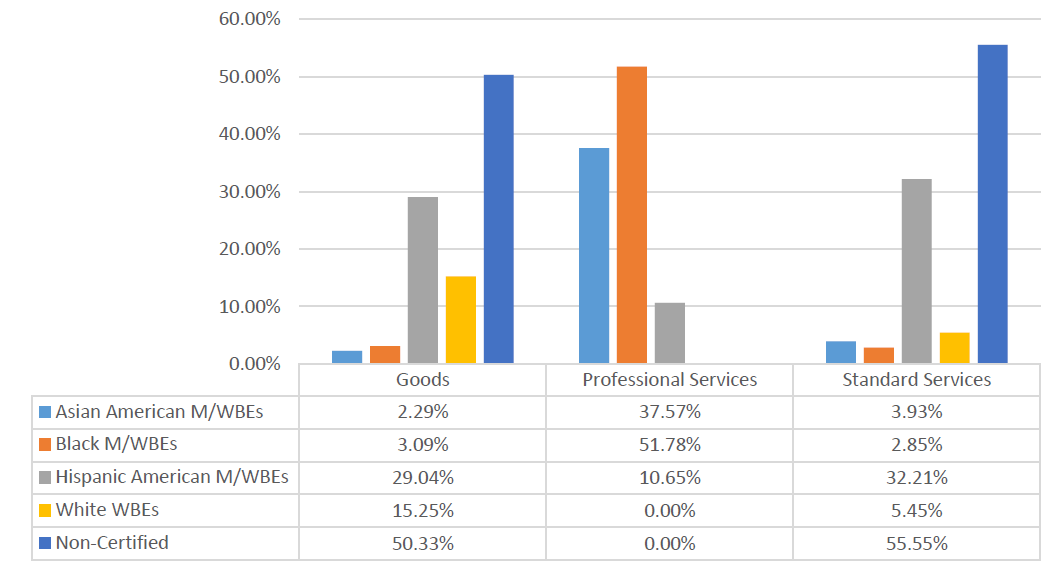
Independently Elected Officials
Independently Elected Officials are subject to the LL 174 participation goals program. Going forward, this Report will include individual analyses for each of these Offices. Generally speaking, these Offices manage relatively small procurement portfolios.
Brooklyn Borough President (BKBP)
Table 79: FY23 LL 174-Eligible Contracts and POS
| Certification Status | # of Contracts | % Share of Contracts | Total Registered Contract Value | % Share of Contract Value |
| All Contracts and POs | 166 | 100.00% | $1,867,744 | 100.00% |
| M/WBE | 7 | 4.22% | $40,599 | 2.17% |
| Non-Certified | 159 | 95.78% | $1,827,145 | 97.83% |
| LL174 Contracts and POs | 92 | 100.00% | $479,977 | 100.00% |
| M/WBE | 7 | 7.61% | $40,599 | 8.46% |
| Non-Certified | 85 | 92.39% | $439,378 | 91.54% |
| LL174 Subcontracts | 0 | 0.00% | $0 | 0.00% |
| M/WBE | 0 | 0.00% | $0 | 0.00% |
| Non-Certified | 0 | 0.00% | $0 | 0.00% |
Chart 119: FY23 Value of LL 174-Eligible Prime Contracts and POs
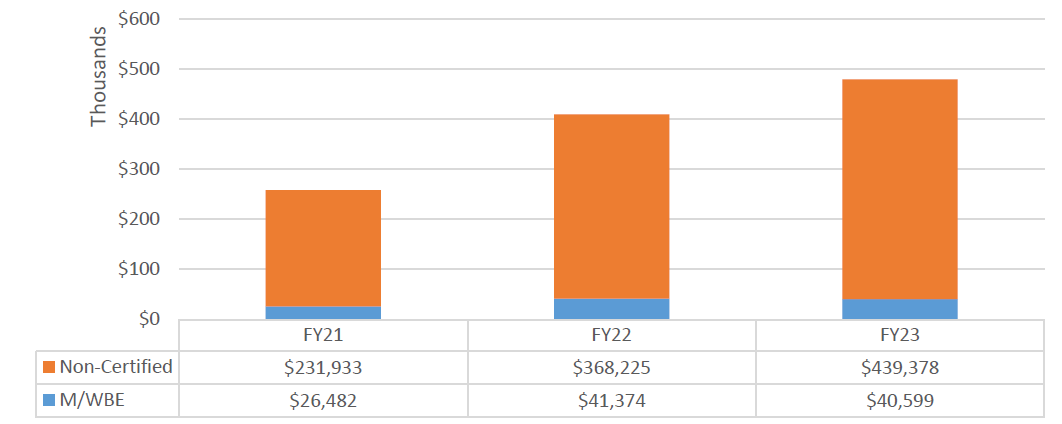
Chart 120: FY23 Value of LL 174-Eligible Contracts and POs, by Race and Gender
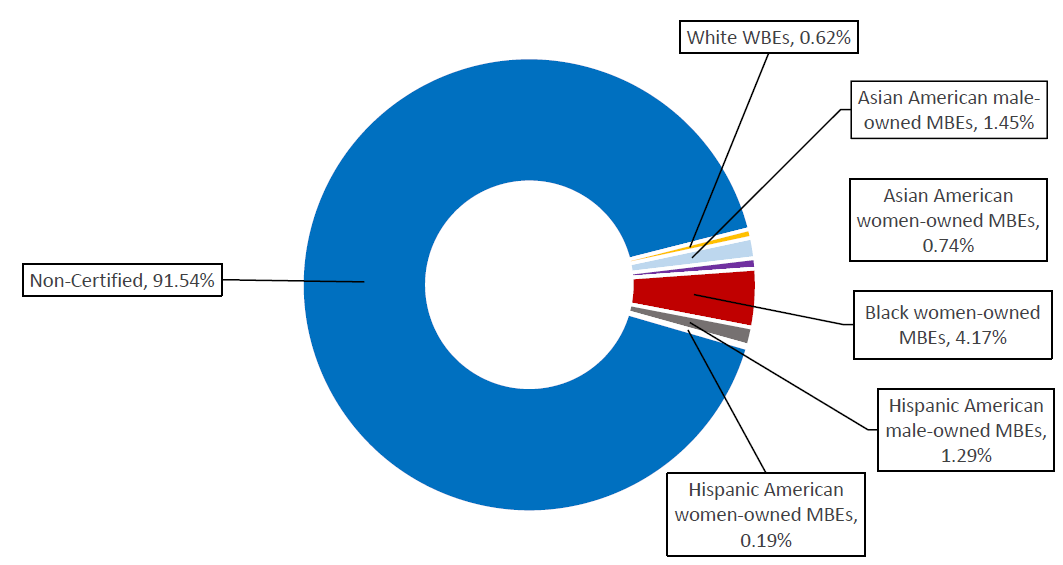
Chart 121: FY23 Share of LL 174-Eligible Contracts and PO Value, by M/WBE Category and Industry
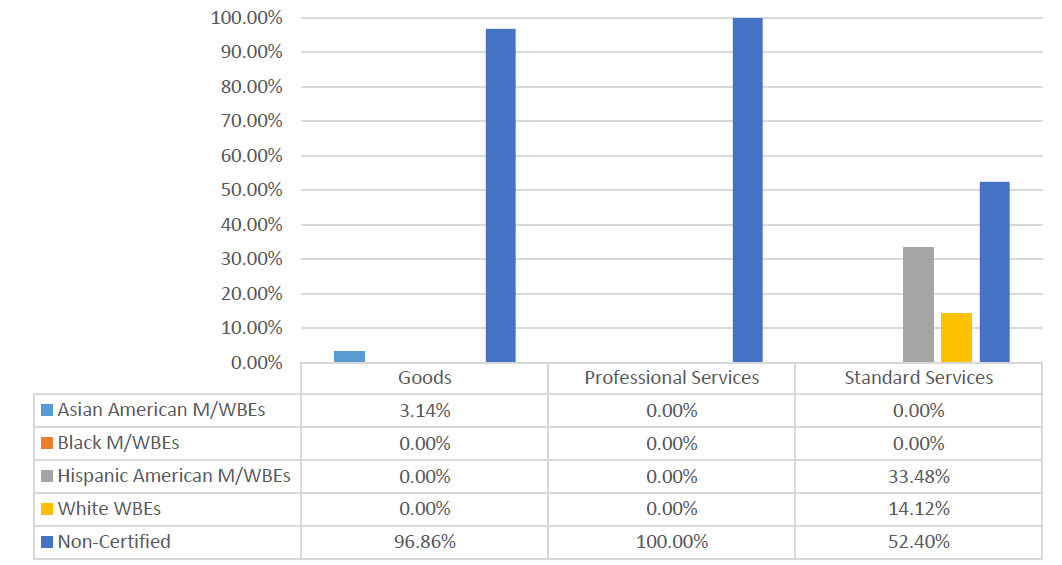
Bronx Borough President (BXBP)
Table 80: FY23 LL 174-Eligible Contracts and POs
| Certification Status | # of Contracts | % Share of Contracts | Total Registered Contract Value | % Share of Contract Value |
| All Contracts and POs | 228 | 100.00% | $530,821 | 100.00% |
| M/WBE | 36 | 15.79% | $96,607 | 18.20% |
| Non-Certified | 192 | 84.21% | $434,214 | 81.80% |
| LL174 Contracts and POs | 222 | 100.00% | $455,787 | 100.00% |
| M/WBE | 36 | 16.22% | $96,607 | 21.20% |
| Non-Certified | 186 | 83.78% | $359,180 | 78.80% |
| LL174 Subcontracts | 0 | 0.00% | $0 | 0.00% |
| M/WBE | 0 | 0.00% | $0 | 0.00% |
| Non-Certified | 0 | 0.00% | $0 | 0.00% |
Chart 122: FY23 Value of LL 174-Eligible Prime Contracts and POs
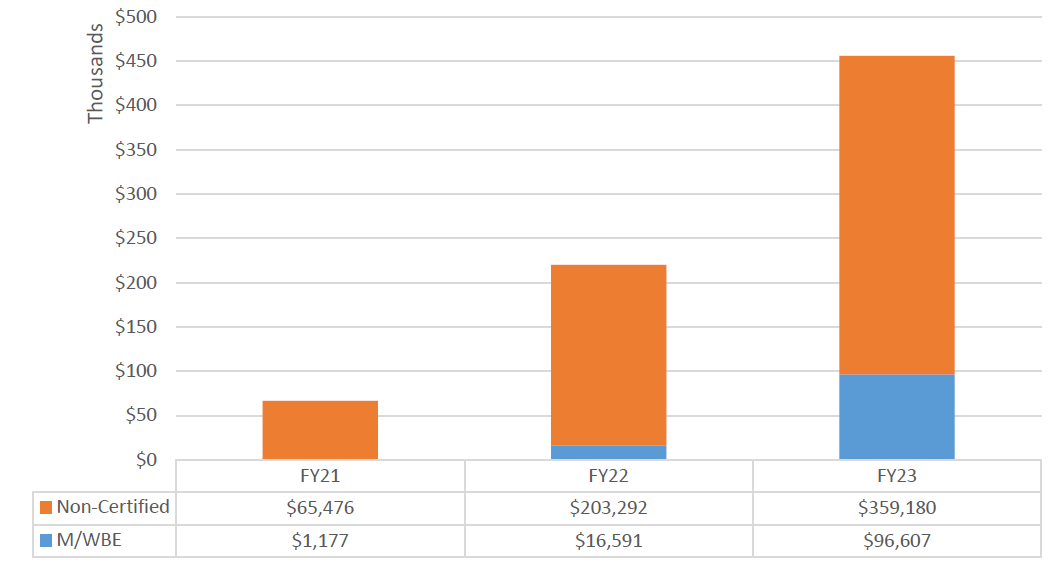
Chart 123: FY23 Value of LL 174-Eligible Contracts and POs, by Race and Gender
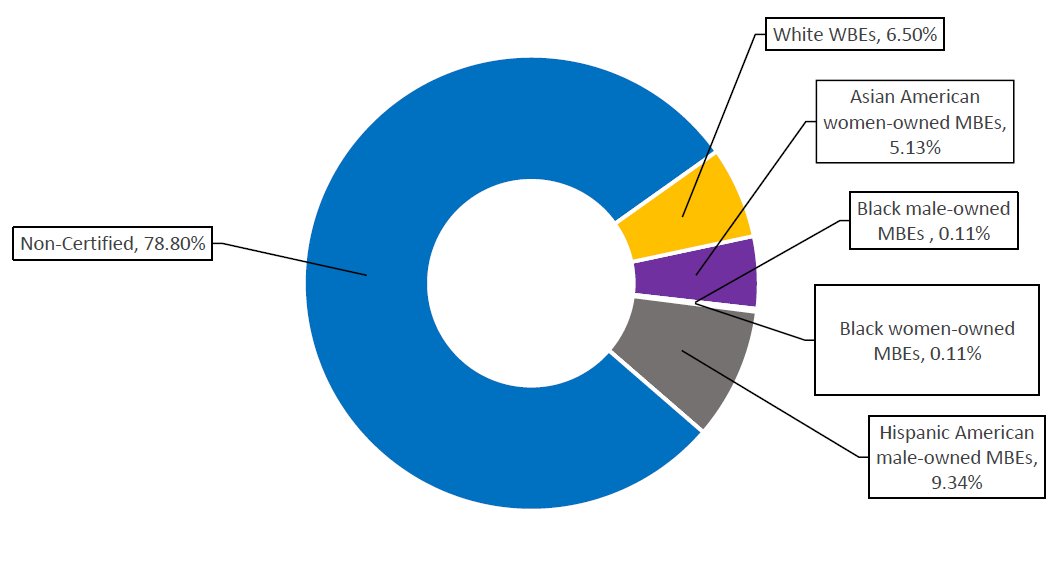
Chart 124: FY23 Share of LL 174-Eligible Contracts and PO Value, by M/WBE Category and Industry
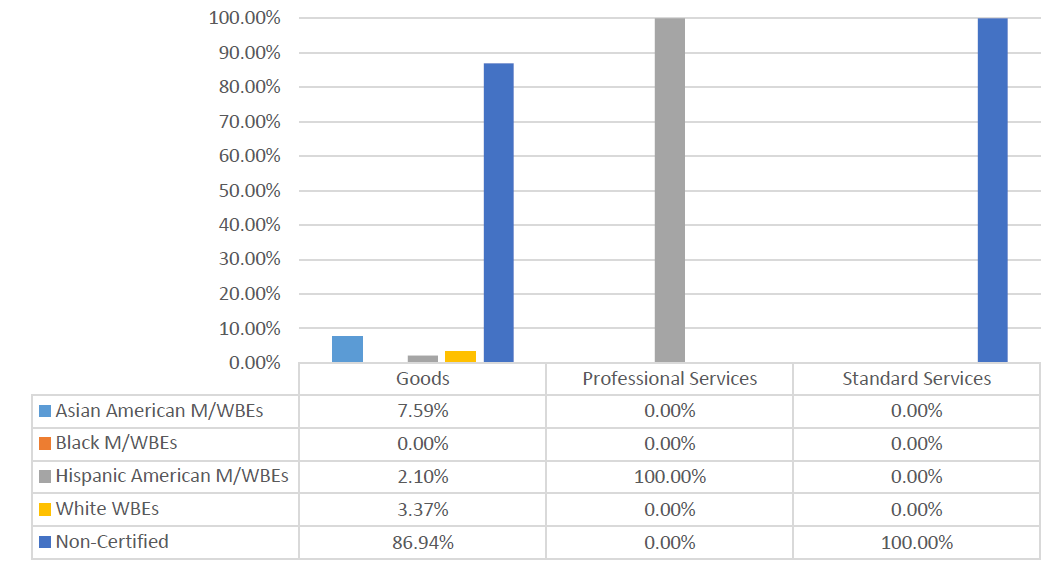
Manhattan Borough President (MBP)
Table 81: FY23 LL 174-Eligible Contracts and POs
| Certification Status | # of Contracts | % Share of Contracts | Total Registered Contract Value | % Share of Contract Value |
| All Contracts and POs | 119 | 100.00% | $466,803 | 100.00% |
| M/WBE | 23 | 19.33% | $90,104 | 19.30% |
| Non-Certified | 96 | 80.67% | $376,699 | 80.70% |
| LL174 Contracts and POs | 115 | 100.00% | $461,649 | 100.00% |
| M/WBE | 23 | 20.00% | $90,104 | 19.52% |
| Non-Certified | 92 | 80.00% | $371,545 | 80.48% |
| LL174 Subcontracts | 0 | 0.00% | $0 | 0.00% |
| M/WBE | 0 | 0.00% | $0 | 0.00% |
| Non-Certified | 0 | 0.00% | $0 | 0.00% |
Chart 125: FY23 Value of LL 174-Eligible Prime Contracts and POs
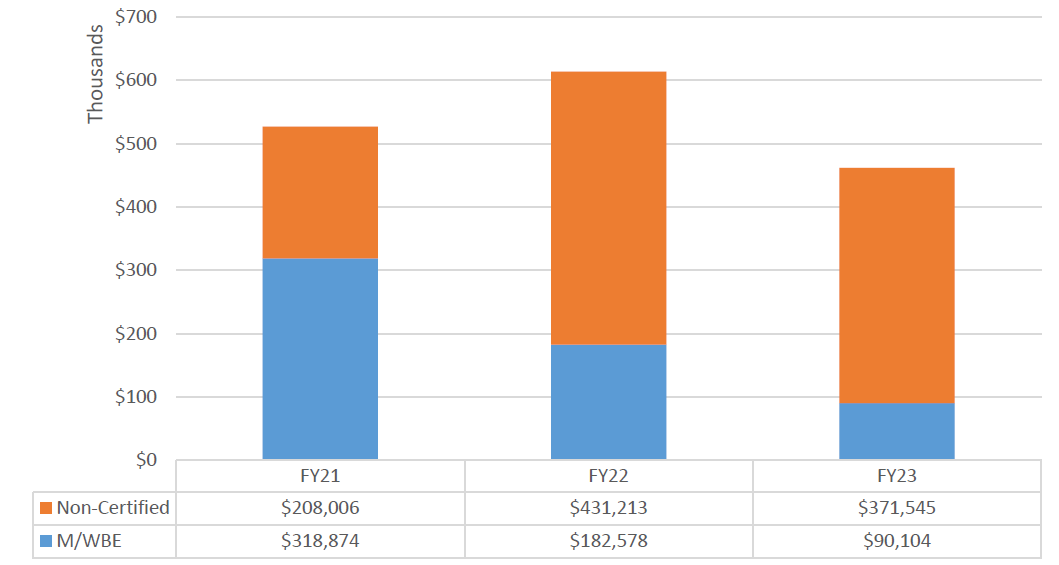
Chart 126: Value of LL 174-Eligible Contracts and POs, by Race and Gender
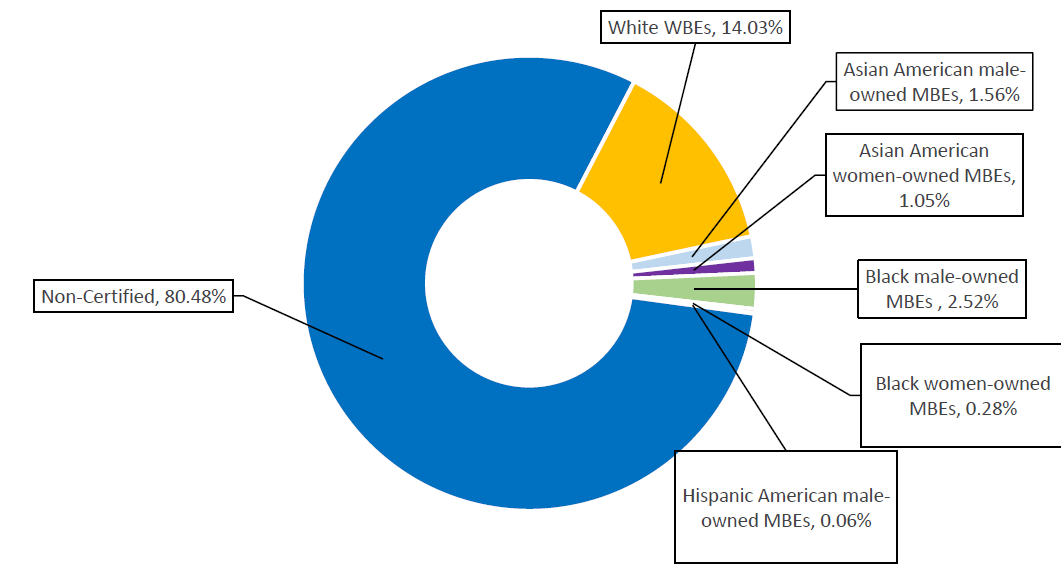
Chart 127: FY23 Share of LL 174-Eligible Contracts and PO Value, by M/WBE Category and Industry

Queens Borough President (QBP)
Table 82: FY23 LL 174-Eligible Contracts and POs
| Certification Status | # of Contracts | % Share of Contracts | Total Registered Contract Value | % Share of Contract Value |
| All Contracts and POs | 112 | 100.00% | $509,906 | 100.00% |
| M/WBE | 4 | 3.57% | $24,513 | 4.81% |
| Non-Certified | 108 | 96.43% | $485,393 | 95.19% |
| LL174 Contracts and POs | 58 | 100.00% | $258,406 | 100.00% |
| M/WBE | 4 | 6.90% | $24,513 | 9.49% |
| Non-Certified | 54 | 93.10% | $233,893 | 90.51% |
| LL174 Subcontracts | 0 | 0.00% | $0 | 0.00% |
| M/WBE | 0 | 0.00% | $0 | 0.00% |
| Non-Certified | 0 | 0.00% | $0 | 0.00% |
Chart 128: FY23 Value of LL 174-Eligible Prime Contracts and POs
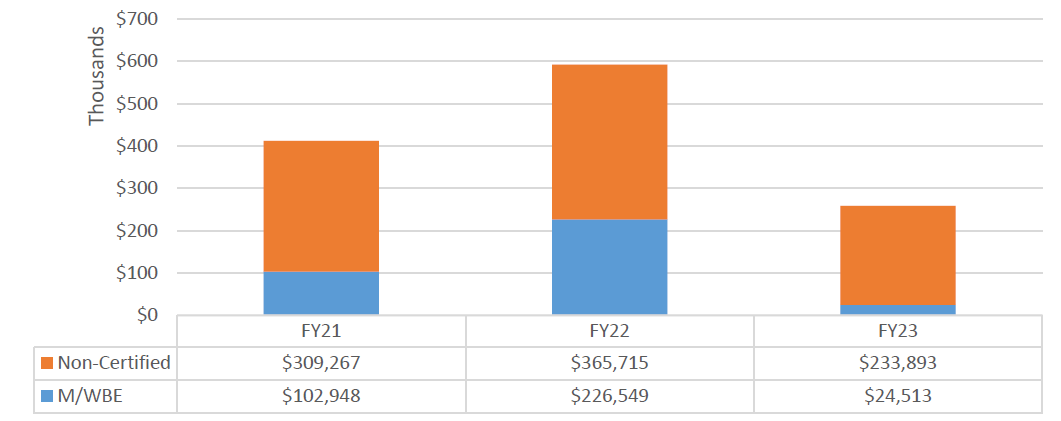
Chart 129: FY23 Value of LL 174-Eligible Contracts and POs, by Race and Gender
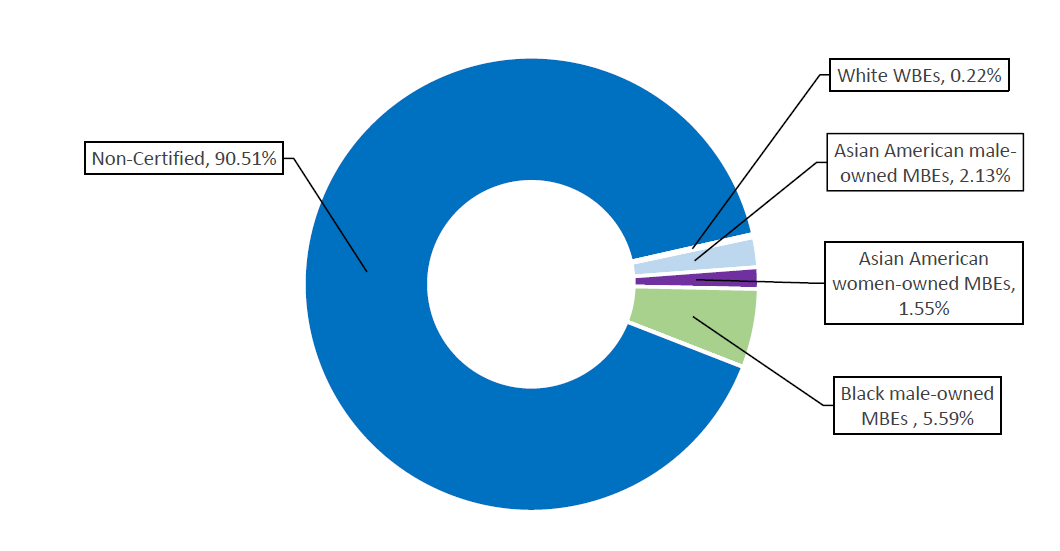
Chart 130: FY23 Share of LL 174-Eligible Contracts and PO Value, by M/WBE Category and Industry
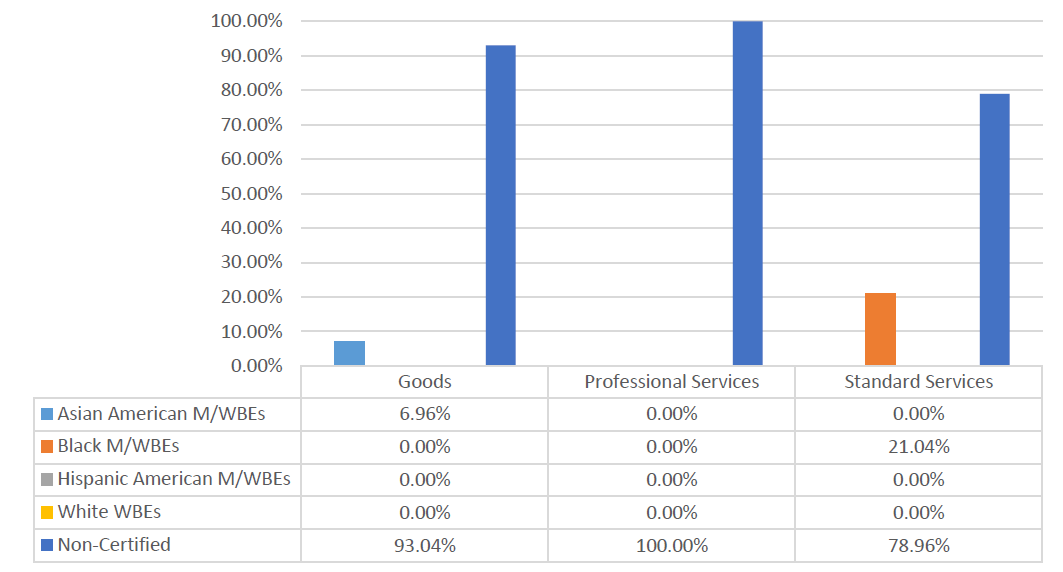
Staten Island Borough President (SIBP)
Table 83: FY23 LL 174-Eligible Contracts and POs
| Certification Status | # of Contracts | % Share of Contracts | Total Registered Contract Value | % Share of Contract Value |
| All Contracts and POs | 220 | 100.00% | $2,085,519 | 100.00% |
| M/WBE | 10 | 4.55% | $5,894 | 0.28% |
| Non-Certified | 210 | 95.45% | $2,079,625 | 99.72% |
| LL174 Contracts and POs | 93 | 100.00% | $102,019 | 100.00% |
| M/WBE | 10 | 10.75% | $5,894 | 5.78% |
| Non-Certified | 83 | 89.25% | $96,124 | 94.22% |
| LL174 Subcontracts | 0 | 0.00% | $0 | 0.00% |
| M/WBE | 0 | 0.00% | $0 | 0.00% |
| Non-Certified | 0 | 0.00% | $0 | 0.00% |
Chart 131 FY23 Value of LL 174-Eligible Prime Contracts and POs
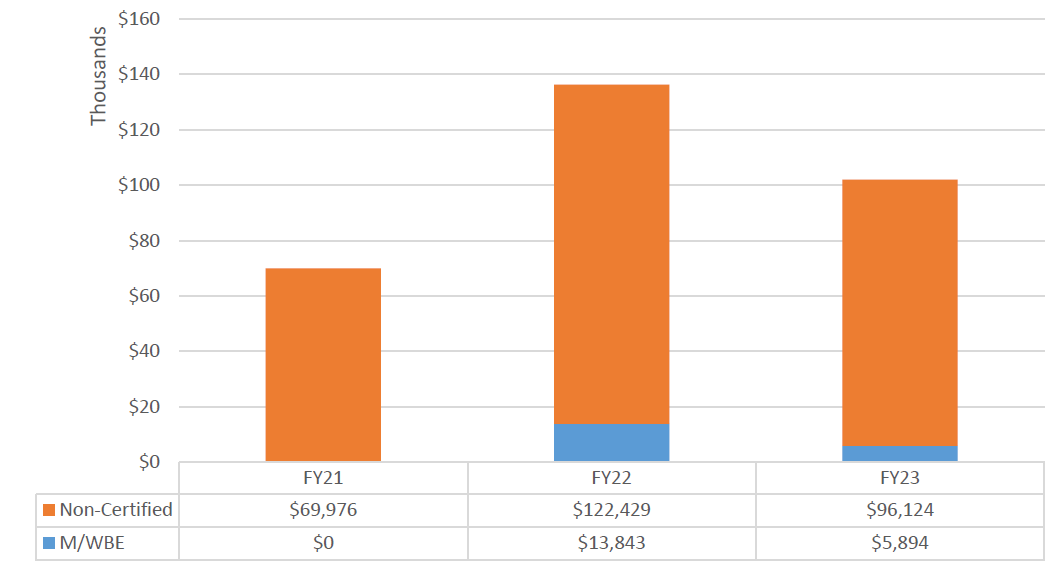
Chart 132: FY23 Value of LL 174-Eligible Contracts and POs, by Race and Gender
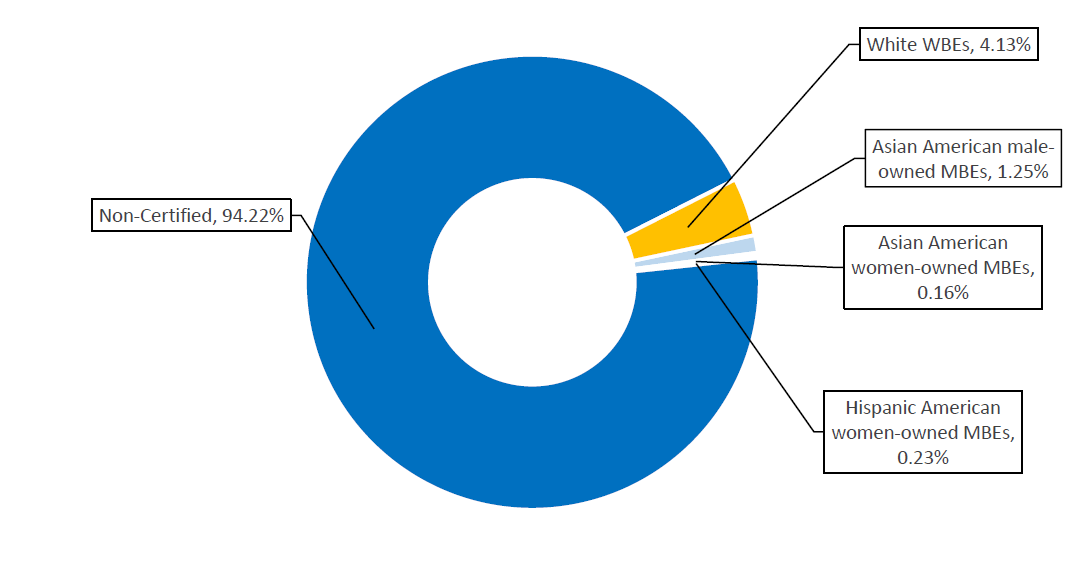
Chart 133: FY23 Share of LL 174-Eligible Contracts and PO Value, by M/WBE Category and Industry
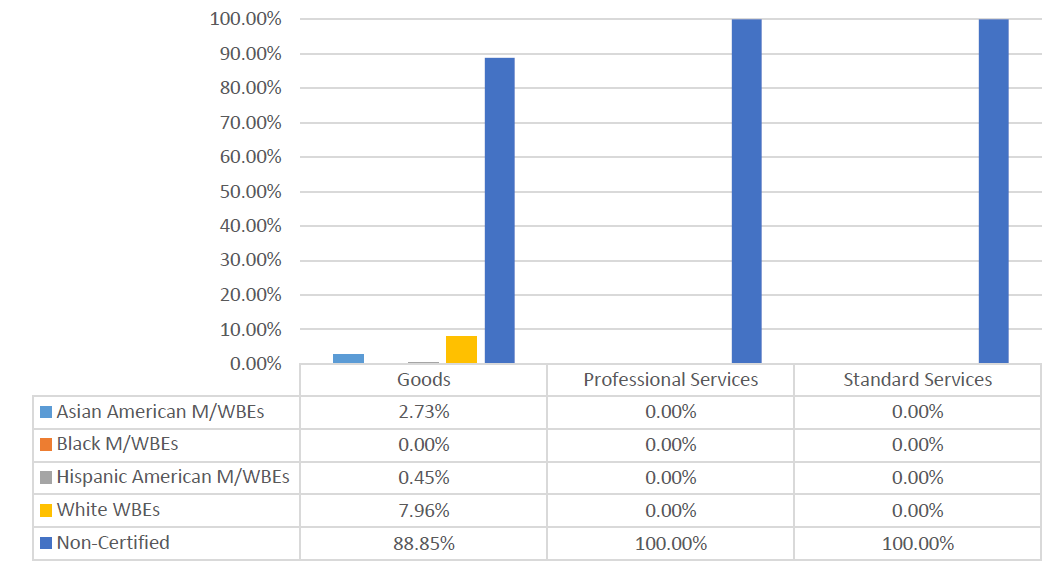
City’s Clerk Office (CLERK)
Table 84: FY23 LL 174-Eligible Contracts and POs
| Certification Status | # of Contracts | % Share of Contracts | Total Registered Contract Value | % Share of Contract Value |
| All Contracts and POs | 29 | 100.00% | $135,178 | 100.00% |
| M/WBE | 3 | 10.34% | $4,512 | 3.34% |
| Non-Certified | 26 | 89.66% | $130,667 | 96.66% |
| LL174 Contracts and POs | 29 | 100.00% | $135,178 | 100.00% |
| M/WBE | 3 | 10.34% | $4,512 | 3.34% |
| Non-Certified | 26 | 89.66% | $130,667 | 96.66% |
| LL174 Subcontracts | 0 | 0.00% | $0 | 0.00% |
| M/WBE | 0 | 0.00% | $0 | 0.00% |
| Non-Certified | 0 | 0.00% | $0 | 0.00% |
Chart 134: FY23 Value of LL 174-Eligible Prime Contracts and POs
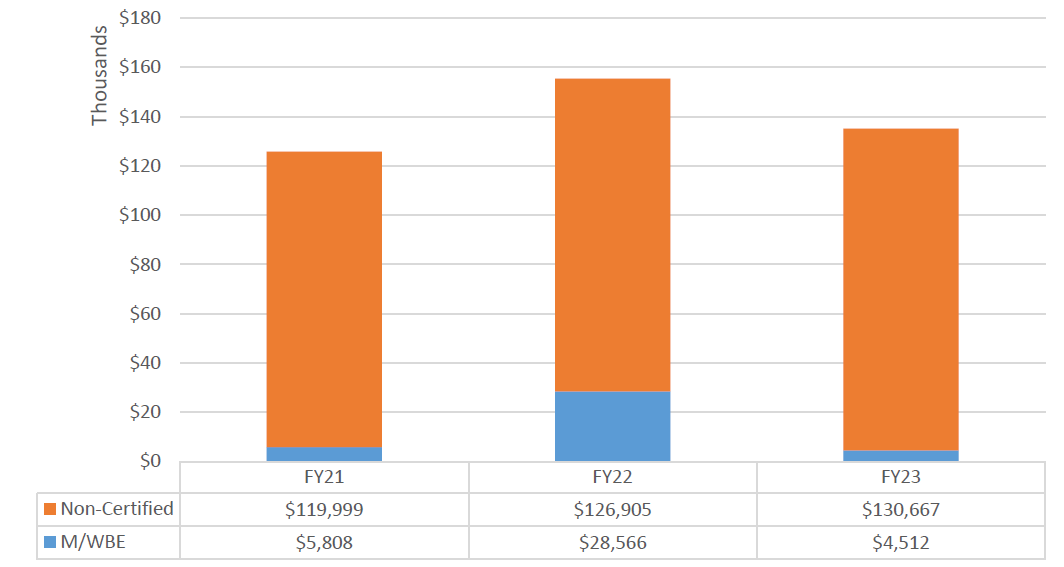
Chart 135: FY23 Value of LL 174-Eligible Contracts and POs, by Race and Gender
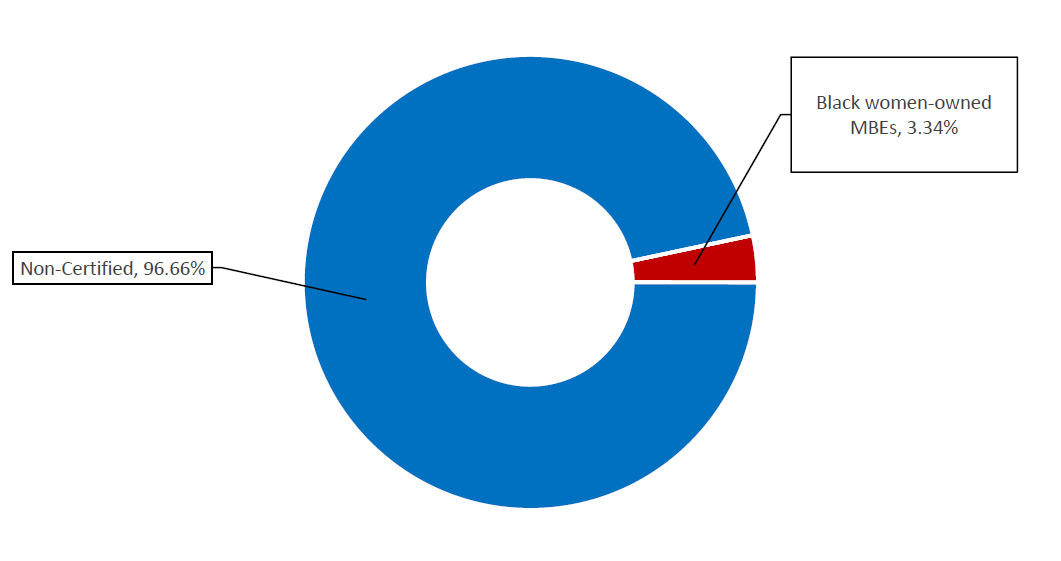
Chart 136: FY23 Share of LL 174-Eligible Contracts and PO Value, by M/WBE Category and Industry
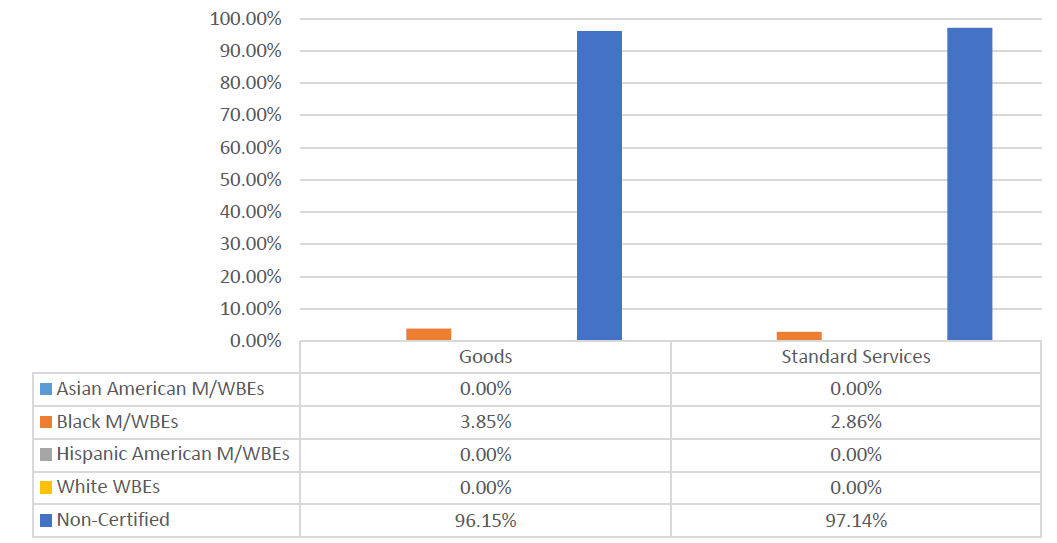
Comptroller (COMP)
The LL 174 data below represents a small share of COMP’s total procurement portfolio, which includes 15 Corpus Funded Agreements (which function as a mechanism to finance investment management services related to the City’s five pension funds) valued at nearly $7 million, which are exempt from LL 174 participation goals. Its $4.37 million in LL 174-eligible value represents less than 0.1% of the City’s total LL 174-eligible contracting portfolio.
The M/WBE and Emerging Manager Pension Investments Report released by the Comptroller’s Office in November 2023 (included as Appendix B of this Report) showed that the New York City Retirement Systems had a total of $19.5 billion in investments with or committed to M/WBE managers as of June 30, 2023. Those investments amount to 12.68% of U.S.-based actively managed assets, or approximately 8% of the total assets under management.
Table 85: FY23 LL 174-Eligible Contracts and POs
| Certification Status | # of Contracts | % Share of Contracts | Total Registered Contract Value | % Share of Contract Value |
| All Contracts and POs | 781 | 100.00% | $147,491,408 | 100.00% |
| M/WBE | 145 | 18.57% | $7,045,988 | 4.78% |
| Non-Certified | 636 | 81.43% | $140,487,966 | 95.22% |
| LL174 Contracts and POs | 300 | 100.00% | $4,370,613 | 100.00% |
| M/WBE | 136 | 45.33% | $1,850,525 | 42.34% |
| Non-Certified | 164 | 54.67% | $2,520,088 | 57.66% |
| LL174 Subcontracts | 2 | 100.00% | $577,320 | 100.00% |
| M/WBE | 2 | 100.00% | $577,320 | 100.00% |
| Non-Certified | 0 | 0.00% | $0 | 0.00% |
Chart 137: FY23 Value of LL 174-Eligible Prime Contracts and POs
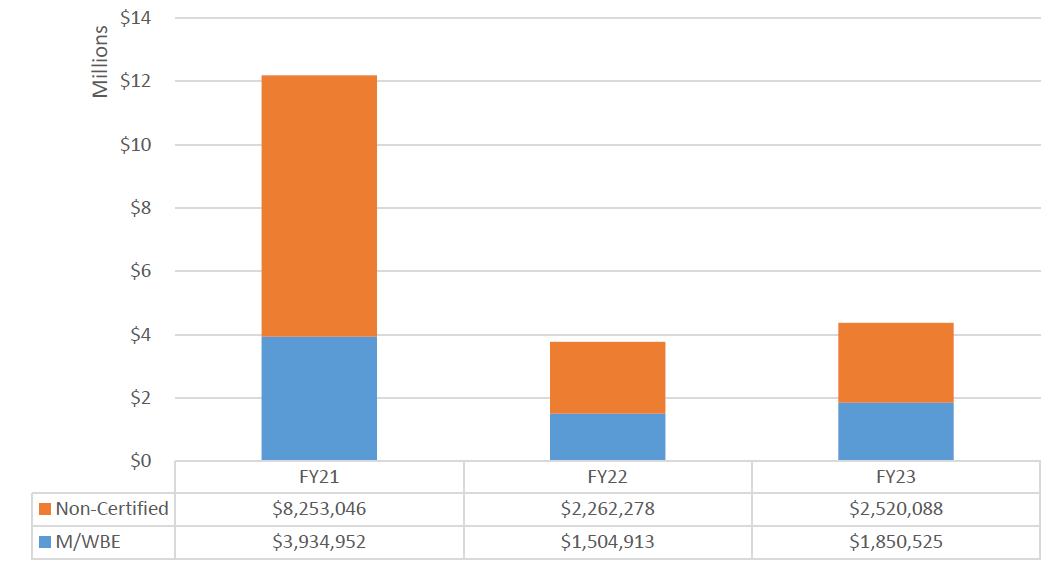
Chart 138: FY23 Value of LL 174-Eligible Contracts and POs, by Race and Gender
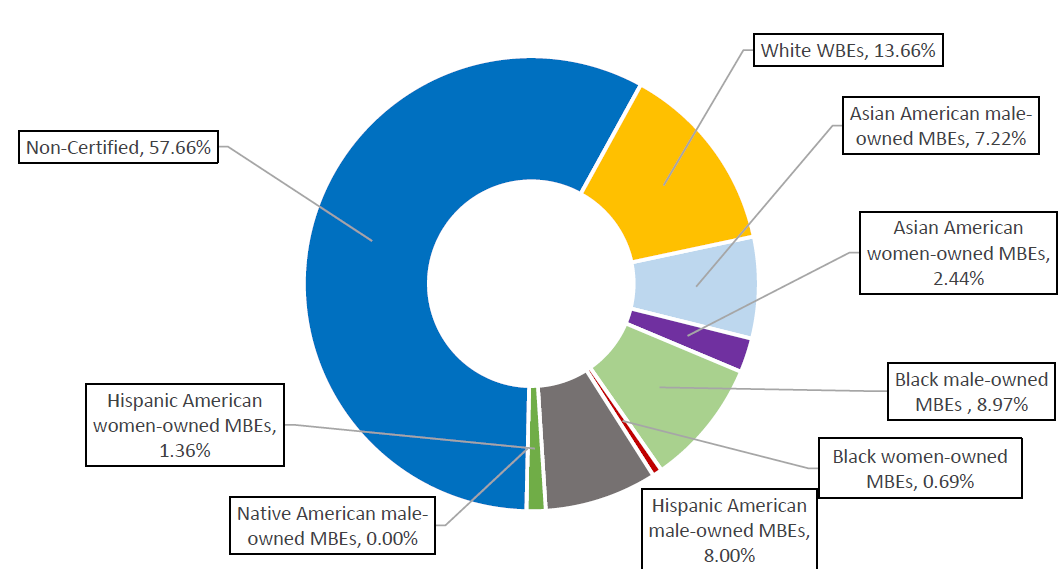
Chart 139: FY23 Share of LL 174-Eligible Contracts and PO Value, by M/WBE Category and Industry
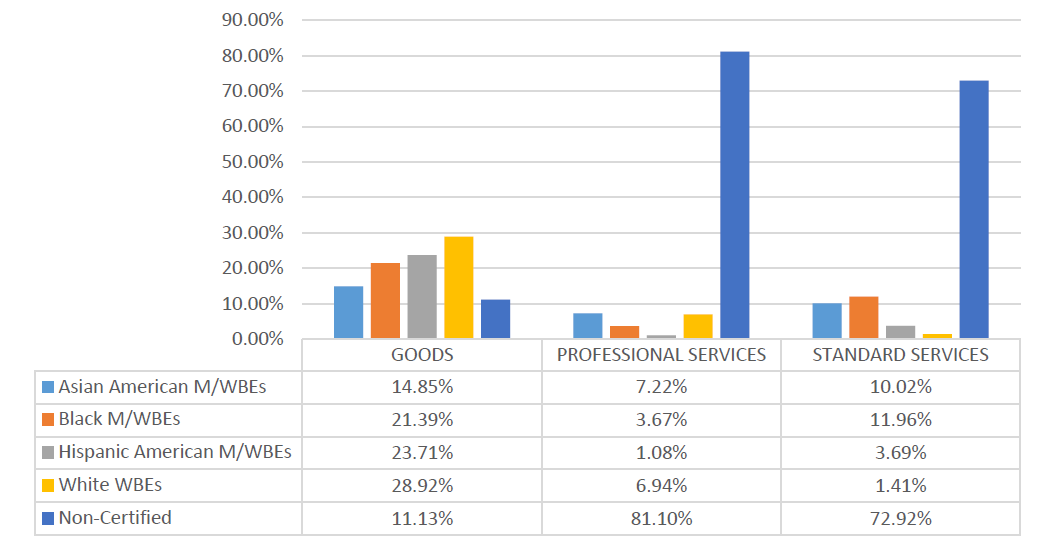
City Council (COUNCIL)
Table 86: FY23 LL 174-Eligible Contracts and POs
| Certification Status | # of Contracts | % Share of Contracts | Total Registered Contract Value | % Share of Contract Value |
| All Contracts and POs | 1,187 | 100.00% | $6,273,658 | 100.00% |
| M/WBE | 229 | 19.29% | $1,108,000 | 17.66% |
| Non-Certified | 958 | 80.71% | $5,165,658 | 82.34% |
| LL174 Contracts and POs | 982 | 100.00% | $3,871,814 | 100.00% |
| M/WBE | 228 | 23.22% | $1,105,062 | 28.54% |
| Non-Certified | 754 | 76.78% | $2,766,752 | 71.46% |
| LL174 Subcontracts | 0 | 0.00% | $0 | 0.00% |
| M/WBE | 0 | 0.00% | $0 | 0.00% |
| Non-Certified | 0 | 0.00% | $0 | 0.00% |
Chart 140: FY23 Value of LL 174-Eligible Prime Contracts and POs
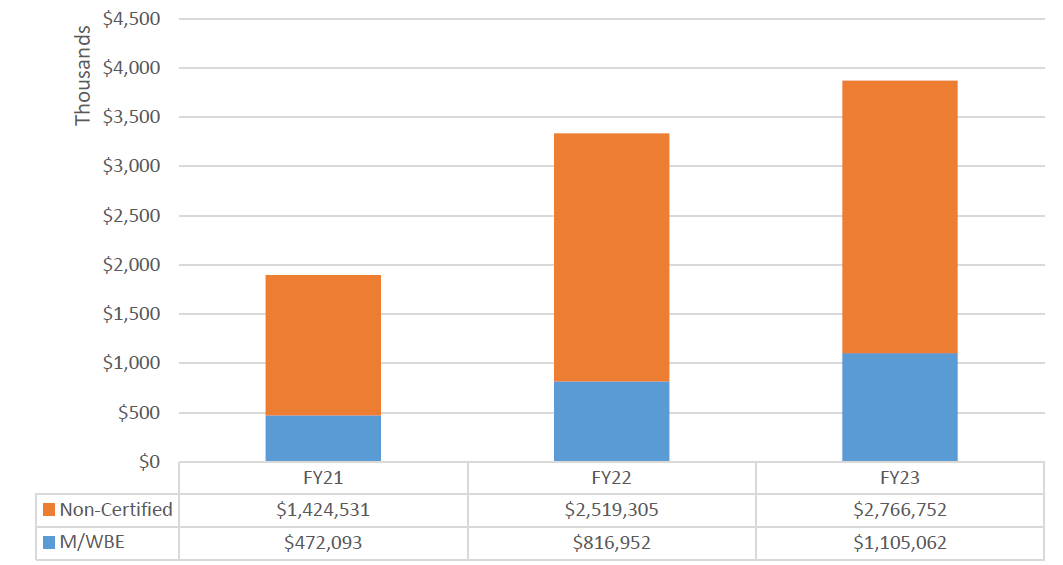
Chart 141: FY23 Value of LL 174-Eligible Contracts and POs, by Race and Gender
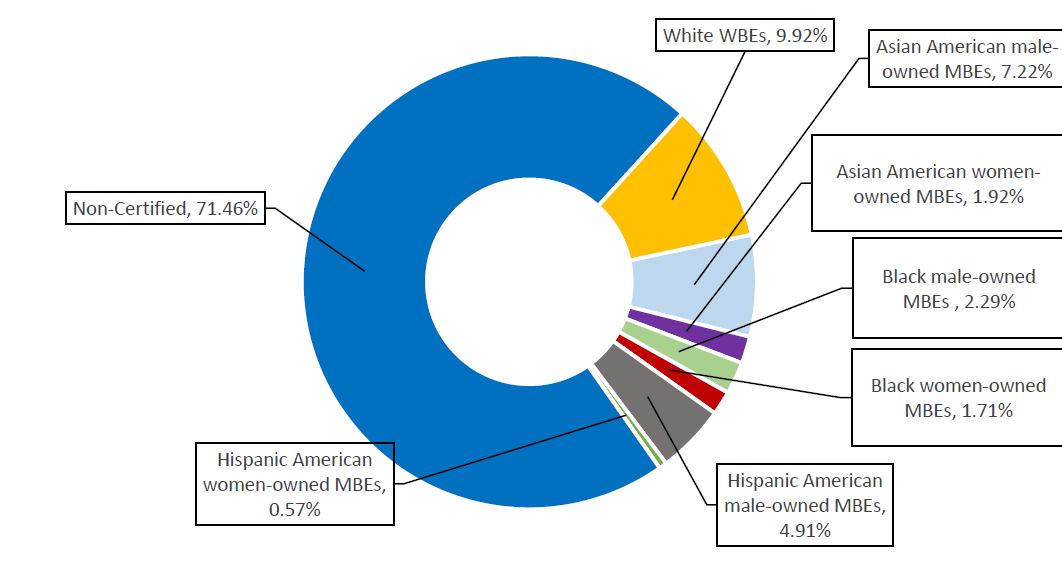
Chart 142: FY23 Share of LL 174-Eligible Contracts and PO Value, by M/WBE Category and Industry
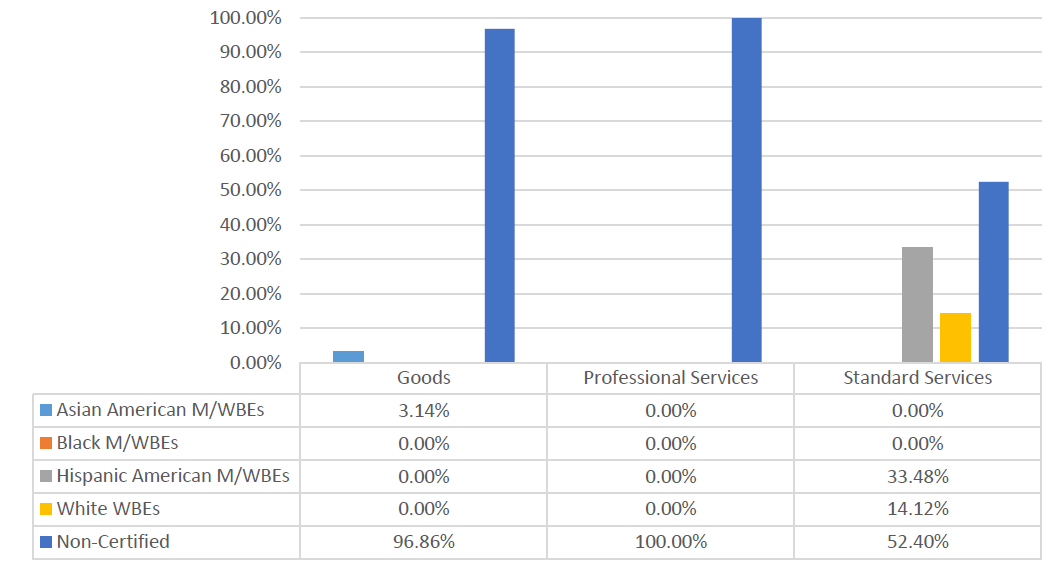
District Attorney Bronx (DABX)
Table 87: FY23 LL 174-Eligible Contracts and POs
| Certification Status | # of Contracts | % Share of Contracts | Total Registered Contract Value | % Share of Contract Value |
| All Contracts and POs | 245 | 100.00% | $5,257,049 | 100.00% |
| M/WBE | 30 | 12.24% | $1,214,466 | 23.10% |
| Non-Certified | 215 | 87.76% | $4,042,583 | 76.90% |
| LL174 Contracts and POs | 240 | 100.00% | $3,324,451 | 100.00% |
| M/WBE | 30 | 12.50% | $1,214,466 | 36.53% |
| Non-Certified | 210 | 87.50% | $2,109,985 | 63.47% |
| LL174 Subcontracts | 0 | 0.00% | $0 | 0.00% |
| M/WBE | 0 | 0.00% | $0 | 0.00% |
| Non-Certified | 0 | 0.00% | $0 | 0.00% |
Chart 143: FY23 Value of LL 174-Eligible Prime Contracts and POs
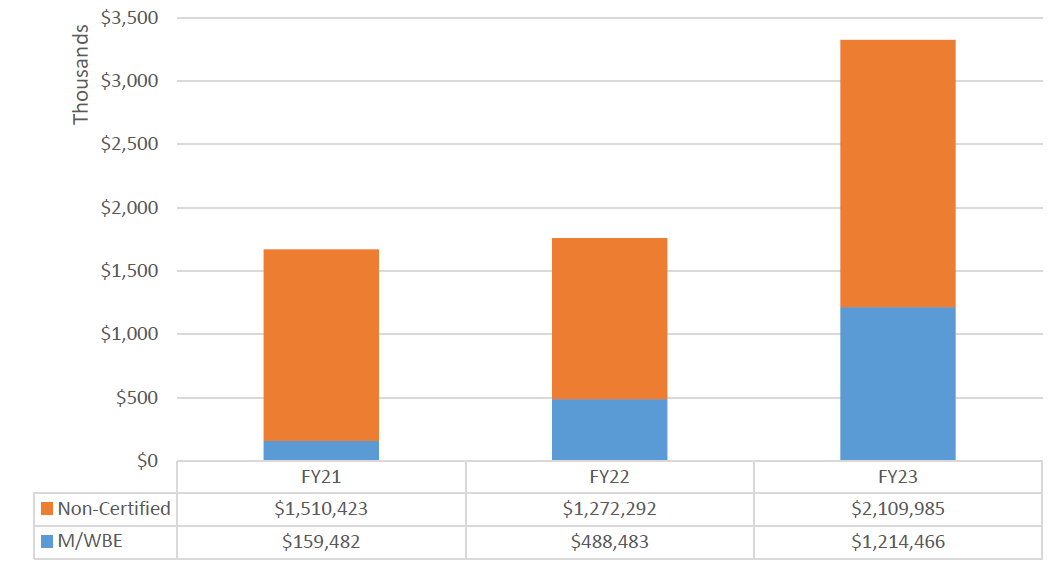
Chart 144: FY23 Value of LL 174-Eligible Contracts and POs, by Race and Gender
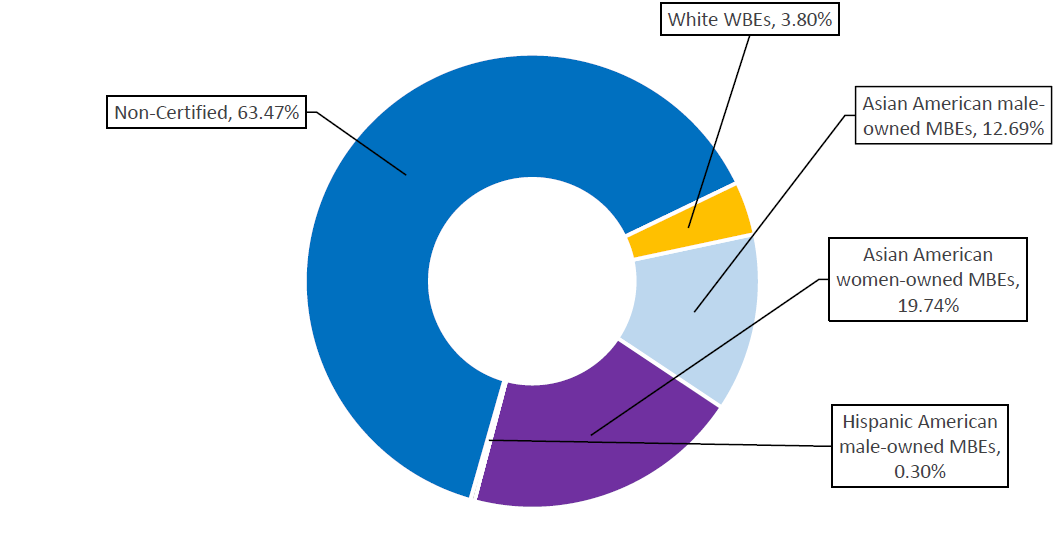
Chart 145: FY23 Share of LL 174-Eligible Contracts and PO Value, by M/WBE Category and Industry
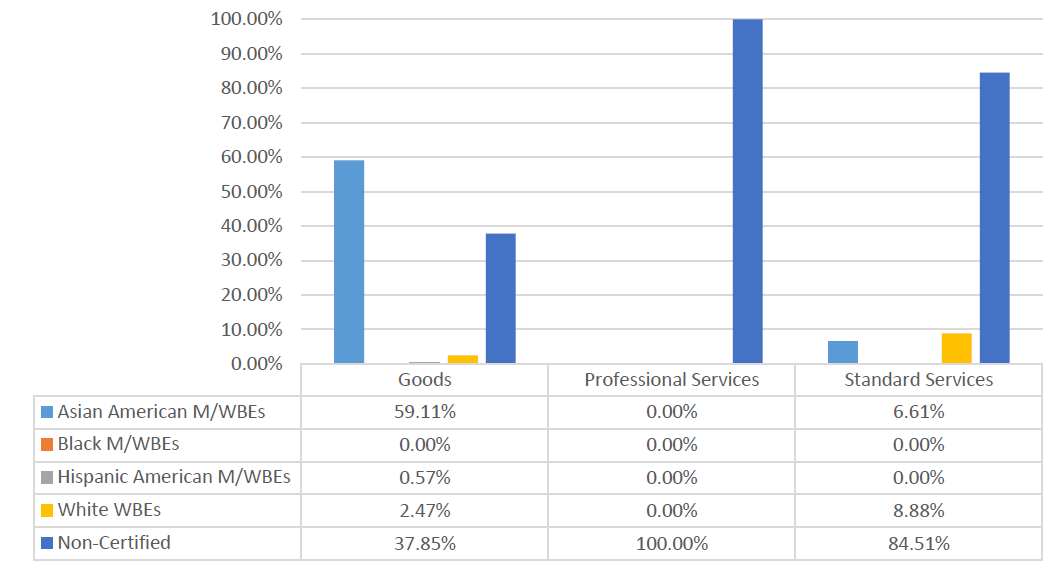
District Attorney Brooklyn (DAKINGS)
Table 88: FY23 LL 174-Eligible Contracts and POs
| Certification Status | # of Contracts | % Share of Contracts | Total Registered Contract Value | % Share of Contract Value |
| All Contracts and POs | 281 | 100.00% | $5,027,425 | 100.00% |
| M/WBE | 44 | 15.66% | $603,892 | 12.01% |
| Non-Certified | 237 | 84.34% | $4,423,533 | 87.99% |
| LL174 Contracts and POs | 275 | 100.00% | $2,286,355 | 100.00% |
| M/WBE | 44 | 16.00% | $603,892 | 26.41% |
| Non-Certified | 231 | 84.00% | $1,682,463 | 73.59% |
| LL174 Subcontracts | 0 | 0.00% | $0 | 0.00% |
| M/WBE | 0 | 0.00% | $0 | 0.00% |
| Non-Certified | 0 | 0.00% | $0 | 0.00% |
Chart 146: FY23 Value of LL 174-Eligible Prime Contracts and POs
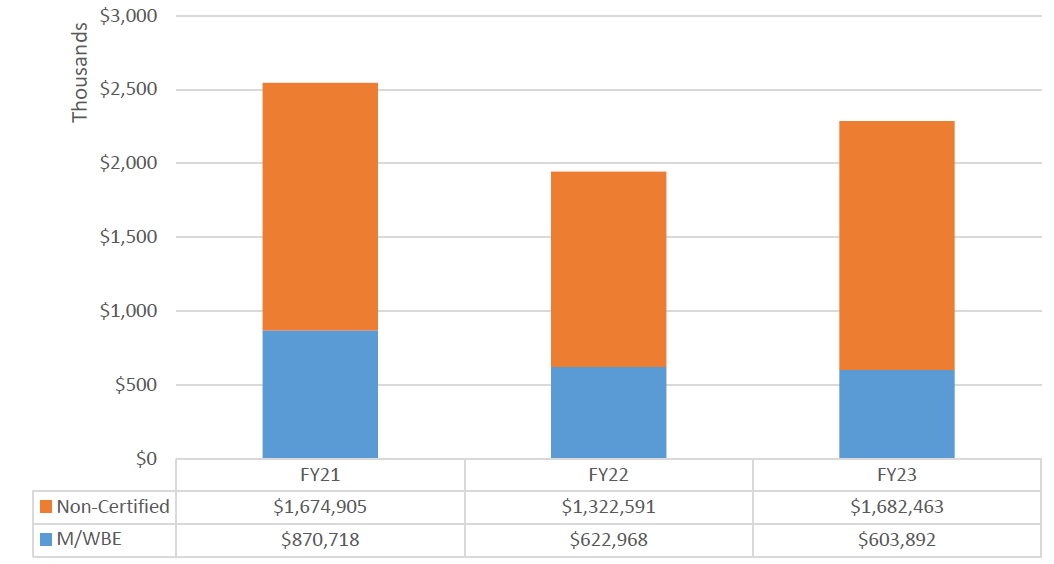
Chart 147: FY23 Value of LL 174-Eligible Contracts and POs, by Race and Gender
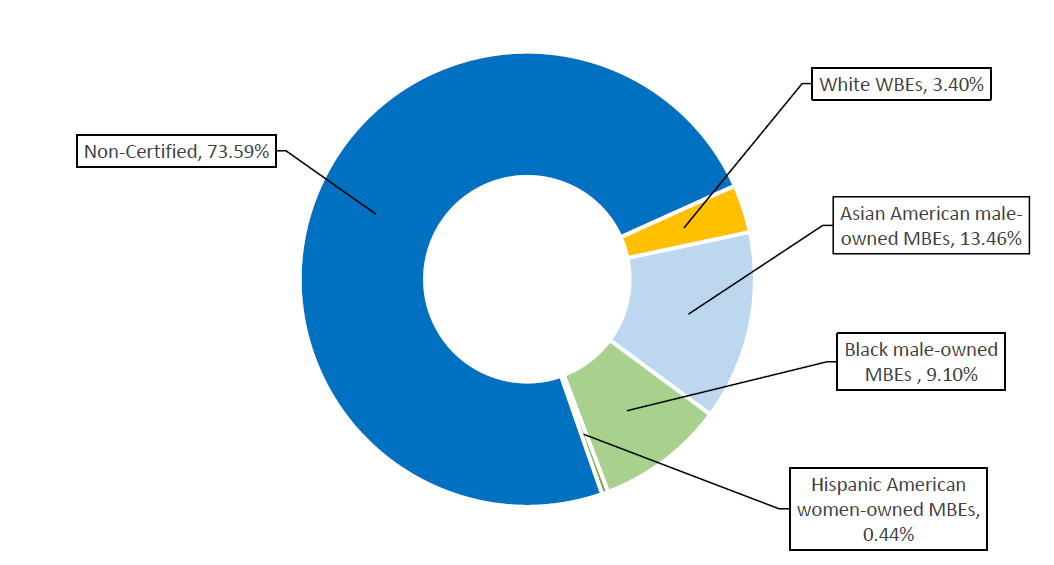
Chart 148: FY23 Share of LL 174-Eligible Contracts and PO Value, by M/WBE Category and Industry
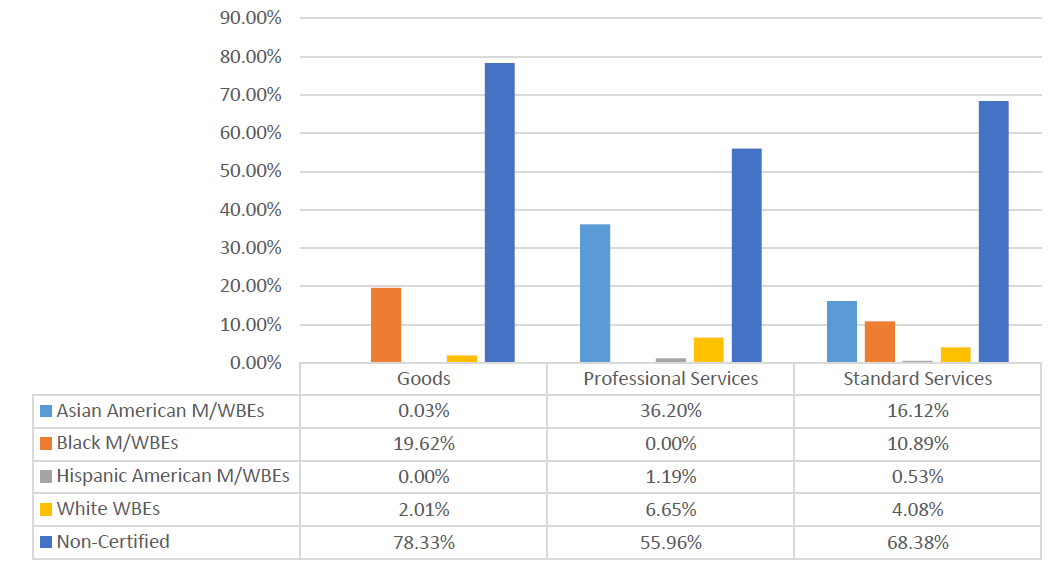
District Attorney New York (DANY)
Table 89: FY23 LL 174-Eligible Contracts and POs
| Certification Status | # of Contracts | % Share of Contracts | Total Registered Contract Value | % Share of Contract Value |
| All Contracts and POs | 563 | 100.00% | $11,657,229 | 100.00% |
| M/WBE | 125 | 22.20% | $7,566,638 | 64.91% |
| Non-Certified | 438 | 77.80% | $4,090,591 | 35.09% |
| LL174 Contracts and POs | 525 | 100.00% | $4,759,270 | 100.00% |
| M/WBE | 121 | 23.05% | $2,444,148 | 51.36% |
| Non-Certified | 404 | 76.95% | $2,315,122 | 48.64% |
| LL174 Subcontracts | 0 | 0.00% | $0 | 0.00% |
| M/WBE | 0 | 0.00% | $0 | 0.00% |
| Non-Certified | 0 | 0.00% | $0 | 0.00% |
Chart 149: FY23 Value of LL 174-Eligible Prime Contracts and POs
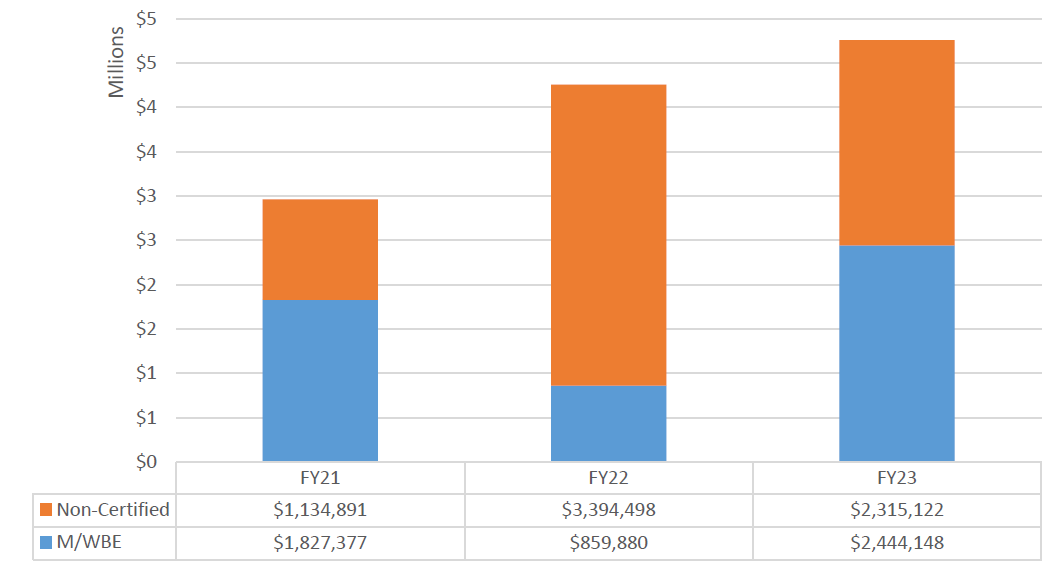
Chart 150: FY23 Value of LL 174-Eligible Contracts and POs, by Race and Gender
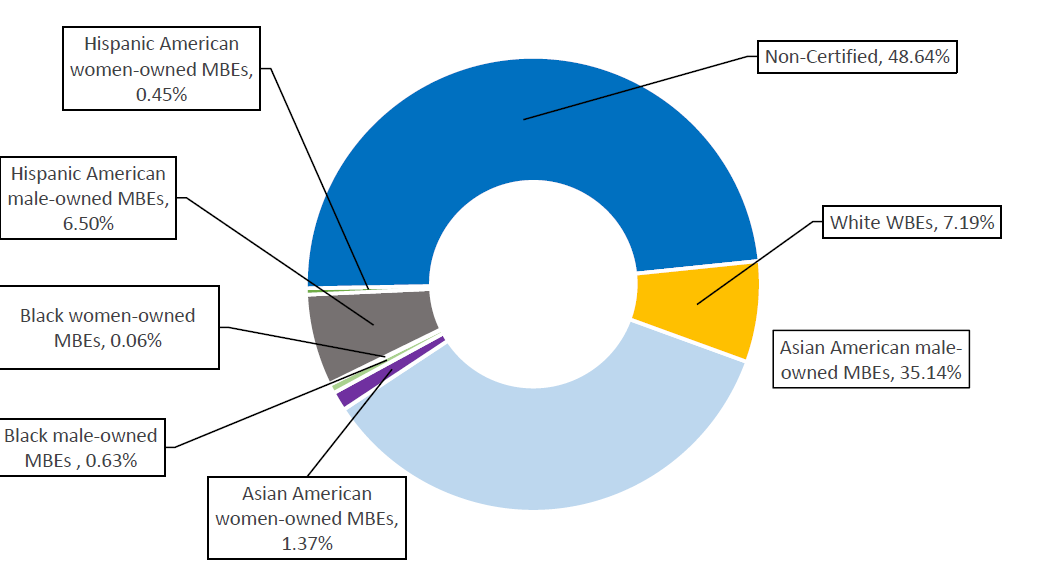
Chart 151: FY23 Share of LL 174-Eligible Contracts and PO Value, by M/WBE Category and Industry
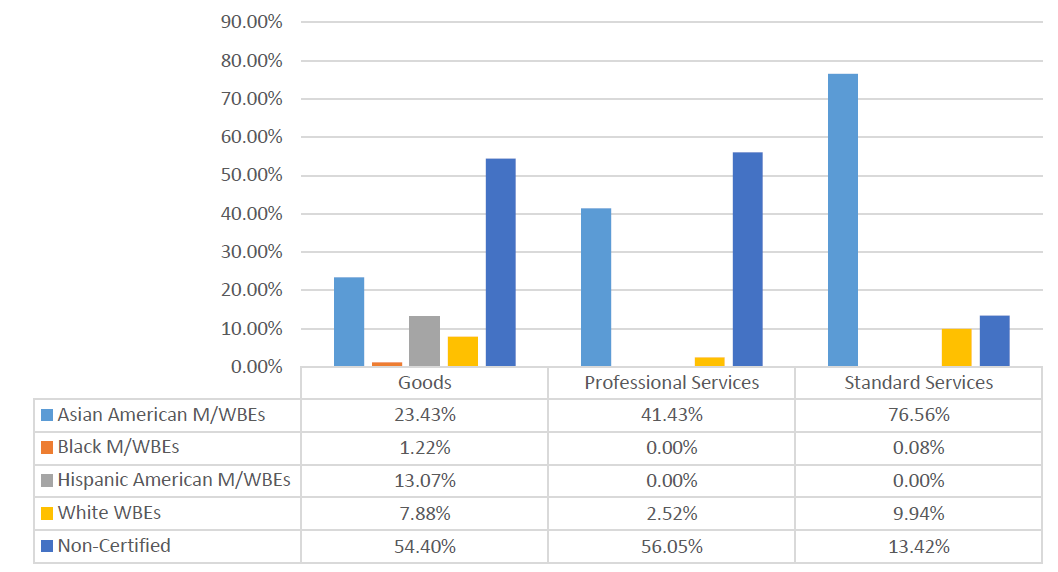
District Attorney Queens (DAQ)
Table 90: FY23 LL 174-Eligible Contracts and POs
| Certification Status | # of Contracts | % Share of Contracts | Total Registered Contract Value | % Share of Contract Value |
| All Contracts and POs | 325 | 100.00% | $2,374,719 | 100.00% |
| M/WBE | 67 | 20.68% | $643,728 | 27.14% |
| Non-Certified | 258 | 79.38% | $1,730,992 | 72.89% |
| LL174 Contracts and POs | 318 | 100.00% | $1,755,191 | 100.00% |
| M/WBE | 67 | 21.07% | $643,728 | 36.68% |
| Non-Certified | 251 | 78.93% | $1,111,463 | 63.32% |
| LL174 Subcontracts | 0 | 0.00% | $0 | 0.00% |
| M/WBE | 0 | 0.00% | $0 | 0.00% |
| Non-Certified | 0 | 0.00% | $0 | 0.00% |
Chart 152: FY23 Value of LL 174-Eligible Prime Contracts and POs
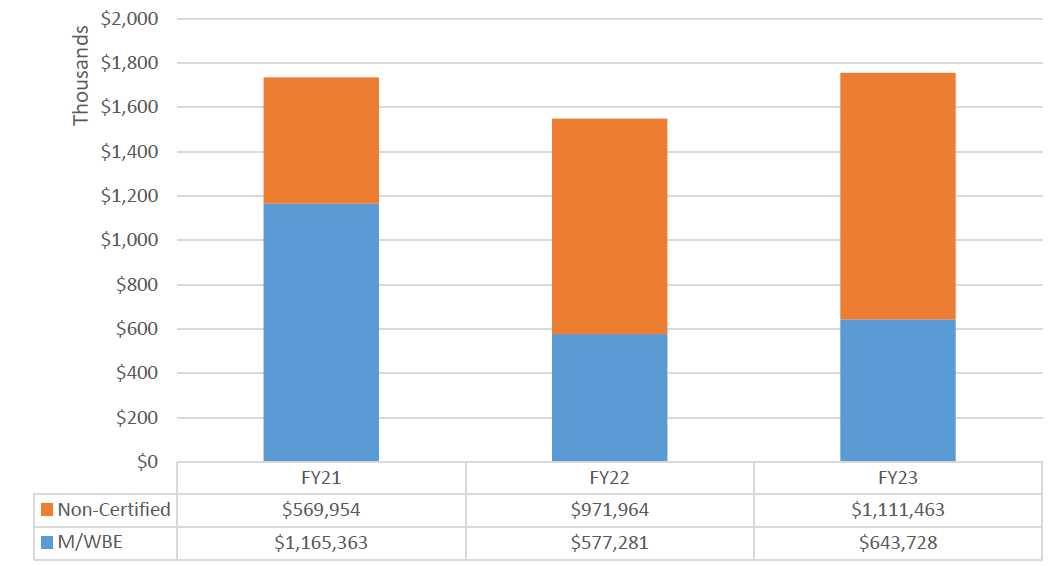
Chart 153: FY23 Value of LL 174-Eligible Contracts and POs, by Race and Gender
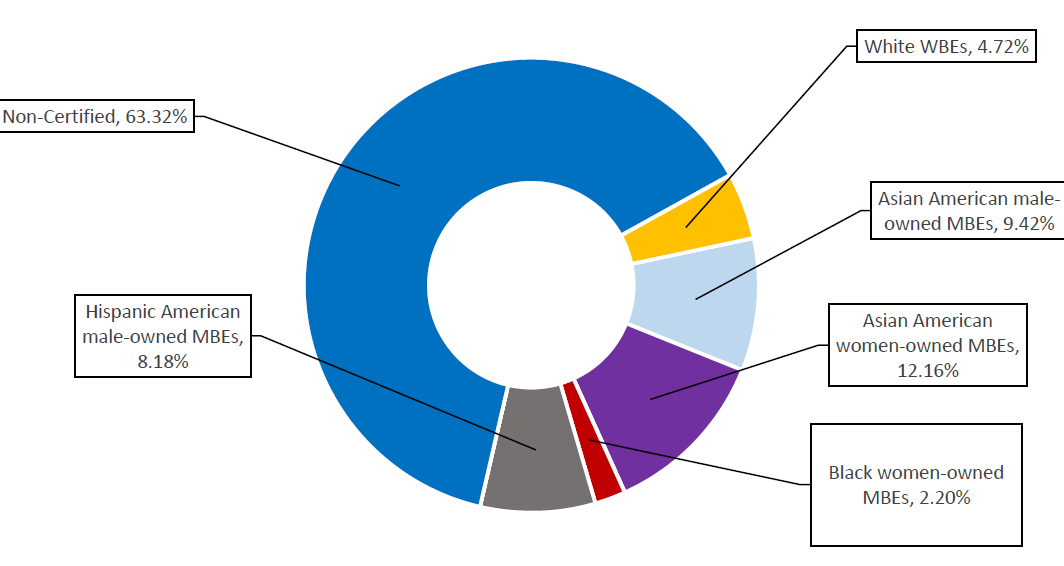
Chart 154: FY23 Share of LL 174-Eligible Contracts and PO Value, by M/WBE Category and Industry
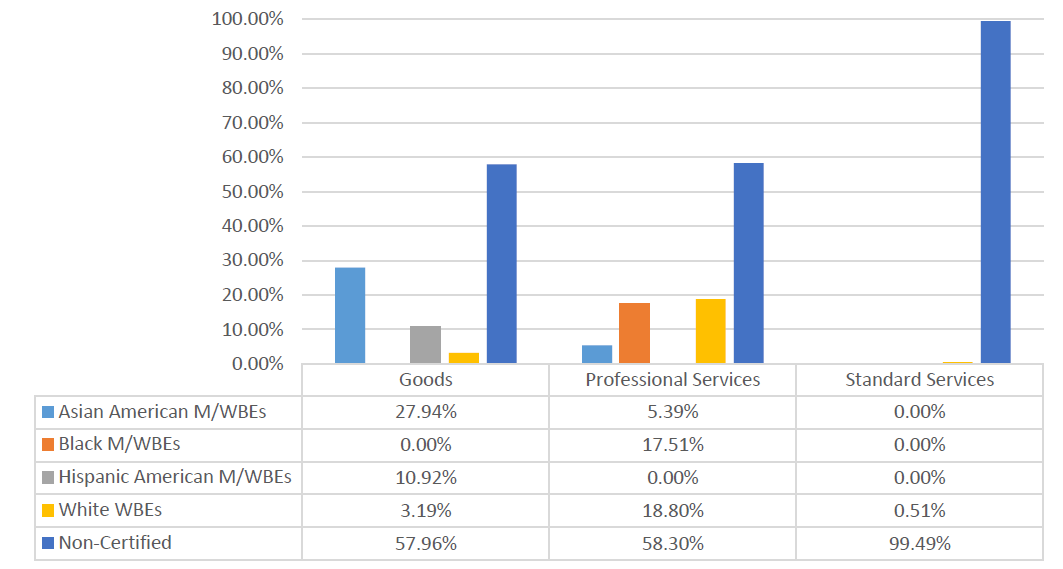
District Attorney Staten Island (DARICH)
Table 91: FY23 LL 174-Eligible Contracts and POs
| Certification Status | # of Contracts | % Share of Contracts | Total Registered Contract Value | % Share of Contract Value |
| All Contracts and POs | 125 | 100.00% | $1,580,455 | 100.00% |
| M/WBE | 57 | 45.60% | $349,114 | 22.09% |
| Non-Certified | 68 | 54.40% | $1,231,341 | 77.91% |
| LL174 Contracts and POs | 112 | 100.00% | $569,230 | 100.00% |
| M/WBE | 57 | 50.89% | $349,114 | 61.33% |
| Non-Certified | 55 | 49.11% | $220,116 | 38.67% |
| LL174 Subcontracts | 0 | 0.00% | $0 | 0.00% |
| M/WBE | 0 | 0.00% | $0 | 0.00% |
| Non-Certified | 0 | 0.00% | $0 | 0.00% |
Chart 155: FY23 Value of LL 174-Eligible Prime Contracts and POs
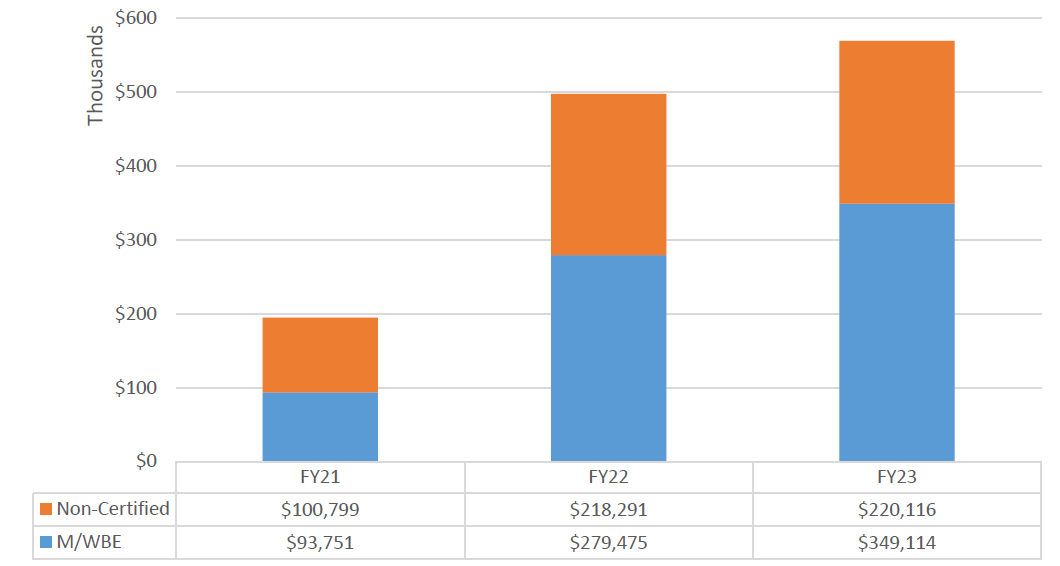
Chart 156: FY23 Value of LL 174-Eligible Contracts and POs, by Race and Gender
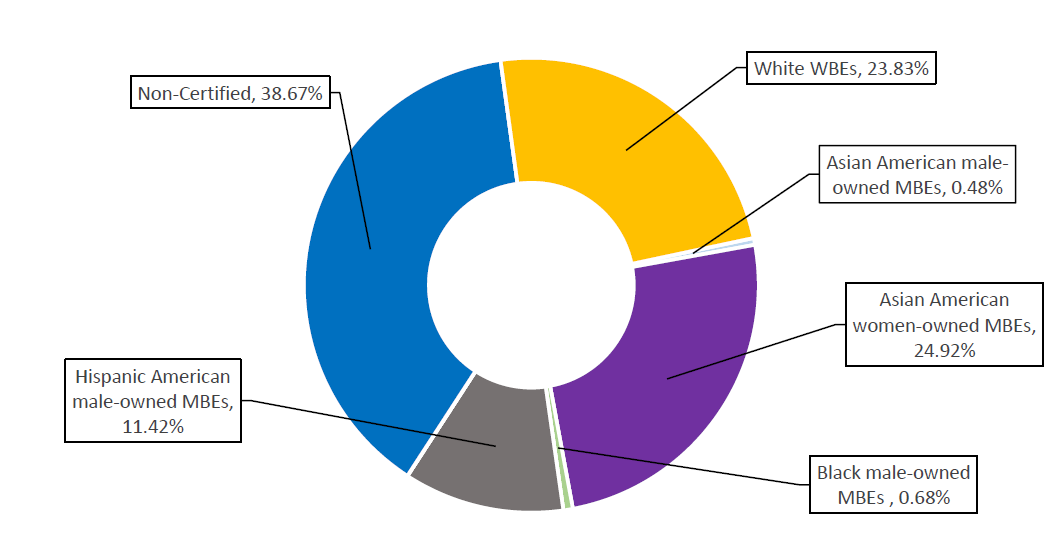
Chart 157: FY23 Share of LL 174-Eligible Contracts and PO Value, by M/WBE Category and Industry
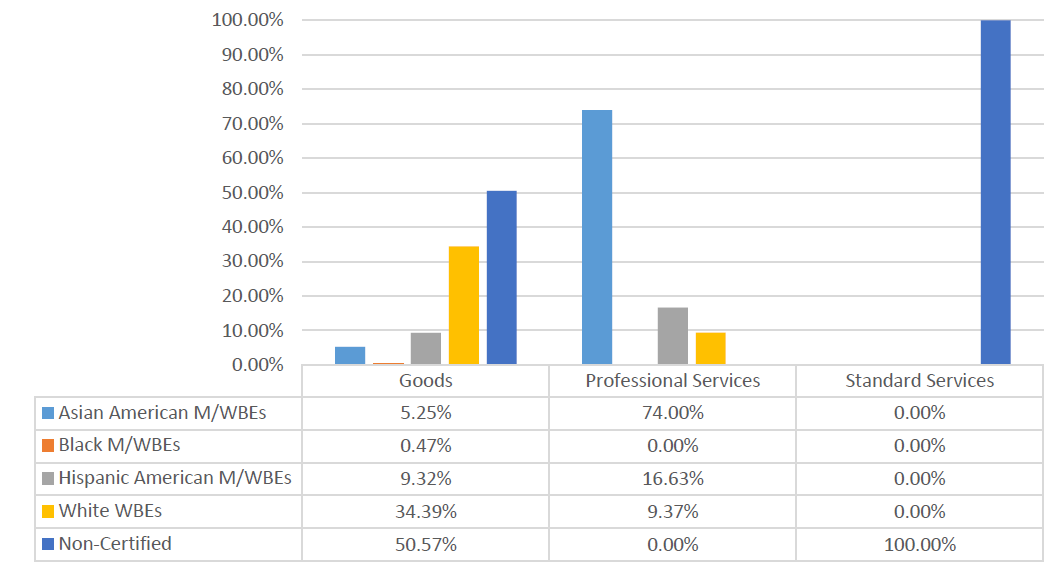
Public Advocate (PUB ADV)
Table 92: FY23 LL 174-Eligible Contracts and POs
| Certification Status | # of Contracts | % Share of Contracts | Total Registered Contract Value | % Share of Contract Value |
| All Contracts and POs | 72 | 100.00% | $307,495 | 100.00% |
| M/WBE | 14 | 19.44% | $77,518 | 25.21% |
| Non-Certified | 58 | 80.56% | $229,978 | 74.79% |
| LL174 Contracts and POs | 72 | 100.00% | $307,495 | 100.00% |
| M/WBE | 14 | 19.44% | $77,518 | 25.21% |
| Non-Certified | 58 | 80.56% | $229,978 | 74.79% |
| LL174 Subcontracts | 0 | 0.00% | $0 | 0.00% |
| M/WBE | 0 | 0.00% | $0 | 0.00% |
| Non-Certified | 0 | 0.00% | $0 | 0.00% |
Chart 158: FY23 Value of LL 174-Eligible Prime Contracts and POs
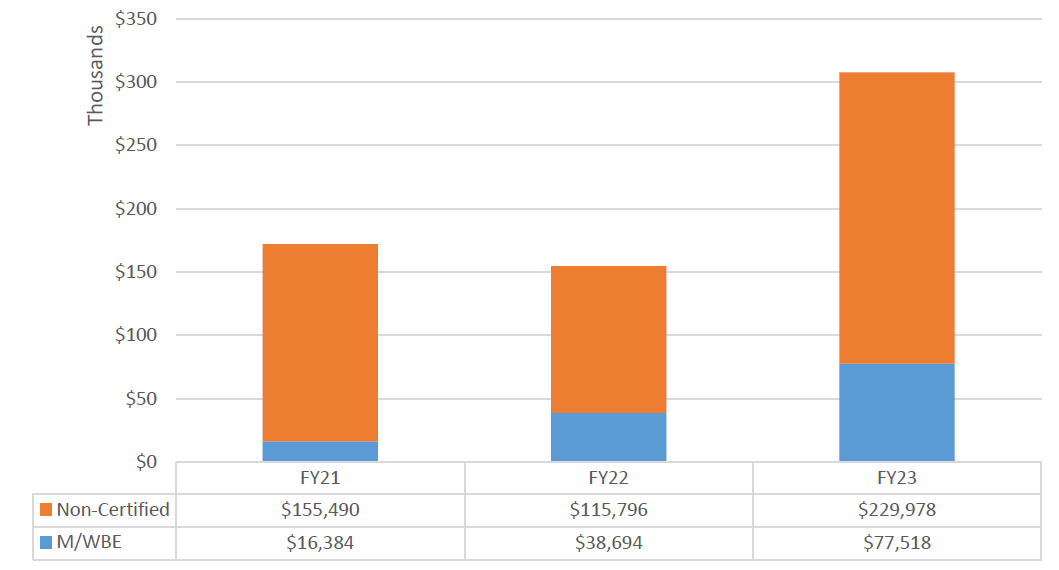
Chart 159: FY23 Value of LL 174-Eligible Contracts and POs, by Race and Gender
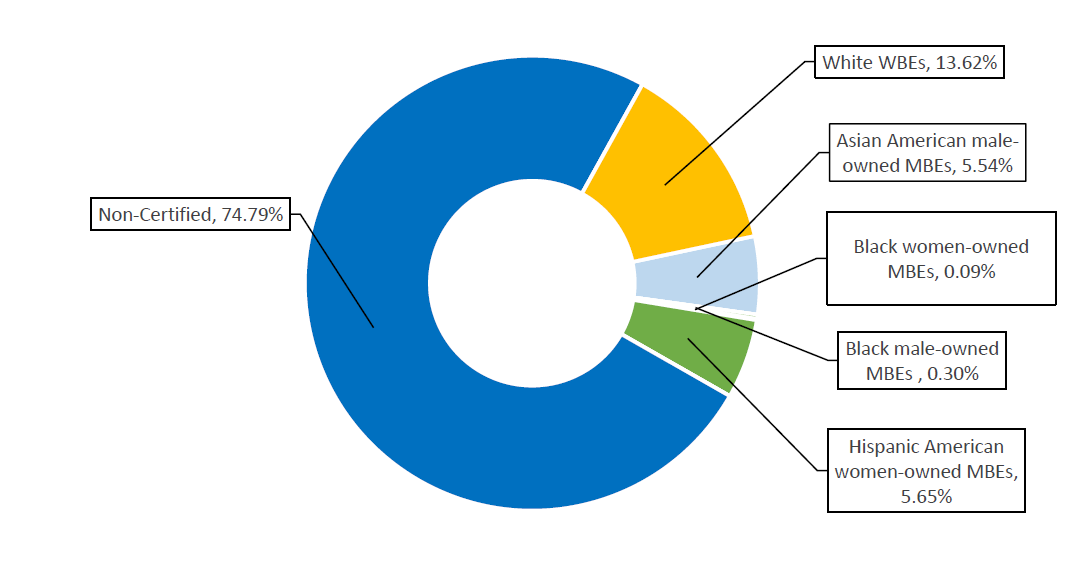
Chart 160: FY23 Share of LL 174-Eligible Contracts and PO Value, by M/WBE Category and Industry
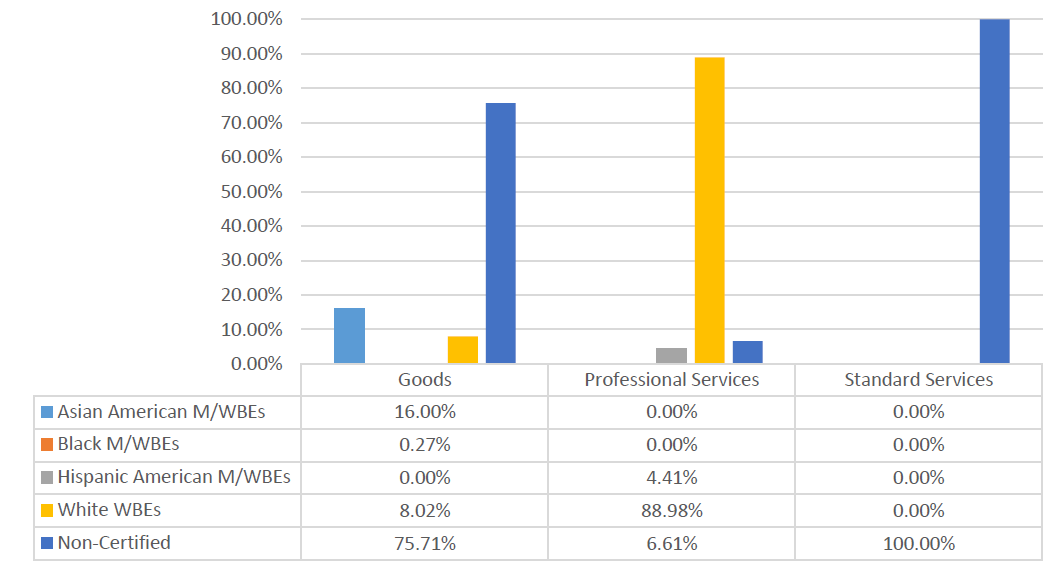
M/WBE Utilization by Industry
M/WBE utilization varies across different industries. M/WBEs receive the highest relative volume of contracts and POs in Standard Services procurements, then in Goods. This is consistent with prior fiscal years.
Table 93: FY23 Count of LL 174-Eligible Contract Registrations and POs, by Industry
| M/WBE | Non-Certified | |||
|---|---|---|---|---|
| Industry | # of Contracts | % of Industry Specific Contracts | # of Contracts | % of Industry Specific Contracts |
| Construction Services[62] | 207 | 41.32% | 294 | 58.68% |
| Goods | 5,349 | 54.70% | 4,430 | 45.30% |
| Professional Services | 689 | 38.43% | 1,104 | 61.57% |
| Standard Services | 10,091 | 70.47% | 4,229 | 29.53% |
| Grand Total | 16,336 | 61.90% | 10,057 | 38.10% |
These analyses also highlight places where a large share of contracts are registered to M/WBEs, but those contracts are for low-dollar-value items. This contract is particularly stark for standard services (where M/WBEs represent 70% of the contract volume, but only 12% of the contract value) and construction services (where M/WBEs represent 41% of contract volume, but only 7.5% of the value).
Table 94: FY23 Value of LL 174-Eligible Contract Registrations and POs, by Industry
| M/WBE | Non-Certified | |||
|---|---|---|---|---|
| Industry | Total Contract and PO Value | % Share of PO and Contract Value | Total Contract and PO Value | % Share of PO and Contract Value |
| Construction | $244,140,108 | 7.50% | $3,010,027,727 | 92.50% |
| Goods | $108,509,861 | 63.88% | $61,346,485 | 36.12% |
| Professional Services | $463,911,348 | 21.63% | $1,681,146,490 | 78.37% |
| Standard Services | $111,198,858 | 12.20% | $800,249,022 | 87.80% |
| Grand Total | $927,760,175 | 14.32% | $5,552,769,725 | 85.68% |
The average value of contracts subject to LL 174 participation goals in goods are closest to parity between M/WBE and Non-Certified firms relative to all other industries (roughly $82,000 vs $80,000). Still, the average value of contracts for M/WBEs are only about two thirds the average value of non-certified firms. While this signals that the City is more effectively utilizing M/WBEs in the Goods industry, contracts in this category of procurement are typically the lowest value given that LL 174 caps goals on Goods purchases up to and including $1 million.
Table 95: FY23 Average Value of LL 174-Eligible Registered Contracts, by Industry
| M/WBE | Non-Certified | ||
|---|---|---|---|
| Industry | Average Value | Average Value | Ratio of Avg Value: M/WBE to Non-Certified |
| Construction | $1,610,689 | $16,349,255 | 9.85% |
| Goods | $82,931 | $80,375 | 103.18% |
| Professional Services | $1,095,771 | $6,675,962 | 16.41% |
| Standard Services | $441,969 | $2,732,745 | 16.17% |
Construction
PPB Rules define the construction services industry as dealing in the planning, design, or construction of real property or other public improvements[63]. In addition to engineering and construction work, this industry also includes contracts for painting, carpentry, plumbing and electrical installation, asbestos and lead abatement, carpet installation and removal, and demolition.
Disaggregated disparities are especially stark for construction services contracts. This is particularly true for women-owned firms. Only 3.6% of the value of construction services contracts were registered businesses owned by women. Worse, virtually 0% of the value of contracts for construction services registered in FY23 were registered to businesses owned by women of color. Of the 501 contracts and POs registered for construction services in FY23, only 3 were registered to businesses owned by women of color (0.6%).
Table 96: FY23 Construction Industry LL 174-Eligible Contract Registrations and POs, by Race and Gender[64]
| M/WBE Category | # of Contracts and POs | % Share of Contracts and POs | Total Contract and PO Value | % Share of Contract and PO Value | AVG Contract Value[65] |
| ALL M/WBEs (Excluding Non-Certified) | 207 | 41.32% | $244,140,108 | 7.50% | $1,610,689 |
| Asian American male-owned MBEs | 95 | 18.96% | $92,770,312 | 2.85% | $1,249,407 |
| Asian American women-owned MBEs | 3 | 0.60% | $4,207,024 | 0.13% | $1,402,341 |
| Black male-owned MBEs | 18 | 3.59% | $5,835,500 | 0.18% | $631,863 |
| Black women-owned MBEs | 3 | 0.60% | $2,009,800 | 0.06% | $1,000,000 |
| Hispanic American male-owned MBEs | 23 | 4.59% | $28,361,158 | 0.87% | $1,568,898 |
| Hispanic American women-owned MBEs | 2 | 0.40% | $1,600,970 | 0.05% | $1,580,970 |
| White WBEs | 63 | 12.57% | $109,355,343 | 3.36% | $2,478,249 |
| Non-Certified | 294 | 58.68% | $3,010,027,727 | 92.50% | $16,349,255 |
| Grand Total | 501 | 100.00% | $3,254,167,835 | 100.00% | $9,705,902 |
Chart 161: Share of Construction Contract and PO Value, FY20-23
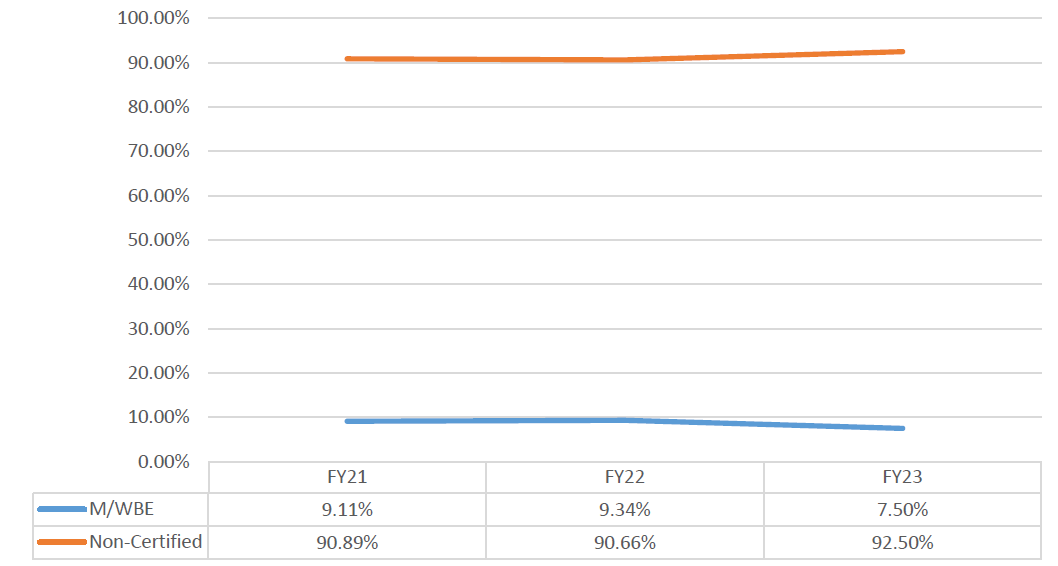
Goods Under $1 Million
The goods industry is made up of contracts for physical items and personal property, including but not limited to equipment, materials, printing, and insurance.[66] Procurements related to consumables such as food and fuel may also fall into the Goods industry. Absent directives to delegate this authority, DCAS is mandated under the Charter to purchase, inspect, store, and distribute all goods, supplies, materials, equipment, and other personal property required by any City agency.[67] In some circumstances, including for the use of the M/WBE NCSP method, DCAS may delegate this authority to agencies in furtherance of allowing agencies to use their discretion to award contracts to M/WBEs.[68]
Agencies most effectively utilize M/WBEs to purchase goods under $1 million, though it is noteworthy that these purchases are not very lucrative and individual purchases don’t necessarily have as much power to support a growing M/WBE. The highest share of goods contract registrations going to M/WBEs went to businesses owned by white women.
Table 97: FY23 Goods (Under $1 Million) LL 174-Eligible Contract Registrations and POs, by Race and Gender
| M/WBE Category | # of Contracts and POs | % Share of Contracts and POs | Total Contract and PO Value | % Share of Contract and PO Value | AVG Contract Value[69] |
| ALL M/WBEs (Excluding Non-Certified) | 5,349 | 54.70% | $108,509,861 | 63.88% | $82,931 |
| Asian American male-owned MBEs | 718 | 7.34% | $12,956,896 | 7.63% | $77,775 |
| Asian American women-owned MBEs | 268 | 2.74% | $7,502,284 | 4.42% | $75,086 |
| Black male-owned MBEs | 594 | 6.07% | $19,061,062 | 11.22% | $112,830 |
| Black women-owned MBEs | 182 | 1.86% | $3,121,345 | 1.84% | $45,900 |
| Hispanic American male-owned MBEs | 799 | 8.17% | $16,214,375 | 9.55% | $75,024 |
| Hispanic American women-owned MBEs | 192 | 1.96% | $3,387,847 | 1.99% | $58,875 |
| Native American male-owned MBEs | 1 | 0.01% | $6,409 | 0.00% | $0 |
| White WBEs | 2,595 | 26.54% | $46,259,642 | 27.23% | $85,580 |
| Non-Certified | 4,430 | 45.30% | $61,346,485 | 36.12% | $80,375 |
| Grand Total | 9,779 | 100.00% | $169,856,346 | 100.00% | $82,077 |
Chart 162: Share of Goods (Under $1 million) Contract and PO Value, FY21-23
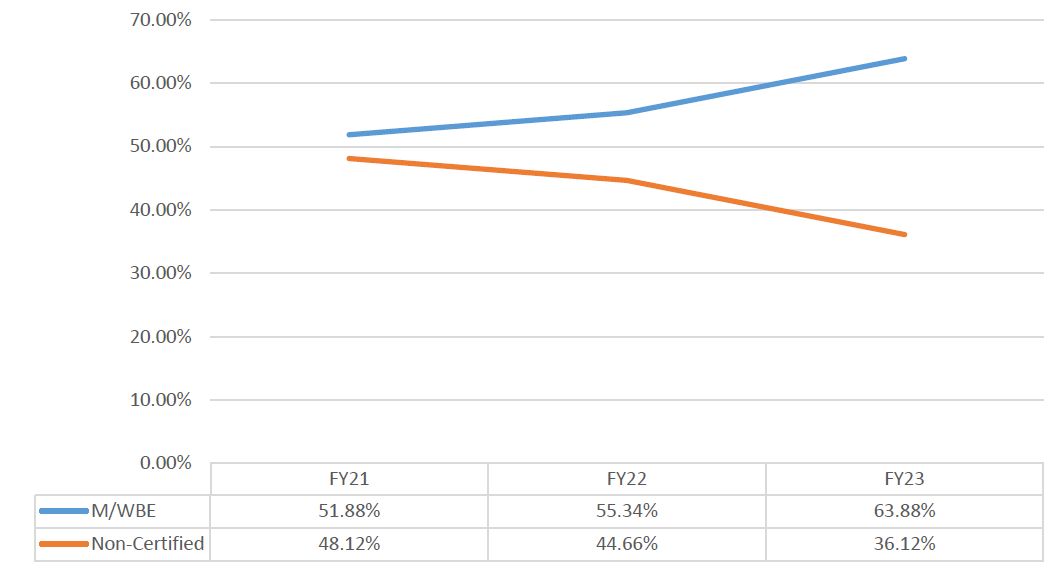
Professional Services
The professional services industry includes contracts for the provision of various kinds of expert advice and consulting, including legal services, medical services, and information technology and construction-related consulting.[70] 38% of LL 174-eligible professional services contracts were registered to M/WBEs – representing 22% of the contract value. This is a 10% decrease in value from FY22. The disaggregated analyses of this sector show trends that are consistent with Citywide totals. However, it is noteworthy that the average value of a professional services contract registered to a business owned by an Asian American male exceeds the average value of professional services contracts registered to non-certified firms.
Table 98: FY23 Professional Services LL 174-Eligible Contract Registrations and POs, by Race and Gender
| M/WBE Category | # of Contracts and POs | % Share of Contracts and POs | Total Contract and PO Value | % Share of Contract and PO Value | AVG Contract Value[71] |
| ALL M/WBEs (Excluding Non-Certified) | 689 | 38.43% | $463,911,348 | 21.63% | $1,095,771 |
| Asian American male-owned MBEs | 137 | 7.64% | $211,043,479 | 9.84% | $2,264,771 |
| Asian American women-owned MBEs | 132 | 7.36% | $36,462,361 | 1.70% | $433,574 |
| Black male-owned MBEs | 94 | 5.24% | $69,727,402 | 3.25% | $938,951 |
| Black women-owned MBEs | 59 | 3.29% | $24,228,654 | 1.13% | $547,916 |
| Hispanic American male-owned MBEs | 76 | 4.24% | $23,769,846 | 1.11% | $487,936 |
| Hispanic American women-owned MBEs | 42 | 2.34% | $2,766,358 | 0.13% | $149,330 |
| Native American male-owned MBEs | 4 | 0.22% | $144,100 | 0.01% | $47,572 |
| White WBEs | 145 | 8.09% | $95,769,148 | 4.46% | $1,610,443 |
| Non-Certified | 1,104 | 61.57% | $1,681,146,490 | 78.37% | $6,675,962 |
| Grand Total | 1,793 | 100.00% | $2,145,057,838 | 100.00% | $3,180,038 |
Chart 163: Share of Professional Services LL 174-Eligible Contract and PO Value, FY21-23
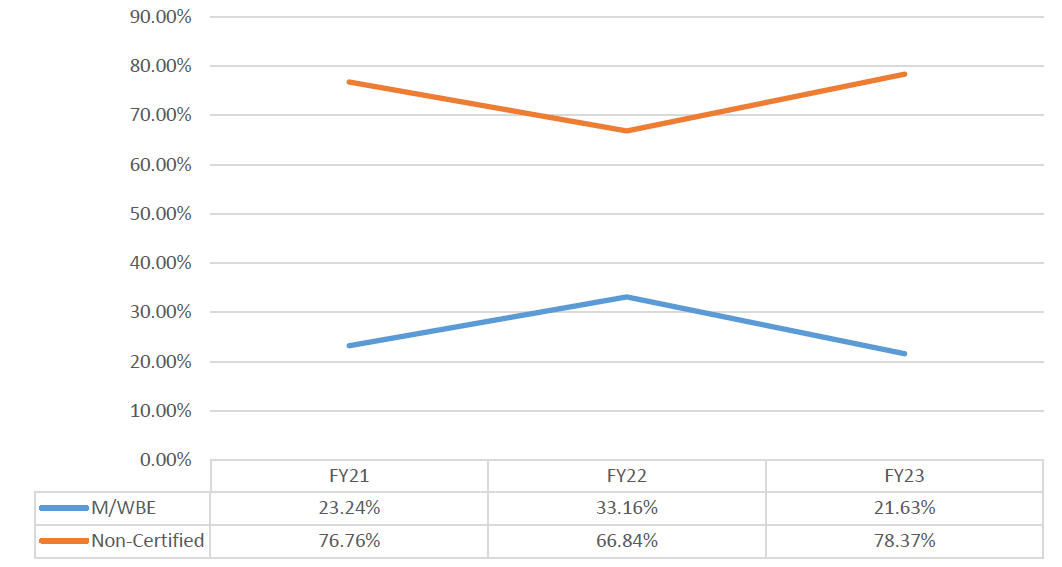
Standard Services
The standard services industry is composed of services other than professional services and human services such as custodial services, security guard services, stenography services, and office machine repair.[72] Analyses of standard services contracts show clear evidence that M/WBEs are winning less lucrative contracts than non-certified firms. Over 70% of LL 174-eligible standard services contracts were registered to M/WBEs, but these contracts only represent 12% of the value. Furthermore, the average value of a standard services contract registered to a M/WBE is approximately $442k, whereas the average value for non-certified firms is over six times larger at $2.73 million.
Table 99: FY23 Standard Services LL 174-Eligible Contract Registrations and POs, by Race and Gender
| M/WBE Category | # of Contracts and POs | % Share of Contracts and POs | Total Contract and PO Value | % Share of Contract and PO Value | AVG Contract Value[73] |
| ALL M/WBEs (Excluding Non-Certified) | 10,091 | 70.47% | $111,198,858 | 12.20% | $441,969 |
| Asian American male-owned MBEs | 8,250 | 57.61% | $40,249,962 | 4.42% | $1,002,880 |
| Asian American women-owned MBEs | 355 | 2.48% | $2,306,747 | 0.25% | $106,587 |
| Black male-owned MBEs | 118 | 0.82% | $14,656,669 | 1.61% | $498,331 |
| Black women-owned MBEs | 99 | 0.69% | $6,844,488 | 0.75% | $192,433 |
| Hispanic American male-owned MBEs | 202 | 1.41% | $22,337,115 | 2.45% | $500,712 |
| Hispanic American women-owned MBEs | 65 | 0.45% | $2,544,555 | 0.28% | $138,853 |
| White WBEs | 1,002 | 7.00% | $22,259,322 | 2.44% | $388,593 |
| Non-Certified | 4,229 | 29.53% | $800,249,022 | 87.80% | $2,732,745 |
| Grand Total | 14,320 | 100.00% | $911,447,880 | 100.00% | $3,174,714 |
Chart 164: Standard Services LL 174-Eligible Contract and PO Value, FY21-23
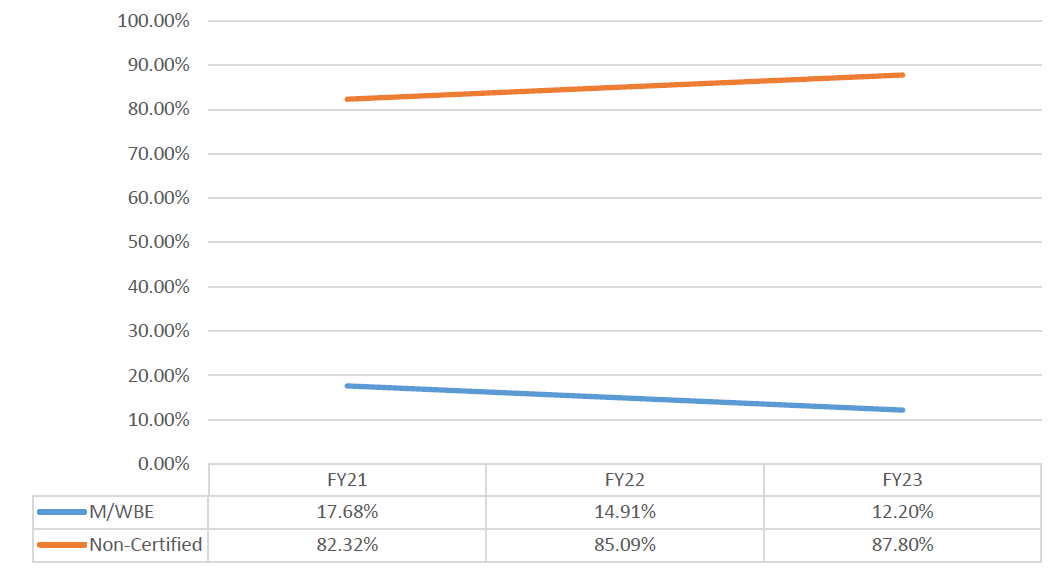
Industry Analysis of the M/WBE NCSP Method
Agencies most frequently use the M/WBE NCSP method to purchase goods and professional services. Agencies don’t frequently use this method for construction services. This is likely because such contracts typically exceed than the M/WBE NCSP method threshold (of $500,000 or $1 million), or, because construction services contracts often utilize federal funding that precludes agencies from utilizing this method for contracts over $250,000.[74]
Table 100: Volume of M/WBE NCSP Method Registrations, by Industry, FY21-23[75]
| FY21 | FY22 | FY23 | |||||
|---|---|---|---|---|---|---|---|
| Industry | # of Contracts | % Share of Contracts | # of Contracts | % Share of Contracts | # of Contracts | % Share of Contracts | |
| Construction | 22 | 2.70% | 28 | 3.02% | 36 | 3.45% | |
| Goods | 419 | 51.47% | 404 | 43.53% | 439 | 42.13% | |
| Professional Services | 256 | 31.45% | 343 | 36.96% | 409 | 39.25% | |
| Standard Services | 78 | 9.58% | 111 | 11.96% | 110 | 10.56% | |
| Unclassified Contract | 39 | 4.79% | 42 | 4.53% | 48 | 4.61% | |
| Grand Total | 814 | 100.00% | 928 | 100.00% | 1,042 | 100.00% | |
Table 101: Value of M/WBE NCSP Method Registrations, by Industry, FY21-23[76]
| FY21 | FY22 | FY23 | ||||
|---|---|---|---|---|---|---|
| Industry | Total Value | Share of Value | Total Value | Share of Value | Total Value | Share of Value |
| Construction | $6,539,590 | 7.64% | $7,670,267 | 6.14% | $13,473,614 | 6.96% |
| Goods | $33,239,216 | 38.85% | $42,436,115 | 33.96% | $65,523,464 | 33.85% |
| Professional Services | $31,485,536 | 36.80% | $50,400,344 | 40.34% | $73,364,144 | 37.90% |
| Standard Services | $10,209,033 | 11.93% | $15,857,235 | 12.69% | $30,524,102 | 15.77% |
| Unclassified Contract | $4,092,150 | 4.78% | $8,582,159 | 6.87% | $10,678,709 | 5.52% |
| Grand Total | $85,565,524 | 100.00% | $124,946,120 | 100.00% | $193,564,035 | 100.00% |
Conclusion
The City’s procurement process and systems have historically fostered an inequitable landscape that require M/WBEs to jump higher over bureaucratic hurdles only to earn lesser returns. There are real, tangible steps that must be taken now to address some of the biggest problems contributing to this perpetuated inequity. This Annual Report on M/WBE Procurement will continue to assess the City’s “Current State” across the key indicators that are contributing to low utilization numbers. This FY23 Report includes a series of recommendations to address needed procedural updates, systematic enhancements, and legislative reforms. Taken with the Recommendations included in prior iterations of this Report, these steps will mitigate some predominant underlying problems and will help close the gap to increase the share of contracts and lucrative opportunities that go to M/WBEs.
Appendix A: Procurement Methods, Tools, and Laws at Play
As detailed in the Annual Report, contracts are vehicles by which City agencies are able to provide critical goods and services to the public. Agencies make the determination of what contracts are needed to support their programmatic missions. These may be contracts to support essential agency operations (e.g., securing office supplies or IT services for its staff) or contracts that enable the agency to fulfill certain policy initiatives like expanding 5G access. The Comptroller’s Officed released a Contract Primer[77] on October 20, 2023 that in greater detail illustrates the process from identifying the need from a procurement through registration of a contract with the Comptroller’s Office. For purposes of this Report, this review includes the most prevalent procurement methods, tools and laws that govern the ways in which the City contracts with M/WBEs.
In general, a combination of relevant Executive Orders, Local Laws and other applicable rules and laws, set forth the procedural requirements for each procurement method available to City agencies. This section of the Report will highlight key components of the City’s contracting processes that impact M/WBE utilization across mayoral agencies as well as the Department of Education (DOE) and the Office of the Comptroller.[78] The independent City agencies (such as DOE), or other agencies (such as state agencies, boards, libraries, and other corporations that perform public functions in the City) may have their own independent procurement procedures, laws, and regulations and M/WBE programs.
- Procurement Methods with Discretion that provide flexibility to City agencies to make direct contract awards to M/WBEs without formal competition.
- Other Procurement Methods that on their own or supported by supplemental procurement tools are designed to provide exclusive or more advantageous opportunities by which the City can award contracts to M/WBEs.
- Goal Based Program which requires that for procurements covered by LL, agencies establish participation goals that yield M/WBE prime and/or subcontracting contracts.
Procurement Methods with Discretion
The PPB Rules authorize agencies to choose from multiple procurement methods that allow contracting agencies latitude to make direct contract awards to M/WBEs without formal competition.
Small Purchases: “5+10” Rule
Small Purchases enable agencies to procure goods, services, and construction above the Micropurchase method limits without formal competition or public advertisement as long as the amount of the contract is below a “small purchase limit” set by the PBB and the City Council, currently $100,000. [79][80]
The PPB Rules outline a competition objective for the award of Small Purchases, currently known as the “5+10” method, that aims to facilitate M/WBE participation by limiting the number of Non-Certified vendors that can compete for opportunities while enabling agencies to include as many M/WBEs in the competition pool as it wishes. [81] Specifically, contracting agencies are required to solicit bids from a list of five randomly selected Non-Certified vendors and at least ten M/WBE vendors when making awards for goods and services (over $20,000) as well as construction (over $35,000), as long as the total value of the contract, including future modifications, does not exceed $100,000. The “5+10” procurement method is not supported by PASSPort; rather agencies seeking to utilize this method must access FMS, which is a separate containing a module that facilitates the solicitation and award. Through this system, vendors are randomly selected from the citywide bidders list based on FMS commodity codes (discussed in more detail later in this section) selected by the contracting agency. Agencies may proceed even if only one responsive bid or offer is received, as long as the ACCO determines the price to be fair and reasonable, the vendor responsible and that other vendors were given an opportunity to respond.
Small Purchases: M/WBE Noncompetitive (NCSP) Method
First introduced in 2017 and since amended, the M/WBE NCSP method, codified under Section 3-08 of the PPB Rules, is designed to increase M/WBEs’ share in City contracts by providing contracting agencies with a tool to make direct contract awards up to thresholds authorized by the State with limited, targeted competition. Initially, in 2017 the NCSP method threshold was only up to $150,000 and limited to goods and services, but not construction procured using only City dollars. In November of 2019, pursuant to additional State legislative authority, the PPB unanimously voted to amend the City’s Rules to both increase the threshold up to $500,000 and expand the eligible industries to include construction. The NYC Law Department subsequently issued guidance to agencies that now permits the use of the method for federally funded procurements up to $250,000 and with certain procedural limitations. In general, contracting agencies leverage this method by soliciting at least three (3) quotes from certified M/WBEs and then award the contract to a responsible vendor that offers a fair and reasonable price.
In 2022, New York State enacted new legislation increasing the dollar threshold for eligible procurements from M/WBEs from $500,000 to $1 million.[82] City agencies were authorized to use an innovative procurement method to allow agencies to make noncompetitive procurements to M/WBEs on January 6, 2023[83]. This Report analyzes FY23 registrations (from July 1, 2022 through June 30, 2023), therefore the reporting period includes time where both thresholds were applicable.
In 2023, as a result of advocacy from the Capital Process Reform Task Force (including the Comptroller’s Office), New York State increased the dollar threshold yet again to $1.5 million[84]. This Office celebrates this threshold increase and expect it to help M/WBEs more effectively compete for larger contracting opportunities.
In FY23 the M/WBE NCSP method yielded a large share of registered M/WBE contracts (36.36%). Surpassing both the count and value totals from FY22, in FY23 city agencies registered 1,042 contracts via the M/WBE NCSP method, valued at $193,564,035.[85]
Micropurchase Procurement Method
Set within the Small Purchase Rule, Micropurchase procurements are those that do not exceed $20,000 for most goods and services, or up to $35,000 for construction. Unlike Small Purchases, which require limited competition but offer discretion in choice, when not exceeding the micropurchase thresholds (inclusive of future modifications) agencies may buy from any available responsible vendor at a fair price, without any competition. Despite this discretion, the Rules require that agencies making micropurchases ensure that the purchases are distributed appropriately, including to M/WBEs.
Other Procurement Methods
The PPB Rules also provide City contracting agencies with many other methods to contract with M/WBEs, even if they offer agencies less discretion when selecting a vendor. While these methods often have longer and more detailed procedures and cycle times, they generally yield larger contracts. City agencies must deliberately and more effectively utilize these award methods to increase the share of lucrative contracts awarded to M/WBEs.
Competitive Sealed Bid Method
The CSB is the default award method under the PPB Rules, General Municipal Law (GML) 103 and most other municipal procurement rules.[86] It functions to award contracts to responsive and responsible vendors that provide the lowest price point for a particular good, service, or construction while still meeting the agency‘s programmatic requirements and needs. Agencies must specify their requirements and criteria for vendors, which may include contractual terms and conditions, as well as minimum qualifications that must be met by the vendor, by issuing an invitation for bid (IFB).[87] CSBs are most often used for contracts pertaining to goods and construction. In fact, absent specific directives from other legal authority, CSBs are the required method for any contracts pertaining to public work contracts.[88]
Agencies may also solicit CSBs by sending notice to a list of prequalified vendors. Agencies may establish PQLs for multiple different types or sizes of projects. While opportunities for vendors to join an agency’s prequalified group must be continuously available to the public, and notice placed at least annually in the City Record, these lists are intended to save time by ensuring that prospective vendors have already been determined to hold the requisite experience, or to otherwise be capable of meeting the City’s needs.[89] While vendors must still be found responsible by an agency before being awarded a new CSB contract, agencies can conduct a preliminary background check on vendors while establishing a PQVL to reduce the risk of complications.
When properly implemented, dedicated PQLs are a tool that must be effectively deployed to direct larger dollar contracts to M/WBE prime vendors.
Competitive Sealed Proposal (CSP) Method
The CSP method is another competitive method whereby agencies solicit for goods, services, or construction-related services via a Requests for Proposal (“RFP”). RFPs are generally used with the scope of a need is not well defined, and an agency needs to understand an applicant vendor’s approach in order to make an award determination. Agencies must award proposals that are determined to be the most advantageous to the City, and may take into consideration price and other criteria, whose relative weight must be set forth in the RFP relating to technical approach, organizational capability, organizational capacity, and M/WBE status.[90] Other factors outside of the RFP cannot be considered by agencies when making award decisions, although there are generally multiple rounds of evaluation and opportunities for vendors to interview or present their proposal to an agency.[91] Like with CSBs, agencies can also issue an RFP notice to a PQVL list.
CSPs are also the tool most often used to establish service master agreements. Additional information on master agreements can be found later in this Section. As discussed earlier in this Report, it is critical that agencies ensure that M/WBEs that are awarded master agreements that are ultimately awarded task orders.
Best Value Preferences for M/WBEs
In January 2020, the City adopted amendments to the PPB Rules allowing contracting agencies to consider M/WBE status when evaluating bids and proposals.[92]
Specifically, for a CSB that is typically awarded to the lowest responsible bidder, contracting agencies are authorized to give an M/WBE bidder a 10% price preference. This means that an M/WBE’s bid price will be evaluated as if it were 10% lower, which may result in more awards to M/WBEs that maintain competitive pricing.
Alternatively, for a CSP, the City must provide either a 10%-point preference or, if the proposal score meets or exceeds a minimum threshold for quality, either a 10% price preference or a 10%-point preference to an M/WBE’s proposal score. These quantitative preferences are required to be applied to CSP’s for goods, standard services, and professional services. Note that for construction-related consulting services, rather than 10%, M/WBEs must receive a 5%-point preference. As noted in the FY22 Report, contracting agencies can increase M/WBE utilization by leveraging best value tools when using the CSB and CSP methods of procurement.
Negotiated Acquisition Contracts
Under section 3-04 of the PPB rules, agencies can move to limit competition via a negotiated acquisition procurement when the ACCO determines, with CCPO approval, that:
- There is a time-sensitive situation where a vendor must be retained quickly to meet the terms of a court order or consent decree, to avoid loss of available funding, to ensure continuity of services, or similar.
- There are a limited number of vendors available and able to perform required work.
- There is a compelling need to extend a contract beyond the typical twelve-month limit
- There is a need to procure legal services or consulting services in support of current or anticipated litigation, investigative or confidential services.
- There are previously unforeseen or unforeseeable construction-related service needs, typically after construction has begun, that cannot be addressed by a change order or other contract modification.
Negotiated acquisition extensions are typically used when agencies have exhausted all contractual renewals, as well as contract extensions permitted by other sections of the PPB Rules, because goods or services were needed for a longer time than originally anticipated, or because the agency has not been able to procure a replacement contract in a timely manner.
In spite of the fact that Negotiated Acquisition contracts are supported by a particular need that may dictate a preferred vendor, the LL still mandates that agencies make reasonable efforts to meet participation goals by requiring that they engage in outreach activities that encourage M/WBEs to complete for these procurements.[93]
There were 700 negotiated acquisitions registered in FY23 for a total value of $2,025,596,205.[94]
Emergency Procurement Contracts
The Charter and PPB rules define an emergency condition as “an unforeseen danger to life, safety, property, or a necessary service” which creates an immediate and serious need for goods, services, or construction that cannot be met quickly enough through normal procurement methods.[95] Agencies seeking to utilize this procurement method must solicit and receive prior approval from the Comptroller’s Office and Corporation Council. They must also seek to obtain as much competition in vendor selection as is possible and practical given the conditions of the emergency.
Agencies then submit a formal emergency declaration to the Comptroller’s Office and Corporation Counsel for approval, and to the City Council for notice. The emergency declaration must include information about the emergency itself, the goods or services or construction needed, the projected cost, the vendor selected in the emergency procurement, and basis of the awarded vendor’s selection. While work can begin under the framework of the emergency declaration prior to a contract’s registration, agencies must still submit contract packages to the Comptroller’s Office for registration before funds are made available to pay vendors.
On August 8, 2023, Mayor Adams issued Executive Order 34 (“EO 34”) to encourage better accountability and outcomes for M/WBEs. Among other mandates, EO 34 requires mayoral agencies to consider at least one quote from an M/WBE on all emergency procurements. EO 34 builds upon a previous Executive Order 59 (“EO-59”) issued by Mayor DeBlasio on July 28, 2020 in response to the ongoing State of Emergency due to the threat of COVID-19. EO-59 stated that agencies “shall not categorically exempt Emergency contracts from M/WBE participation goals, and shall instead, to the extent practicable in light of the nature of the procurement, follow the procedures set forth in Section 6-129(h) and (i) of the N.Y.C. Administrative Code to set goals for the contract.” Even absent a policy directive to engage with M/WBEs, and similar to Negotiated Acquisitions, the LL mandates agencies to conduct outreach encouraging M/WBE to compete for Emergency procurement contracts.[96]
This Office released “Rethinking Emergency Procurements” on November 30, 2023, which included a focused analysis on M/WBE utilization in emergency procurements. M/WBEs were awarded just 15% of the count of contracts included in the Report’s lookback period, amounting to only 3.45% of the total emergency procurement value. This Report can be found at this link: https://comptroller.nyc.gov/reports/rethinking-emergency-procurements/
Master Agreements
A Master Services Agreement (MA1) is a type of umbrella contract under which a vendor or pool of vendors (for Multiple Master Agreements [MMA1s]) hold a master agreement defining a general scope of services with specific assignments determined through subsequently issues task orders.
MMA1s for services allow agencies to use a fast-track solicitation process to obtain the specific services needed from firms that already hold a master agreement with the City. They provide flexibility when the scope of a project or task cannot be defined in advance or when the nature of services needed cannot be determined at the time the contract is solicited and registered. At the time the services are needed, the agency prepares a scope and a task order for the vendor.
Finding #3 of this Report includes analyses related to M/WBE utilization in MMA1s.
M/WBE Certification
City-certified M/WBEs are certified by SBS.[97] A business seeking M/WBE certification must meet the following eligibility requirements:
- The business is legally authorized to transact business in New York State.
- The business has been in operation (i.e., selling goods and/or services) for at least one year.
- At least 51% of the business is owned, operated and controlled by a U.S. Citizen(s) or U.S. permanent resident(s) who are women and/or members of designated minority groups including:
- Black
- Hispanic
- Asian-Pacific
- Asian-Indian
- Native American
- The business has one of the following legal structures:
- Sole proprietorship
- Limited Liability Company (LLC)
- Corporation
- Limited Liability Partnership (LLP)
- Limited Partnership (LP)
- General Partnership
- The business’ principal office, place of business or headquarters is located within the five boroughs of New York City or in one of the following counties in New York and New Jersey:
- Nassau
- Putnam
- Rockland
- Westchester
- Suffolk
- Bergen
- Hudson
- Passaic
Note: a business located outside of New York City and outside of the designated counties noted above may qualify for M/WBE certification if the applicant can prove a substantial presence in the geographic market of New York City. Substantial presence can be demonstrated by providing documentation that satisfies at least two of the following conditions:
- Maintenance of a bank account for at least six (6) months in the City, or engagement in other banking transactions in the City, and/or
- Possession of a license (i.e., by the business or by at least one owner) issued by a New York City agency supporting its ability to transact business in the City, and/or
- Proof of business transactions, or attempted business transactions, in or with the City more than once over the past three (3) years
Additional information about M/WBE certification, including required documentation, can be found on SBS’ website: Minority and Women-owned Business Enterprise (M/WBE) Certification Program | City of New York (nyc.gov)
Participation Goals Program
Separate from the independent tools outlined above that can support the award of higher dollar value contracts to M/WBE prime vendors, agencies have a legally mandated responsibility to include M/WBE participation goals when using many of those methods as sourcing vehicles. As discussed below, when used effectively, participation goals ensure maximum M/WBE utilization even in circumstances where the chosen procurement method does not result in a contract award to an M/WBE prime.
The inception of the City’s M/WBE program was borne out of a disparity study which is discussed further along in this Report. Currently, the City’s Program is currently governed by Section 6-129(b) of the Admin Code, which codifies Local Laws 174[98] and 176[99] enacted by the City Council in 2019. This legislation outlines mandated M/WBE participation goals for mayoral agencies and those of Elected Officials. As of this most recently amended guidance, contracting agencies are expected to establish and ensure that M/WBE participation goals are met for all eligible procurements in:
- Standard services;
- Professional services;
- Construction services;
- Goods (up to $1 million)
There are some specified exceptions, including but not limited to:[100]
- Emergency procurements;
- Intergovernmental (NY State Office of General Services (OGS)/ U.S. General Services Administration (GSA)) procurements;
- Sole source contracts;
- Government-to-government procurements;
- Contracts subject to federal or state funding requirements that preclude the City from imposing M/WBE participation goals or impose their own Disadvantaged Business Enterprise (DBE), MBE, or WBE goals;
- Human services procurements;
- Any procurement that results in an award to a not-for-profit entity; and
- Any procurement that is not competitively awarded (i.e., Required Authorized Source, etc.)
On all eligible procurements, agencies are required to establish M/WBE participation goals that maximize M/WBE utilization. If an eligible procurement results in the establishment of master agreement with task/work orders that are individually registered, goals are not set on the prime contract, as the scopes of work may not yet be known. Rather, the task orders issued pursuant to the master agreement may be subject to goal setting. In establishing participation goals, the City is required to ensure that substantial progress is made toward attaining the citywide goals set forth in the LL in as short a time as practicable. It is important to note that the discretionary procurement methods discussed earlier are not excluded from the LL 174 requirements, making it all the more critical that the City consider all eligible procurement methods as critical vehicles by which to attain higher M/WBE utilization.
These goals include specific contracting participation goals for each individual M/WBE category: “Black Americans, Asian Americans, Hispanic Americans, Native Americans, Women, and Emerging”. While the LL permits agencies to set an “unspecified goal,” which a vendor may meet by using an M/WBE regardless of certification category, when setting participation goals, agencies are required to consider the potential for the purchase to provide opportunities for specific categories of M/WBEs to develop greater capacity and to increase competition for city procurements.[101] In fact, Agency annual utilization plans, which are submitted to the speaker of the council and publicly posted, must include an explanation if any goal is different than the participation goal for the relevant group and industry classification as set forth in the LL. [102]
Monitoring a vendor’s compliance with the contractually required goal is outside the scope of this Report, though subcontractor compliance challenges are addressed earlier in this Report. It is important to understand that both an agency and the vendor’s compliance with goals is based on the dollar amount that is paid or obligated to be paid to an M/WBE. Therefore, the goal sets the legal benchmark for utilization, but prime and subcontract expenditures ultimately measure actual compliance and success. Much of the analyses in this Report focus on procurements subject to the City’s participation goals program.
Disparity Studies
New York City’s M/WBE program was created in 1992 in response to an initial disparity study that analyzed the availability and representation of M/WBEs in City contracting. The City is required to conduct this review at least once every two years.[103] To date, the City has produced only three disparity studies, the most recent of which was published in 2018, which analyzed data from July 2006 through July 2015. This 2018 disparity study found sufficient evidence of disparity and recommended that the City continue its M/WBE program in supporting of closing the gap. The 2018 disparity study supported the City’s goal of 30% utilization for M/WBEs, and informed the metrics used for disaggregated goals (by M/WBE category and by industry).
The FY22 Annual Report on M/WBE Procurement included a recommendation that the City swiftly proceed with the procurement of an updated disparity study to better reflect the state of the current economy. As of the date of the publishing of this Report, the City has not yet released a solicitation to pursue an updated disparity study. Visit this link to access a copy of the 2018 disparity study: https://www.nyc.gov/assets/mwbe/business/pdf/NYC-Disparity-Study-Report-final-published-May-2018.pdf
Resources
New York City agencies and vendors leverage many systems, platforms, and resources that support its contracting functions. This Report references many key technology resources that are particularly relevant when discussing contracting with M/WBEs. This Report identifies problems and recommends changes and enhancements that would make these, individually and collectively more valuable tools to support the increase to M/WBE utilization.
FY23 Annual Summary Contracts Report for the City of New York
The Comptroller’s Office is required to publish an annual summary report of contracts and agreements assumed by New York City during the previous fiscal year in accordance with section 6-116.2 of the Administrative Code. This “Annual Summary Contracts Report” was released on January 30, 2024, and aims to provide better transparency into what the city is buying and how these purchases are being made. The Annual Summary Contracts Report includes plain data on over 12,000 registered procurement actions made by the City, representing a value of over $38 billion. This M/WBE utilization report is a follow-up to the Annual Summary Contracts Report that will focus on the share of City registered contracts going to M/WBEs, subject to LL 174 participation goals.
A copy of the report can be found at: https://comptroller.nyc.gov/reports/annual-contracts-report/
Financial Management System (FMS)
FMS is the City’s computerized accounting and financial data management system that is jointly administered by the Mayor and Comptroller and managed by the Financial Information Services Agency (FISA). FMS is the central repository of the accounting, budgetary and contracting activity for all city agencies. To properly track expenses and revenues, agencies are required to specifically identify the type of contract submitted for registration by selecting from a list of predetermined contract type codes in FMS. Award method categories indicate how the City selects vendors for a particular contract. This Report also references “Industry classifications” which are not entered by agencies into FMS but are instead derived from various FMS data points to reveal procurement trends by sector.
The majority of the data analyses in this Report pertaining to registered contracts were sourced from FMS.
Payee Information Portal (PIP)
All vendors are required to register and create an account in PIP to do business with the City of New York. PIP is managed by FISA and enables vendors to view financial transactions, register for Electronic Funds Transfer (EFT) payments, enroll in citywide bidders’ lists, report on subcontractors, and record payments made to subcontractors among other features.
Checkbook NYC
In July of 2010 the Comptroller’s Office launched Checkbook NYC, an online transparency tool that for the first time placed the City’s day-to-day spending in the public domain. Using an intuitive dashboard approach that combines a series of graphs and user-friendly tables, Checkbook NYC provides up-to-date information about the City’s financial condition.
Checkbook NYC has been ranked the top transparency tool in the nation for tracking government spending by the United States Public Interest Research Group and was named New York City 2013 “Best External Application” by Government Technology Magazine.
Checkbook NYC also contains a majority of the City’s contract data. This tool enables users to examine data on its “Contracts” tab by fiscal year (or other date ranges), procurement category, contract types, and more. Visit this link to access Checkbook NYC: https://www.checkbooknyc.com/
Online Directories of Certified Vendors
SBS Online Directory of NYC Certified Businesses
The SBS Online Directory of NYC Certified Businesses is a searchable list of M/WBE, Locally-based enterprises (LBE), and Emerging Business Enterprises (EBE) businesses certified by the City of New York. It includes contact information for these firms, as well as details regarding their expertise, experience, and more. As of June 30, 2023 (the end of FY23), the SBS Online Directory of Certified Vendors included 10,992 M/WBEs. Visit this link to access the SBS Online Directory: https://sbsconnect.nyc.gov/certification-directory-search/
Empire State Directory
There is a separate certification process for becoming a New York State certified M/WBE, defined by Article 15-A of the New York State Executive Law. The New York State M/WBE Directory is a searchable list of State certified M/WBEs, searchable by commodity code, location, work region, industry, and business size.
- Visit this link to access more information about the New York State M/WBE certification process: https://esd.ny.gov/doing-business-ny/mwbe/mwbe-certification-eligibility-requirements
- Visit this link to access the NYS M/WBE directory of certified firms: https://ny.newnycontracts.com/
PASSPort
This online vendor management and procurement system is managed by MOCS. PASSPort is where vendors and mayoral Agencies exchange information to create and manage vendor accounts, make determinations for contract awards, and complete performance evaluations. This platform is designed to increase transparency, reduce administrative burdens, and build more collaborative relationships for positive financial impact. Visit this link to access PASSPort: https://passport.cityofnewyork.us/
PASSPort Public
PASSPort Public is a portal that is designed for data transparency and provides the public with insight into the City procurement system. The portal provides up-to-date information and status updates concerning vendors, solicitations, and contract registrations. Visit this link to access PASSPort Public: https://a0333-passportpublic.nyc.gov/
MOCS M/WBE Reporting
As of FY14, MOCS is required to publish quarterly reports on the progress of the M/WBE Program. The M/WBE Reports page on the MOCS website shares current and historical M/WBE reports and M/WBE Noncompetitive small purchase Compliance Report. Visit this link to access the M/WBE Reports Page: https://www.nyc.gov/site/mocs/opportunities/m-wbe-reports.page
City Record Online (CROL)
The City Record Online (CROL) is a fully searchable database of notices published in the City Record newspaper which includes but is not limited to public hearings and meetings, public auctions and sales, solicitations and awards and official rules proposed and adopted by city agencies. Visit this link to access CROL: https://a856-cityrecord.nyc.gov/
M/WBEs are encouraged to use CROL to receive notice and learn about current and upcoming procurement opportunities.
Agency Procurement Plans (LL-1 and LL-63)
Under Local Law 1, SBS and MOCS are required to publish an annual plan and schedule listing anticipated contracting opportunities for the coming fiscal year. These plans include the following information for each solicitation: the specific type and scale of the services to be procured, the term of the proposed contract, the method of solicitation the agency intends to utilize, and the anticipated fiscal year quarter of the planned solicitation. Similarly, under Local Law 63 of 2011, MOCS is required to publish a plan and schedule detailing the anticipated contract actions (for certain categories of procurement) of each City agency for the upcoming fiscal year. This requirement applies to contracts valued at more than $200K providing standard or professional services, including against agency task orders.
Both contracting plans are useful tools to give vendors notice about potential upcoming procurement opportunities with each agency.
These plans are available on the MOCS website. Visit:
https://www.nyc.gov/site/mocs/resources/standard-prof-services-ll63.page
Appendix B: M/WBE Asset Managers & Public Finance
The NYC Office of the Comptroller Bureau of Asset Management and Bureau of Public Finance released the M/WBE and Emerging Manager Pension Report in November 2023 detailing the share of pension investments with M/WBE asset managers and emerging managers & the role of M/WBEs in public finance. The New York City Retirement Systems had a total of $19.5 billion in investments with or committed to M/WBE managers as of June 30, 2023. Those investments amount to 12.68% of U.S.-based actively managed assets, or approximately 8% of the total assets under management.
The report is available at: https://comptroller.nyc.gov/reports/mwbe-and-emerging-manager-pension-investments-fiscal-year-2023/
Appendix C: LL 174 Exclusions
In order to analyze the City’s utilization of M/WBEs in areas subject to LL 174 participation goals, this report excluded contracts and spending that fell into one of the following categories, pursuant to § 6-129(q) of the Administrative Code.
Award Method LL 174 Exclusions
| Award Method Code | Award Method |
| 5 | Sole Source |
| 6 | Emergency |
| 7 | Lessee Negotiation |
| 8 | Loan Negotiation |
| 9 | Rental Subsidy Negotiation |
| 10 | Renewal of Contract |
| 11 | Determined by Legal Mandate |
| 12 | Boro Needs/Discretionary Fund |
| 13 | Petition Private Use/Franchise |
| 14 | Concessionaire by Procedure |
| 15 | Renewal Franchise/Concession |
| 16 | Exempt Concession – Public Bid |
| 17 | Government-to-Government |
| 18 | Non-Procurement Transaction |
| 24 | Contract Conversion |
| 25 | Intergovernmental Procurement |
| 26 | Determined by Government Mandate |
| 28 | Buy Against |
| 29 | Assignment |
| 40 | DOE Listing Application |
| 41 | Cable Service Negotiation |
| 42 | Professional Membership Negotiation |
| 43 | Subscriptions Etc. per PPB |
| 44 | Public Utility |
| 45 | Small Purchase – Public Utility |
| 51 | Grants |
| 61 | Small Purchase – Renewal |
| 62 | Small Purchase – Intergovernmental |
| 68 | Force Account Negotiation |
| 78 | Real Estate Sales and Purchases |
| 79 | Watershed Land Negotiation |
| 99 | Miscellaneous |
| 100 | Small Purchase – Subscription etc. |
| 101 | Small Purchase – Professional Membership |
| 102 | Small Purchase – Grants |
| 103 | Small Purchase – Government-to-Government |
| 104 | Small Purchase – Assignment |
| 105 | Condemnations – Exempt OCA Processing |
| 106 | Small Purchase – Buy Against |
| 107 | Small Purchase Watershed Land Acquisition |
| 251 | Intergovernmental Procurement Renewal |
| 511 | Grant Renewal |
Industry LL 174 Exclusions[104]
| Industry |
| Human Services |
| Goods (Over $1 million) |
Vendor-Related 174 Exclusions
| Vendor |
| NYC Economic Development Corporation |
| NYC Housing Authority |
| All vendors with 1099 Non-Profit Status |
Contract Type LL 174 Exclusions
| Contract Type Code | Contract Type |
| 15 | Franchises |
| 17 | Revocable Consents |
| 18 | Permits |
| 20 | Concessions |
| 25 | Corpus Funded |
| 26 | Compensating Balance from Proceeds |
| 29 | Other Expense Contract or Revenue Related |
| 30 | Miscellaneous Revenue – No Expense |
| 35 | Lessee |
| 36 | Miscellaneous Property Rental |
| 39 | Lessor – Revenue |
| 40 | Lessor – Accounting Lines Exist |
| 41 | Cable Service |
| 42 | Professional Membership |
| 43 | Subscriptions |
| 44 | Public Utility |
| 46 | Requirements – Goods (Over $1 million) |
| 65 | Loans |
| 68 | Force Account Agreement |
| 70 | Programs |
| 72 | Programs (Not Tax Levy Funded) |
| 78 | Real Estate Sales and Purchases |
| 79 | Watershed Land Acquisition |
| 83 | Condemnations – Exempt OCA Processing |
| 85 | Intra-Agency Fund Agreements |
| 88 | New York City Bond Financing |
Appendix D: Z-Scores
In an effort to assess agency performance more fairly, this year’s analysis examined how much LL 174-eligibile business (as a function of value and volume) each agency did with M/WBEs relative to their peers with similar-sized LL 174 portfolios.
Z-Scores
This analysis employed a statistical tool known as a Z-Score to measure how much business each agency did with M/WBEs as compared to their cohort average. First, volume and value totals were calculated for each agency in a given fiscal year. Next, those volume and value totals were compared for each agency to their respective cohort averages (e.g. the total value of all LL 174-eligible M/WBE contracts and POs for a “Tier 1” agency was compared to the average value of all LL 174-eligible M/WBE contracts and POs across “Tier 1” agencies, and the total number of LL 174-eligible contracts and POs for a “Small Volume” agency was compared to the average number of LL 174-eligible contracts and POs across all “Small Volume” agencies). Finally, Z-Scores for volume and value were combined for each agency into a unified score, giving greater weight to the value portion. The cohort system allows for standardized assessment across different agency sizes, ensuring that agencies are compared with their peers who handle a similar volume and value of LL 174-eligible contracts and POs. The result tells us if an agency is performing above, below, or at the average level compared to its peers within the same operational scale. Comparing Z-Scores within Cohorts ensures that each agency, is measured against a relevant and comparable standard.
Cohorts
Value and volume cohorts were established by aggregating LL 174-eligible contract and PO data for each agency over a four-year period (FY20-23). The extended timeframe accommodates the fluctuations in each agency’s procurement cycle, accounting for both heavier and lighter years. The cohorts were established as follows:
Value Cohorts
- Large: total aggregated value over $100 million
- Medium: total aggregated value between $50 million and $100 million
- Small: total aggregated value between $10 million and $50 million
- Micro: total aggregated value under $10 million
Volume Cohorts
- Large Volume: Over 10,000 contracts and POs
- Moderate Volume: Between 1,000 and 10,000 contracts and POs
- Small Volume: Between 100 and 1,000 contracts and POs
- Micro Volume: Less than 100 contracts and POs
All Ranked Agency Z-Scores, FY21-FY23
| Agency | Value Cohort | Volume Cohort | FY21 Combined | FY22 Combined | FY23 Combined | YOY 23-22 |
| ACS | Between 10M-50M | Small Volume | 1.2 | 0.91 | 0.25 | -66.35% |
| BIC | Under 10M | Very Small Volume | 0.08 | -0.18 | 0.57 | 74.96% |
| CCHR | Under 10M | Small Volume | -0.87 | -1.21 | -1.04 | 16.91% |
| CCRB | Under 10M | Very Small Volume | -0.83 | -1.06 | -1.16 | -9.64% |
| COMP | Under 10M | Small Volume | 0.9 | 1.83 | 2.17 | 33.83% |
| DCAS | Between 50M-100M | Small Volume | 1.18 | -0.83 | -0.58 | 25.64% |
| DCLA | Under 10M | Very Small Volume | -0.35 | -0.62 | -0.85 | -22.96% |
| DCP | Under 10M | Small Volume | 0 | 0.73 | -0.06 | -78.93% |
| DCWP | Under 10M | Small Volume | -0.04 | -0.21 | -0.39 | -17.95% |
| DDC | Over 100M+ | Small Volume | 1.25 | 1.15 | 0.27 | -87.08% |
| DEP | Over 100M+ | Moderate Volume | 0.41 | 0.42 | 1.01 | 58.88% |
| DFTA | Under 10M | Small Volume | -0.24 | 0.28 | 0.39 | 11.16% |
| DHS | Between 50M-100M | Very Small Volume | -0.47 | 0.17 | 1.48 | 131.37% |
| DOB | Under 10M | Small Volume | 2.41 | 1.72 | 1.18 | -53.80% |
| DOC | Between 10M-50M | Moderate Volume | 0.2 | 0.41 | 0.2 | -21.35% |
| DOE | Over 100M+ | Moderate Volume | -0.53 | -0.69 | -0.67 | 2.03% |
| DOF | Between 10M-50M | Small Volume | -0.82 | -1.35 | -1.03 | 32.28% |
| DOHMH | Between 50M-100M | Moderate Volume | 0.86 | 0.95 | 0.6 | -34.64% |
| DOI | Under 10M | Small Volume | -0.77 | -0.91 | -1.09 | -17.70% |
| DOP | Under 10M | Small Volume | -0.14 | -0.68 | -0.14 | 53.56% |
| DORIS | Under 10M | Small Volume | -0.83 | -0.28 | 0.03 | 30.47% |
| DOT | Over 100M+ | Moderate Volume | -0.55 | -0.68 | -1.29 | -61.33% |
| DPR | Over 100M+ | Moderate Volume | -0.2 | -0.35 | -0.1 | 25.14% |
| DSNY | Between 50M-100M | Moderate Volume | -0.67 | -0.78 | -0.27 | 50.23% |
| DSS/HRA | Between 10M-50M | Small Volume | -0.23 | 0.23 | -0.73 | -95.71% |
| DYCD | Under 10M | Small Volume | -0.15 | 0.61 | -0.42 | -102.50% |
| FDNY | Between 10M-50M | Small Volume | 0.58 | -0.08 | -0.46 | -37.84% |
| HPD | Between 50M-100M | Small Volume | 0.47 | 0.49 | -0.37 | -86.45% |
| LAW | Between 10M-50M | Small Volume | -0.39 | 0.48 | 1.4 | 91.79% |
| LPC | Under 10M | Very Small Volume | -0.72 | -1.08 | -0.87 | 21.56% |
| MAYOR | Between 10M-50M | Small Volume | 0.28 | 0.43 | 1.03 | 59.83% |
| NYCEM | Between 50M-100M | Small Volume | -0.84 | -0.95 | -0.42 | 52.29% |
| NYPD | Between 50M-100M | Large Volume | -0.53 | 0.95 | -0.44 | -138.44% |
| OATH | Under 10M | Small Volume | -0.31 | 0.37 | 0.38 | 1.70% |
| OTI | Over 100M+ | Large Volume | -0.38 | 0.16 | 0.78 | 62.35% |
| SBS | Between 10M-50M | Small Volume | -0.81 | -1.03 | -0.66 | 37.37% |
| TLC | Under 10M | Small Volume | 1.84 | 0.69 | 1.28 | 59.33% |
Appendix E: Award Method Analysis Categories
This appendix provides additional information about the types of contracts and POs included in the analysis reflected in Table 11 and Table 12.
| Award Method Analysis Category | Award Method Codes (Unless Otherwise Specified) |
| Competitive Sealed Bid Contracts | 1, 3 |
| Competitive Sealed Proposal Contracts | 2, 22 |
| Accelerated Procurement Contracts | 27 |
| Demonstration Project Contracts | 23 |
| Innovative Procurement Contracts | 20 |
| Micropurchase Contracts | 30, 38, POs under $20k, POs under 35k under (CT 5 or CT 48 only) |
| Negotiated Acquisition Contracts | 21, 211 |
| Small Purchase Contracts – General | 31, 32, 35, 36, 37, 109, 111, 112, 113, POs over 35k, POs between 20k-35k (except for CT 5 and 48). |
| Small Purchase Contracts – M/WBE | 72 |
Appendix F: Summary of Agencies in This Report
This Report measures M/WBE utilization among mayoral agencies. Specified sections of this Report include additional analyses for the Department of Education and non-mayoral Elected offices (including the Comptroller’s Office).
| Agency | Agency Short Name |
| Administration for Children’s Services | ACS |
| Borough President – Bronx | BXBP |
| Borough President – Brooklyn | BKBP |
| Borough President – Manhattan | MBP |
| Borough President – Queens | QBP |
| Borough President – Staten Island | SIBP |
| Business Integrity Commission | BIC |
| City Council | CC or Council |
| Civilian Complaint Review Board | CCRB |
| Commission on Human Rights | CCHR |
| Department for the Aging | DFTA |
| Department of Buildings | DOB |
| Department of City Planning | DCP |
| Department of Citywide Administrative Services | DCAS |
| Department of Consumer and Worker Protection | DCWP |
| Department of Correction | DOC |
| Department of Cultural Affairs | DCLA |
| Department of Design and Construction | DDC |
| Department of Education | DOE |
| Department of Environmental Protection | DEP |
| Department of Finance | DOF |
| Department of Health and Mental Hygiene | DOHMH |
| Department of Homeless Services | DSS/DHS |
| Department of Investigation | DOI |
| Department of Parks and Recreation | DPR |
| Department of Probation | DOP |
| Department of Records and Information Services | DORIS |
| Department of Sanitation | DSNY |
| Department of Small Business Services | SBS |
| Department of Transportation | DOT |
| Department of Youth and Community Development | DYCD |
| District Attorney – Bronx County | DABX |
| District Attorney – Kings County | DAKINGS |
| District Attorney – New York County | DANY |
| District Attorney – Queens County | DAQ |
| District Attorney -Richmond County | DARICH |
| Fire Department of New York | FDNY |
| Health and Hospitals Corporation | HHC |
| Housing Preservation and Development | HPD |
| Human Resources Administration (Department of Social Services) | DSS/HRA |
| Landmarks Preservation Commission | LPC |
| Law Department | LAW |
| Mayoralty | MAYOR |
| New York City Emergency Management | NYCEM |
| New York Police Department | NYPD |
| Office of Administrative Trials and Hearings | OATH |
| Office of Technology and Innovation | OTI |
| Office of The Comptroller | COMP |
| Taxi and Limousine Commission | TLC |
Appendix G: FY23 LL 174-Eligible Prime and Subcontracts by Agency[105]
This appendix shares the total number of each agency’s prime contract registrations subject to LL 174 participation goals and the total number of those prime contracts that have approved subcontractors in PIP.
| Agency | # of LL 174 Contracts | # of LL 174 Contracts with PIP Approved Subcontracts |
| ACS | 99 | 5 |
| CCHR | 1 | 0 |
| CCRB | 14 | 0 |
| COMP | 39 | 0 |
| DCAS | 215 | 2 |
| DCLA | 9 | 0 |
| DCP | 13 | 0 |
| DCWP | 3 | 0 |
| DDC | 134 | 118 |
| DEP | 198 | 0 |
| DFTA | 14 | 0 |
| DHS | 30 | 1 |
| DOB | 19 | 0 |
| DOC | 61 | 0 |
| DOE | 1,097 | 0 |
| DOF | 40 | 4 |
| DOHMH | 620 | 0 |
| DOI | 5 | 0 |
| DOP | 9 | 0 |
| DORIS | 1 | 0 |
| DOT | 196 | 40 |
| DPR | 335 | 95 |
| DSNY | 80 | 8 |
| DSS/HRA | 62 | 1 |
| DYCD | 14 | 0 |
| FDNY | 62 | 22 |
| HPD | 114 | 5 |
| LAW | 59 | 0 |
| LPC | 2 | 0 |
| MAYOR | 26 | 4 |
| NYCEM | 29 | 0 |
| NYPD | 231 | 3 |
| OATH | 15 | 0 |
| OTI | 190 | 0 |
| SBS | 21 | 0 |
| TLC | 6 | 0 |
| Grand Total | 4,063 | 380 |
Appendices H-L: Additional Data
Appendix H: PIP Approved Subcontract Records for LL 174-Eligible Primes, FY21-23 (Mayoral Agencies Only)
- This appendix contains a summary of subcontract records (count and value) by agency and M/WBE Category for the past three fiscal years
- Visit this link to view data: https://comptroller.nyc.gov/wp-content/uploads/2024/02/Appendix-H-–-PIP-Approved-Subcontract-Records-for-LL-174-Elgibile-Primes-FY21-23-Mayoral-Agencies-Only.xlsx
Appendix I: Summary of Contract and PO Totals, Subject to LL 174 Participation Goals
- This appendix contains a summary of contract and PO data (count and value) by agency and M/WBE Category
- Visit this link to view data: https://comptroller.nyc.gov/wp-content/uploads/2024/02/Appendix-I-Summary-of-Contract-and-PO-Totals-Subject-to-LL-174-Participation-Goals.xlsx
Appendix J: Summary of Spend Data, Subject to LL 174 Participation Goals
- This appendix contains summary data displaying spend by year, agency, and prime/sub contract type
- Visit this link to view data: https://comptroller.nyc.gov/wp-content/uploads/2024/02/Appendix-J-LL174_spend.xlsx
Appendix K: Summary of M/WBE NCSP Method Registrations
- This appendix contains a summary of M/WBE NCSP method registration data (count and value) by agency and M/WBE Category.
- Visit this link to view data: https://comptroller.nyc.gov/wp-content/uploads/2024/02/Appendix-K-Summary-of-MWBE-NCSP-Registrations.xlsx
Appendix L: M/WBE Retroactivity by Agency, FY21-23
- This appendix contains a summary of all registered procurement contracts (not just subject to LL 174 participation goals) by agency and retroactivity status
- Visit this link to view data: https://comptroller.nyc.gov/wp-content/uploads/2024/02/Appendix-L-MWBE-Retroactivity-by-Agency-FY21-23.xlsx
Acknowledgments
Kerri Nagorski, Director of Procurement Policy and Partnerships, and Dan Roboff, Director of Procurement Research Analysis and Reporting, were the lead authors of this report with support from Michael D’Ambrosio, Assistant Comptroller for the Bureau of Contract Administration, Charlette Hamamgian, Deputy Comptroller, Emerson Lazellari, Senior Data Analyst, James Leidy, CUNY Fellow, Daphnie Agami, Senior Advisor and Counsel to the Deputy Comptroller and Sadye Campoamor, Chief Equity Officer. Report design was completed by Archer Hutchinson, Creative Director. Troy Chen and Edward Sokolowski from the Comptroller’s Bureau of Information Systems and Technology, as well as REI Systems Inc, provided consulting and other support for this Report. The Comptroller’s Office of the General Counsel has reviewed portions of this report.
Thank you to the M/WBE community and advocates for important contributions to this report, including the M/WBEs that participated in the Comptroller’s Office Borough Events in Fall 2023. Thank you to Megan Flynn, Edward Cen, James Mongeluzo, Evelin Collado, Greer Mayhew, and Donald De Rosa from the Bureau of Public Affairs for their efforts to coordinate and facilitate these M/WBE Borough Events.
Endnotes
[1] A note on terminology: For the purposes of this report, “M/WBE” refers to a City-Certified Minority or Women-Owned Business Enterprise. Terms used in this report such as “Minority” and “Hispanic” are based on the NYC Administrative Code and Local Law 174 and align with the certification status in the various systems and databases designed to implement those laws. Such terms are necessary for measurement, but they also have many shortcomings. They often do not reflect how people refer to themselves and fail to convey the expansiveness of human identities. There are no categories for people of two or more races, LGBTQ contractors, or people with disabilities. New York City is already a “majority minority” city. While this report is designed to measure outcomes under the existing legal framework, legislative or administrative changes would be welcome to update the categories to better reflect the diverse population of New York City.
[2] While records are limited, M/WBE utilization among reported subcontracts is higher than it is for prime contracts. The Payee Information Portal (PIP) reflects that Mayoral agencies entered subcontract data for just 380 (~13%) of the 2,927 LL 174-eligible prime contracts registered in FY23. Among these 380 contracts, M/WBEs were awarded $539.8 million, which amounts to 44.9% of the total subcontract value. It is important to note that subcontract values are not additive to the value of prime contract awards given that they reflect a subset of the reported prime values. As such, this Report does not combine prime and subcontract utilization figures.
[3] In FY23, the Department of Design and Construction (“DDC”) registered a $3 billion contract to a non-certified firm for the design-build construction of the Brooklyn borough-based jail (referred to as “the DDC BBJ contract”). Construction contracts procured via design-build are expected to comply with the objectives and goals of LL 174, and as such are included in the overall utilization analysis. However, as an outlier in terms of contract value, this contract was excluded from the analysis of average value so as not to unduly skew the totals.
[4] In FY23, 11,244 contracts and POs were registered to Asian American male-owned MBEs, Hispanic American male-owned MBEs, Black male-owned MBEs, and Native American male-owned MBEs. 1,465 contracts and POs were registered to Asian American women-owned MBEs, Hispanic American women-owned MBEs, and Black women-owned MBEs. Additional information can be found in Table 12 of this Report.
[5] At the end of FY23, there were 10,992 certified vendors in the SBS Directory. 2,242 unique M/WBEs had a registered prime contract, subcontract, or PO in FY23.
[6] Of LL 174-eligible MMA1 contracts registered between FY16-FY23 (and have since expired), 43% of MMA1s registered to M/WBEs had 0% usage.
[7] Additional context and methodology for Agency rankings and comparisons can be found in the “M/WBE Utilization by Agency” Section and in Appendix D of this Report.
[8] The DOE did not approve any subcontractors in the PIP in FY23. As such, it is impossible to measure DOE’s actual M/WBE utilization or monitor compliance with established subcontracting goals.
[9] Summary data for prior fiscal years contained in this Report may reflect minor differences from tables in the FY22 Annual Report on M/WBE Procurement. Unless an update to the data methodology is otherwise noted, such discrepancies can be attributed to changes in vendor or contract characteristics since data was last pulled from FMS.
[10] Certification data is based on status reflected in FMS as of Fall 2023, when the data for this report was accessed. Vendors with non-profit organization types in FMS were also excluded from this Report’s analysis of LL 174 performance.
[11] State legislation was adopted granting authority to the DOE to utilize the same framework as LL 174 in 2020. The Panel for Educational Policy approved this change during FY23.
[12] Chapter 11(B) of Title 66 of the Rules of the City of New York lays out the City’s M/WBE Certification Program within SBS’ Division of Economic and Financial Opportunity.
[13] Certification eligibility requirements are detailed in Appendix A of this Report.
[14] A list of required documentation can be found on the SBS website here: https://www.nyc.gov/html/nycbe/downloads/pdf/MWBE_Document_Checklist.pdf
[15] NY State Senate Bill 2023-S7371: https://www.nysenate.gov/legislation/bills/2023/S7371
[16] RCNY §1-01(e)
[17] N.Y.C. Admin. Code §6-129(g)(2)
[18] See Appendix C for a full list of exclusions used to arrive at a subset of contracts subject to LL 174 participation goals. This chart excludes values for non-Mayoral agencies.
[19] While not mutually exclusive, most non-for-profit contract and PO value falls under the human services industry.
[20] City procurement systems are limited and do not include the necessary data to confirm if a contract is in fact funded by State or Federal funds. Due to these limitations, LL 174-eligible data in this Report includes some contracts that may actually be excluded from LL 174.
[21] https://comptroller.nyc.gov/reports/rethinking-emergency-procurements/
[22] NY State Senate Bill 2023-S7526: https://www.nysenate.gov/legislation/bills/2023/S7526
[23] NY State Senate Bill 2023-S7385: https://www.nysenate.gov/legislation/bills/2023/S7385
[24] https://comptroller.nyc.gov/reports/rethinking-emergency-procurements/
[25] As reflected in FMS at the time data for this report was pulled.
[26] In FY23, the Department of Design and Construction (“DDC”) registered a $3 billion contract to a non-certified firm for the design-build construction of the Brooklyn borough-based jail (referred to as “the DDC BBJ contract”). Construction contracts procured via design-build are expected to comply with the objectives and goals of LL 174, and as such are included in this analysis. In specified circumstances, this contract was excluded as an outlier in some of this Report’s targeted analyses. The DDC BBJ contract is very large and impacted the City’s M/WBE utilization rate for FY23. This contract has a 30% M/WBE utilization goal, which is expected to direct $900,000 to M/WBE subcontractors. Less than a year into the 6-year contract term, M/WBEs account for 1% of the value of approved subcontractors in PIP (as of February 6, 2024).
[27] https://www.census.gov/quickfacts/newyorkcitynewyork
[28] Though it is not a mayoral agency, the “M/WBE Utilization by Agency” section of this Report includes utilization data for the Comptroller’s Office for purposes of transparency and shared accountability. This section also includes Department of Education (DOE) utilization data, given the size and value of its contracting portfolio.
[29] This total does not include POs.
[30] Analyses of LL 174-eligible spending in this FY23 report was expanded to better capture exclusions against direct orders (DO1s) by drawing from the contract characteristics of their parent requirements contracts (MA1s).
[31] The $3 billion DDC BBJ contract (CT1-850- 20238807786) was excluded from this analysis as an outlier.
[32] From Table 3 and Table 4 of this Report
[33] The $3 billion DDC BBJ contract (CT1-850- 20238807786) was excluded from this analysis as an outlier.
[34] All of the average value charts in this section do not include the $3 billion DDC BBJ contract (CT1-850- 20238807786)
[35] See Appendix E for more details about the types of contracts and POs included in this analysis.
[36] 22 AM72s were excluded from this analysis because they were registered to vendors without M/WBE certifications indicated in FMS, at the time the data for this report was pulled.
[37] Micropurchases are limited in value to $20,000 for goods and services, or $35,000 for construction.
[38] The value of most small purchase methods is capped at $100,000.
[39] From December 2022 through the end of FY23, the maximum value for contracts procured under this method was capped at $1 million. Prior to December 2022, the value was capped at $500,000.
[40] As of January 3, 2024. The SBS Directory has also 13 firms certified as Native American MBEs.
[41] Although three prime contracts and two POs were registered to Native American M/WBE in FY23, the total value of these actions was less than 0.00% of value subject to LL 174 goals. For this reason, Native American M/WBEs are not reflected in this chart.
[42] PIP is the managed by FISA and is the system of record for approved subcontracts and subcontractor payments.
[43] MA1-040- 20239378391
[44] On October 6, 2022, New York State enacted new legislation increasing the dollar threshold for eligible procurements from M/WBEs from $500,000 to $1 million. The increased $1 million threshold became effective in January 2023, therefore procurement data for FY23 reflected a transition across the expanded thresholds – the maximum threshold for this method was $500,000 for the first two quarters of FY23 and $1 million for the third and fourth quarters of FY23
[45] These numbers exclude registered M/WBE NCSPs that were listed as registered to Non-Certified firms at the time this data was pulled from FMS. These records may reflect businesses that have lost their M/WBE certification since registration or agency input errors.
[46] These numbers represent contract values as of the time of initial registration. Agencies are permitted to increase the value of M/WBE NCSP method contracts through a contract modification so long as they do not exceed the stipulated threshold. The agency must also comply with any necessary rules and procedures for the contract modification.
[47] Federal Acquisition Rules cap the usage of the M/WBE NCSP award method at $250,000 for contracts funded with federal dollars. This may prevent agencies from utilizing this method for contracts with combined funding sources (that include $250,000 or more dollars from federal funds).
[48] Agencies only had the opportunity to utilize this method for contracts valued over $500,000 for 6 months of FY23. This data does not include procurements that were initiated in FY23 but registered in FY24.
[49] These numbers exclude registered M/WBE NCSPs that were listed as registered to Non-Certified firms at the time this data was pulled from FMS in January 2023. These records may reflect businesses that have lost their M/WBE certification since registration or agency input errors.
[50] For the purposes of this targeted analysis, MMA1s registered to the DOE and this Office were included in this review. While not otherwise included in LL 174-eligible datasets for this report, a limited number of MMA1s procured via renewal were included in this analysis after it was determined that their original contracts were subject to participation goals. See Appendix C for a list of LL 174 exclusions applied elsewhere in this report.
[51] This analysis totaled the value of dollars issued against associated task orders as of Fall 2023. These sums were then compared to the most recent modified versions of their associated MMA1 contracts.
[52] N.Y.C. Admin. Code §6-129(f)(i)(10)
[53] https://comptroller.nyc.gov/reports/annual-contracts-report/
[54] N.Y.C. Admin. Code §6-129(q)
[55] PPB Rule 3-16(b)
[56] https://app.equitableeconomies.com/?stay=yes
[57] Note: Z-scores were generated for both value and volume by comparing agency totals against their cohort averages. Then, the two scores for each agency were combined, giving greater weight to the value score, allowing for the creation of a unified standardized metric.
[58] The DDC BBJ contract has a 30% M/WBE utilization goal, which is expected to direct $900,000 to M/WBE subcontractors. In specified circumstances, this contract was excluded as an outlier in some of this Report’s targeted analyses, but was included in each of the tables and charts in this DDC Section of the Report.
[59] LL 174 stipulates that contracts subject to federal or state funding requirements are excluded from the M/WBE participation goals program. City procurement systems are limited and do not include the necessary data to confirm if a contract is in fact funded by State or Federal funds. Due to these limitations, LL 174-eligible data in this Report includes some contracts that may actually be excluded from LL 174.
[60] LL 174 stipulates that contracts subject to federal or state funding requirements are excluded from the M/WBE participation goals program. City procurement systems are limited and do not include the necessary data to confirm if a contract is in fact funded by State or Federal funds. Due to these limitations, LL 174-eligible data in this Report includes some contracts that may actually be excluded from LL 174.
[61] NYCEDC has its own Minority, Women-Owned, and Disadvantaged Business Enterprises (M/W/DBE) program that is not included in this Report.
[62] The $3 billion DDC BBJ contract (CT1-850- 20238807786) was excluded from this analysis as an outlier.
[63] 9 RCNY § 1-01(e)
[64] The $3 billion DDC BBJ contract (CT1-850- 20238807786) was excluded from this analysis as an outlier.
[65] The average PO value for the Construction Industry was $14,646. Notably, it was only $9,800 for black women and $1,090 for Asian women.
[66] 9 RCNY § 1-01(e)
[67] NYC Charter §823(a)
[68] As of December 15, 2023, DCAS, the Comptroller, and MOCS have authorized agencies to make purchases of goods using the M/WBE NCSP method up to $1,500,000 without involving DCAS. Notwithstanding the above, the DCAS Office of Citywide Procurement (OCP) shall continue procuring all fuel, furniture, and vehicles regardless of dollar value. Agencies may continue procuring non-bulk (e.g., event catering) and public health/safety goods (e.g., commodities used to protect the general welfare of the public including, but not limited to, medical supplies, law enforcement equipment, emergency response supplies/equipment and fire/life safety equipment) at values not to exceed $100,000 per twelve-month period.
[69] The average PO value for the Goods (Under $1 Million) Industry was $2,983.
[70] 9 RCNY § 1-01(e)
[71] The average PO value for the Professional Services industry was $5,304.
[72] 9 RCNY § 1-01(e)
[73] The average PO value for the standard services Industry was $2,448. Notably Black and Hispanic women had the highest average PO value.
[74] Federal Acquisition Rules cap the usage of the M/WBE NCSP method at $250,000 for contracts funded with federal dollars.
[75] This table does not include M/WBE NCSP method contracts registered to firms that were not listed as certified in FMS as of January 2023.
[76] This table does not include M/WBE NCSP method contracts registered to firms that were not listed as certified in FMS as of January 2023.
[77] https://comptroller.nyc.gov/reports/contract-primer/
[78] N.Y.C. Admin. Code §6-129(i)(6)(a) defines “Agency” as a ”city, county, borough, or other office, position, administration, department, division, bureau, board or commission, or a corporation, institution or agency of government, the expenses of which are paid in whole or in part from the city treasury.”
[79] 9 RCNY §3-08
[80] The M/WBE NCSP method is an exception to this threshold
[81] 9 RCNY §3-08
[82] Assembly Bill A10459: https://www.nysenate.gov/legislation/bills/2021/A10459
[83] While this threshold change was not codified in the PPB until June 2023, agencies were able to make purchases directly from M/WBEs up to the increased threshold using the Innovative Procurement method per PPB Rule §3-12
[84] Governor Hochul signed NY State Senate Bill 2023 – S7563 on December 8, 2023
[85] Table 21 of this Report
[86] GML §103 and applicable sections of the Code of Federal Regulations (CFR)
[87] NYC Charter §313
[88] GML § 100(5)
[89] NYC Charter §324
[90] PPB Rules §3-03(a)
[91] NYC Charter §319
[92] See PPB Rules §1-01(e), 3-02(o)(1)(iv), 3-03(a)(1), 3-03(g), and 3-03(g)(6)
[93]N.Y.C. Admin. Code §6-129(h)(2)(a)(e)
[94] NYC Office of the Comptroller Annual Summary Contracts Report Section “Group 2: Limited or Non-competitive Methods”
[95] NYC Charter §315 and 9 RCNY §3-06
[96] N.Y.C. Admin. Code §6-129(h)(2)(a)
[97] Chapter 11(B) of Title 66 of the Rules of the City of New York lays out the City’s M/WBE Certification Program within SBS’ division of economic and financial opportunity.
[98] https://legistar.council.nyc.gov/LegislationDetail.aspx?ID=3776475&GUID=140B19AA-8A79-4DF1-9A21-BB277797201F&Options=ID%7CText%7C&Search=1293-B
[99] https://legistar.council.nyc.gov/LegislationDetail.aspx?ID=3872955&GUID=391F7DE2-91E6-4D0C-9CAC-2AC8A166BF0E&Options=Advanced&Search=
[100] The data analyses pertaining to LL 174 participation goals included in this report use exclusions that align with these specified exceptions, detailed further in Appendix C.
[101] N.Y.C. Admin. Code §6-129(g)(2)
[102] N.Y.C. Admin. Code §6-129(g)(1)
[103] Pursuant to §11-61(d)(4)(a) of the Rules of the City of New York
[104] The data in this report uses rules employed by Checkbook NYC to assign industry classifications based on contract characteristics such as award category, contract type, and expense category. Expense categories may change over time based on the code selected by agencies when issuing new disbursements. Contracts that could not be mapped to the Construction, Goods, Professional Services, or Standard Service industries using these rules were labeled as “unclassified contracts.”
[105] Includes COMP and DOE