
Executive Summary
Each year, the City of New York purchases billions of dollars of goods and services, ranging from schools supplies to massive infrastructure projects. The City has both an opportunity and an obligation to ensure that the businesses who are awarded those contracts – which last year totaled $43 billion – reflect the diversity of New Yorkers. Despite decades of laws and programs designed to increase the number of Minority/Women-Owned Business Enterprises (M/WBEs) contracting with the City, the share of City dollars going to diverse businesses remains woefully small. [1]
New Yorkers see the work of M/WBEs contracted by the City in the programs, parks, and playgrounds they enjoy. The work of M/WBEs includes offering health and safety assistance, facilitating infrastructure improvements, and renovating schools, fire houses, and senior centers. M/WBEs have stepped up to help in the City’s efforts to address the ongoing impact of COVID-19 crisis and to provide shelter and services for asylum seekers.
- Last year, the Department of Design and Construction (DDC) relied on the work of Safeco Construction Corp., a Hispanic American male-owned Minority Business Enterprise (MBE), to provide needed repairs to pedestrian ramps, restoring accessibility in public spaces throughout the city.
- This year, the Taxi and Limousine Commission (TLC) worked with Navigator Technologies LLC, an Asian American male-owned MBE, to manage the design and build of its online licensing portal.
- The Department of Health and Mental Hygiene (DOHMH) partnered with Relationship & Psychology Consulting LLC, a Black women-owned MBE, to provide motivational interviewing and Mental Health training for DOE school officials.
Unfortunately, despite many efforts in recent decades, the City of New York has historically procured goods and services overwhelmingly from businesses owned by Non-Certified firms, including white men. The City’s procurement process and systems have historically fostered an inequitable landscape that require M/WBEs to jump higher over bureaucratic hurdles only to earn lesser returns.
In his 2023 State of the City address, Mayor Eric Adams announced plans to double the rate of the City’s current M/WBE contracts, with ambitious goals through FY26 and FY30.[2] He subsequently appointed the first ever citywide Chief Business Diversity Officer of Mayor’s Office of Minority and Women-Owned Business Enterprises to help fulfill these goals.
This Annual Report on M/WBE Procurement presents data on the City’s Fiscal Year 2022 procurement that will be necessary for focusing and evaluating those efforts. By shining a spotlight on M/WBE contracting, the report aims to identify progress, confront shortcomings honestly, and make recommendations for much-needed improvement to help enable the City deliver on its commitment for M/WBE businesses to receive their fair share of City contracting.
Key Findings
- M/WBEs continue to win only a small share of the value of City contracts. M/WBEs accounted for only 2% of the value of all new City contracts and Purchase Orders (POs) registered in FY22, and just 15.9% of the narrower universe of City contracts and POs subject to M/WBE participation goals under Local Law 174 (LL 174).[3] Similarly, M/WBEs received only 12.29% of the City’s total spending on prime contracts subject to LL 174 in FY22.
- Disparities among M/WBEs remain stark. Black (male- and women-owned) M/WBEs, Hispanic American (male- and women-owned) M/WBEs, Asian American women-owned MBEs, and Native American M/WBEs (male- and women-owned) each represent less than 2% of the value of all FY22 registered contracts subject to LL 174 participation goals. Over 70% of the value of M/WBE contracts in FY22 was awarded to firms owned by white women and Asian American men.
- M/WBEs win contracts that are much smaller on average. Many City agencies have succeeded in increasing the number of contracts they award to M/WBEs, often utilizing discretionary procurement methods intended to increase M/WBE access. Unfortunately, the LL 174 eligible contracts that M/WBEs win tend to be far smaller. The average value of a new contract registered in FY22 to a non-certified firm was $5.01 million, nearly eight times larger than the average value of a new contract registered to a M/WBE, which was just $679 thousand.
- Few City-certified M/WBEs actually do business with the City. In FY22, fewer than 18% of City-certified M/WBEs had a contract, purchase order, or approved subcontract registered by the City.[4]
- Subcontracting and M/WBE compliance processes are paper-based, opaque and ineffective. The current M/WBE compliance mechanisms are also too reliant on self-reporting by contracting agencies and prime vendors, in outdated or underutilized systems, which limits accountability as well as the City’s ability to meet the requirements of the M/WBE program.
- When M/WBEs do receive contract awards, they are not paid on time. Approximately 55% of M/WBE contracts registered in FY22 were retroactive, even worse than the citywide rate of approximately 52%. This is a particular challenge for smaller firms, without sufficient working capital to endure long wait times for payment.
Recommendations
Recommendation #1: Ensure that M/WBEs Have Access to Higher Value Contracts through Competitive Procurements. Wider adoption of M/WBE Prequalified Lists (PQLs) and the utilization of “Best Value” preferences is needed to direct higher-dollar-value contracting opportunities to eligible M/WBEs, particularly targeted to underutilized M/WBE Categories.
Recommendation #2: Bolster Agencies’ Use of Existing Discretionary Procurement Methods. Raising the threshold for the M/WBE Noncompetitive Small Purchase (NCSP) method and improving the use of discretionary micropurchases and small purchases will allow City agencies to drive contract awards to M/WBEs with limited targeted competition.
Recommendation #3: Reform the subcontracting process and incorporate it into PASSPort. Such reforms must ensure that prime vendors and contracting agencies are being held accountable for M/WBE participation goals on eligible prime contracts. Digitizing the subcontracting process and integrating it into PASSPort will bring greater accountability to meeting M/WBE goals for subcontractors.
Recommendation #4 Provide stronger tools to City agencies. The City must strengthen existing systems to make M/WBE data more accessible, improve the quality of data maintained by the systems so that agencies can find the right M/WBEs, and ensure there is sufficient capacity of ready, willing and able M/WBEs to compete for goods and services that the City procures.
Recommendation #5: Improve the timeliness of City contract registration. The City must remain committed to prioritizing needed reforms proposed by the Capital Process Task Force and Joint Task Force to Get Nonprofits Paid On Time to deliver faster and more cost-effective goods and services to New Yorkers in a way that increases investments to M/WBEs and reduces barriers to the participation and inclusion of these businesses in City contracting.
Agency and Sector Highlights
In addition to providing analysis of the overall state of city procurement with M/WBEs, this report provides a snapshot for each agency and compares M/WBE participation by industry. In Fiscal Year 2022:
- The Department of Small Business Services (90.1%), Department of Cultural Affairs (85.2%), and Department of Buildings (79.6%) had the highest share of contract value subject to LL 174 registered to M/WBEs.
- The Department of Finance (7.4%), Department of Environmental Protection (7.9%), and Department of Transportation (10.6%) had the lowest share of contract value subject to LL 174 registered to M/WBEs.
- The Department of Education is a non-mayoral agency and during FY22 was not subject to LL 174 participation goals. However, this Report includes data analyses for the DOE because it has the largest procurement portfolio in the City. If the same LL 174 participation goals were applied to the DOE, it would have the lowest share of contract value subject to LL 174 registered to M/WBEs (5.6%).
- The Department of Small Business Services, Department of Correction, and the Office of the Comptroller were the three most improved agencies from FY20 to FY22 in percentage of contract value subject to LL 174 registered to M/WBEs.
- The Office of Technology and Innovation (99 procurements), Department of Health and Mental Hygiene (73), and Department of Transportation (63) made the most frequent use of the M/WBE Noncompetitive Small Purchase method.
- Construction and Standard Services procurements lagged behind those for Goods and Professional Services in resulting prime contracts to M/WBEs.
Our Approach
This Annual Report provides a comprehensive review of FY22 contract registration data of New York City agencies and affiliated agencies to highlight the frequency in which M/WBEs are awarded contracts based on procurement method, dollar value, and industry to identify procedural roadblocks and other inequities that impact the way M/WBEs contract with the City.
In order to provide as accurate an assessment as possible, this year’s report makes several changes from prior years. This report includes data on both FY22 contract registrations (legally binding agreements between agencies and vendors that were registered during FY22) and POs, and FY22 spending on contracts (regardless of what year they were registered). In addition, the report presents data from multiple perspectives, including certification disparities, average contract value, procurement methods, and contract retroactivity. Unlike prior years, we do not combine these into a single letter grade, but instead present the full data for each agency.
In preparing this report, the Comptroller’s Office gathered stakeholder feedback from small and large M/WBEs across several sectors and from contracting agencies with practical experience to highlight the factors that present obstacles to M/WBEs from successfully working with the City.
Data
This Report largely measures M/WBE utilization in alignment with the expectations and M/WBE participation goals set in LL 174 and Section 6-129 of the New York City Administrative Code (“Administrative Code”) for eligible contracts.
LL 174 excludes large areas of City contacting including: Human Service contracts and other not-for-profit contracts (as they do not have owners or shareholders), Emergency Procurements, Intra-governmental contracts, contracts subject to federal or state funding requirements that preclude the City from imposing City-certified M/WBE participation goals or impose their own, and contracts issued by some non-mayoral agencies (including at the time of this report the Department of Education, the Economic Development Corporation, and the New York City Housing Authority).[5] This Report only includes information on M/WBEs certified by New York City and does not include information about contracts registered to businesses who may be New York State certified M/WBEs. This Report also does not include data related to Renewals. A full list of excluded considerations is included in Appendix C of this Report.
As a result of these exclusions, less than 14% of total City procurement for FY22 was subject to the M/WBE participation goals of LL 174.[6] The total for new contracts and purchase orders registered by the City during FY22 was $44,560,595,459 (of which 5.2% went to M/WBEs), while procurement subject to LL 174 was $6,149,586,703 (of which 15.91% went to M/WBEs).
In an effort to provide a broader view, therefore, in some circumstances data is included for contracting agencies and procurement actions not covered by Local Law 174. The report will specify when and where analyses pertain to contracts subject to participation goals or instead to citywide data sets.
Additional context and information about the City’s participation goals program and relevant guiding legislation can be found in Appendix A.
Findings
Finding #1: M/WBEs continue to win only a small share of the value of City contracts.
In FY22, the City registered 136,269 new contracts and POs valued at over $44 billion. This includes many areas of contracting that are not subject to LL 174 participation goals including human services contracts (which account for almost 43% of the registered contract value citywide). It also does not include Emergency contracts or contracts for non-mayoral agencies. Across all City contracts and POs, 24,033 were registered to M/WBEs, representing 5% of the value and 17% of the volume. This relative share of registered contracts remains generally stagnant with the share from prior fiscal years.
Table 1: All Registered New Contracts and POs Citywide, FY20-22
| Certification Type | # of Contracts | % Share of Number of Contracts | Total Registered Contract Value | % Share of Contract Value |
| FY20 | 116,926 | N/A | $23,501,616,476 | N/A |
| Non-Certified | 97,016 | 82.97% | $21,764,326,473 | 92.61% |
| M/WBEs | 19,910 | 17.03% | $1,737,290,004 | 7.39% |
| FY21 | 95,378 | N/A | $31,663,781,674 | N/A |
| Non-Certified | 74,104 | 77.70% | $30,199,840,438 | 95.38% |
| M/WBEs | 21,274 | 22.30% | $1,463,941,236 | 4.62% |
| FY22 | 136,269 | N/A | $44,560,595,459 | N/A |
| Non-Certified | 112,236 | 82.36% | $42,242,006,814 | 94.80% |
| M/WBEs | 24,033 | 17.64% | $2,318,588,645 | 5.20% |
The numbers are somewhat better for new contract registrations and POs subject to LL 174 M/WBE participation goals. Per Table 2, M/WBEs accounted for 57.83% of new contracts and POs subject to LL 174 participation goals by count, and 15.91% of the associated value. The 15.91% share reflects a marginal decrease from prior fiscal years.
This small share is especially disappointing, given the actual diversity and demographics of the City. For reference throughout this report: According to the U.S. Census, in 2022, New York City was 31.9% non-Hispanic white, 28.9% Hispanic or Latino, 23.4% Black, 14.3% Asian or Pacific Islander, 0.5% Native American, and 7.1% two or more races. And 52% women, and 48% men.[7]
Chart 1: FY22 Share of Contract and PO Value Subject to LL 174 Participation Goals
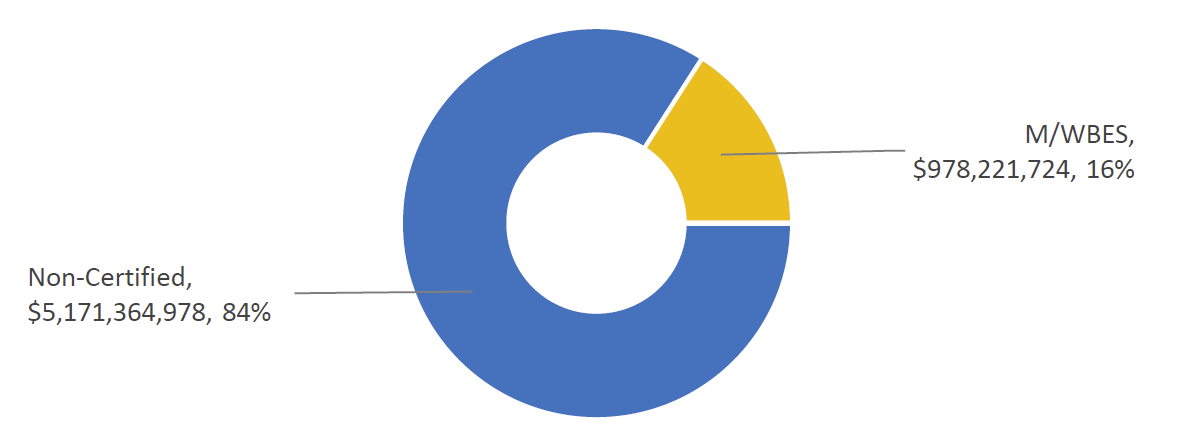
Table 2: New Contracts and POs – Subject to LL 174 Participation Goals, FY20-22[8]
| Certification Type | # of Contracts | % Share of Contracts | Total Registered Contract Value | % Share of Contract Value |
| FY20 | 26,994 | N/A | $3,849,452,447 | N/A |
| Non-Certified | 12,770 | 47.31% | $3,219,884,594 | 83.65% |
| M/WBEs | 14,224 | 52.69% | $629,567,853 | 16.35% |
| FY21 | 26,426 | N/A | $5,259,835,911 | N/A |
| Non-Certified | 10,162 | 38.45% | $4,394,002,487 | 83.54% |
| M/WBEs | 16,264 | 61.55% | $865,833,423 | 16.46% |
| FY22 | 29,486 | N/A | $6,149,586,703 | N/A |
| Non-Certified | 12,435 | 42.17% | $5,171,364,978 | 84.09% |
| M/WBEs | 17,051 | 57.83% | $978,221,724 | 15.91% |
The City spent a total of $6.72 billion in FY22 (prime contracts registered in FY22 and prior fiscal years subject to LL 174 participation goals), 12.29% of which ($826.33 million) was spent with M/WBE prime vendors, a modest increase in share compared to prior fiscal years.
Table 3: Prime Spend Subject to LL 174 Participation Goals, FY20-22
| Fiscal Year | M/WBE Spending | Non-Certified Spending | Total Spending | M/WBE Share |
| FY20 | $797,963,627 | $6,067,576,798 | $6,865,540,425 | 11.62% |
| FY21 | $774,832,134 | $6,024,249,948 | $6,799,082,082 | 11.40% |
| FY22 | $826,330,701 | $5,896,850,869 | $6,723,181,569 | 12.29% |
| Total | $2,399,126,462 | 17,988,677,615 | $20,387,804,077 | 11.77% |
M/WBE utilization varies depending on the industry. The Construction and Standard Services industries see some of the lowest spending and registration values to M/WBEs. Only 9% of Construction and 15% of Standard Services prime contract registration value subject to LL 174 participation goals were registered to M/WBEs. Similarly, only 11% of prime Construction spending and less than 15% of prime Standard Services Spending went to M/WBEs. Additional details analyzing M/WBE utilization at the industry level can be found in the “M/WBE Utilization by Industry” section of this Report.
Table 4: FY22 Value of M/WBE Prime Contract Registrations and POs, Subject to LL 174 Participation Goals, by Industry
| M/WBEs | Non-Certified | ||||
| Industry | Total Contract and PO Value | % Share of Contract and PO Value | Total Contract and PO Value | % Share of Contract and PO Value | |
|---|---|---|---|---|---|
| Construction | $379,322,280 | 9.35% | $3,679,602,595 | 90.65% | |
| Goods <$1 million | $91,147,171 | 56.17% | $71,120,120 | 43.83% | |
| Professional Services | $410,033,659 | 31.73% | $882,092,100 | 68.27% | |
| Standardized Services | $81,961,129 | 14.79% | $472,293,049 | 85.21% | |
| Grand Total | $962,464,239 | 15.86% | $5,105,107,864 | 84.14% | |
Table 5: FY22 Total Prime Vendor Spend Subject to LL 174 Participation Goals, by Industry
| M/WBE Category | Construction – % of Total Spending | Professional Services % of Total Spending | Standardized Services – % of Total Spending | Goods – % of Total Spending |
| All M/WBE | 11.05% | 15.11% | 14.55% | 15.42% |
| Non-Certified | 88.95% | 84.89% | 85.45% | 84.58% |
| Total | 100.00% | 100.00% | 100.00% | 100.00% |
It is important to note that these trends look different for subcontracted spending across industries. M/WBEs receive higher shares of subcontracted spending than non-certified firms in Construction, Professional Services, and Standardized Services. M/WBEs only receive a very small share of Goods subcontracted spending, as there is little subcontracting in this industry generally.
Table 6: FY22 Total Sub Vendor Spend Subject to LL 174 Participation Goals, by Industry
| M/WBE Category | Construction – % of Total Spending | Professional Services % of Total Spending | Standardized Services – % of Total Spending | Goods – % of Total Spending |
| All M/WBE | 53.59% | 66.95% | 58.57% | 4.44% |
| Non-Certified | 46.41% | 33.05% | 41.43% | 95.56% |
| Total | 100.00% | 100.00% | 100.00% | 100.00% |
Finding #2: Disparities among different categories of M/WBEs remain stark
The City is falling even farther short when it comes to contracting with Black, Hispanic American, and Native American-owned businesses and businesses owned by Asian American women (collectively “underutilized M/WBE categories”), each of which represent less than 2% of the value of all FY22 registered contracts subject to LL 174 participation goals.
Viewed as a share of the value of all M/WBE contracts, Black M/WBEs represent less than 10%, and Hispanic American M/WBEs only 11%. To date, the City has not awarded a prime contract to a Native American M/WBE.[9] Over 70% of the value of M/WBE contracts subject to LL 174 participation goals were registered to businesses owned by white women or Asian American males.
Table 7: FY22 Registrations for Contracts and POs Subject to LL 174 Participation Goals, by M/WBE Category
| M/WBE Category | # of Contracts and POs | % Share of LL Contracts and POs | Total Contract and PO Value | % Share of LL Contract and PO Value | % Share of All M/WBE LL Contract and PO Value |
| Asian American M/WBEs | 10,600 | 35.95% | $347,237,468 | 5.65% | 35.50% |
| Black M/WBEs | 1,156 | 3.92% | $96,853,512 | 1.57% | 9.90% |
| White WBEs | 3,905 | 13.24% | $431,400,898 | 7.02% | 44.10% |
| Hispanic American M/WBEs | 1,389 | 4.71% | $102,709,871 | 1.67% | 10.50% |
| Native American M/WBEs | 1 | 0.00% | $19,976 | 0.00% | 0.00% |
| Grand Total | 17,051 | 57.83% | $978,221,724 | 15.91% | 100.00% |
Table 8: FY22 Registered Contracts Subject to LL 174 Participation Goals, by M/WBE Category and Gender
| M/WBE Category | # of Contracts or POs | % Share of Contracts and POs | Total Contract and PO Value | % Share of Contract and PO Value | % Share of All M/WBE Value |
| Asian American male-owned MBEs | 9,734 | 33.01% | $290,201,026 | 4.72% | 29.67% |
| Asian American women-owned MBEs | 866 | 2.94% | $57,036,441 | 0.93% | 5.83% |
| Black male-owned MBEs | 826 | 2.80% | $61,811,290 | 1.01% | 6.32% |
| Black women-owned MBEs | 330 | 1.12% | $35,042,222 | 0.57% | 3.58% |
| Hispanic American male-owned MBEs | 1,152 | 3.91% | $93,966,605 | 1.53% | 9.61% |
| Hispanic American women-owned MBEs | 237 | 0.80% | $8,743,266 | 0.14% | 0.89% |
| Native American male-owned MBEs | 1 | <.01% | $19,976 | <.01% | <.01% |
| White WBEs | 3,905 | 13.24% | $431,400,898 | 7.02% | 44.10% |
| M/WBE ALL (Not Included in Grand Total) | 17,051 | 57.83% | $978,221,724 | 15.91% | 100.00% |
| Non-Certified | 12,435 | 42.17% | $5,171,364,978 | 84.09% | N/A |
| Grand Total | 29,486 | 100.00% | $6,149,586,703 | 100.00% | N/A |
Chart 2: Value of Contracts and POs Subject to LL 174 Participation Goals, By Race, FY20-22[10]
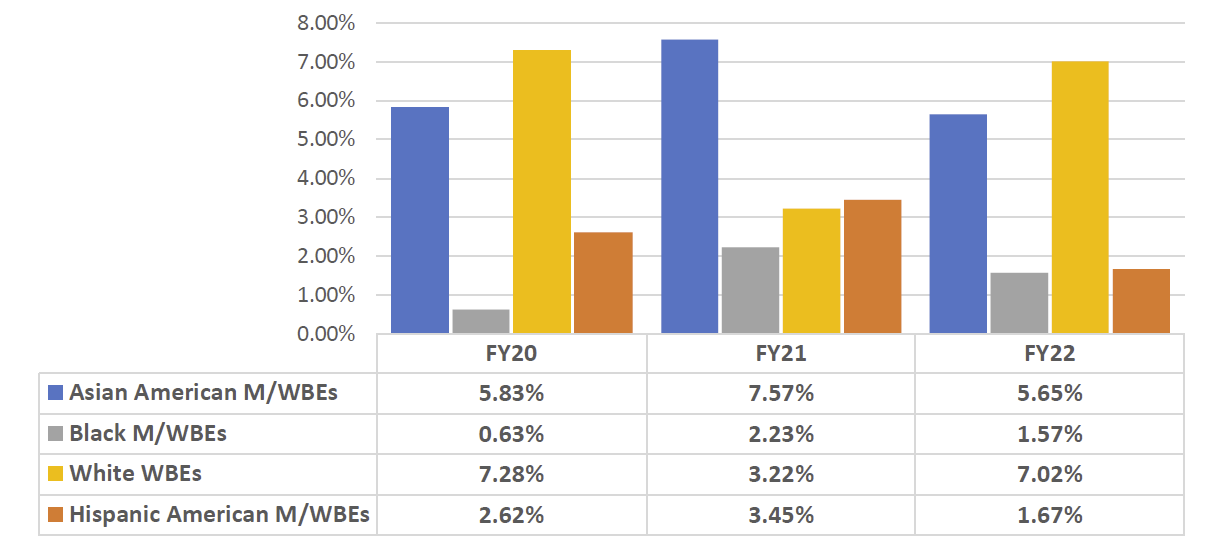
Table 9: FY22 M/WBE Contracts and POs Subject to LL 174 Participation Goals, as a Share of Total M/WBE Contracts, by M/WBE Category
| M/WBE Category | Number of Contracts and POs | % of M/WBE Contracts | Total $ Value | % Share of M/WBE value | % Share of All Value subject to LL 174 goals |
| Asian American M/WBEs | 10,600 | 62.17% | $347,237,467 | 35.50% | 5.65% |
| Black M/WBEs | 1,156 | 6.78% | $96,853,511 | 9.90% | 1.57% |
| Hispanic American M/WBEs | 1,389 | 8.15% | $102,709,871 | 10.50% | 1.67% |
| Native American M/WBEs | 1 | 0.01% | $19,976 | 0.00% | 0.00% |
| White WBEs | 3,905 | 22.90% | $431,400,897 | 44.10% | 7.02% |
| Grand Total | 17,051 | 100.00% | $978,221,724 | 100.00% | 15.91% |
These trends are true in analyzing both contract registrations and spend data – though, Black M/WBEs received an even smaller portion of prime spending in comparison to other M/WBE categories.
Table 10: FY22 Prime Spending Subject to LL 174 Participation Goals, by Race
| Category – By Race | Total Spend | % Share of Total City Spending | % Share of Spending Out of Total M/WBE Spending |
| Asian American M/WBEs | $386,755,404 | 5.75% | 46.80% |
| Black M/WBEs | $47,578,167 | 0.71% | 5.76% |
| Hispanic American M/WBE | $120,227,530 | 1.79% | 14.55% |
| White WBEs | $271,769,600 | 4.04% | 32.89% |
| Non-Certified | $5,896,850,869 | 87.71% | N/A |
| Total | $6,723,181,569 | 12.29% | 100% |
Women-Owned Firms Lag Behind
Overall, the City’s utilization of MBEs owned by women is significantly less than the low utilization of MBEs owned by males. The data shows that the disparity is even more stark across businesses owned by women across difference races. The total number of LL 174-eligible contracts registered to businesses owned by white women (3,905) was more than double the total count of contracts registered to all other women-owned MBEs combined (1,433). Furthermore, contracts registered to businesses owned by white women represented a larger value (7.02%) than the value of all contracts registered to all women-owned MBEs combined (1.64%).
This is driven in part by the fact that there are more certified businesses owned by white women in the Department of Small Business Services (SBS) Online Directory of NYC Certified Vendors (“the SBS Directory”) than there are certified women-owned MBEs for all minority categories combined (Black women-owned MBEs, Hispanic American women-owned MBEs, Asian American women-owned MBEs, and Native American women-owned MBEs). In order for agencies and vendors to contract with underutilized M/WBE categories, SBS must target its certification efforts particularly with women-owned MBEs.
Within each racial category, male certified firms consistently represent larger shares of the counts of registered contracts and POs. Male-owned MBEs account for more than double (11,713) the total number of contracts and POs registered to women-owned M/WBEs (5,338, including white WBEs).
Finding #3: M/WBEs Win Contracts That Are Much Smaller on Average
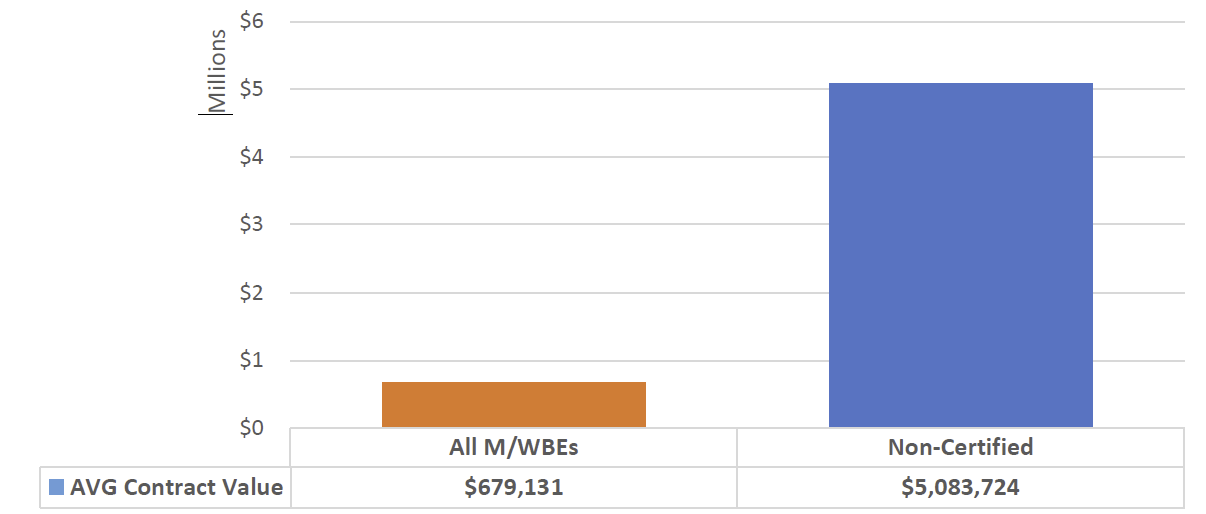
Our analysis identifies a key factor contributing to the unsatisfactory utilization rate: the average dollar value of registered M/WBE contracts is significantly lower than the average dollar value of contracts registered to non-certified firms. As a result, M/WBEs are jumping higher hurdles for lower returns.
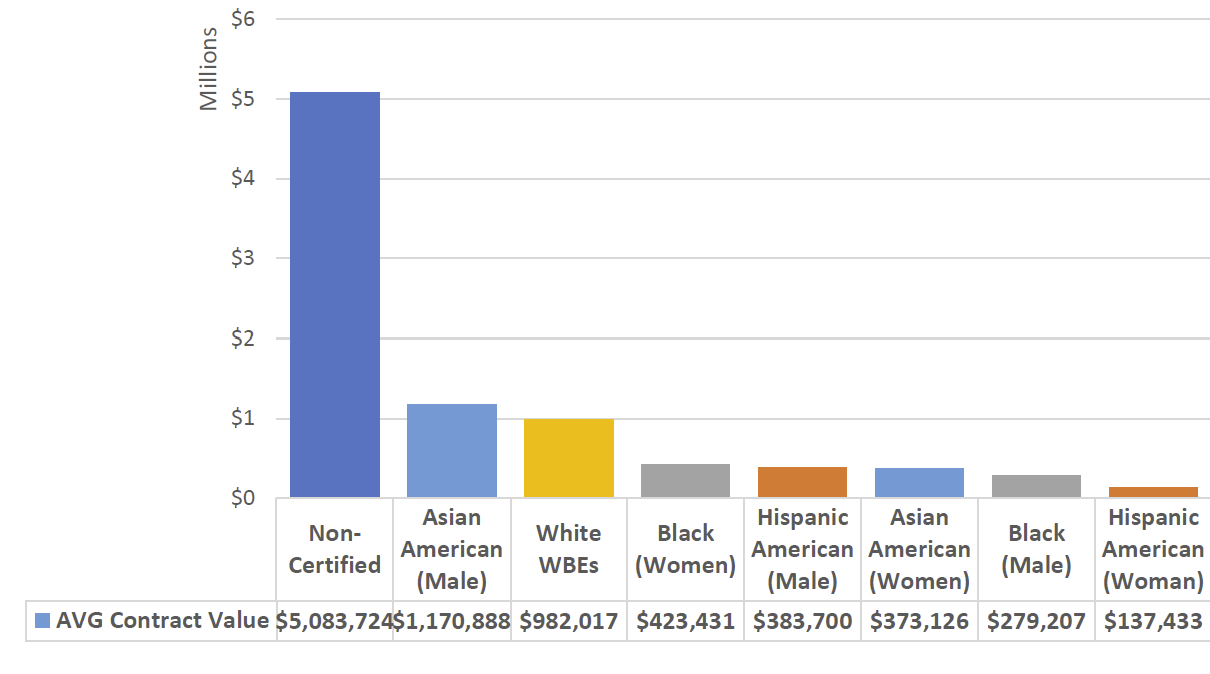
In analyzing FY22 registrations subject to LL 174 participation goals, the average dollar value of a contract registered to a M/WBE ($679,131) was less than 14% of the average dollar value of a contract registered to a Non-Certified firm ($5.08 million).
Chart 3: Average Value of Registered Contracts Subject to LL 174 Participation Goals
Award Method Analyses
A tension exists in the City’s M/WBE procurement: Award methods with agency discretion – such as Micropurchase, Small Purchase, and M/WBE NCSP– are more likely to result in a prime contract with an M/WBE; however, these discretionary methods generally result in lower-dollar-value contracts. However, even within competitive methods – both Competitive Sealed Bid (CSB) and Competitive Sealed Proposal (CSP) – the average contract value for M/WBEs is far lower than for non-certified firms.
Table 11: FY22 Registered Contracts by Award Method, Citywide[11]
| Award Method | M/WBE | Non-Certified | ||
| Award Method Category | # of contracts | % Share of contracts | # of contracts | % Share of Contracts |
|---|---|---|---|---|
| Methods Without Discretion | ||||
| CSB | 143 | 25.72% | 413 | 74.28% |
| CSP | 136 | 8.01% | 1562 | 91.99% |
| Accelerated Procurements | 11 | 10.38% | 95 | 89.62% |
| Total | 290 | 12.29% | 2070 | 87.71% |
| Methods With Discretion[12] | ||||
| Demonstration Projects | 0 | 0.00% | 24 | 100.00% |
| Innovative Procurement Contracts | 3 | 2.91% | 100 | 97.09% |
| Micropurchase Contracts | 21,395 | 17.87% | 98,314 | 82.13% |
| Negotiated Acquisition Contracts | 21 | 2.04% | 1007 | 97.96% |
| Small Purchase Contracts – General | 1,122 | 14.01% | 6,887 | 85.99% |
| M/WBE – NCSP[13] | 944 | 100% | 0 | 0% |
| Total | 23,485 | 18.97% | 100329 | 81.03% |
Table 12: FY22 Average Value of Registered Contracts by Award Method, Citywide
| Award Method | M/WBE – AVG Contract Value | Non-Certified – AVG Contact Value |
| Methods Without Discretion | ||
|---|---|---|
| CSB | $2,998,811 | $11,786,323 |
| CSP | $5,773,720 | $8,582,401 |
| Accelerated Procurements | $143,196 | $2,153,685 |
| Methods With Discretion[14] | ||
| Demonstration Projects | N/A | $1,959,954 |
| Innovative Procurement Contracts | $42,195,277[15] | $4,443,022 |
| Micropurchase Contracts | $3,424 | $2,679 |
| Negotiated Acquisition Contracts | $9,700,570[16] | $2,961,258 |
| Small Purchase Contracts – General | $36,699 | $27,165 |
| M/WBE NCSP method | $134,907 | N/A |
Disaggregated By Race
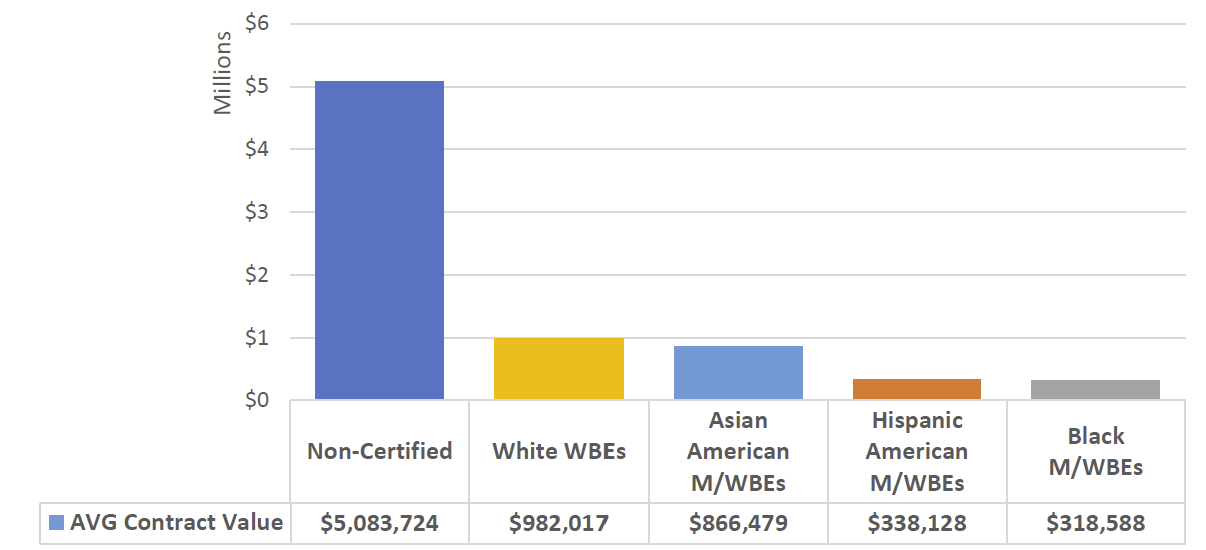
Underutilized M/WBE Categories also earn less lucrative contracts than businesses owned by white women and Asian American males.
Chart 4: FY22 Average Value of Registered Contracts Subject to LL 174 Participation Goals, by M/WBE Category
Disaggregated By Gender
The value of contracts and POs subject to LL 174 participation goals registered to male-owned MBEs (7.25%) is more than four times the value of contracts registered to women-owned MBEs (1.64%). Hispanic American women-owned MBEs represented the smallest relative share, whose contract value represents only 0.14% of all registrations (and <1% of M/WBE registrations).
With the exception of Black M/WBEs, the average value of women-owned MBE contract registrations is consistently lower than the value of male-owned MBE contract registrations. The starkest contrast exists for Hispanic American women-owned MBEs – the average contract registered to a Hispanic American women-owned MBE ($137,433) is only worth roughly 2.70% of the average value of a contract registered to a Non-Certified firm (~$5.1 million). This analysis also highlights a significant gender disparity across Asian American M/WBEs – the average dollar value of a contract registered to an Asian American male-owned MBE contract is about $1.17 million, whereas the average dollar value for contract registered to an Asian American women-owned MBE is only about $373,000.
Chart 5: FY22 Average Value of Registered Contracts Subject to LL 174 Participation Goals, by Race and Gender
Finding #4: Only a Small Percentage of City-Certified M/WBEs Actually Do Business with the City
The City’s most recent disparity study was published in 2018 to analyze the availability and representation of M/WBEs in City contracting (from the years 2006-2015). This disparity study established the foundation for the goal-setting process and has informed the City’s metrics for certification (additional information can be found in Appendix A of this report). The City has dedicated significant resources in the past few years to increase the number of certified M/WBEs in the SBS Directory.
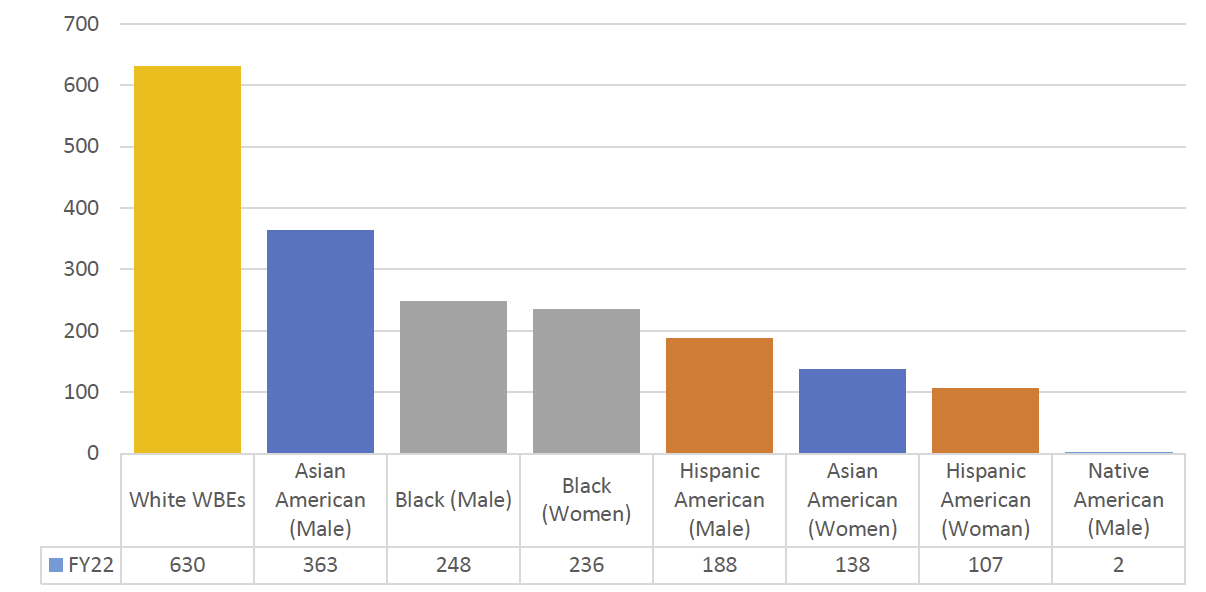
As of June 30, 2022, there were 10,768 City-certified M/WBEs in the SBS Directory.[17] However, only 1,912 (17.76%) of these certified M/WBEs entered a new contract, subcontract, or PO with the City in FY22.[18] There have been increases since FY20 for several underutilized M/WBE Categories: Asian American women-owned MBEs (138, increased from 98 in FY20); Black women-owned MBEs (236, increased from 163 in FY20); Black male-owned MBEs (248, increased from 192 in FY20); and Hispanic American women-owned MBEs (107, increased from 87 in FY20).
It goes without saying that the City’s economy today is significantly different than in 2015, and so the City is long overdue for a study that reflects its current state. In its Local Law 63 Plan, SBS planned to release an RFP for a “Citywide Disparity Study- Analysis of Citywide M/WBE Goals” with an anticipated contract start date of January 2023.[19] As of the date of this Report, there is no record of the contract in PASSPort Public nor has it been submitted for Comptroller’s Office registration review. It is imperative that the City takes immediate steps to advance the procurement of the disparity study to better reflect the state of the current economy and the availability of M/WBEs. Furthermore, this study should also explore whether the current categories of “minority groups” is sufficiently representative and reflective of the constituents and business owners in New York City.[20]
Table 13: Unique M/WBEs with New Prime Contracts, Purchase Orders, or Subcontracts, FY20-22
| M/WBE Category | FY20 | FY21 | FY22 |
| Asian American male-owned MBEs | 387 | 313 | 363 |
| Asian American women-owned MBEs | 93 | 101 | 138 |
| Black male-owned MBEs | 192 | 205 | 248 |
| Black women-owned MBEs | 163 | 174 | 236 |
| Hispanic American male-owned MBEs | 205 | 198 | 188 |
| Hispanic American women-owned MBEs | 87 | 75 | 107 |
| Native American male-owned MBEs | 0 | 1 | 2 |
| White WBEs | 652 | 580 | 630 |
| All Male-Owned MBEs (Not Reflected in “Total”) | 784 | 717 | 801 |
| All Women-Owned MBEs (Not Reflected in “Total”) | 343 | 350 | 481 |
| Total | 1,779 | 1,647 | 1,912 |
Chart 6: FY22 Unique M/WBEs with New Prime Contracts, Purchase Orders, or Subcontracts
Finding #5: Subcontracting and M/WBE Compliance Processes Are Paper-Based, Opaque and Ineffective
Subcontracting is an alternative way for M/WBEs to get involved in City contracting. Many prime vendors are required to subcontract work components to fulfill the M/WBE participation goals that may be established on the contract. By connecting with a prime vendor, an M/WBE can create meaningful subcontract opportunities today that can lead to direct contracts with the City tomorrow.
Unfortunately, the City’s subcontracting ecosystem is largely paper-based, with most required steps still occurring outside of electronic systems. This outdated and opaque process creates barriers for M/WBEs that rely on subcontracting as a pathway to partner with prime vendors and to cultivate direct opportunities with contracting agencies. The lack of a dynamic, end-to-end workflow system for subcontracting intensifies the challenges for M/WBEs and leads to difficulties in holding contracting agencies and prime vendors accountable for abiding by the City’s rules and procedures around subcontracting.
City procurement rules specify that each subcontractor must be approved by the contracting agency before starting work.[21] This approval is often obtained through a process that is managed by the prime vendor, who works with potential subcontractors and contracting agencies to submit documents for review and, upon contract registration, enter subcontractor information into the Payee Information Portal (PIP).
To account for the reality that City contracts are often registered retroactively (after the contract work has already started), the City has created a preliminary approval process that allows prime vendors to front-load subcontractor approvals. The preliminary approval process obligates prime vendors to complete and submit a paper Subcontractor Approval Form (SAF) to the contracting agency for an offline review, outside of a centralized system. The agency’s review of the paper SAF is often protracted, and sometimes does not happen at all. Across the three fiscal years since FY20, 17 agencies recorded no approved subcontractors in PIP, and an additional 10 agencies approved fewer than 10 subcontractors. Because of its self-reporting nature, an agency’s lack of approved subcontractors in PIP may be due to its failures to ensure compliance with the City’s subcontracting rules and procedures and/or to set inefficient M/WBE participation goals on the prime contract.
The lack of transparency associated with this offline process causes confusion and uncertainty that leads to projects starting behind schedule from the beginning. This is damaging to M/WBE subcontractors, to the City, and to the communities that are counting on a City project to be completed on time and on budget.
The preliminary approval may come with conditions that a subcontractor file vendor and principal questionnaires in the City’s PASSPort procurement database, and provide other supporting documentation, including but not limited to a SBS Division of Labor Services (DLS) employment report, professional licenses, Project Labor Agreement (PLA) letters of assent, apprenticeship agreements and references. Once the prime contract is registered, the prime vendor can formally submit all subcontractors for approval through PIP, which in this instance serves as a database for prime vendors with contracts valued at $250,000 or more to manage subcontractor approvals and record subcontractor payments. Unfortunately, PIP does not manage the submission and review of supporting documents that may be required for a subcontractor to get approved, further clouding an already disjointed process.
Once a subcontractor approval is reflected in PIP, prime vendors are then required to report on all payments made to subcontractors within 30 days of paying the subcontractor for the work performed. Subcontractor payment data is self-reported by the prime vendor, so validation may be difficult. Contracting agencies can request documentation or use other means to verify subcontractor participation and payment such as payment voucher forms, cancelled checks, periodic audits of prime vendors, job site inspections and performance evaluations. Because many of the validation activities also occur offline and aren’t directly tied to contract management activities in a system, contracting agencies, prime vendors, and subcontractors can face difficulty interacting with each other in a meaningful, transparent fashion.
The City isn’t fully maximizing M/WBE subcontractors by continuing to deploy paper-based processes along with a system (PIP) that is disconnected from other contract management, vendor disclosure, and payment activities that occur in other City systems. The current landscape fails to provide prime vendors or subcontractors with an ability to monitor the status of agency reviews or a central platform to submit required documents to get a subcontractor approved or to prove that a subcontractor was paid.
“My visibility in PIP is limited – I can’t always see if my prime contractors are in compliance with M/WBE goals or not.”
The tools for monitoring compliance with M/WBE participation goals are decentralized and too reliant on self-reporting
The City does not have centralized tools to properly measure compliance with meeting M/WBE participation goals on contracts, many of which are met through subcontracting. The current M/WBE compliance mechanisms are also too reliant on self-reporting by contracting agencies and prime vendors in outdated or underutilized systems, which limits accountability as well as the City’s ability to meet the requirements of the M/WBE program.
For contracts subject to M/WBE participation goals under Local Law 174, agencies are required by MOCS policy to enter M/WBE participation goal requirements into the City’s Financial Management System (FMS) along with prime contractor and contract information, the total value of anticipated subcontracts, and industry classifications among other details. This data entry exercise is the sole responsibility of the agency and occurs separate and apart from the traditional activities that happen in PASSPort and FMS in connection with processing and registering a contract. As a result, the City depends on contracting agencies to enter M/WBE participation goals in FMS, which may not always occur, and to monitor compliance using FMS and agency-specific tracking mechanisms.
Prime vendors with contracts that are subject to M/WBE participation goals must also submit a subcontractor utilization plan (also referred to as a list of subcontractors) to the contracting agency within 30 days of a notice to proceed, and every 12 months throughout the duration of the contract.[22] This plan must list all the vendors that the prime vendor intends to award subcontracts to within the next 12 months, and ultimately shows how a prime vendor will meet its M/WBE obligations over the course of the contract. This submission process (when it does happen) occurs on paper and outside of City systems, which can lead to agencies failing to hold prime vendors accountable from the outset of a project can result in M/WBE participation goals being missed or not fully maximized.
Finding #6: When M/WBEs do receive contract awards, they are not paid on time
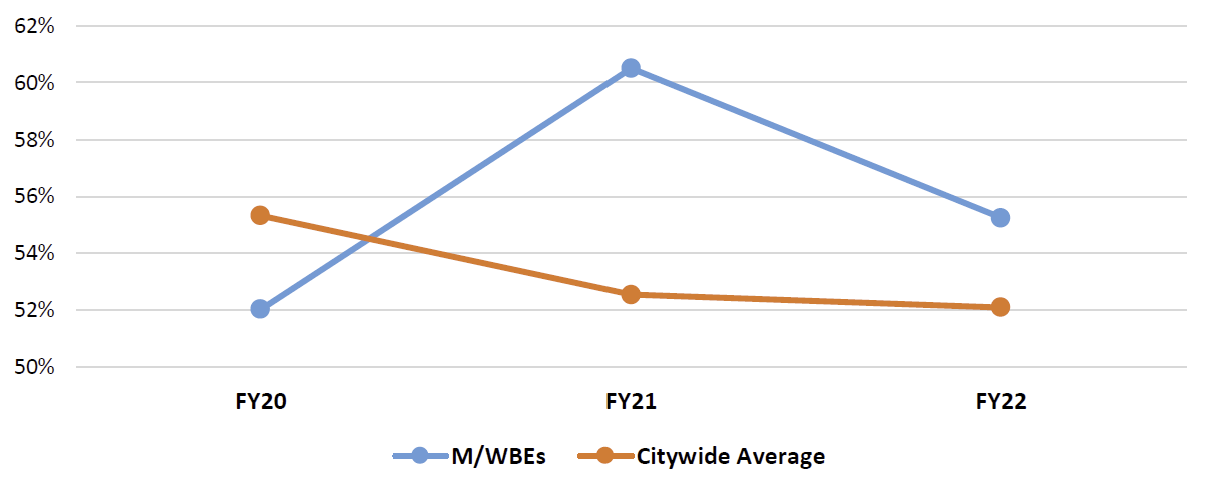
The City’s lengthy contracting processes too often compromise the stability of its contractors. In FY22, over 55% of new contracts with M/WBEs were registered retroactively, after the beginning of their contract term, compared with the 52% citywide average. This forces M/WBEs to advance funds out of limited working capital, to seek to borrow in order to start the project, or to delay work. In some circumstances, it means M/WBEs are providing City services without any guarantee of pay. This is especially challenging given that average M/WBE contract sizes are smaller, and that many M/WBEs are small businesses that lack sufficient working capital and may have a more challenging time borrowing from traditional lending institutions.
Table 14: FY22 New M/WBE Contract Registrations by Retroactive Category, Citywide
| Retroactive Category | # of Contracts | % Share of Contracts | Total Contract Value | % Share of Contract Value |
| On Time or Early | 1,193 | 44.75% | $621,227,332 | 27.68% |
| Late – Within 30 days | 606 | 22.73% | $392,544,775 | 17.49% |
| Later – Between 31-180 days | 673 | 25.24% | $1,027,777,171 | 45.79% |
| Very Late – Between 181-365 Days | 130 | 4.88% | $135,353,991 | 6.03% |
| Latest – More than 1-year | 64 | 2.40% | $67,759,384 | 3.02% |
| Grand Total | 2,666 | 100.00% | $2,244,662,655 | 100.00% |
Chart 7: Citywide Share of Late Registrations by Count, FY20-22
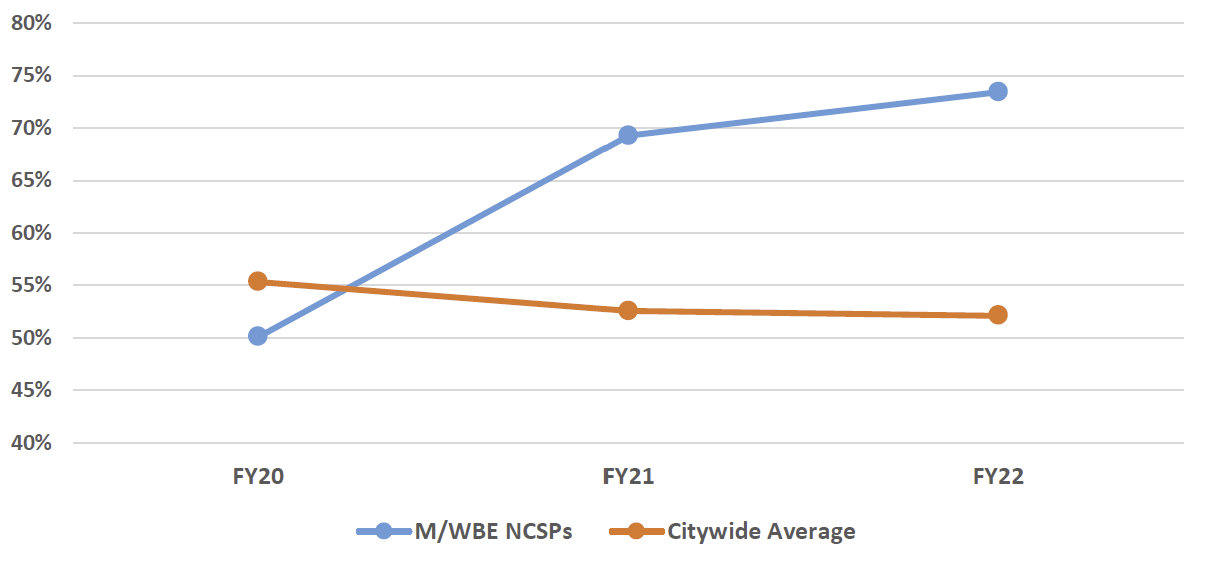
Retroactive registration is even higher, on average, for procurements using the M/WBE NCSP method, despite the fact that the Comptroller’s office has delegated authority to allow agencies, with appropriate oversight measures, to self-register contracts procured pursuant to the M/WBE NCSP method. In doing so, vendors awarded contracts using this method do not wait up to 30-calendar days for their contract to be registered, which then provides a vehicle by which they are able to be paid. Yet, despite the time savings this provides, agencies are still self-registering contracts after their start date at a greater rate than for M/WBE contracts that are registered by the Comptroller.
Table 15: FY22 M/WBE NCSP Registrations by Retroactive Category, Citywide
| Retroactive Category | # of Contracts | % Share of Contracts | Total Contract Value | % Share of Contract Value |
| On Time or Early | 251 | 26.59% | $31,218,862 | 24.51% |
| Late – Within 30 days | 335 | 35.49% | $38,222,414 | 30.01% |
| Later – Between 31-180 days | 303 | 32.10% | $48,317,876 | 37.94% |
| Very Late – Between 181-365 Days | 50 | 5.30% | $8,923,518 | 7.01% |
| Latest – More than 1-year | 5 | 0.53% | $669,623 | 0.53% |
| Grand Total | 944 | 100.00% | $127,352,292 | 100.00% |
Chart 8: Citywide Share of Late M/WBE NCSP Registrations by Count, FY20-22
Recommendations
Recommendation #1: Ensure that M/WBEs Have Access to Higher Value Contracts through Competitive Procurements
1.1 Establish more M/WBE Prequalified Lists (PQL)
CSB and CSP are appropriately the primary vehicles by which the City awards higher-dollar value contracts. Procurement Policy Board rules authorize agencies to limit competition pools for procurements pursuant to RFBs and RFPs to vendors on pre-qualified lists. Pursuant to State legislative authority, PQLs may also be established exclusively for M/WBEs. Agencies may also establish PQLs that, as a condition of prequalification, require that a significant portion of any awarded contract funds be spent with M/WBEs (either as prime vendors or through subcontracting).
The Comptroller’s Office supports the recommendation of the Capital Process Reform Task Force to increase the use of M/WBE exclusive prequalified lists.[23] Some agencies have successfully utilized both types of PQLs, but wider adoption of PQLs is needed to direct higher-dollar-value contracting opportunities to eligible M/WBEs, particularly targeted the for underutilized M/WBE Categories. In addition to the utilization advantages, PQLs intend to fast track the award of contracts, which offers an opportunity for agencies to procure critical goods and services more quickly, and to improve timeliness of registrations.
City systems such as PASSPort and FMS already include identifiers for procurements pursuant to PQLs, but additional enhancements would better highlight the use of PQLs that are specifically targeted to direct opportunities to M/WBEs at either the prime or subcontracting levels.
1.2 Utilize “Best Value” Preferences
The PPB Rules also already provide authorization for contracting agencies to provide M/WBE bidders and proposers with “best value” price or point preferences in all new procurements (see Appendix A of this Report for more information). The City is obligated to monitor agency compliance with the M/WBE Program generally, but “best value” remains underutilized and unenforced by oversight agencies.[24]
To tackle this problem, the City must make necessary changes in PASSPort to require oversight review of all CSBs and CSPs to determine whether the contracting agency properly considered M/WBE price or point preferences in their solicitation documents. Such enforcement can be amplified by reducing or rescinding delegated procurement and/or contracting authority of contracting agencies that are missing the mark on best value, as is permitted under LL 174.
Additionally, there is no designated identifier in either PASSPort or FMS to accurately reflect procurements that utilize the “best value” preference. The lack of transparency further masks the ability to track whether City agencies are effectively exercising their discretion to offer point preferences to M/WBEs. PASSPort and FMS enhancements should create award methods that identify the use of Best Value in RFBs and RFPs. As a joint administrator of FMS, the Comptroller’s Office is committed to working with the Mayoral Administration and FISA to effectuate any changes that will bring additional transparency to this process, including the use of “best value.”
Recommendation #2: Bolster Agencies’ Use of Existing Discretionary Procurement Methods
The PPB Rules authorize agencies to choose from multiple procurement methods that allow contracting agencies latitude to make direct contract awards to M/WBEs without formal competition under appropriate conditions. These methods are often also quicker and have limited and condensed procedural steps, which make them nimbler than some of the methods discussed elsewhere in this Report.
The dollar value of awards made through discretionary methods is generally lower than through other methods. As a result, expanding the use of these methods will not address the fact that M/WBE contracts are significantly lower in value on average. These methods do, nonetheless, give many M/WBEs real opportunities to provide goods and services to meet the needs of City agencies. These smaller awards are a meaningful entry point for smaller M/WBEs who are looking to start contracting with the City and over time can help contribute to a larger pool of M/WBEs that are ready and able to take on larger contracts.
2.1 Achieve broader and higher dollar use of the M/WBE NCSP Method
The M/WBE Noncompetitive Small Purchase (NCSP) method allows City agencies to make direct contract awards to M/WBEs with limited targeted competition. In general, contracting agencies leverage this method by soliciting at least three quotes from certified M/WBEs and then awarding the contract to a responsible vendor that offers a fair and reasonable price. With a threshold higher than those for micro- and small purchases, the method is one of the City’s most effective tools in driving prime contract awards to M/WBEs.
When first authorized by the State Legislature in 2017, the M/WBE NCSP method threshold was only up to $150,000 and limited to goods and services. In 2019, the M/WBE NCSP method was expanded up to $500,000 and to include construction. Procurement for FY22 reflected this $500,000 threshold.
Since it was introduced in FY20, the M/WBE NCSP method has made up a significant share of new M/WBE contract registrations (35.41% in FY22). In FY22 city agencies registered 944 contracts via the M/WBE NCSP method, valued at over $127 million.[25] These numbers represent contract values as of the time of initial registration.[26]
Table 16: Contracts Registered Using the M/WBE NCSP Method, Citywide, FY20-22
| Fiscal Year | # of M/WBE NCSP Contracts | % Share of All M/WBE Contract Registrations | Total Value of M/WBE NCSPs | AVG Contract Value of M/WBE NCSP |
| FY20 | 1,190 | 52.12% | $94,340,220 | $79,277 |
| FY21 | 833 | 39.69% | $87,566,148 | $105,121 |
| FY22 | 944 | 35.41% | $127,352,292 | $134,907 |
| Grand Total | 2,967 | N/A | $309,258,661 | $104,233 |
However, the FY22 registration data illustrates that many agencies focused their use of the M/WBE NCSP method at values far below the $500,000 threshold. In FY22, 83.58% of contracts registered using the M/WBE NCSP method were below $250,000, half the maximum value permitted by the Rule.[27] Almost three quarters of the contracts registered using this method did not exceed $150,000, the initial cap set back in 2017.
Table 17: FY22 Contracts Registered Using the M/WBE NCSP Method, Citywide[28]
| Contract Value | Black | Asian American | Hispanic American | White WBE | Total | Percent |
| Less than $150K | 180 | 177 | 205 | 145 | 707 | 74.89% |
| $150K – $250K | 20 | 29 | 15 | 18 | 82 | 8.69% |
| $250K – $450K | 19 | 36 | 18 | 20 | 93 | 9.85% |
| $450K – $500K | 14 | 19 | 6 | 23 | 62 | 6.57% |
| Grand Total | 233 | 261 | 244 | 206 | 944 | 100.00% |
The share of M/WBE NCSP registrations by count are relatively evenly distributed across race. Still, businesses owned by Asian American males and white women had a higher average dollar value than contracts registered to M/WBEs in other categories.
Table 18: FY22 Contracts Registered Using the M/WBE NCSP Method, Citywide, by M/WBE Category[29]
| M/WBE Category | # of Contracts | Percent of All M/WBE NCSP | NCSP Share of Total M/WBE Category Registrations | AVG M/WBE NCSP Value |
| Asian American male-owned MBEs | 114 | 12.08% | 4.54% | $175,610 |
| Asian American women-owned MBEs | 147 | 15.57% | 5.85% | $138,574 |
| Black Male-owned MBEs | 167 | 17.69% | 6.65% | $122,383 |
| Black women-owned MBEs | 66 | 6.99% | 2.63% | $145,420 |
| Hispanic American male-owned MBEs | 201 | 21.29% | 8.00% | $89,915 |
| Hispanic American women-owned MBEs | 43 | 4.56% | 1.71% | $160,785 |
| Native American M/WBEs | 0 | 0% | 0% | 0% |
| White WBEs | 206 | 21.82% | 8.20% | $155,047 |
| Grand Total | 944 | 100.00% | 37.56% | $134,907 |
The Comptroller’s Office recently delegated authority to City agencies and DOE to permit them to self-register contracts procured pursuant to the M/WBE NCSP method, while maintaining appropriate oversight measures. This delegation provides a tool that contributes to eliminating the retroactive registration of M/WBE contracts so that they are timely paid.
Mayor Adams and his Administration took an important step to build upon this in signing Executive Order 26 (EO 26) in February 2023 to focus on increasing participation in underutilized M/WBE Categories.[30] EO 26 formalizes a Recovery for All policy put in place by the DeBlasio Administration in July 2021 (the beginning of the fiscal year covered in this Report). Given the disparate findings in this Report, the City must also take affirmative steps to establish responsible measures to hold agencies accountable for eliminating bias and the underutilization of certain M/WBE groups by enforcing EO 26.
To that end, as a condition for delegating registration authority directly to agencies, the Comptroller’s Office mandated additional reporting and oversight requirements to make more transparent the City’s use of the M/WBE NCSP method with the expectation that tracking and reporting on utilization will highlight areas that require intentional focus. Commencing this calendar year, the City is required to publish reports on key performance indicators including the total unique M/WBE vendors that have been awarded contracts through the M/WBE NCSP method and a disaggregation of awarded M/WBE data by racial and gender categories. The first of these public reports is due by the City on August 15, 2023.
The delegation also mandates that the City review anticipated agency contract management actions at or below the new $1 million threshold to ensure that contracting agencies are maximizing use of this method.
2.2 Raise the M/WBE NCSP method threshold to $1.5 million
On October 6, 2022, New York State enacted new legislation increasing the dollar threshold for eligible procurements from M/WBEs from $500,000 to $1 million. In line with prior legislative approvals, this provides the City with the legal authority to codify changes in the PPB Rules to reflect the increased dollar threshold. Recognizing this historic opportunity, Comptroller Lander urged the PPB to convene to immediately commence the procedural process to enact the amendment. In December 2022, the PPB convened for the first time in three years and unanimously approved amending the PPB Rules to raise the threshold to not only align with the current State legislative authority up to $1 million, but also offers the flexibility to swiftly implement increases moving forward.
In January 2023, the NYC Capital Process Reform Task Force released its final set of immediate recommendations, seeking further State Legislative authority to increase the M/WBE NCSP method threshold to up to $1.5 million, consistent with the threshold for other public entities such as the Metropolitan Transportation Authority (MTA). Governor Hochul included legislation to increase the threshold to $1.5 million in her FY24 Executive Budget. The Comptroller’s Office urges the State Legislature to support this change.
“I am so excited for this increased threshold for the M/WBE noncompetitive small purchase award method. This will really give my business (and others like mine) a chance to actually grow, not to just stay alive.”
2.3 Ensure that discretionary micropurchases and small purchases are more fairly distributed to M/WBEs
Micropurchase procurements are those that do not exceed $20,000 for most goods and services, or up to $35,000 for construction. These purchases allow for the most discretion of any procurement method. The Rules require that agencies making micropurchases ensure that the purchases are distributed appropriately, including to M/WBEs. Yet the data shows that even when given wide discretionary latitude, the City is still not sufficiently contracting with M/WBEs.
Given the lower dollar value, Micropurchases are entered into either as registered contracts or POs. A total of 1,353 new contracts were registered in FY22 using the Micropurchase method for a total value of $13.67 million, and the City also issued 118,356 purchase orders at or below the Micropurchase threshold, for an average value of under $3,000, and a total value of $322.94 million.
M/WBEs accounted for 17.9% of the volume of these Micropurchases, and 27.82% of their total value.
Table 19: FY22 Micropurchases, Citywide
| Certification Type | Number of Contracts and POs | % Share of Contracts and POs | Total Contract and PO Value | AVG Value |
| Non-Certified | 98,314 | 82.13% | $263,358,009 | $2,679 |
| M/WBE | 21,395 | 17.87% | $73,261,077 | $3,424 |
The Small Purchase method also enables agencies to procure goods, services, and construction without formal competition or public advertisement, at a greater threshold. Given that the method affords agencies a quicker mechanism to procure goods and services, small purchases account for a large share of registered procurement actions in FY22. There are mechanisms built into this method that aim to facilitate M/WBE participation. Despite this, agencies are still not effectively utilizing M/WBEs using this method. In FY22, the 8,009 Small Purchase contracts and POs account for a total value of $227.83 million. M/WBEs accounted for 14% of the volume of these small purchases, and only 21.8% of their total value. Additional details on this method can be found in Appendix A of this report. When the threshold of the procurement overlaps with the M/WBE NCSP method, agencies should be directed to use the M/WBE NCSP method, given that it limits the competition to certified M/WBEs.
Table 20: FY22 Small Purchases, Citywide
| Certification Type | Number of Contracts and POs | % Share of Contracts and POs | Total Contract and PO Value | AVG Value |
| Non-Certified | 6,887 | 85.99% | $187,087,775 | $27,165 |
| M/WBE | 1,122 | 14.01% | $40,743,526 | $36,699 |
Recommendation #3: Reform the subcontracting process and incorporate it into PASSPort
Reforming the subcontracting process is critical for enhancing M/WBE participation and ensuring transparency. Such reforms must ensure that prime vendors and contracting agencies are being held accountable for M/WBE participation goals on eligible prime contracts.
The City should, therefore, eliminate the paper-based subcontractor submission and review process and incorporate the Payee Information Portal (PIP) subcontractor process into PASSPort with end-to-end functionality. These technology enhancements will create a one-stop-shop for contracting agencies, prime vendors, and subcontractors to manage all the activities related to their City contract. An online platform with workflow functionality that allows for document submission, review and approval steps, and information sharing would streamline subcontractor approvals and reduce barriers for M/WBEs. It would also allow the City to collect more reliable, trustworthy, and transparent data to monitor compliance with M/WBE participation goals and target outreach in particular sectors and industries where there may be subcontracting gaps or bottlenecks.
While this will be no small task, in recent years the City has successfully moved its vendor management activities (previously handled offline, on paper and in VENDEX) and its procurement and contract management process (also handled offline, on paper and in Automated Procurement Tracking system, or APT) into PASSPort. This brought many inefficient, paper-based processes into an electronic platform that cut down processing times, leveraged information sharing amongst vendors and contracting agencies, and brought transparency to those same stakeholders along with other interested parties with the recent PASSPort Public innovations.
Recommendation #4 Provide stronger tools to City agencies
New York City is full of capable, ready, and willing M/WBEs; however, finding them can present a challenge for contracting agencies. Recent investments in PASSPort, the SBS Directory, and Checkbook, have offered needed access to data and facilitated greater transparency. However, without targeted enhancements, these systems will continue to fall short of providing the level of access and information needed to narrow the wide disparities identified in this report. Information and resources remain in difficult-to-navigate silos that prevent agencies from achieving greater M/WBE utilization. The City must strengthen existing systems to make data more accessible across City tools and improve the quality of data maintained by the systems.
4.1 Update the training and guidance that agencies receive to reflect changes in procurement methods, markets, City goals, and best practices
In their work to increase M/WBE utilization, procurement officers are required to consider unique factors that vary by procurement, including its size and nature, the availability of certified M/WBEs with the capacity to perform the specific types and scale of work involved, appropriate or required licensing, vendors’ existing active contracts (private and public), past work experience and performance, and the value and scope of the vendor’s contracting portfolio. Agencies must also identify areas of work that may be subcontracted, and in doing so are directed to consider both subcontracting areas identified on past similar contracts and the current market and industry analyses that could result in new subcontracting opportunities.
The current resources available to agency procurement officers are complicated and outdated. Agencies are directed to use an offline Excel template worksheet to set goals for each eligible procurement. This worksheet does help standardize some consideration factors across agencies, but it is cumbersome to use and requires extensive training and resources for agencies to understand how to complete it.
The City has not issued revised goal-setting training or resources on BuyWise, the online platform that supports City procurement professionals, in at least five years. The current resources available to agencies include: a 2015 Best Practices Memo; a 69-page 2017 M/WBE Goal Setting Process Training Materials; and a 2018 Revised M/WBE Goal-Setting Policy Memo.
It is unrealistic to expect agency officials to navigate each of these documents to set a single goal, a process required for each of the 1,360 new contracts and 517 task orders registered in FY22 subject to LL 174. This outdated guidance also fails to provide agencies with training on current market trends and analyses necessary to develop informed metrics. Agencies should have access to expert insight into evolving industries, including sectors that may have opened more opportunities for subcontracting than previously existed.
Furthermore, these tools are completed individually and used offline, without support or oversight from the NYC Mayor’s Office of Contract Services (MOCS) or the NYC Office of Minority and Women Business Enterprises (OM/WBE). This provides the City and the public with little insight into what goals are set for each procurement, and how this may vary across agencies or industries. Modernized resources and tools will help Agencies set and achieve more realistic and ambitious M/WBE utilization goals.
4.2 Make data relevant to M/WBE procurement more easily accessible across City data tools and contracting systems
New York City agencies and vendors leverage many systems, platforms, and resources that support its contracting functions. Appendix A of this Report includes context and details about the many key technology resources that are particularly relevant when discussing contracting with M/WBEs. The City must prioritize a series of targeted integrations and enhancements of these systems to remedy the pervasive and incidental administrative hurdles preventing agencies from developing a broad, diverse pool of M/WBE partners.
These enhancements will allow for better information sharing to support agencies and M/WBEs alike. Among its many features, Checkbook NYC allows users to view the contracting and spend history of virtually all City agencies. Users can search for data on contracts with prime vendors and subcontractors, and focus searches for M/WBEs. This information should be leveraged as both a helpful transparency tool and to foster connections between agencies and M/WBEs doing business with the City. For M/WBEs not yet doing business with the City, Checkbook also provides search functionalities that offer information that can be used for direct networking and outreach.
The City should streamline this process by integrating Checkbook functionality into other City systems like the SBS Directory. M/WBE Vendor Profiles in the SBS Directory should be enhanced to include a Checkbook NYC link that would provide real-time registration and spend data that more accurately reflects an M/WBE’s capacity to undertake City contracts. This up-to-date information will bolster the market research and vendor outreach required of agencies when targeting vendors when using discretionary award methods. It will also support agencies in establishing appropriate participation goals required of prime vendors.
SBS has already begun important work to strengthen the connection between the SBS Directory and FMS. FMS will soon include additional essential details, including real time certification dates, which will be critical to ensure that agencies are able to identify M/WBEs as they become certified, and also to better ensure compliance if a certification status changes.
PASSPort Public would also benefit from several enhancements, including the development of functionality to allow users more useful options to accurately search for solicitations and contracts. For example, users have the ability to search open solicitations by filtering for the “RFI (M/WBE)” procurement method, seemingly to identify currently issued M/WBE NCSP method solicitations. However, search results do not accurately display the solicitations issued through this method, making it unhelpful for M/WBEs looking to identify potential opportunities that are meant to specifically target their participation.
PASSPort Public should also be expanded to provide information regarding subcontracting opportunities. The NYC Economic Development Corporation (NYCEDC) offers many resources to interested M/WBE subcontractors than can act as a model for other mayoral agencies, and perhaps for PASSPort, to follow.[31] NYCEDC allows M/WBEs to join Interested Subcontractor Lists, review Plan Holders Lists, and see what prime contractors have recently been awarded contracts. M/WBE subcontractors would benefit from this level of insight for other contracting agencies throughout the City.
4.3 Validate commodity codes so agencies can find the right M/WBEs
A commodity code is a standardized number for a product or service that a vendor might offer to the City and is used by agencies to find and target eligible M/WBEs. PASSPort allows vendors to enroll in commodities to connect them directly to applicable City contracting opportunities. Prior to issuing a solicitation or request for bids, proposals or quotes, City agencies generate a vendor competition pool by selecting the appropriate commodity codes associated with the goods or services that are being procured. During Comptroller’s Office focus groups, agency contracting staff shared that these commodity codes are often too general and may cast too wide of a net, making it difficult for agencies to find M/WBEs that actually aligned with the specific goods or services that are being procured. Conversely, there are times when commodity codes are too narrow, thereby leaving able M/WBEs out of the procurement competition pool.
In fulfillment of their responsibilities outlined in LL 174, SBS, OM/WBE, and MOCS must work closely with City contracting practitioners to strengthen the integrity and accuracy of commodity codes. It is imperative that M/WBEs are appropriately and timely classified in order to ensure compliance with procurement rules. At the time of certification and regularly thereafter, the City must proactively engage with M/WBEs to review selected commodity code and confirm alignment with the goods and services that they are able to provide. Given the large number of certified entities, engagement should be prioritized first to support underrepresented M/WBEs: Black M/WBEs, Hispanic American M/WBEs, Native American M/WBEs and Asian American women-owned MBEs.
Recommendation #5: Improve the timeliness of City contract registration
The City’s lengthy contracting processes are compromising the stability of its contractors. Over half of new contracts registered to M/WBEs were registered after the beginning of their contract term. This forces M/WBEs to advance funding, borrow to cover those advances, adjust, or delay work, and in some cases provide City services without any guarantee of pay.
Through the Capital Process Reform Task Force and the Joint Task Force to Get Nonprofits Paid on Time, the Comptroller’s Office and the Adams Administration have begun collaborative efforts to advance substantial reforms to the procurement system.
The New York City Capital Process Task Force was convened by then First Deputy Mayor Lorraine Grillo in April 2022 to undertake a comprehensive review of the City’s capital process and advocate for recommendations to reform capital delivery. The Task Force issued 39 recommendations to reduce timelines for capital project completion, achieve taxpayer savings, enhance vendor participation and inclusion in the construction industry, and increase the City’s capacity to address emerging needs
Nine of the recommendations involve changes in State legislation. Governor Hochul included three of them in her FY2024 Executive Budget – including expanded use of alternative delivery methods and raising the threshold for the M/WBE NCSP method from $1 million to $1.5 million. The Mayor and Comptroller are advocating for the inclusion of the remaining items with the State Legislature.
The remaining 30 recommendations call for action at the City level, including doubling the number of projects that use the Capital Project Scope Development fund, creating a template and establishing standard response times for the Certificate to Proceed process, and expanding the “Expanded Work Allowance” program for unforeseen field conditions from DDC to all other agencies. As part of this work, the Comptroller’s Office recently revised Comptroller’s Directive 10 to update interpretations of capital eligibility in limited scenarios where warranted.
The Joint Task Force to Get Non-Profits Paid on Time developed a series of recommendations to reform the City’s procurement process and ensure that nonprofits are paid on time, in full, and with certainty so they can keep doing their jobs of meeting the needs of New Yorkers. Many of these reforms will also benefit M/WBEs. The Task Force recommended that the City create new processes and routines to hold City stakeholders accountable for timely procurement and contracting procedures and make information about the process transparent to nonprofit providers and the public; and establish new processes to streamline and modernize the procurement and contracting process to reduce inefficiencies. Following the initial work of the Task Force, the City engaged McKinsey & Company to conduct a full-scale review and identify concrete process improvements. The First Deputy Mayor, Mayor’s Office of Contracts Services, Comptroller’s Office, and other agency stakeholders continue to meet on a regular basis to drive implementation of those reforms.
Together, these reforms will address outdated and lengthy procurement processes and aim to deliver faster, more cost-effective, high-quality goods and services to New Yorkers. The City must remain committed to prioritizing these needed reforms in a way that increases investments to M/WBEs and reduces barriers to the participation and inclusion of these businesses in City contracting.
M/WBE Utilization by Agency
This Section includes individual analyses for City agencies with LL 174-eligible contract registrations and spend. Though not subject to LL 174 participation goals, this Section also includes the same analyses for the Department of Education (DOE), given the size and value of its contracting portfolio. Similarly, for transparency and accountability this Section also includes analyses for the Comptroller’s Office.
These analyses provide a detailed understanding into the contract registration data, spend data and other procurement trends of each individual agency.[32] It is important to note that each agency procures different goods and services, has different operating budgets, and different priorities – so a one for one comparison may not always be appropriate. The Annual Summary Contracts Report includes more helpful information about contracting across agencies.
However, it can be helpful and informative to note patterns and trends across agencies, including the count and value of contracting opportunities across similar industries. Agencies are encouraged to review data pertaining to sister agencies that procure similar goods and services for best practices or to identify areas where they can share context or resources to improve their utilization. These analyses are intended to be reviewed in combination with the findings throughout the rest of the Report, including in the next Section by industry.
These analyses do not capture agency utilization information about businesses certified by other municipalities, including those who may be NY State certified M/WBEs or federal Disadvantage Business Enterprises (DBE)[33]. Some City agencies such as DOT Department of Transportation (DOT), Department of Parks and Recreation (DPR), and Department of Design and Construction (DDC) procure large contracts funded by federal transportation funds that are subject to DBE goals, and therefore must satisfy DBE participation requirements. Compliance with these non-City requirements is not reflected in this Report.
Ranked Measures:
These ranked measures are intended to provide additional context for the individual agency data. Rankings were made in consideration of a few measures that were conducive to cross-agency comparison:
- The relative share of LL 174-eligible contract and purchase order value that was registered to M/WBEs
- The number of contracts registered using the M/WBE NCSP method for each agency
- The average value of contracts registered using the M/WBE NCSP method for each agency
These considerations were made to ensure that smaller agencies would not be disadvantaged against agencies with larger budgets and procurement portfolios, since the first measure examines relative value shares, and citywide average M/WBE NCSP dollar value never rose above $135 thousand.
Rankings: Share of LL 174-Eligible Contract and PO Value Registered to M/WBEs
The following agencies registered the highest share of the value of LL 174-eligible contracts and POs to M/WBEs in FY22. The agencies in this list have varied sizes of procurement portfolios, funding sources, and account for purchases of goods and services in all industries.
Table 21: Top Five Agencies – FY22
| Agency | % Share of LL 174 Contracts registered to M/WBEs |
| Small Business Services (SBS) | 90.13% |
| Department of Cultural Affairs (DCLA) | 85.18% |
| Department of Buildings (DOB) | 79.63% |
| Department of Youth and Community Development (DYCD) | 73.79% |
| Business Integrity Commission (BIC) | 65.65% |
The agencies in Table 22 registered the lowest share of LL 174-eligible contract and PO value to M/WBEs. Many of the agencies in this list have some of the largest procurement portfolios in the City. Some of these low utilization rates may reflect additional constraints referenced earlier in the report, such as federal or state funding requirements.
Table 22: Bottom Five Agencies – FY22
| Agency | % Share of LL 174 Contracts registered to M/WBEs |
| Department of Education (DOE) | 5.60% |
| Department of Finance (DOF) | 7.43% |
| Department of Environmental Protection (DEP) | 7.91% |
| Department of Transportation (DOT) | 10.62% |
| Department of Design and Construction (DDC) | 12.41% |
The following agencies showed the largest improvement in utilization relative to FY20 levels. The agencies in this list have varied sizes of procurement portfolios, and account for purchases of goods and services in all industries.
Table 23: Five Most Improved Agencies – FY20-22
| Agency | FY20 | FY22 | Difference |
| Small Business Services (SBS) | 32.67% | 90.13% | 57.45% |
| Department of Corrections (DOC) | 23.21% | 63.03% | 39.81% |
| Comptroller (COMP) | 11.40% | 37.01% | 25.61% |
| Business Integrity Commission (BIC) | 44.79% | 65.65% | 20.86% |
| NYC Office of Emergency Management (NYCEM) | 10.29% | 30.38% | 20.09% |
Agency Rankings: Utilization of M/WBE NCSP Method by Count
The following LL 174-rated agencies utilized the M/WBE NCSP method most frequently in FY22. These agencies typically have larger procurement portfolios.
Table 24: Top Five Agencies – FY22
| Agency | # of Contracts Registered using M/WBE NCSP method |
| Office of Technology and Innovation (OTI) | 99 |
| Department of Health and Mental Hygiene (DOHMH) | 73 |
| Department of Transportation (DOT) | 63 |
| Fire Department (FDNY) | 57 |
| Department of Citywide Administrative Services (DCAS) | 54 |
The agencies in Table 25 utilized the M/WBE NCSP method least frequently in FY22. Generally speaking, these are all agencies with relatively small procurement portfolios.
Table 25: Bottom Five Agencies – FY22
| Agency | # of Contracts Registered using M/WBE NCSP method |
| Landmarks Preservation Commission (LPC) | 1 |
| Department of City Planning (DCP) | 1 |
| Department of Probation (DOP) | 2 |
| Civilian Complaint Review Board (CCRB) | 3 |
| Department of Investigation (DOI) | 3 |
The agencies in Table 26 showed the biggest increases in the count of contracts registered using the M/WBE NCSP method since FY20. Generally speaking, these agencies all have large procurement portfolios. Notably, DOI appears in Table 25 (bottom five agencies for M/WBE NCSP method utilization) as well as the most improved rankings. Given the overall decline in M/WBE NCSP method utilization by count since FY20, an increase of 3 registrations was enough for an agency to reach the top five.
Table 26: Five Most Improved Agencies – FY20-22
| Agency | FY20 | FY22 | Difference |
| Office of Technology and Innovation (OTI) | 77 | 99 | 22 |
| Department of Parks and Recreation (DPR) | 29 | 50 | 21 |
| Small Business Services (SBS) | 11 | 24 | 13 |
| Department of Design and Construction (DDC) | 19 | 27 | 8 |
| Department of Investigation (DOI) | 0 | 3 | 3 |
Agency Rankings: Utilization of M/WBE NCSP Method by Average Contract Value
As previously mentioned, the average value of a contract registered using the M/WBE NCSP method in FY22 was $134,907. The agencies in Table 27 utilized the M/WBE NCSP method to register contracts with the highest average contract value in FY22. Most of these agencies generally tend to procure high-dollar-value contracts.
Table 27: Top Five Agencies – FY22
| Agency | AVG Value of contracts registered using the M/WBE NCSP method |
| Small Business Services (SBS) | $207,713 |
| Department of Homeless Services (DHS) | $206,250 |
| Department of Design and Construction (DDC) | $197,322 |
| Administration for Children’s Services (ACS) | $184,271 |
| Department of Cultural Affairs (DCLA) | $180,029 |
Table 28 displays agencies that utilized the M/WBE NCSP method with the lowest average contract value in FY22. Most of these agencies generally tend to have small procurement portfolios.
Table 28: Bottom Five Agencies – FY22
| Agency | AVG Value of contracts registered using the M/WBE NCSP method |
| Landmarks Preservation Commission (LPC) | $22,500 |
| Department of City Planning (DCP) | $23,167 |
| Department of Probation (DOP) | $51,968 |
| Civilian Complaint Review Board (CCRB) | $55,840 |
| Department of Investigation (DOI) | $58,731 |
Table 29 ranks the top five agencies showing the largest increase in average value of contracts registered utilizing the M/WBE NCSP method since FY20. Most of these agencies generally tend to have relatively large procurement portfolios.
Table 29: Five Most Improved Agencies – FY20-22
| Agency | FY20 | FY22 | Difference |
| Department of Design and Construction (DDC) | $68,655 | $197,322 | $128,667 |
| Department for the Aging (DFTA) | $56,275 | $179,495 | $123,220 |
| New York Police Department (NYPD) | $56,340 | $171,233 | $114,894 |
| Department of Homeless Services (DHS) | $94,898 | $206,250 | $111,352 |
| Administration for Children’s Services (ACS) | $75,456 | $184,271 | $108,815 |
Administration for Children’s Services (ACS)
ACS predominantly contracts with vendors for human services, which are exempt from LL 174 participation goals. Therefore, the data included here represents a relatively small share of ACS’ total procurement portfolio. The relative count and the M/WBE share of registered contract value for these contracts is significantly higher than the Citywide average. Well over half of ACS’ total spend against prime contracts went to M/WBEs in each of the last three FYs. As is the case with most human services agencies, ACS has higher rates of retroactivity than the Citywide average, though this has improved since FY21. There were zero approved subcontractors tied to LL 174 eligible contracts in PIP for FY20, FY21, or FY22.
Table 30: LL 174-Eligible Contracts and POs – FY20-22
| Certification Status | # of Contracts | % Share of Contracts | Total Registered Contract Value | % Share of Registered Contract Value |
| FY20 | 427 | N/A | $12,200,936 | N/A |
| Non-Certified | 277 | 64.87% | $6,112,696 | 50.10% |
| M/WBE | 150 | 35.13% | $6,088,240 | 49.90% |
| FY21 | 244 | N/A | $21,179,862 | N/A |
| Non-Certified | 167 | 68.44% | $14,933,724 | 70.51% |
| M/WBE | 77 | 31.56% | $6,246,137 | 29.49% |
| FY22 | 361 | N/A | $26,783,863 | N/A |
| Non-Certified | 203 | 56.23% | $13,845,990 | 51.70% |
| M/WBE | 158 | 43.77% | $12,937,873 | 48.30% |
| Grand Total | 1,032 | N/A | $60,164,662 | N/A |
Chart 9: FY22 Value of LL 174-Eligible Prime Contracts and POs
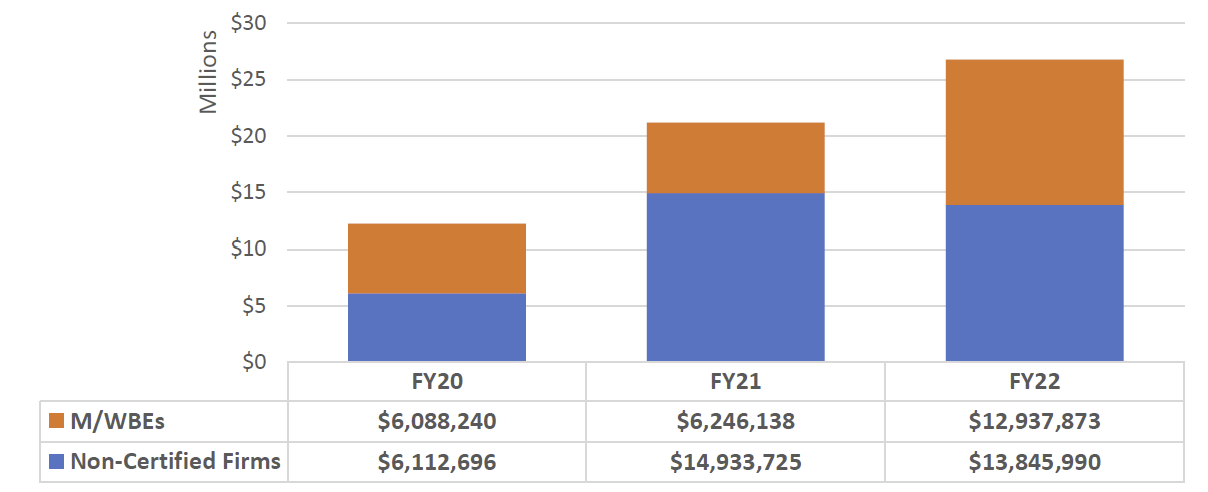
Chart 10: FY22 Value of LL 174-Eligible Contracts and POs, by Race and Gender
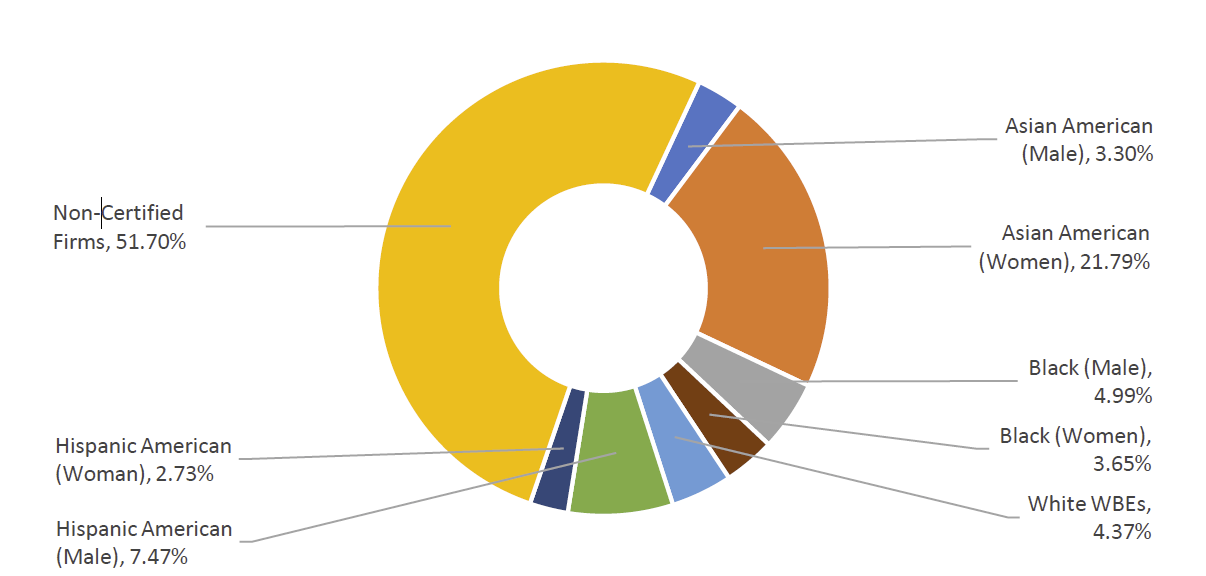
Table 31: Registered M/WBE NCSPs – FY20-22
| FY | Count | Total Value | AVG Value | Citywide AVG Value |
| FY20 | 77 | $5,810,107 | $75,456 | $79,27 |
| FY21 | 10 | $1,163,003 | $116,300 | $105,121 |
| FY22 | 45 | $8,292,210 | $184,271 | $134,907 |
| Grand Total | 132 | $15,265,321 | $115,646 | $104,232 |
Chart 11: Share of M/WBE Contracts Registered Late – FY20-22
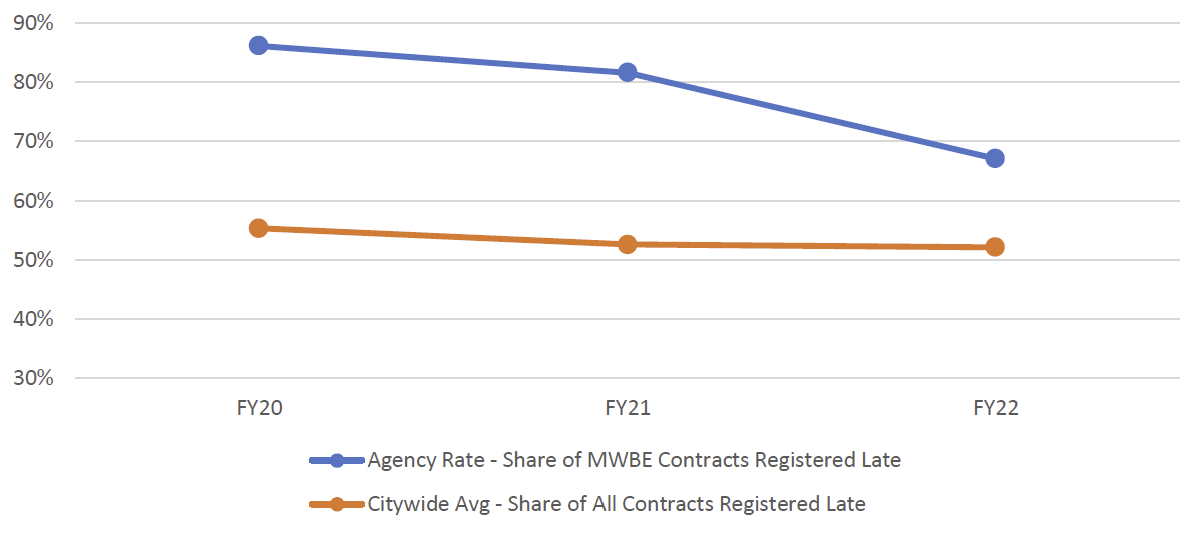
Chart 12: FY22 Contract and PO Value, by M/WBE Category and Industry
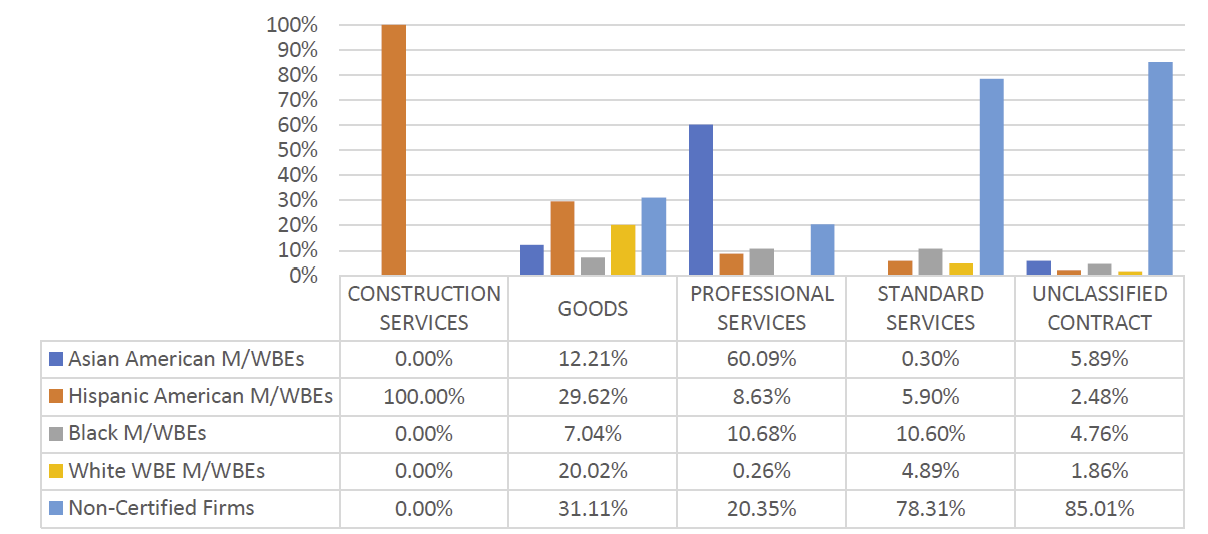
Table 32: LL 174-Eligible Prime Spend, FY20-22
| M/WBE Category | FY20 | FY21 | FY22 | |||
|---|---|---|---|---|---|---|
| Spend | % Share | Spend | % Share | Spend | % Share | |
| M/WBE ALL | $16,700,181 | 35.51% | $17,679,314 | 32.85% | $18,790,200 | 40.59% |
| Non-Certified | $30,329,279 | 64.49% | $36,146,526 | 67.15% | $27,504,679 | 59.41% |
| Total | $47,029,461 | 100.00% | $53,825,840 | 100.00% | $46,294,879 | 100.00% |
Table 33: LL 174-Eligible Sub Vendor Spend, FY20-22
|
M/WBE Category |
FY20 | FY21 | FY22 | |||
|---|---|---|---|---|---|---|
| Spend | % Share | Spend | % Share | Spend | % Share | |
| M/WBE ALL | $325,090 | 100.00% | $0 | N/A | $0 | N/A |
| Non-Certified | $0 | 0.00% | $0 | N/A | $0 | N/A |
| Total | $325,090 | 100.00% | $0 | 100.00% | $0 | 100.00% |
Business Integrity Commission (BIC)
BIC has a small contracting portfolio – it registered four new contracts and 51 POs that were LL 174-eligible in FY22 (less than $230,000 total). Three contracts were registered using the M/WBE NCSP method for low-dollar-value contracts, averaging $26,613 in value. Though there were very few registrations, all were registered after the contract start date. The share of LL 174-eligible spending has increased in FY22 relative to FY21, but it remains slightly down from FY20 levels. There was no recorded LL 174-eligible subcontract spending since FY20, and zero approved subcontractors tied to LL 174-eligible contracts in PIP for FY20, FY21, or FY22.
Table 34: LL 174-Eligible Contracts and POs – FY20-22
| Certification Status | # of Contracts | % Share of Contracts | Total Registered Contract Value | % Share of Registered Contract Value |
| FY20 | 66 | N/A | $258,824 | N/A |
| Non-Certified | 40 | 60.61% | $142,903 | 55.21% |
| M/WBE | 26 | 39.39% | $115,921 | 44.79% |
| FY21 | 49 | N/A | $154,917 | N/A |
| Non-Certified | 32 | 65.31% | $99,110 | 63.98% |
| M/WBE | 17 | 34.69% | $55,806 | 36.02% |
| FY22 | 55 | N/A | $226,746 | N/A |
| Non-Certified | 27 | 49.09% | $77,891 | 34.35% |
| M/WBE | 28 | 50.91% | $148,855 | 65.65% |
| Grand Total | 170 | N/A | $640,489 | N/A |
Chart 13: FY22 Value of LL 174-Eligible Prime Contracts and POs
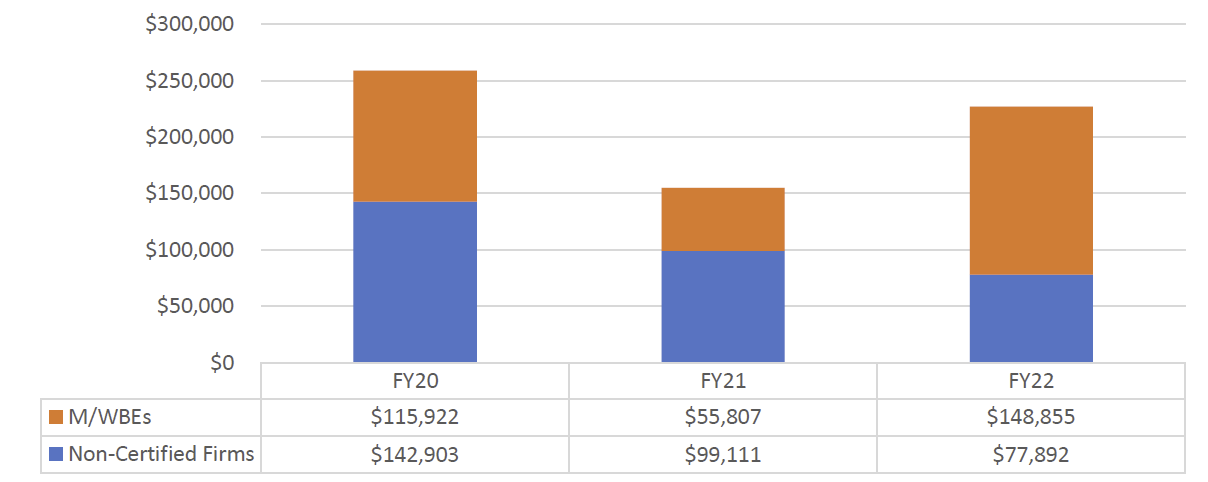
Chart 14: FY22 Value of LL 174-Eligible Contracts and POs, by Race and Gender
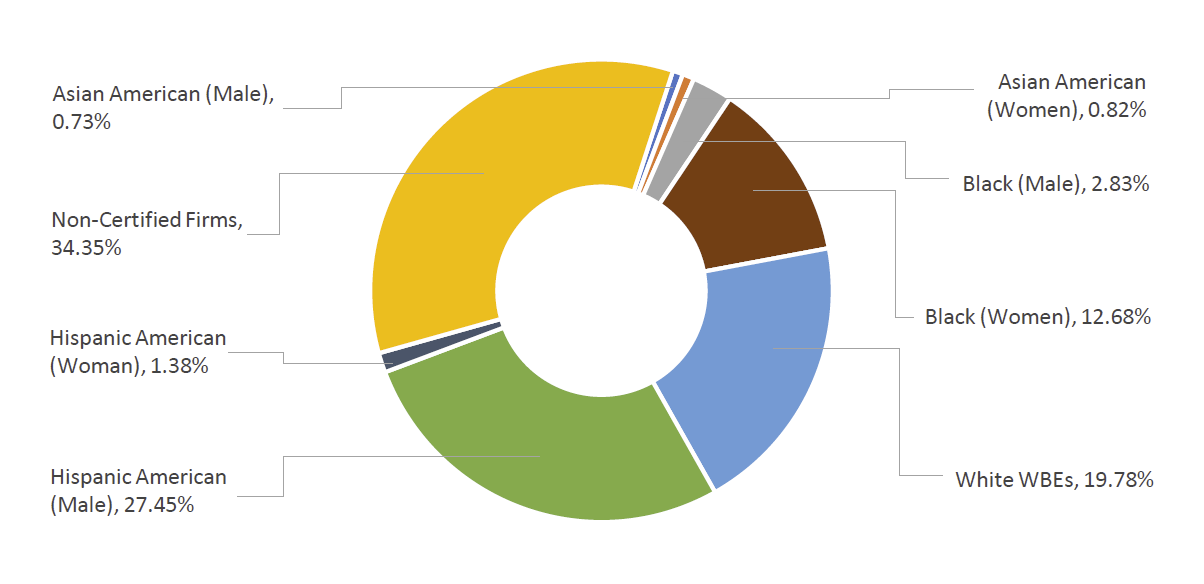
Table 35: Registered M/WBE NCSPs – FY20-22
| FY | Count | Total Value | AVG Value | Citywide AVG Value |
| FY20 | 3 | $75,202.46 | $25,067 | $79,27 |
| FY21 | 0 | 0 | 0 | $105,121 |
| FY22 | 3 | $79,839.37 | $26,613 | $134,907 |
| Grand Total | 6 | $155,041.83 | $25,840 | $104,232 |
Chart 15: Share of M/WBE Contracts Registered Late – FY20-22
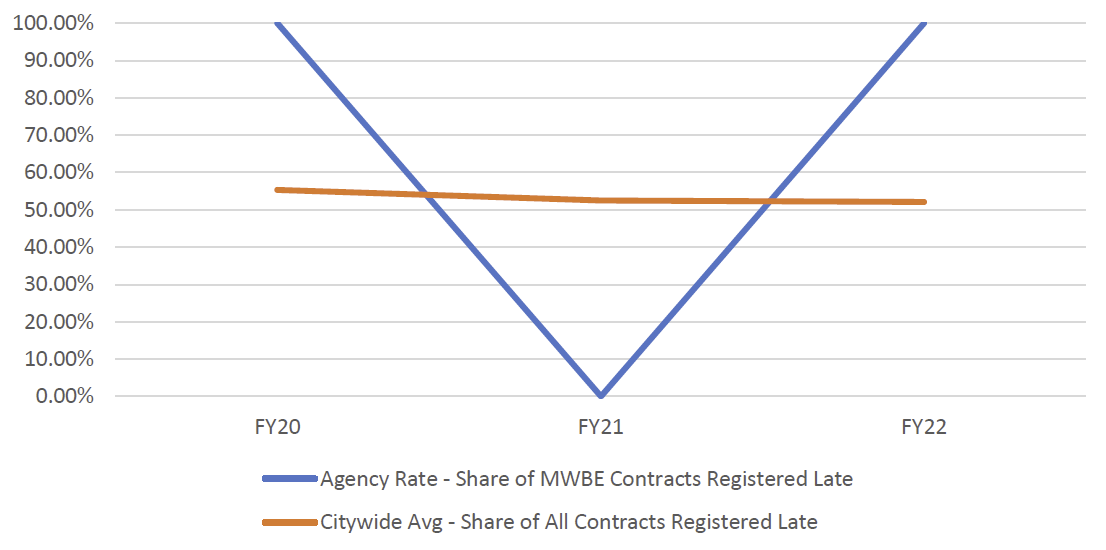
Chart 16: FY22 Contract and PO Value, by M/WBE Category and Industry
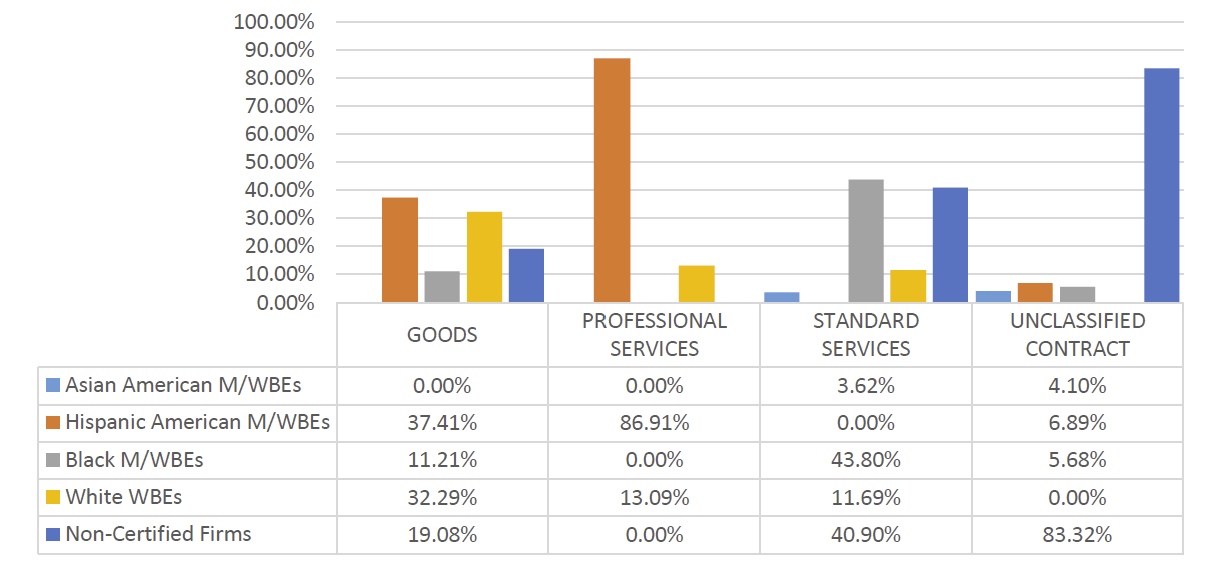
Table 36: LL 174-Eligible Prime Spend, FY20-22
|
M/WBE Category |
FY20 | FY21 | FY22 | |||
| Spend | % Share | Spend | % Share | Spend | % Share | |
|---|---|---|---|---|---|---|
| M/WBE ALL | $182,756 | 22.96% | $73,048 | 9.38% | $146,662 | 19.97% |
| Non-Certified | $613,355 | 77.04% | $705,835 | 90.62% | $587,647 | 80.03% |
| Total | $796,111 | 100.00% | $778,884 | 100.00% | $734,310 | 100.00% |
City Commission on Human Rights (CCHR)
CCHR has a small contracting portfolio – it registered five new contracts and 81 POs that were LL 174-eligible in FY22 (less than $715,000 total). The share of registered contract value to M/WBEs is higher than the Citywide average (50%). Four contracts were registered using the M/WBE NCSP method for very low-dollar-value contracts, averaging $52,500 in value. Though there were very few registrations, all were registered after the contract start date. The share of LL 174-eligible spend with M/WBEs was over 54% in FY22, which was a slight decline from FY21 but still more than in FY20. There was no recorded LL 174-eligible subcontract spending since FY20. There were zero approved subcontractors tied to LL 174-eligible contracts in PIP for FY20, FY21, or FY22.
Table 37: LL 174-Eligible Contracts and POs – FY20-22
| Certification Status | # of Contracts | % Share of Contracts | Total Registered Contract Value | % Share of Registered Contract Value |
| FY20 | 77 | N/A | $649,961 | N/A |
| Non-Certified | 42 | 54.55% | $264,458 | 40.69% |
| M/WBE | 35 | 45.45% | $385,502 | 59.31% |
| FY21 | 66 | N/A | $461,870 | N/A |
| Non-Certified | 24 | 36.36% | $174,946 | 37.88% |
| M/WBE | 42 | 63.64% | $286,924 | 62.12% |
| FY22 | 86 | N/A | $711,932 | N/A |
| Non-Certified | 41 | 47.67% | $353,953 | 49.72% |
| M/WBE | 45 | 52.33% | $357,978 | 50.28% |
| Grand Total | 229 | N/A | $1,823,764 | N/A |
Chart 17: FY22 Value of LL 174-Eligible Prime Contracts and POs
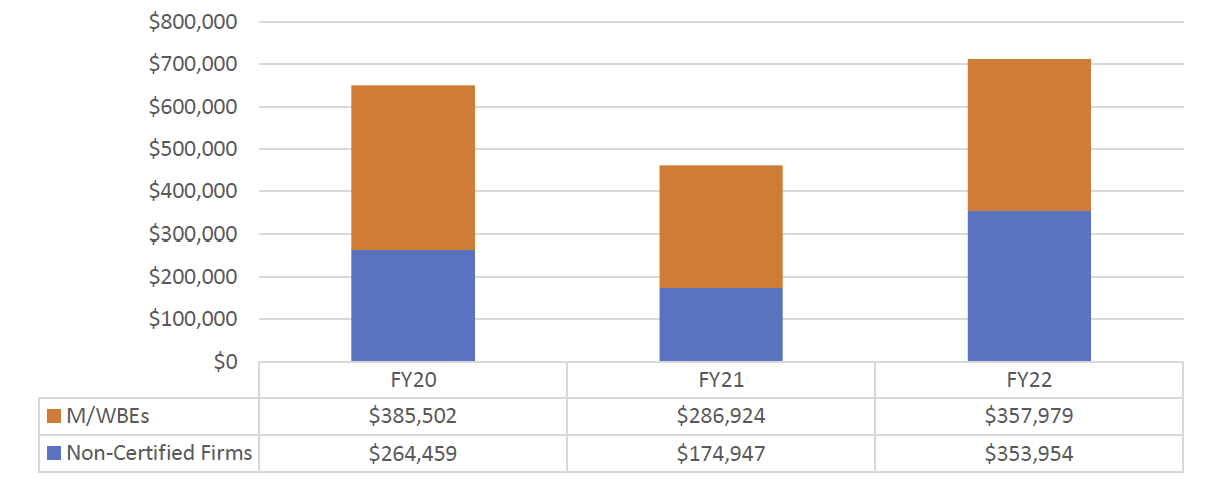
Chart 18: FY22 Value of LL 174-Eligible Contracts and POs, by Race and Gender
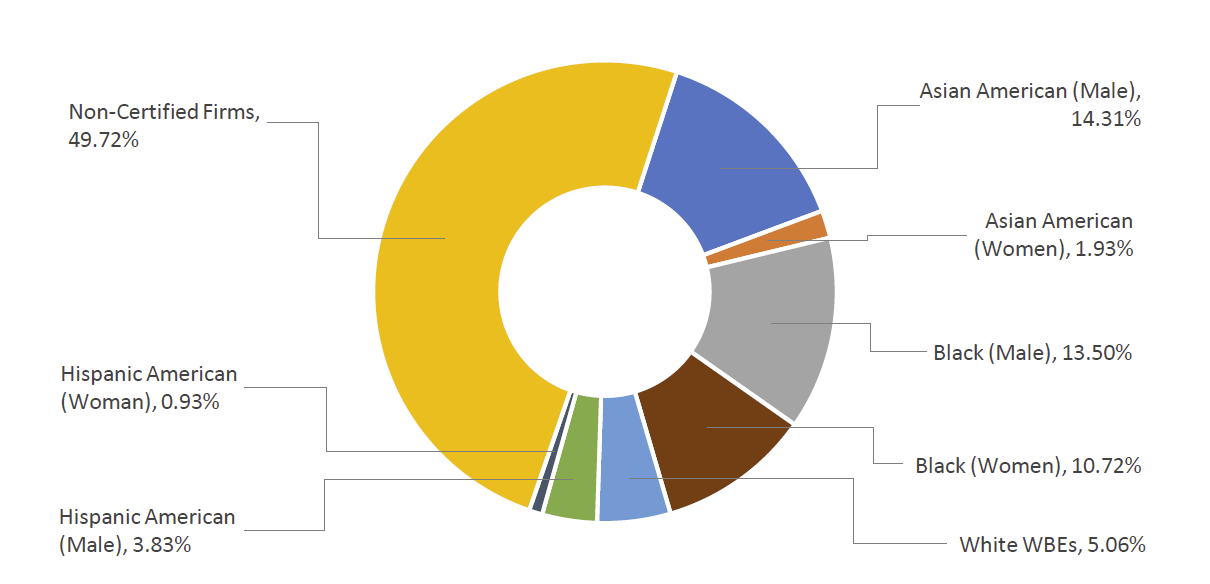
Table 38: Registered M/WBE NCSPs – FY20-22
| FY | Count | Total Value | AVG Value | Citywide AVG Value |
| FY20 | 4 | $270,329 | $67,582 | $79,27 |
| FY21 | 3 | $113,300 | $37,767 | $105,121 |
| FY22 | 4 | $210,000 | $52,500 | $134,907 |
| Grand Total | 11 | $593,629 | $53,966 | $104,232 |
Chart 19: Share of M/WBE Contracts Registered Late – FY20-22
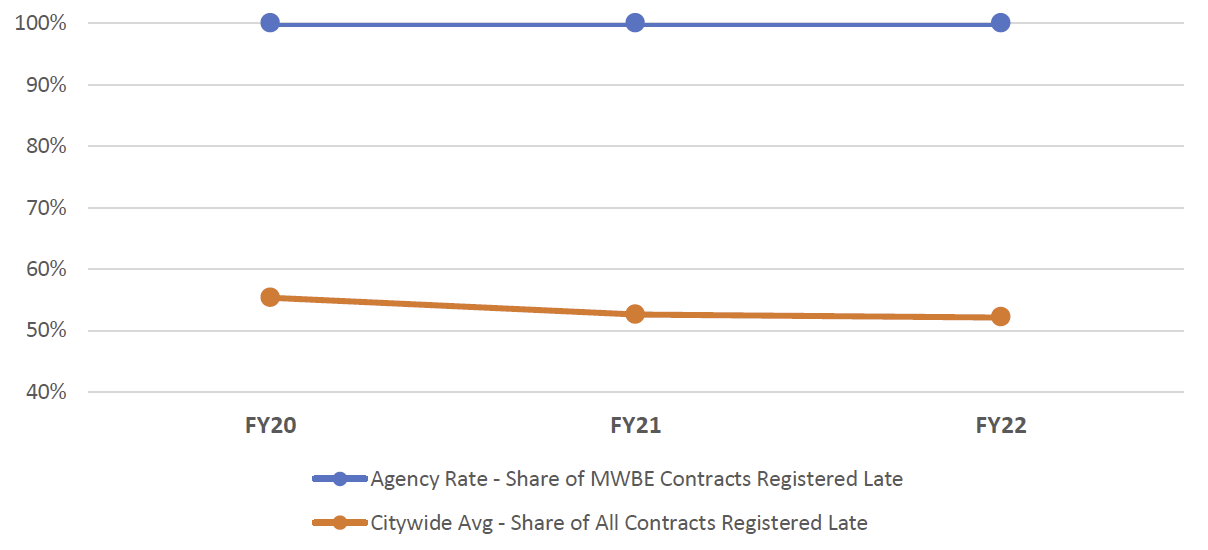
Chart 20: FY22 Contract and PO Value, by M/WBE Category and Industry
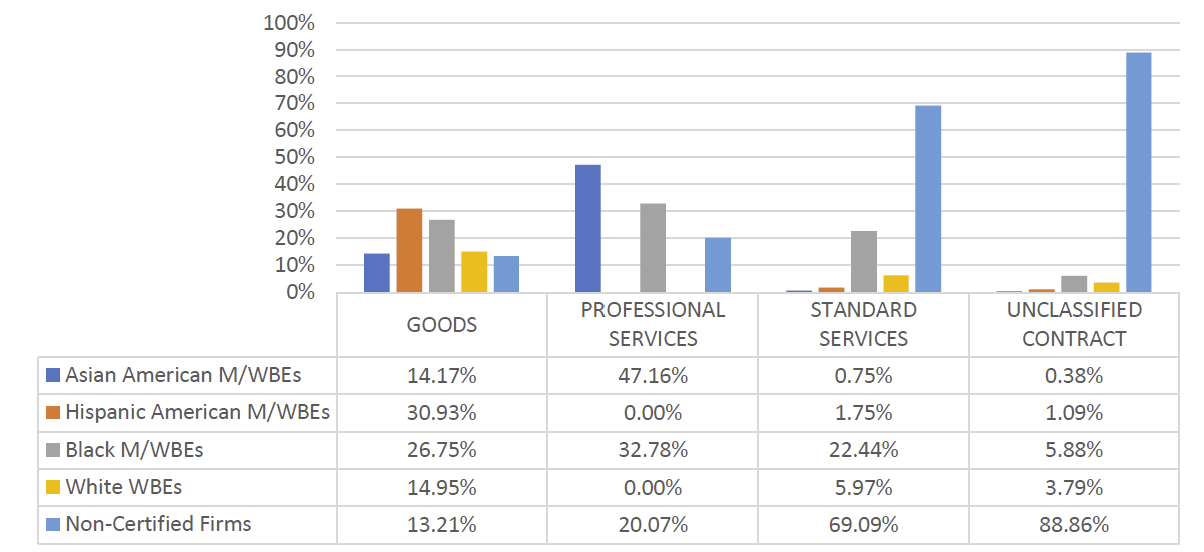
Table 39: LL 174-Eligible Prime Spend, FY20-22
|
M/WBE Category |
FY20 | FY21 | FY22 | |||
|---|---|---|---|---|---|---|
| Spend | % Share | Spend | % Share | Spend | % Share | |
| M/WBE ALL | $383,016 | 46.21% | $480,267 | 56.03% | $566,712 | 54.28% |
| Non-Certified | $445,829 | 53.79% | $376,911 | 43.97% | $477,426 | 45.72% |
| Total | $828,845 | 100.00% | $857,178 | 100.00% | $1,044,138 | 100.00% |
Civilian Complaint Review Board (CCRB)
CCRB has a small contracting portfolio – it registered 20 new contracts and 58 POs that were LL 174-eligible in FY22 (less than $615,000 total). Three contracts were registered using the M/WBE NCSP method for very low dollar value contracts, averaging $55,840 in value. Though there were very few registrations, most were registered after the contract start date. The value and percent share of LL 174-eligible prime spending that went to M/WBEs was the higher in FY22 than in the preceding FYs. There was no recorded LL 174-eligible subcontract spending since FY20. There were zero approved subcontractors tied to LL 174-eligible contracts in PIP for FY20, FY21, or FY22.
Table 40: LL 174-Eligible Contracts and POs – FY20-22
| Certification Status | # of Contracts | % Share of Contracts | Total Registered Contract Value | % Share of Registered Contract Value |
| FY20 | 60 | N/A | $362,307 | N/A |
| Non-Certified | 46 | 76.67% | $257,425 | 71.05% |
| M/WBE | 14 | 23.33% | $104,881 | 28.95% |
| FY21 | 42 | N/A | $530,962 | N/A |
| Non-Certified | 32 | 76.19% | $152,360 | 28.70% |
| M/WBE | 10 | 23.81% | $378,602 | 71.30% |
| FY22 | 78 | N/A | $614,290 | N/A |
| Non-Certified | 64 | 82.05% | $376,106 | 61.23% |
| M/WBE | 14 | 17.95% | $238,184 | 38.77% |
| Grand Total | 180 | N/A | $1,507,560 | N/A |
Chart 21: FY22 Value of LL 174-Eligible Prime Contracts and POs
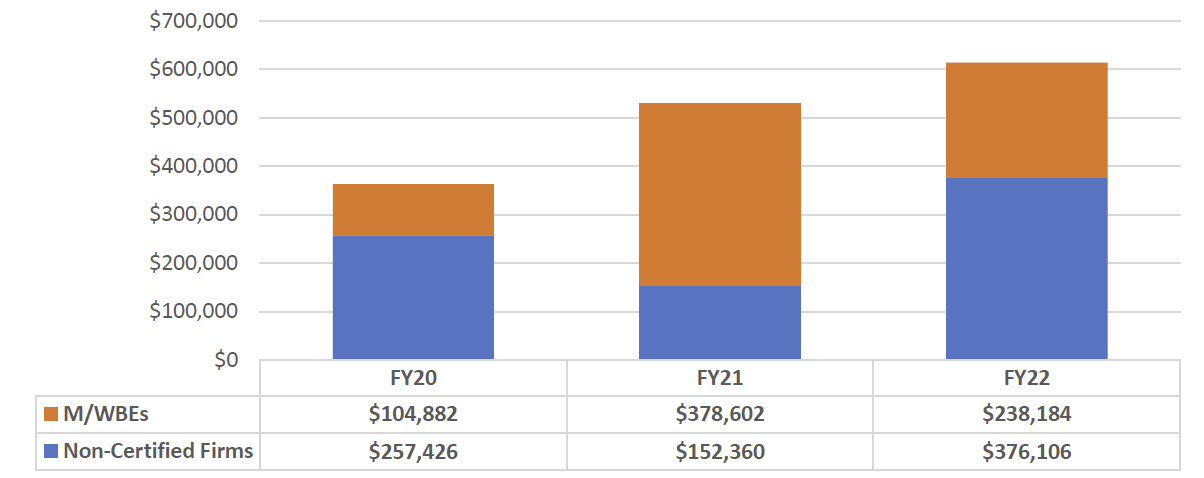
Chart 22: FY22 Value of LL 174-Eligible Contracts and POs, by Race and Gender
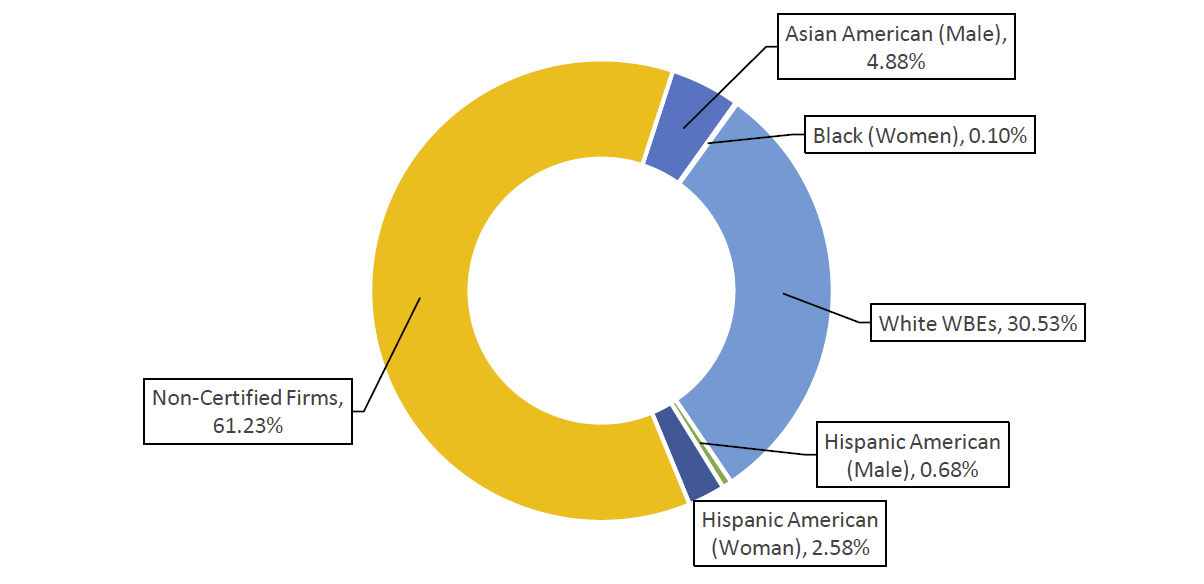
Table 41: Registered M/WBE NCSPs – FY20-22
| FY | Count | Total Value | AVG Value | Citywide AVG Value |
| FY20 | 1 | $51,552 | $51,552 | $79,27 |
| FY21 | 2 | $306,384 | $153,192 | $105,121 |
| FY22 | 3 | $167,519 | $55,840 | $134,907 |
| Grand Total | 6 | $525,454 | $87,576 | $104,232 |
Chart 23: Share of M/WBE Contracts Registered Late – FY20-22
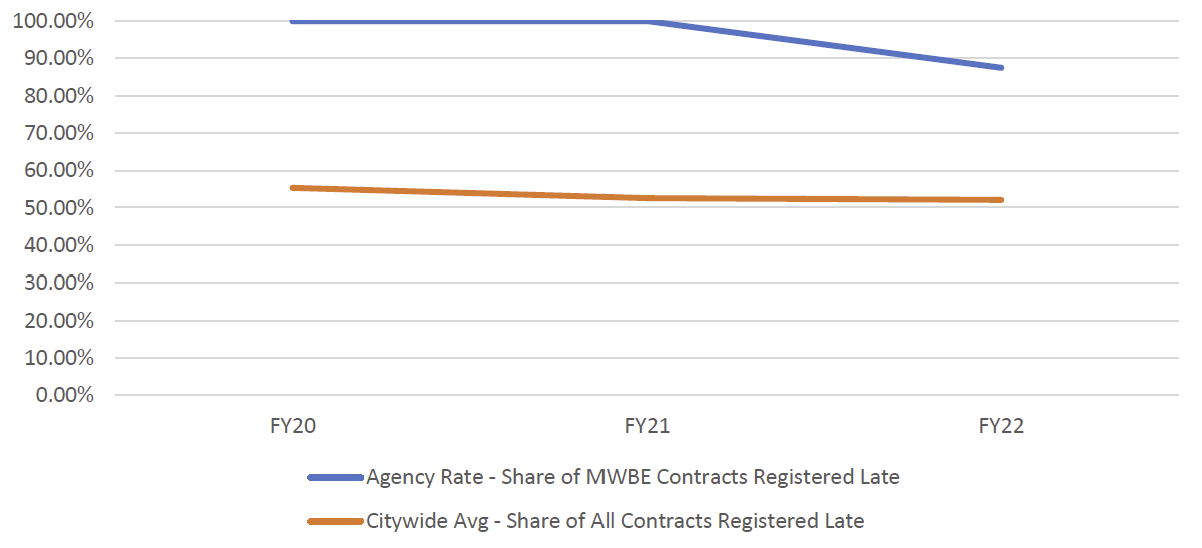
Chart 24: FY22 Contract and PO Value, by M/WBE Category and Industry
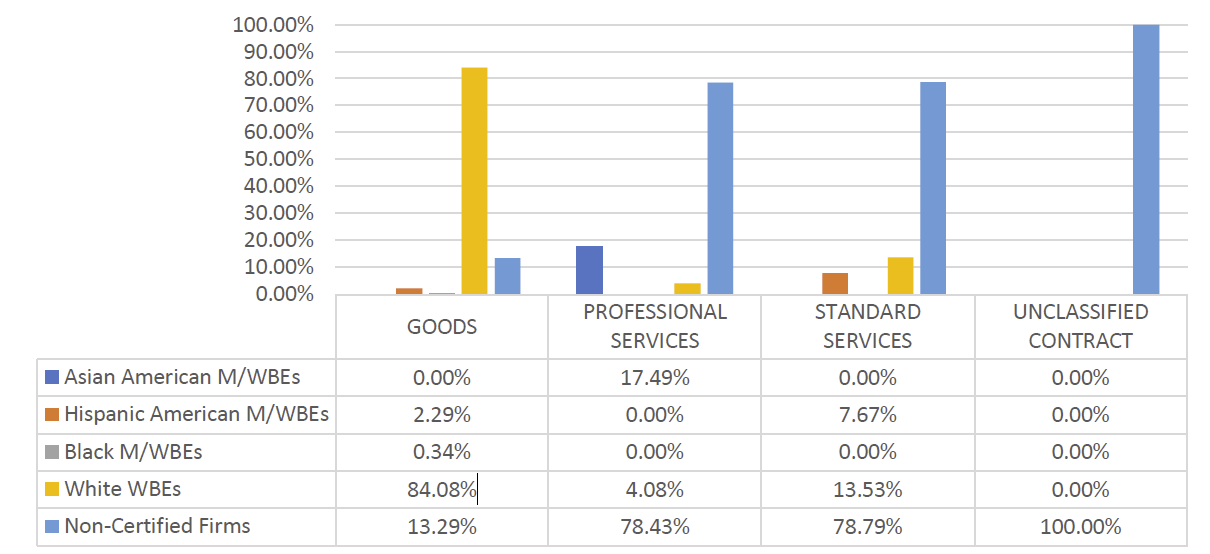
Table 42: LL 174-Eligible Prime Spend, FY20-22
|
M/WBE Category |
FY20 | FY21 | FY22 | |||
|---|---|---|---|---|---|---|
| Spend | % Share | Spend | % Share | Spend | % Share | |
| M/WBE ALL | $200,243 | 29.41% | $193,339 | 18.51% | $421,443 | 37.10% |
| Non-Certified | $480,518 | 70.59% | $851,281 | 81.49% | $714,501 | 62.90% |
| Total | $680,760 | 100.00% | $1,044,621 | 100.00% | $1,135,944 | 100.00% |
Comptroller (COMP)
The Comptroller is the City’s Chief Financial Officer and an independently elected official. While the Comptroller’s Office is not a mayoral agency, to be transparent and fair, we have analyzed this Office’s data in alignment with LL 174 participation goal requirements. The Comptroller’s Office’s procurement portfolio includes Corpus Funded Agreements (which function as a mechanism to finance investment management services related to the City’s five pension fund), which are exempt from LL 174 participation goals. The data included here, therefore, represents only a share of the Comptroller’s Office’s procurements. The Comptroller’s Office has a relatively small LL 174 procurement portfolio. The total value of all eligible contracts in FY22 shows a decrease in size by nearly 80% since FY20. FY20 and FY21 were atypical years for many agencies, including the Comptroller’s Office, due to new needs related to COVID-19 safety measures and the transition to infrastructure to support remote work and services. The share of registered contract value that went to M/WBEs is higher than the Citywide average (40%). Over 50% of this contract value was registered to Asian American M/WBEs and Black M/WBEs. The largest share of spending was with businesses owned by white women. This Office’s retroactivity rate was slightly later than the Citywide average. Nearly all subcontracted spending went to M/WBEs.
A November 2022 report, released by the Comptroller’s office, described in Appendix B, showed that the New York City Retirement Systems had a total of $16.82 billion in investments with or committed to M/WBE managers as of June 30, 2022. Those investments amount to 11.65% of U.S.-based actively managed assets, or approximately 7% of the total assets under management.
Table 43: LL 174-Eligible Contracts and POs – FY20-22[34]
| Certification Status | # of Contracts | % Share of Contracts | Total Registered Contract Value | % Share of Registered Contract Value |
| FY20 | 408 | N/A | $21,125,903 | N/A |
| Non-Certified Firms | 252 | 61.76% | $18,701,397 | 88.52% |
| M/WBEs | 156 | 38.24% | $2,424,506 | 11.48% |
| FY21 | 139 | N/A | $12,193,991 | N/A |
| Non-Certified Firms | 64 | 46.04% | $8,247,584 | 67.64% |
| M/WBEs | 75 | 53.96% | $3,946,407 | 32.36% |
| FY22 | 214 | N/A | $3,772,200 | N/A |
| Non-Certified Firms | 88 | 41.12% | $2,247,383 | 59.58% |
| M/WBEs | 126 | 58.88% | $1,524,817 | 40.42% |
| Grand Total | 761 | N/A | $37,092,096 | N/A |
Chart 25: FY22 Value of LL 174-Eligible Prime Contracts and POs
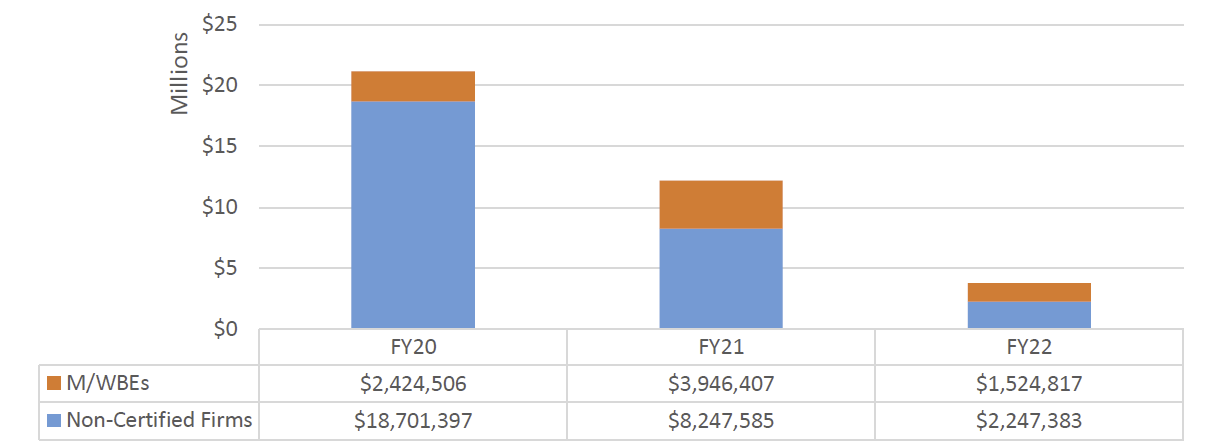
Chart 26: FY22 Value of LL 174-Eligible Contracts and POs, by Race and Gender
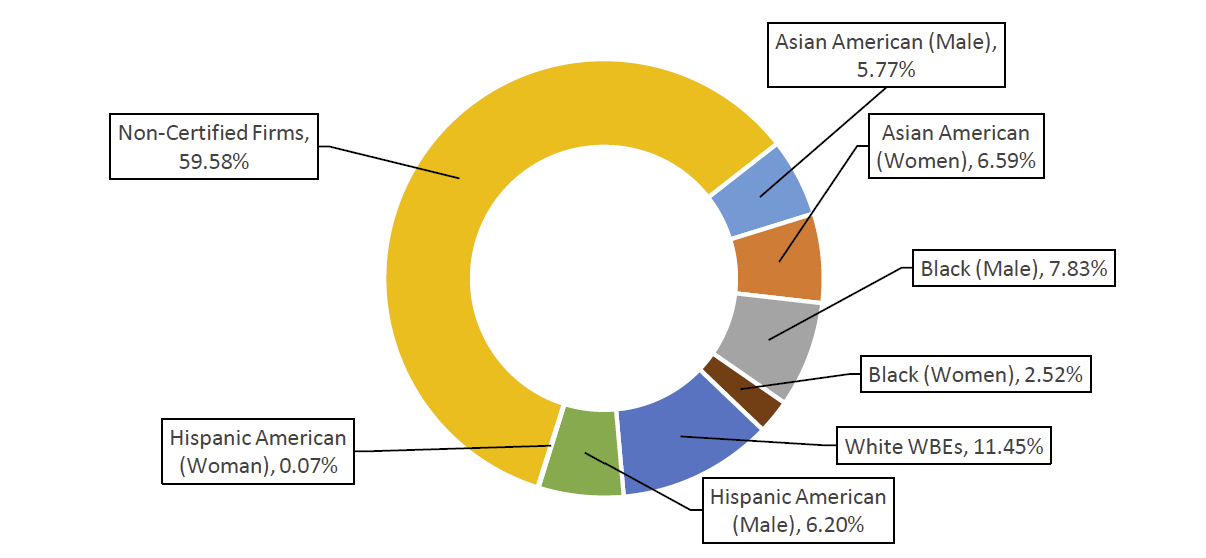
Table 44: Registered M/WBE NCSPs – FY20-22
| FY | Count | Total Value | AVG Value | Citywide AVG Value |
| FY20 | 20 | $1,808,009 | $90,400 | $79,27 |
| FY21 | 23 | $2,516,147 | $109,397 | $105,121 |
| FY22 | 14 | $1,229,294 | $87,806 | $134,907 |
| Grand Total | 57 | $5,553,452 | $97,428 | $104,232 |
Chart 27: Share of M/WBE Contracts Registered Late – FY20-22
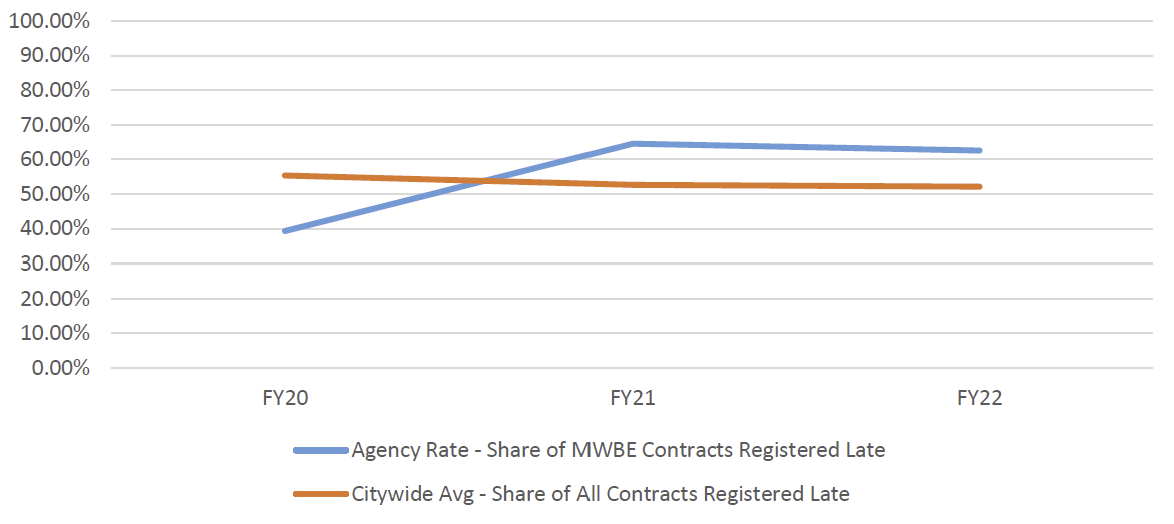
Chart 28: FY22 Contract and PO Value by M/WBE Category and Industry
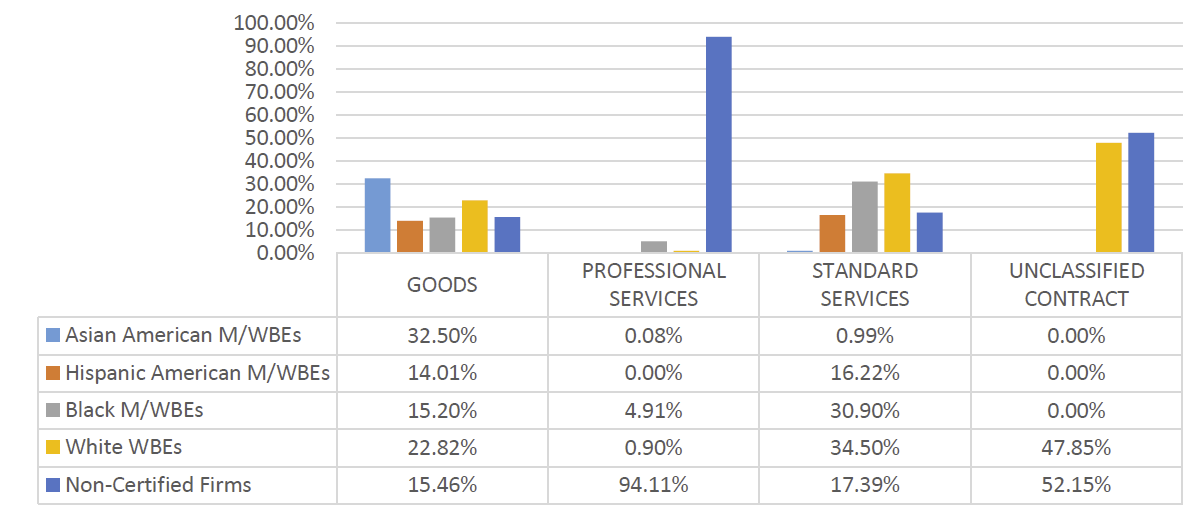
Table 45: LL 174-Eligible Approved Subcontracts – FY20-22
| Certification Status | # of Contracts | % Share of Contracts | Total Registered Contract Value | % Share of Registered Contract Value |
| FY20 | 9 | N/A | $2,624,999 | N/A |
| Sub – Non-Certified | 8 | 88.89% | $2,525,000 | 96.19% |
| Sub – M/WBE | 1 | 11.11% | $99,999 | 3.81% |
| FY21 | 2 | N/A | $2,160,000 | N/A |
| Sub – Non-Certified | 2 | 100.00% | $2,160,000 | 100.00% |
Table 46: LL 174-Eligible Prime Spend, FY20-22
|
M/WBE Category |
FY20 | FY21 | FY22 | |||
| Spend | % Share | Spend | % Share | Spend | % Share | |
| M/WBE ALL | $5,213,202 | 44.52% | $2,495,113 | 24.42% | $421,443 | 4.98% |
| Non-Certified | $6,495,529 | 55.48% | $7,723,648 | 75.58% | $8,033,586 | 95.02% |
| Total | $11,708,731 | 100.00% | $10,218,761 | 100.00% | $8,455,028 | 100.00% |
Table 47: LL 174-Eligible Sub Vendor Spend, FY20-22
|
M/WBE Category |
FY20 | FY21 | FY22 | |||
|---|---|---|---|---|---|---|
| Spend | % Share | Spend | % Share | Spend | % Share | |
| M/WBE ALL | $1,525,513 | 96.74% | $2,037,183 | 98.96% | $1,861,582 | 99.96% |
| Non-Certified | $51,477 | 3.26% | $21,420 | 1.04% | $668 | 0.04% |
| Total | $1,576,991 | 100.00% | $2,058,604 | 100.00% | $1,862,250 | 100.00% |
Department of Citywide Administrative Services (DCAS)
DCAS procured some very high-value contracts in FY22 – the total registered contract value quadrupled from FY21 (compared to a relatively smaller growth in contract volume). Many of these items are exempt from LL 174 participation goals, including goods (for higher value than included in the LL) and Emergency procurements (particularly those related to COVID-19). Therefore, the data included here represents a relatively small share of DCAS’ total procurement portfolio. Though the count of contracts registered to M/WBEs is consistent with Citywide levels, the share of registered contract value is lower—suggesting that these highest-value contracts went to Non-Certified firms. DCAS is in the top 5 agencies for the count of contracts registered utilizing the M/WBE NCSP method (54 times in FY22), though the average value of these contracts is lower than the Citywide average. DCAS has higher rates of retroactivity than the Citywide average. Though this is consistent with FY21 figures, this is a steep delay from FY20. The share of LL 174-eligible spending remained relatively level against prime contracts, ranging from 10-13% since FY20. The share of LL 174-eligible spending to M/WBE sub vendors has fallen from just over half in FY21 to a third in FY22.
Table 49: LL 174-Eligible Contracts and POs – FY20-22
| Certification Status | # of Contracts | % Share of Contracts | Total Registered Contract Value | % Share of Registered Contract Value |
| FY20 | 506 | N/A | $195,302,026 | N/A |
| Non-Certified | 241 | 47.63% | $178,913,093 | 91.61% |
| M/WBE | 265 | 52.37% | $16,388,933 | 8.39% |
| FY21 | 500 | N/A | $61,221,151 | N/A |
| Non-Certified | 239 | 47.80% | $40,380,752 | 65.96% |
| M/WBE | 261 | 52.20% | $20,840,399 | 34.04% |
| FY22 | 598 | N/A | $264,692,981 | N/A |
| Non-Certified | 288 | 48.16% | $230,616,935 | 87.13% |
| M/WBE | 310 | 51.84% | $34,076,045 | 12.87% |
| Grand Total | 1,604 | N/A | $521,216,158 | N/A |
Chart 29: FY22 Value of LL 174-Eligible Prime Contracts and POs
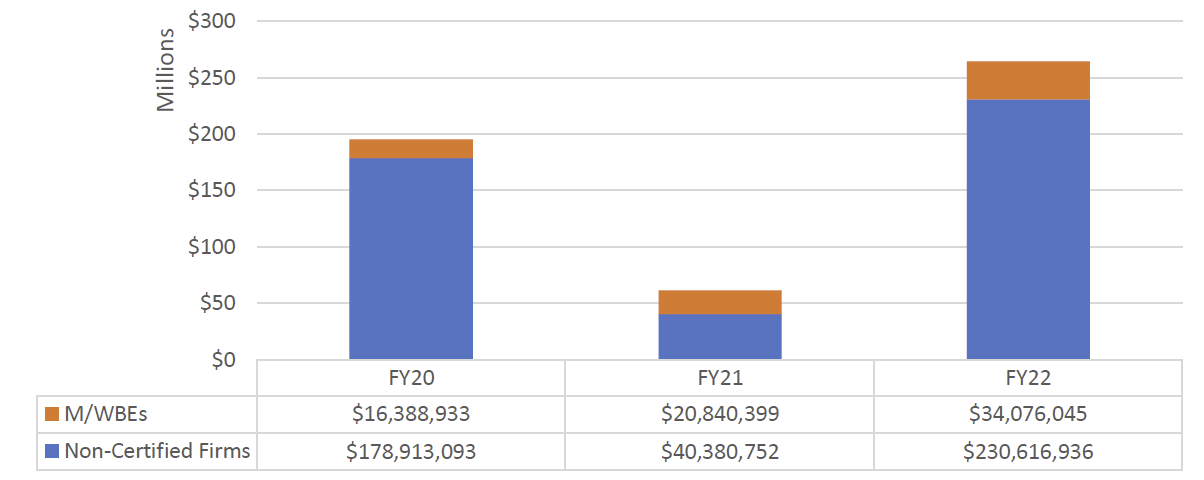
Chart 30: FY22 Value of LL 174-Eligible Contracts and POs, by Race and Gender
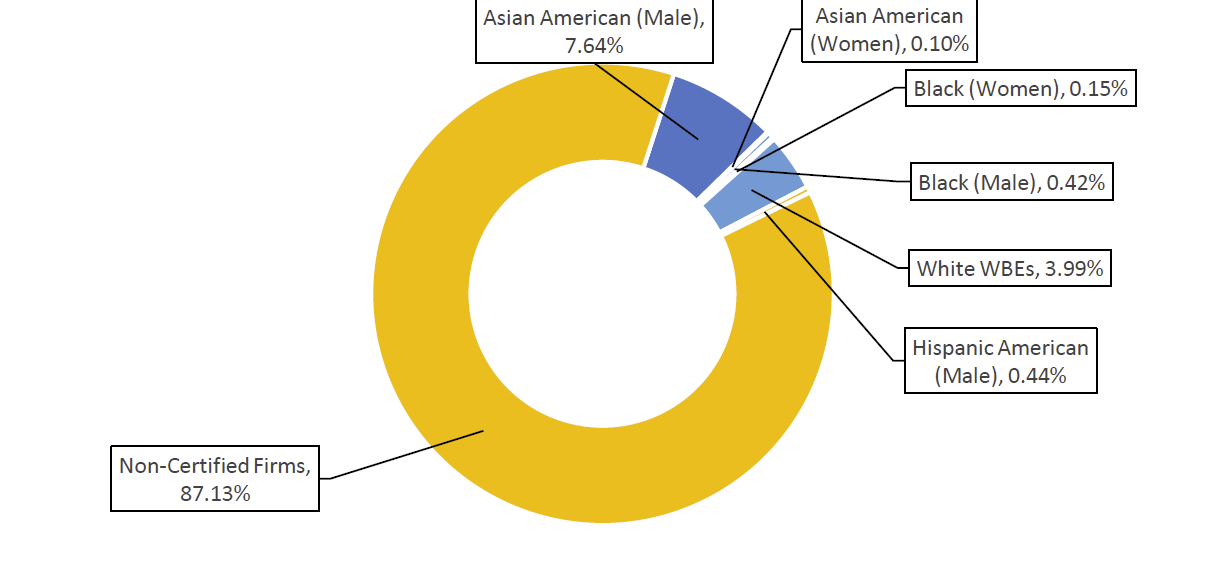
Table 50: Registered M/WBE NCSPs – FY20-22
| FY | Count | Total Value | AVG Value | Citywide AVG Value |
| FY20 | 65 | $4,934,619 | $75,917 | $79,27 |
| FY21 | 47 | $4,840,486 | $102,989 | $105,121 |
| FY22 | 54 | $4,222,818 | $78,200 | $134,907 |
| Grand Total | 166 | $13,997,922 | $84,325 | $104,232 |
Chart 31: Share of M/WBE Contracts Registered Late – FY20-22

Chart 32: FY22 Contract and PO Value, by M/WBE Category and Industry
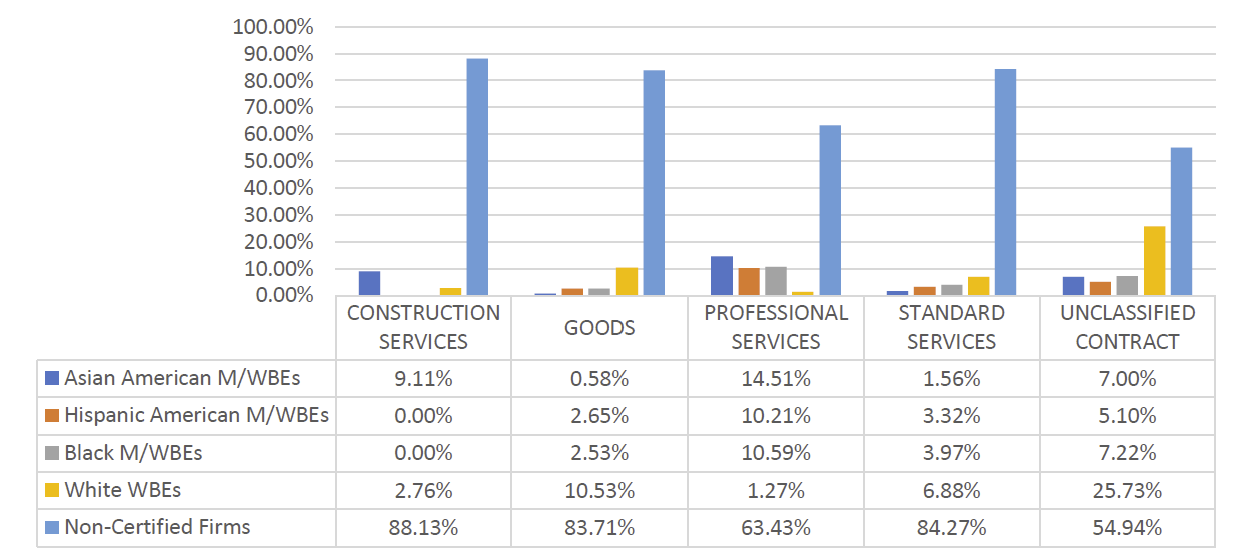
Table 51: Approved LL 174-Eligible Subcontracts – FY20-22
| Certification Status | # of Contracts | % Share of Contracts | Total Registered Contract Value | % Share of Registered Contract Value |
| FY20 | 48 | N/A | $78,675,741 | N/A |
| Sub – Non-Certified | 45 | 93.75% | $78,129,741 | 99.31% |
| Sub – M/WBE | 3 | 6.25% | $546,000 | 0.69% |
| FY21 | 16 | N/A | $956,100 | N/A |
| Sub – Non-Certified | 14 | 87.50% | $953,000 | 99.68% |
| Sub – M/WBE | 2 | 12.50% | $3,100 | 0.32% |
| FY22 | 34 | N/A | $131,631,666 | N/A |
| Sub – Non-Certified | 27 | 79.41% | $125,131,666 | 95.06% |
| Sub – M/WBE | 7 | 20.59% | $6,500,000 | 4.94% |
Table 52: LL 174-Eligible Prime Spend FY20-22
|
M/WBE Category |
FY20 | FY21 | FY22 | |||
|---|---|---|---|---|---|---|
| Spend | % Share | Spend | % Share | Spend | % Share | |
| M/WBE ALL | $63,834,537 | 10.67% | $50,997,880 | 13.28% | $53,973,308 | 10.27% |
| Non-Certified | $534,586,393 | 89.33% | $333,036,877 | 86.72% | $471,319,269 | 89.73% |
| Total | $598,420,930 | 100.00% | $384,034,757 | 100.00% | $525,292,577 | 100.00% |
Table 53: LL 174-Eligible Sub Vendor Spend, FY20-22
|
M/WBE Category |
FY20 | FY21 | FY22 | |||
|---|---|---|---|---|---|---|
| Spend | % Share | Spend | % Share | Spend | % Share | |
| M/WBE ALL | $3,343,345 | 43.34% | $16,762,373 | 49.12% | $5,922,341 | 33.07% |
| Non-Certified | $4,370,873 | 56.66% | $17,365,620 | 50.88% | $11,984,438 | 66.93% |
| Total | $7,714,218 | 100.00% | $34,127,993 | 100.00% | $17,906,778 | 100.00% |
Department of Cultural Affairs (DCLA)
DCLA has a relatively small procurement portfolio and predominantly contracts with vendors for human services, which are exempt from LL 174 participation goals. DCLA seems to have successfully registered some of its more lucrative LL 174-eligible contracts with M/WBEs – as the share in registered M/WBE contract value (85%) is much higher than the share of the volume of contracts registered to M/WBEs (11%). DCLA has also shown improvement in registration timing – in FY22 30% of contracts were registered after the contract start date compared to 100% in FY21. The share of DCLA’s LL 174 spending with M/WBEs has declined modestly over the last three FYs, from 13% to 8%. There were zero approved subcontractors tied to LL 174-eligible contracts in PIP, and there was no recorded LL 174-eligible subcontract spending since FY20.
Table 54: LL 174-Eligible Contracts and POs – FY20-22
| Certification Status | # of Contracts | % Share of Contracts | Total Registered Contract Value | % Share of Registered Contract Value |
| FY20 | 61 | N/A | $738,799 | N/A |
| Non-Certified | 47 | 77.05% | $104,759 | 14.18% |
| M/WBE | 14 | 22.95% | $634,040 | 85.82% |
| FY21 | 52 | N/A | $354,763 | N/A |
| Non-Certified | 40 | 76.92% | $197,657 | 55.72% |
| M/WBE | 12 | 23.08% | $157,106 | 44.28% |
| FY22 | 108 | N/A | $1,493,020 | N/A |
| Non-Certified | 96 | 88.89% | $221,325 | 14.82% |
| M/WBE | 12 | 11.11% | $1,271,695 | 85.18% |
| Grand Total | 221 | N/A | $2,586,584 | N/A |
Chart 33: FY22 Value of LL 174-Eligible Prime Contracts and POs
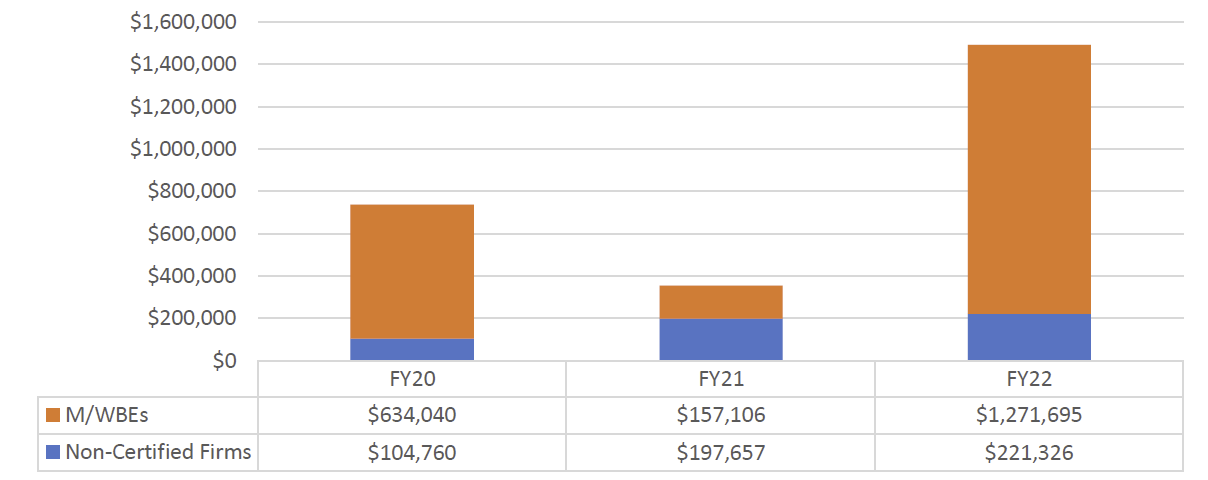
Chart 34: FY22 Value of LL 174-Eligible Contracts and POs, by Race and Gender
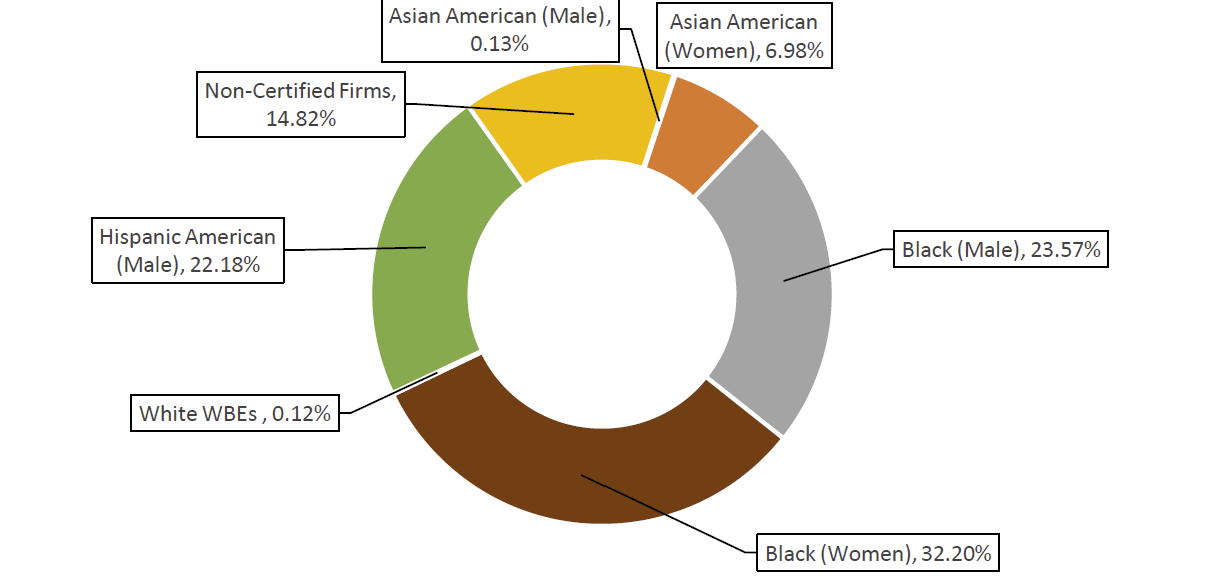
Table 55: Registered M/WBE NCSPs – FY20-22
| FY | Count | Total Value | AVG Value | Citywide AVG Value |
| FY20 | 7 | $620,291 | $88,613 | $79,27 |
| FY21 | 2 | $85,390 | $42,695 | $105,121 |
| FY22 | 7 | $1,260,206 | $180,029 | $134,907 |
| Grand Total | 16 | $1,965,887 | $122,868 | $104,232 |
Chart 35: Share of M/WBE Contracts Registered Late – FY20-22
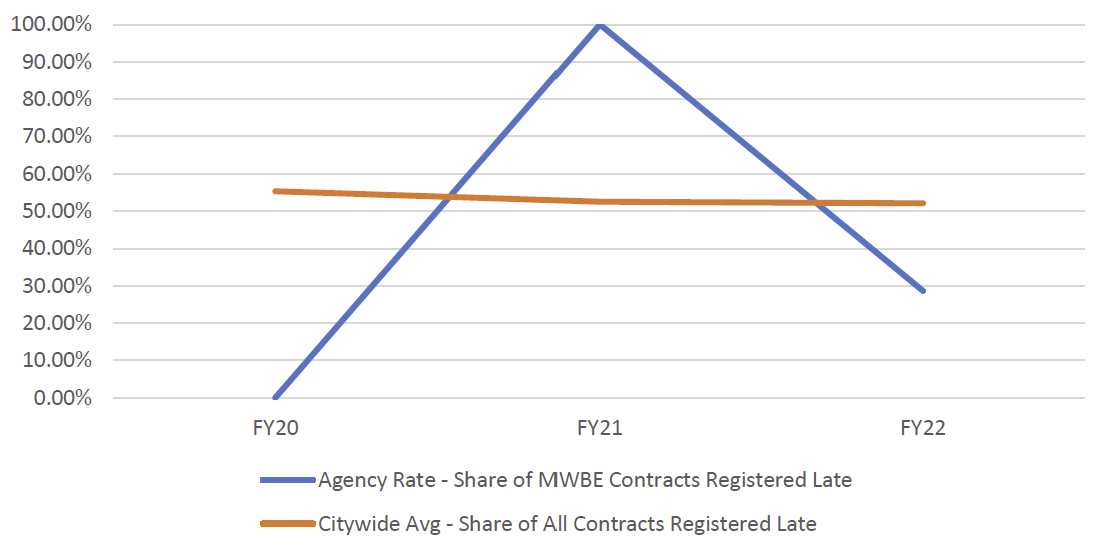
Chart 36: FY22 Contract and PO Value, by M/WBE Category and Industry
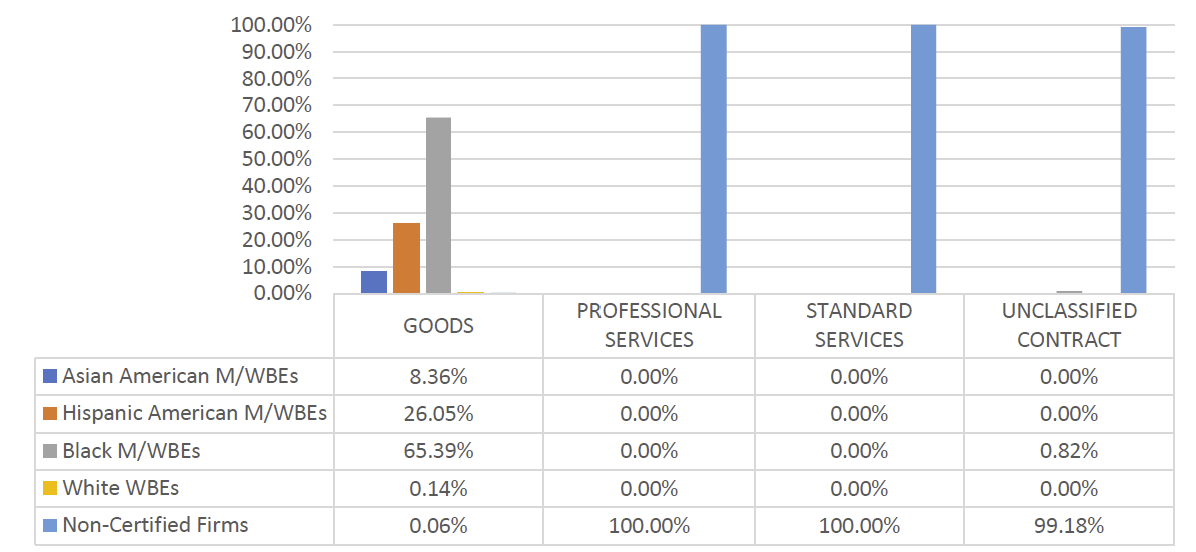
Table 56: LL 174-Eligible Prime Spend, FY20-22
|
M/WBE Category |
FY20 | FY21 | FY22 | |||
|---|---|---|---|---|---|---|
| Spend | % Share | Spend | % Share | Spend | % Share | |
| M/WBE ALL | $5,358,129 | 13.54% | $2,486,443 | 9.82% | $2,605,468 | 8.13% |
| Non-Certified | $34,224,234 | 86.46% | $22,821,814 | 90.18% | $29,431,907 | 91.87% |
| Total | $39,582,363 | 100.00% | $25,308,257 | 100.00% | $32,037,375 | 100.00% |
Department of City Planning (DCP)
DCP has a relatively small procurement portfolio, registering five new LL 174-eligible contracts and 135 POs in FY22 (valued less than $630,000 total). Though a small portfolio, the share of contract value registered to M/WBEs is higher than the Citywide average (52.15%). DCP registered all five of these contracts after the contract start date, a stark change from a 30% retroactivity rate in FY20. DCP’s overall LL 174-eligible spending has declined since FY20 although the FY22 share going to M/WBE primes is back at 20% after a dip in FY21. There were zero approved subcontractors tied to LL 174-eligible contracts in PIP for FY20, FY21, or FY22. 100% of DCP’s LL 174 sub vendor spending has gone to M/WBEs since FY20.
Table 57: LL 174-Eligible Contracts and POs – FY20-22
| Certification Status | # of Contracts | % Share of Contracts | Total Registered Contract Value | % Share of Registered Contract Value |
| FY20 | 131 | N/A | $1,551,425 | N/A |
| Non-Certified | 49 | 37.40% | $266,762 | 17.19% |
| M/WBE | 82 | 62.60% | $1,284,663 | 82.81% |
| FY21 | 101 | N/A | $684,844 | N/A |
| Non-Certified | 43 | 42.57% | $213,237 | 31.14% |
| M/WBE | 58 | 57.43% | $471,607 | 68.86% |
| FY22 | 140 | N/A | $627,760 | N/A |
| Non-Certified | 56 | 40.00% | $300,406 | 47.85% |
| M/WBE | 84 | 60.00% | $327,354 | 52.15% |
| Grand Total | 372 | N/A | $2,864,030 | N/A |
Chart 37: FY22 Value of LL 174-Eligible Prime Contracts and POs
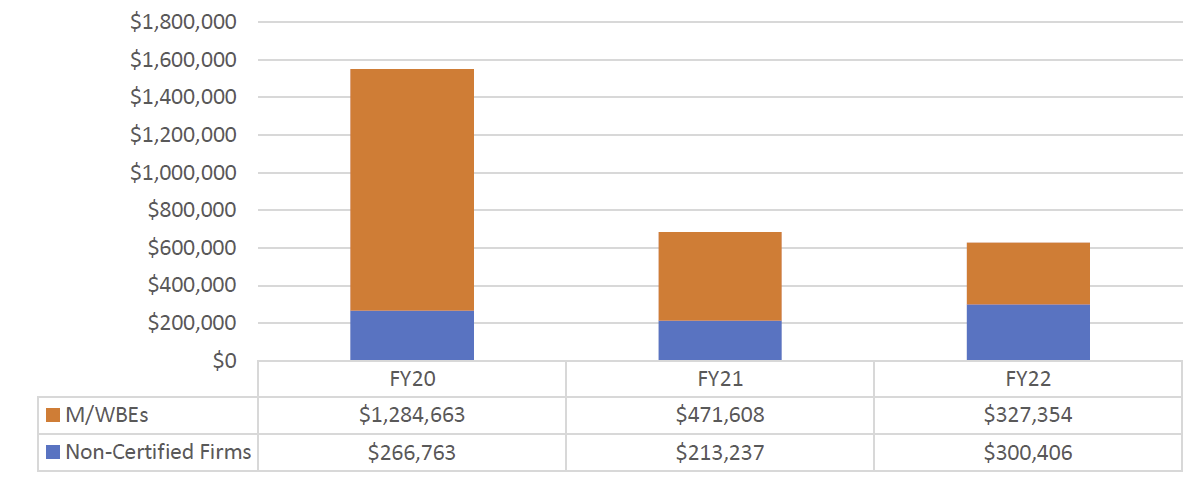
Chart 38: FY22 Value of LL 174-Eligible Contracts and POs, by Race and Gender
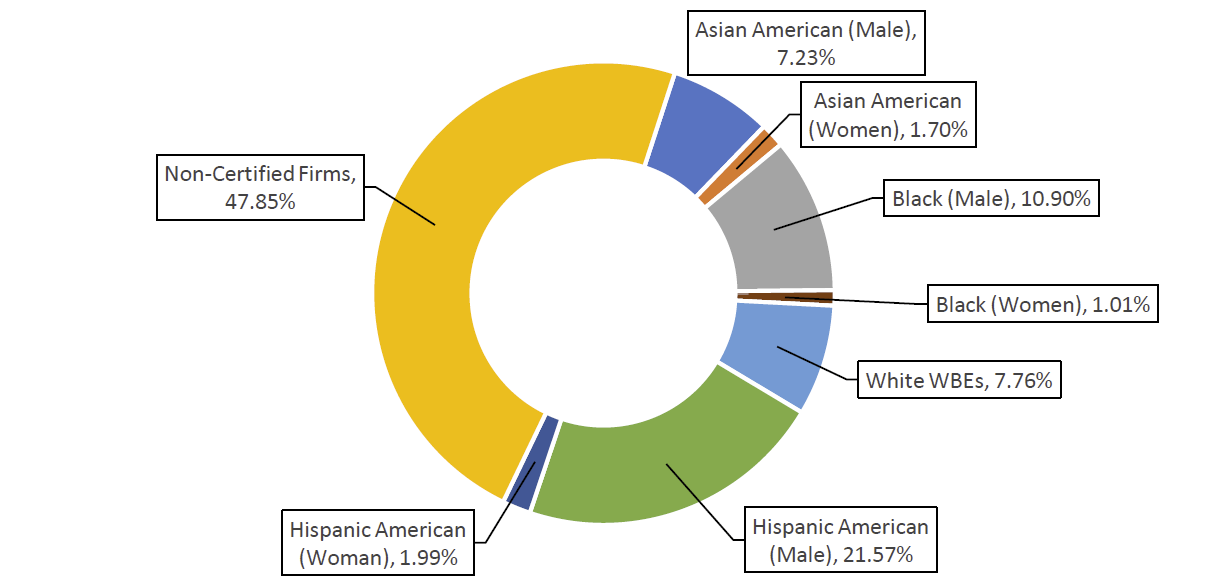
Table 58: Registered M/WBE NCSPs – FY20-22
| FY | Count | Total Value | AVG Value | Citywide AVG Value |
| FY20 | 11 | $882,906 | $80,264 | $79,27 |
| FY21 | 2 | $155,000 | $77,500 | $105,121 |
| FY22 | 1 | $23,167 | $23,167 | $134,907 |
| Grand Total | 14 | $1,061,073 | $75,791 | $104,232 |
Chart 39: Share of M/WBE Contracts Registered Late – FY20-22
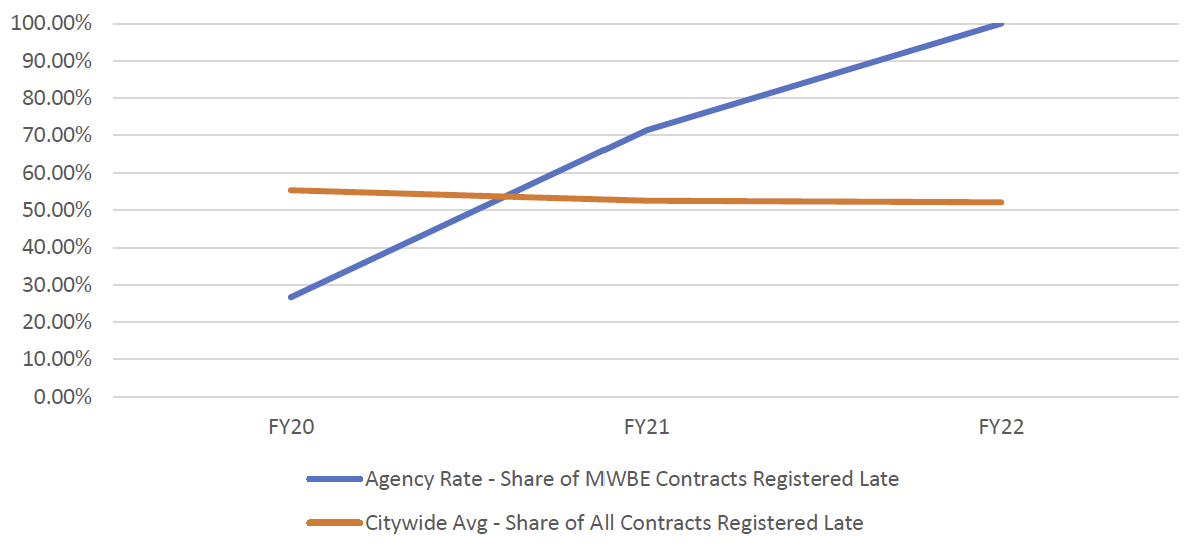
Chart 40: FY22 Contract and PO Value, by M/WBE Category and Industry
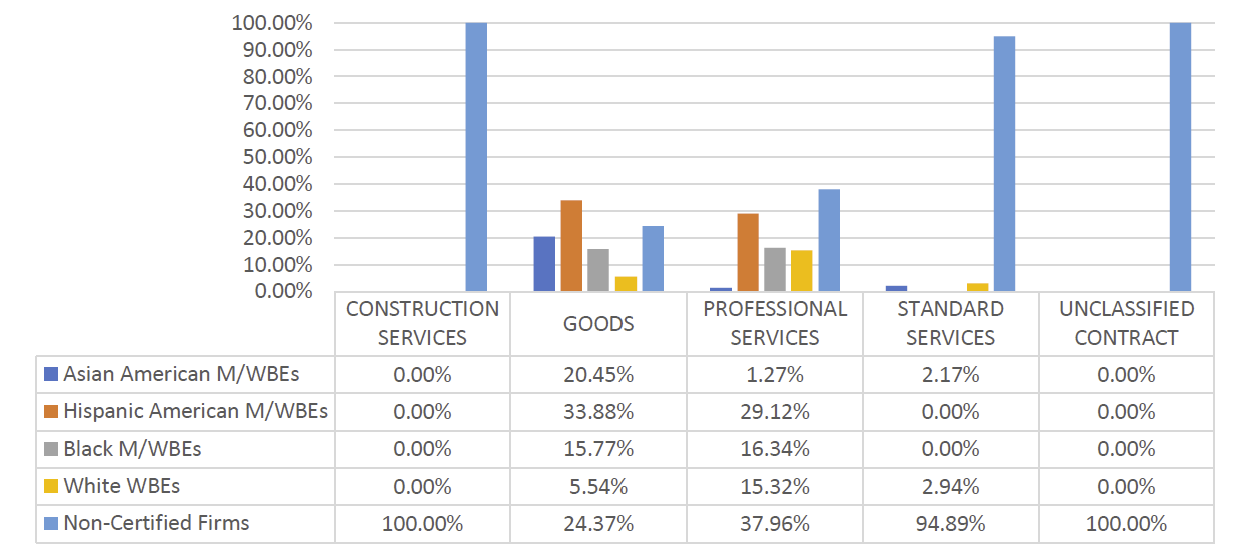
Table 59: Approved LL 174-Eligible Subcontracts – FY20-22
| Certification Status | # of Contracts | % Share of Contracts | Total Registered Contract Value | % Share of Registered Contract Value |
| FY20 | 8 | N/A | $788,526 | N/A |
| Sub – Non-Certified | 8 | 100.00% | $788,526 | 100.00% |
| FY21 | 1 | N/A | $72,513 | N/A |
| Sub – Non-Certified | 1 | 100.00% | $72,513 | 100.00% |
Table 60: LL 174-Eligible Prime Spend, FY20-22
|
M/WBE Category |
FY20 | FY21 | FY22 | |||
|---|---|---|---|---|---|---|
| Spend | % Share | Spend | % Share | Spend | % Share | |
| M/WBE ALL | $1,443,106 | 20.61% | $561,189 | 11.97% | $650,268 | 20.18% |
| Non-Certified | $5,560,151 | 79.39% | $4,127,405 | 88.03% | $2,571,461 | 79.82% |
| Total | $7,003,257 | 100.00% | $4,688,594 | 100.00% | $3,221,729 | 100.00% |
Table 61: LL 174-Eligible Sub Vendor Spend, FY20-22
|
M/WBE Category |
FY20 | FY21 | FY22 | |||
|---|---|---|---|---|---|---|
| Spend | % Share | Spend | % Share | Spend | % Share | |
| M/WBE ALL | $48,389 | 100.00% | $63,282 | 100.00% | $296,108 | 100.00% |
| Non-Certified | $0 | 0.00% | $0 | 0.00% | $0 | 0.00% |
| Total | $48,389 | 100.00% | $63,282 | 100.00% | $296,108 | 100.00% |
Department of Consumer and Worker Protection (DCWP)
DCWP has a relatively small procurement portfolio, registering eight new contracts and 93 POs in FY22 (valuing nearly $3 million) that were LL 174-eligible. Though a small portfolio, the share of contract value registered to M/WBEs is higher than the Citywide average (47.77%). DCWP registered a higher percentage of contract value to Black M/WBEs than most agencies (32%). DCWP registered all eight new contracts late in FY22. There were zero approved subcontractors for LL 174-eligible contracts in PIP for FY20, FY21, or FY22. Over a third of DCWP’s LL 174-eligible spending went to M/WBE prime vendors in FY22. There was no recorded LL 174-eligible subcontract spending since FY20.
Table 62: LL 174-Eligible Contracts and POs – FY20-22
| Certification Status | # of Contracts | % Share of Contracts | Total Registered Contract Value | % Share of Registered Contract Value |
| FY20 | 119 | N/A | $1,506,678 | N/A |
| Non-Certified | 83 | 69.75% | $816,835 | 54.21% |
| M/WBE | 36 | 30.25% | $689,843 | 45.79% |
| FY21 | 93 | N/A | $1,375,882 | N/A |
| Non-Certified | 70 | 75.27% | $406,894 | 29.57% |
| M/WBE | 23 | 24.73% | $968,987 | 70.43% |
| FY22 | 101 | N/A | $2,748,204 | N/A |
| Non-Certified | 68 | 67.33% | $1,435,476 | 52.23% |
| M/WBE | 33 | 32.67% | $1,312,727 | 47.77% |
| Grand Total | 313 | N/A | $5,630,765 | N/A |
Chart 41: FY22 Value of LL 174-Eligible Prime Contracts and POs
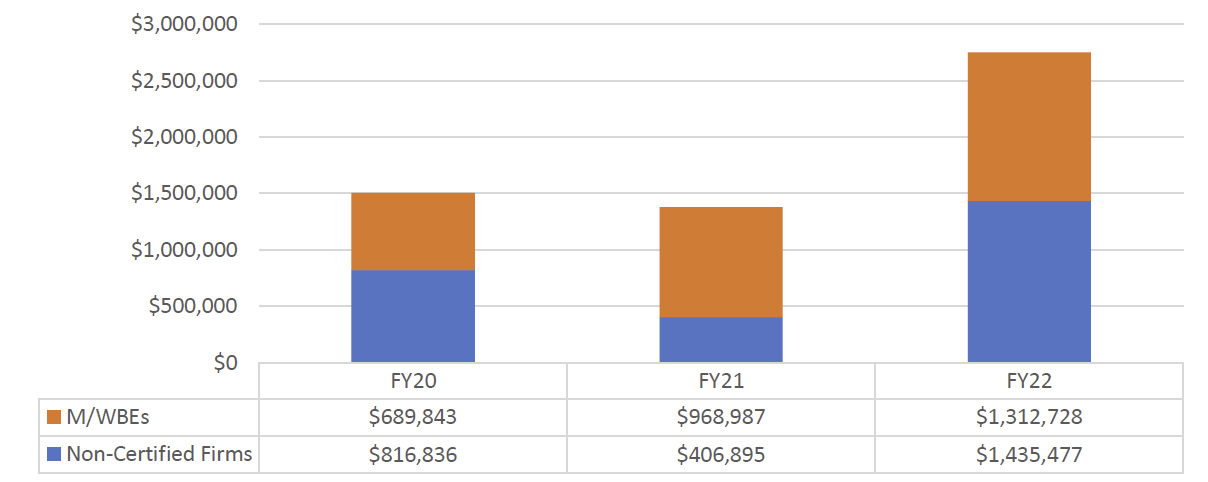
Chart 42: FY22 Value of LL 174-Eligible Contracts and POs, by Race and Gender
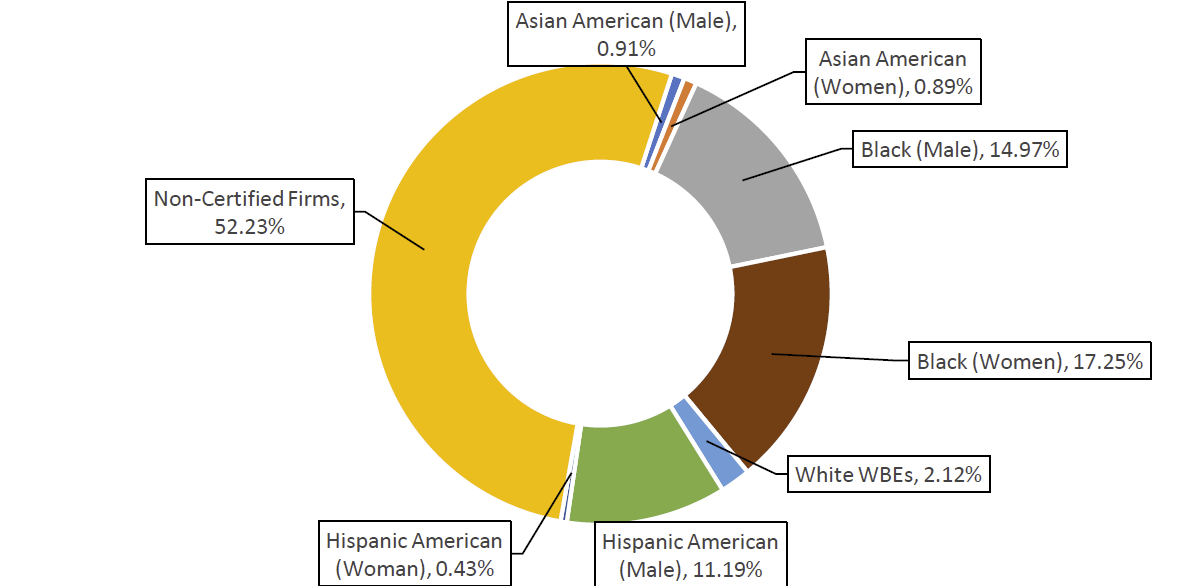
Table 63: Registered M/WBE NCSPs – FY20-22
| FY | Count | Total Value | AVG Value | Citywide AVG Value |
| FY20 | 8 | $565,732 | $70,716 | $79,27 |
| FY21 | 4 | $929,954 | $232,488 | $105,121 |
| FY22 | 7 | $1,150,260 | $164,323 | $134,907 |
| Grand Total | 19 | $2,645,946 | $139,260 | $104,232 |
Chart 43: Share of M/WBE Contracts Registered Late – FY20-22
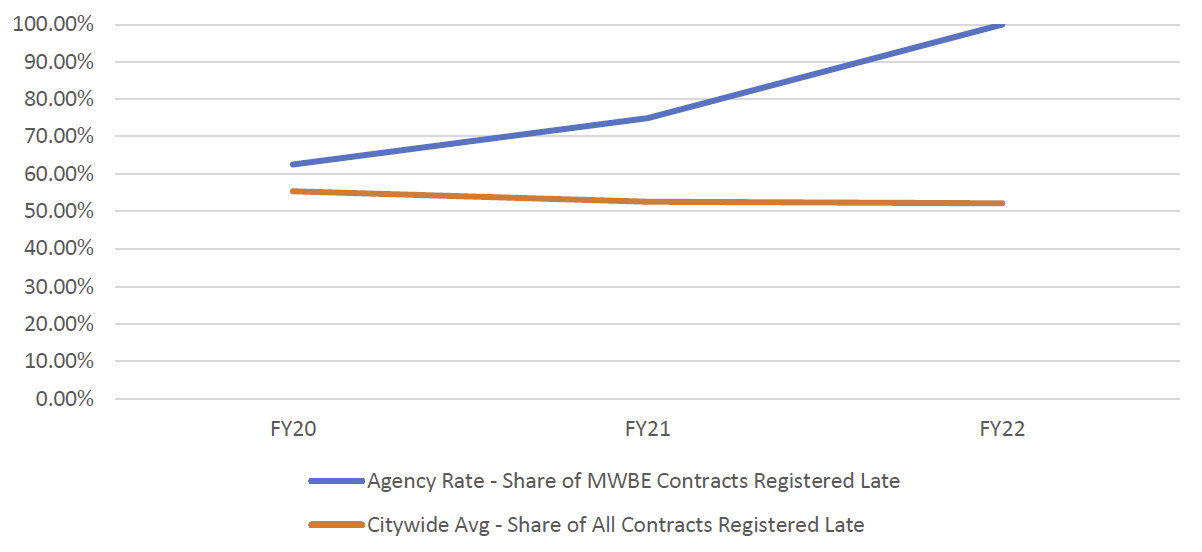
Chart 44: FY22 Contract and PO Value, by M/WBE Category and Industry
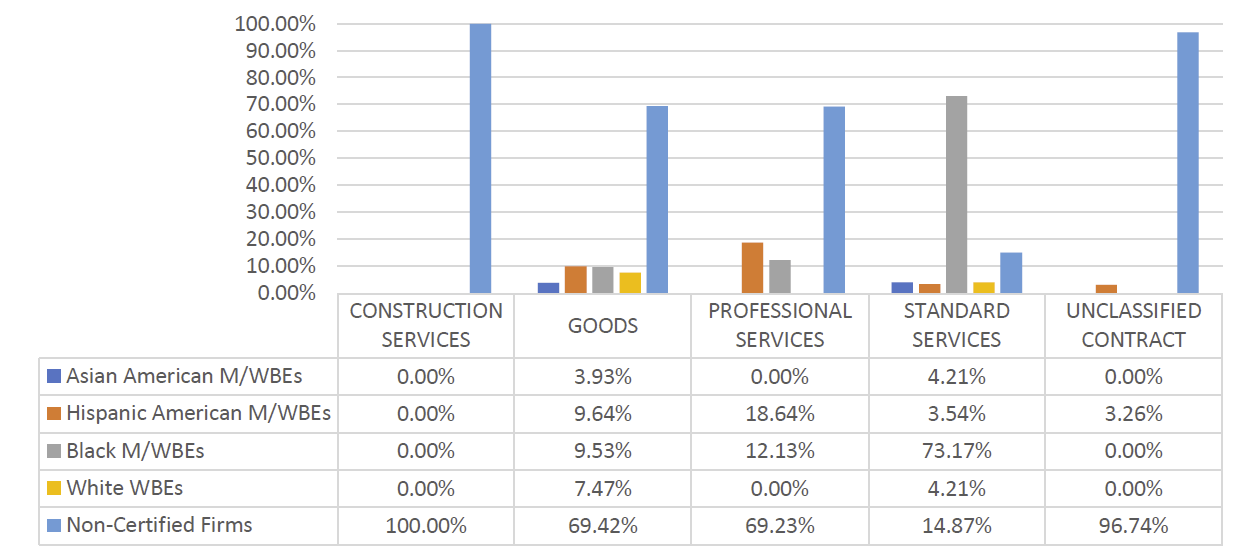
Table 64: LL 174-Eligible Prime Spend, FY20-22
|
M/WBE Category |
FY20 | FY21 | FY22 | |||
|---|---|---|---|---|---|---|
| Spend | % Share | Spend | % Share | Spend | % Share | |
| M/WBE ALL | $1,210,392 | 30.25% | $1,699,112 | 53.27% | $1,343,316 | 33.67% |
| Non-Certified | $2,791,014 | 69.75% | $1,490,373 | 46.73% | $2,646,129 | 66.33% |
| Total | $4,001,406 | 100.00% | $3,189,485 | 100.00% | $3,989,445 | 100.00% |
Department of Design and Construction (DDC)
DDC has one of the largest procurement portfolios across the City and registered some of the highest-value Construction contracts. Though during FY20-22 some of these large procurements (many of these COVID-19 related Emergency contracts) are exempt from LL 174 participation goals, DDC still registered over $3 billion in eligible contracts and POs in FY22. DDC heavily relies on CSB and CSP procurements given that most of its contracts are for construction and construction-related services. DDC’s share of registered contract value is slightly lower than the Citywide average (12%). DDC has increased its utilization of the M/WBE NCSP method since FY20, and DDC has one of the highest average values for contracts registered using this method across the City ($197,322).
DDC’s share of LL 174-eligible spending with M/WBE primes has been low, but it reached a high point in FY22 relative to the previous three FYs at nearly 9%. The share of LL 174-eligible spending with sub vendors has been much higher, with over half of the dollar totals going to M/WBEs since FY20.
Table 65: LL 174-Eligible Contracts and POs – FY20-22
| Certification Status | # of Contracts | % Share of Contracts | Total Registered Contract Value | % Share of Registered Contract Value |
| FY20 | 323 | N/A | $1,041,457,600 | N/A |
| Non-Certified | 224 | 69.35% | $859,316,806 | 82.51% |
| M/WBE | 99 | 30.65% | $182,140,794 | 17.49% |
| FY21 | 333 | N/A | $2,465,134,640 | N/A |
| Non-Certified | 242 | 72.67% | $1,914,879,214 | 77.68% |
| M/WBE | 91 | 27.33% | $550,255,426 | 22.32% |
| FY22 | 382 | N/A | $3,188,471,447 | N/A |
| Non-Certified | 267 | 69.90% | $2,792,742,136 | 87.59% |
| M/WBE | 115 | 30.10% | $395,729,311 | 12.41% |
| Grand Total | 1,038 | N/A | $6,695,063,688 | N/A |
Chart 45: FY22 Value of LL 174-Eligible Prime Contracts and POs
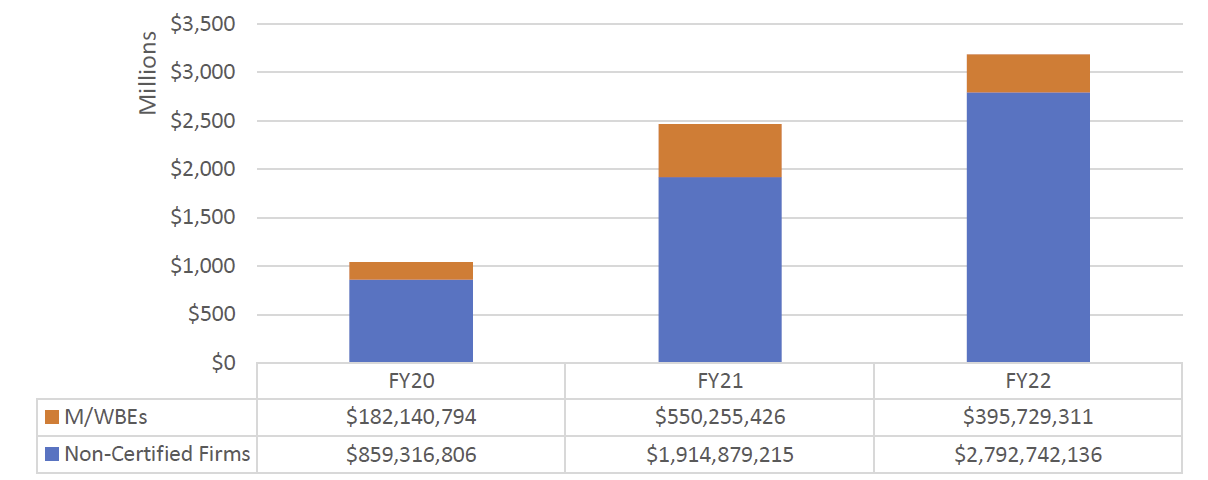
Chart 46: FY22 Value of LL 174-Eligible Contracts and POs, by Race and Gender
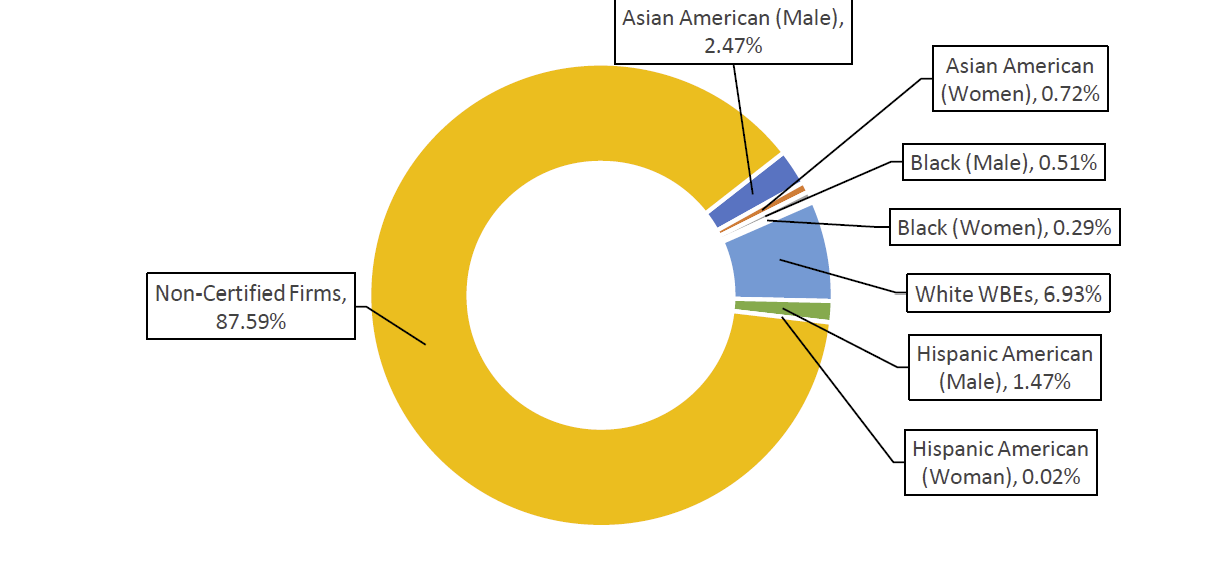
Table 66: Registered M/WBE NCSPs – FY20-22
| FY | Count | Total Value | AVG Value | Citywide AVG Value |
| FY20 | 19 | $1,304,437 | $68,655 | $79,27 |
| FY21 | 23 | $3,818,545 | $166,024 | $105,121 |
| FY22 | 27 | $5,327,692 | $197,322 | $134,907 |
| Grand Total | 69 | $10,450,673 | $151,459 | $104,232 |
Chart 47: Share of M/WBE Contracts Registered Late – FY20-22

Chart 48: FY22 Contract and PO Value, by M/WBE Category and Industry
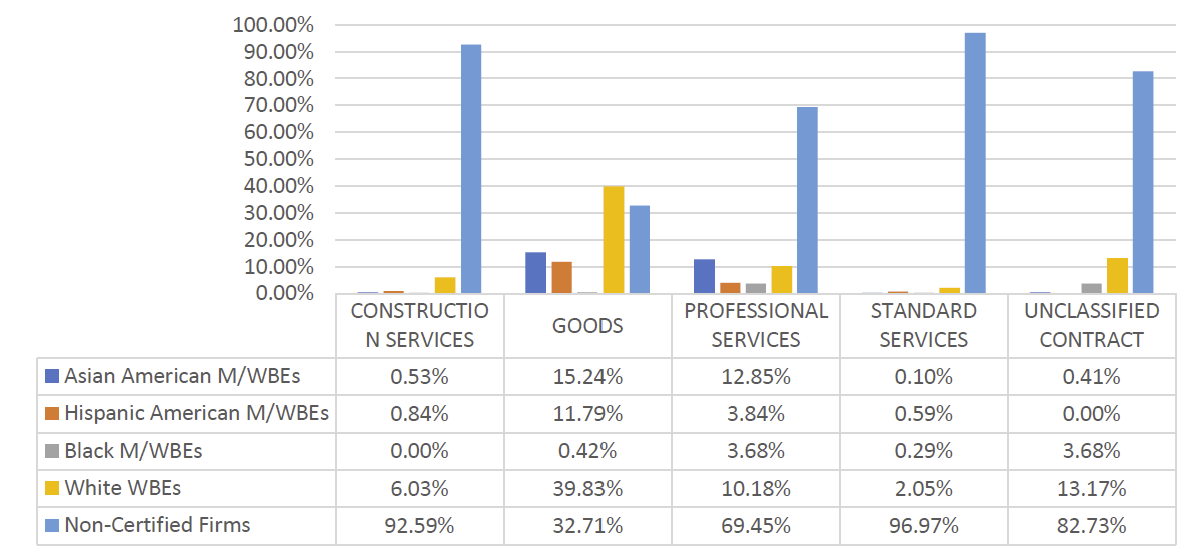
Table 67: Approved LL 174-Eligible Subcontracts – FY20-22
| Certification Status | # of Contracts | % Share of Contracts | Total Registered Contract Value | % Share of Registered Contract Value |
| FY20 | 917 | N/A | $269,019,681 | N/A |
| Sub – Non-Certified | 692 | 75.46% | $224,401,396 | 83.41% |
| Sub – M/WBE | 225 | 24.54% | $44,618,285 | 16.59% |
| FY21 | 740 | N/A | $434,599,193 | N/A |
| Sub – Non-Certified | 632 | 85.41% | $414,476,911 | 95.37% |
| Sub – M/WBE | 108 | 14.59% | $20,122,282 | 4.63% |
| FY22 | 975 | N/A | $620,309,836 | N/A |
| Sub – Non-Certified | 867 | 88.92% | $606,275,287 | 97.74% |
| Sub – M/WBE | 108 | 11.08% | $14,034,548 | 2.26% |
Table 68: LL 174-Eligible Prime Spend, FY20-22
|
M/WBE Category |
FY20 | FY21 | FY22 | |||
|---|---|---|---|---|---|---|
| Spend | % Share | Spend | % Share | Spend | % Share | |
| M/WBE ALL | $7,084,816 | 4.71% | $4,731,121 | 4.12% | $4,893,886 | 8.89% |
| Non-Certified | $143,189,747 | 95.29% | $110,182,531 | 95.88% | $50,149,078 | 91.11% |
| Total | $150,274,563 | 100.00% | $114,913,652 | 100.00% | $55,042,964 | 100.00% |
Table 69: LL 174-Eligible Sub Vendor Spend, FY20-22
|
M/WBE Category |
FY20 | FY21 | FY22 | |||
|---|---|---|---|---|---|---|
| Spend | % Share | Spend | % Share | Spend | % Share | |
| M/WBE ALL | $59,705,147 | 59.64% | $76,210,556 | 57.26% | $106,927,365 | 63.20% |
| Non-Certified | $40,406,683 | 40.36% | $56,895,042 | 42.74% | $62,274,150 | 36.80% |
| Total | $100,111,829 | 100.00% | $133,105,598 | 100.00% | $169,201,515 | 100.00% |
Department of Environmental Protection (DEP)
DEP manages many long-term, high value contracts – including many Negotiated Acquisitions and Watershed Agreements. Though the data here only shows procurements eligible for LL 174 participation goals, DEP still has an extremely large LL 174-eligible procurement portfolio. DEP registered over $1.3 billion in FY22 alone, with a heavy reliance on CSB and CSP procurements given that most of its contracts are for construction and construction-related services. The share of the value registered to M/WBEs is only 7% – below the Citywide average. DEP did use the M/WBE NCSP method more often than most agencies (52 times) and had a higher average value than the Citywide average ($167,603).
DEP’s share of LL 174-eligible spending with M/WBE primes was just 10% in FY22. However, DEP has increased the share of spend going to M/WBE sub vendors each year since FY20, reaching over 53% in FY22.
Table 70: LL 174-Eligible Contracts and POs – FY20-22
| Certification Status | # of Contracts | % Share of Contracts | Total Registered Contract Value | % Share of Registered Contract Value |
| FY20 | 1,605 | N/A | $677,298,025 | N/A |
| Non-Certified | 666 | 41.50% | $637,899,320 | 94.18% |
| M/WBEs | 939 | 58.50% | $39,398,705 | 5.82% |
| FY21 | 1,630 | N/A | $1,317,548,158 | N/A |
| Non-Certified | 649 | 39.82% | $1,244,379,906 | 94.45% |
| M/WBEs | 981 | 60.18% | $73,168,253 | 5.55% |
| FY22 | 1,880 | N/A | $1,089,928,681 | N/A |
| Non-Certified | 693 | 36.86% | $1,003,702,042 | 92.09% |
| M/WBEs | 1,187 | 63.14% | $86,226,639 | 7.91% |
| Grand Total | 5,115 | N/A | $3,084,774,864 | N/A |
Chart 49: FY22 Value of LL 174-Eligible Prime Contracts and POs
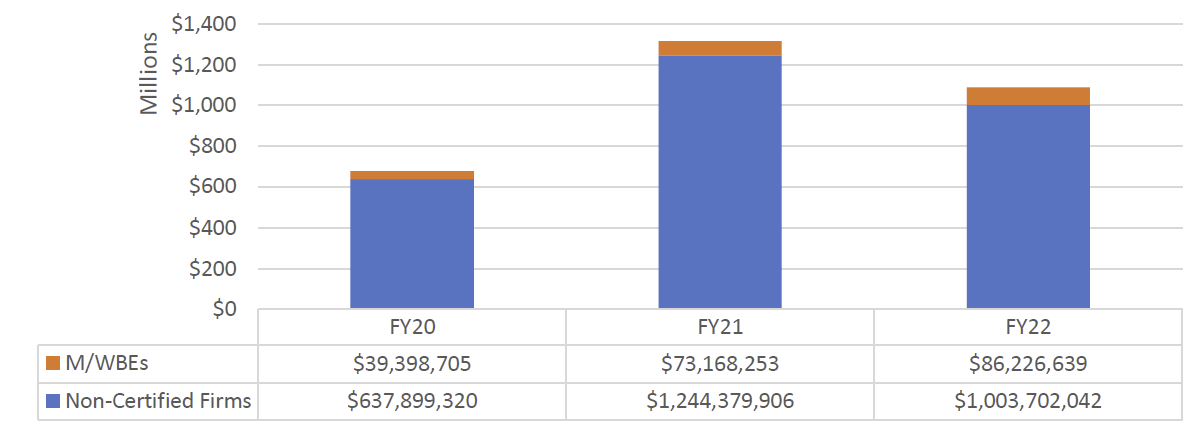
Chart 50: FY22 Value of LL 174-Eligible Contracts and POs, by Race and Gender
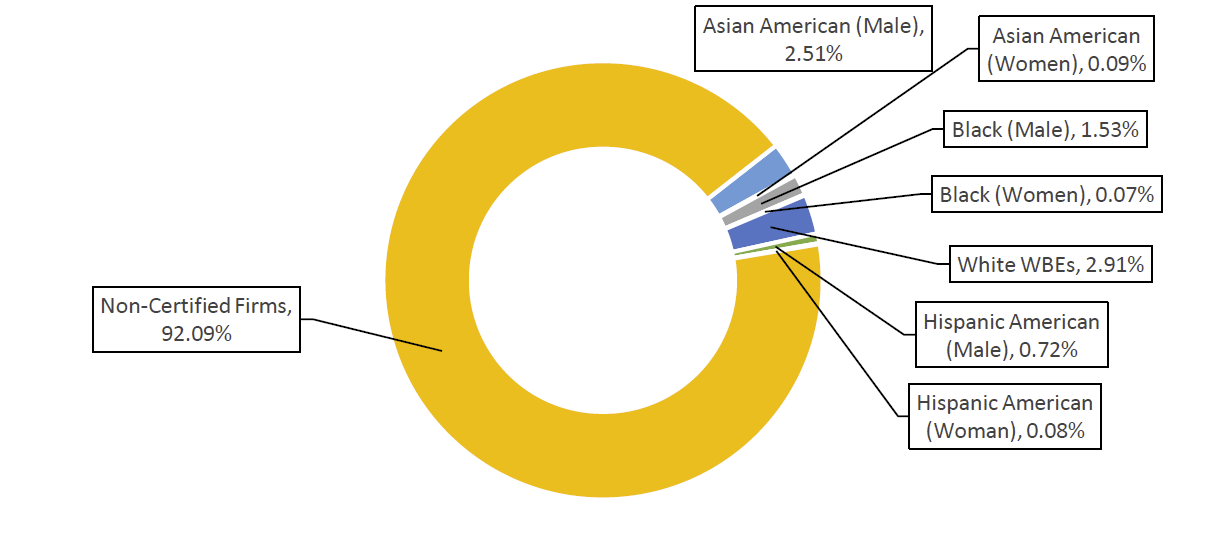
Table 71: Registered M/WBE NCSPs – FY20-22
| FY | Count | Total Value | AVG Value | Citywide AVG Value |
| FY20 | 73 | $6,293,773 | $86,216 | $79,27 |
| FY21 | 23 | $2,429,576 | $105,634 | $105,121 |
| FY22 | 52 | $8,715,353 | $167,603 | $134,907 |
| Grand Total | 148 | $17,438,702 | $117,829 | $104,232 |
Chart 51: Share of M/WBE Contracts Registered Late – FY20-22
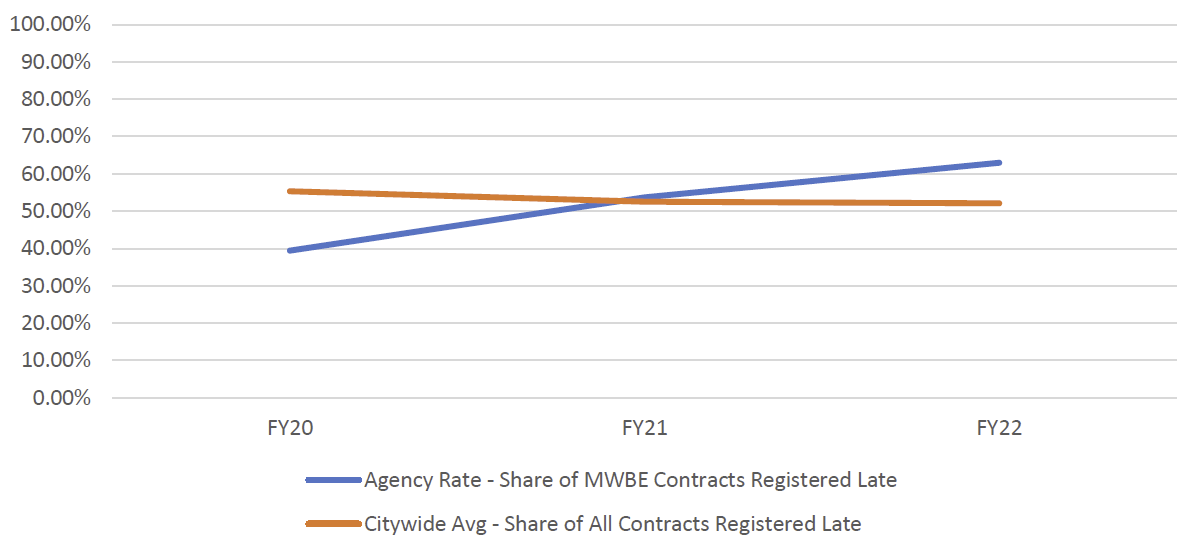
Chart 52: FY22 Contract and PO Value, by M/WBE Category and Industry
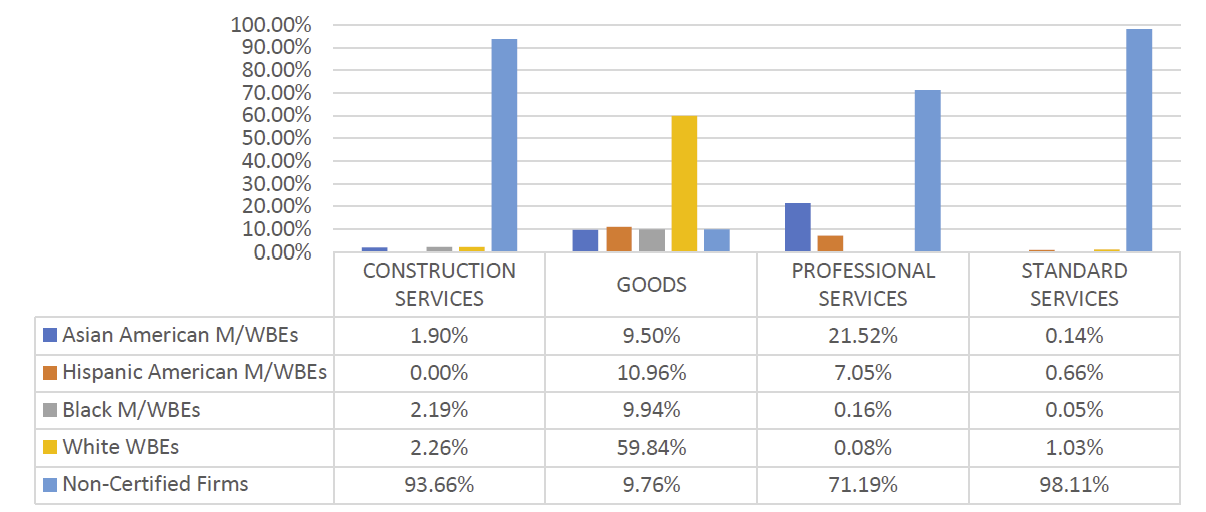
Table 72: Approved LL 174-Eligible Subcontracts – FY20-22
| Certification Status | # of Contracts | % Share of Contracts | Total Registered Contract Value | % Share of Registered Contract Value |
| FY20 | 589 | N/A | $216,561,487 | N/A |
| Sub – Non-Certified | 573 | 97.28% | $215,209,715 | 99.38% |
| Sub – M/WBE | 16 | 2.72% | $1,351,772 | 0.62% |
| FY21 | 453 | N/A | $310,170,212 | N/A |
| Sub – Non-Certified | 407 | 89.85% | $297,060,283 | 95.77% |
| Sub – M/WBE | 46 | 10.15% | $13,109,929 | 4.23% |
| FY22 | 392 | N/A | $251,188,016 | N/A |
| Sub – Non-Certified | 331 | 84.44% | $234,707,604 | 93.44% |
| Sub – M/WBE | 61 | 15.56% | $16,480,412 | 6.56% |
Table 73: LL 174-Eligible Prime Spend, FY20-22
|
M/WBE Category |
FY20 | FY21 | FY22 | |||
|---|---|---|---|---|---|---|
| Spend | % Share | Spend | % Share | Spend | % Share | |
| M/WBE ALL | $138,566,568 | 8.75% | $177,786,958 | 11.34% | $151,223,865 | 10.16% |
| Non-Certified | $1,445,539,216 | 91.25% | $1,389,874,645 | 88.66% | $1,337,650,202 | 89.84% |
| Total | $1,584,105,784 | 100.00% | $1,567,661,603 | 100.00% | $1,488,874,067 | 100.00% |
Table 74: LL 174-Eligible Sub Vendor Spend, FY20-22
|
M/WBE Category |
FY20 | FY21 | FY22 | |||
|---|---|---|---|---|---|---|
| Spend | % Share | Spend | % Share | Spend | % Share | |
| M/WBE ALL | $67,429,426 | 46.26% | $63,798,442 | 45.85% | $91,258,081 | 53.27% |
| Non-Certified | $78,339,696 | 53.74% | $75,347,223 | 54.15% | $80,063,544 | 46.73% |
| Total | $145,769,121 | 100.00% | $139,145,665 | 100.00% | $171,321,625 | 100.00% |
Department for the Aging (DFTA)
The Department for the Aging predominantly contracts with vendors for human services, which are exempt from LL 174 participation goals. Therefore, the data included here represents a relatively small share of DFTA’s total procurement portfolio. DFTA seems to have successfully registered some of its more lucrative contracts with M/WBEs, as the share in registered M/WBE contract value (43%) is higher than the share of the volume of contracts registered to M/WBEs (34%). As is the case with most human services agencies, DFTA has higher rates of retroactivity than the Citywide average- registering 100% of contracts in FY22 after the contract start date. There were zero approved subcontractors in PIP for FY20, FY21, or FY22. In terms of both value and share of LL 174-eligible spending, M/WBEs have seen increases since FY20, surpassing two-thirds of all LL 174 spending in FY22. There was no recorded LL 174-eligible subcontract spending since FY20.
Table 75: LL 174-Eligible Contracts and POs – FY20-22
| Certification Status | # of Contracts | % Share of Contracts | Total Registered Contract Value | % Share of Registered Contract Value |
| FY20 | 166 | N/A | $1,255,864 | N/A |
| Non-Certified | 74 | 44.58% | $484,475 | 38.58% |
| M/WBE | 92 | 55.42% | $771,389 | 61.42% |
| FY21 | 149 | N/A | $4,099,777 | N/A |
| Non-Certified | 95 | 63.76% | $3,588,262 | 87.52% |
| M/WBE | 54 | 36.24% | $511,514 | 12.48% |
| FY22 | 207 | N/A | $2,339,244 | N/A |
| Non-Certified | 135 | 65.22% | $1,324,586 | 56.62% |
| M/WBE | 72 | 34.78% | $1,014,658 | 43.38% |
| Grand Total | 522 | N/A | $7,694,886 | N/A |
Chart 53: FY22 Value of LL 174-Eligible Prime Contracts and POs
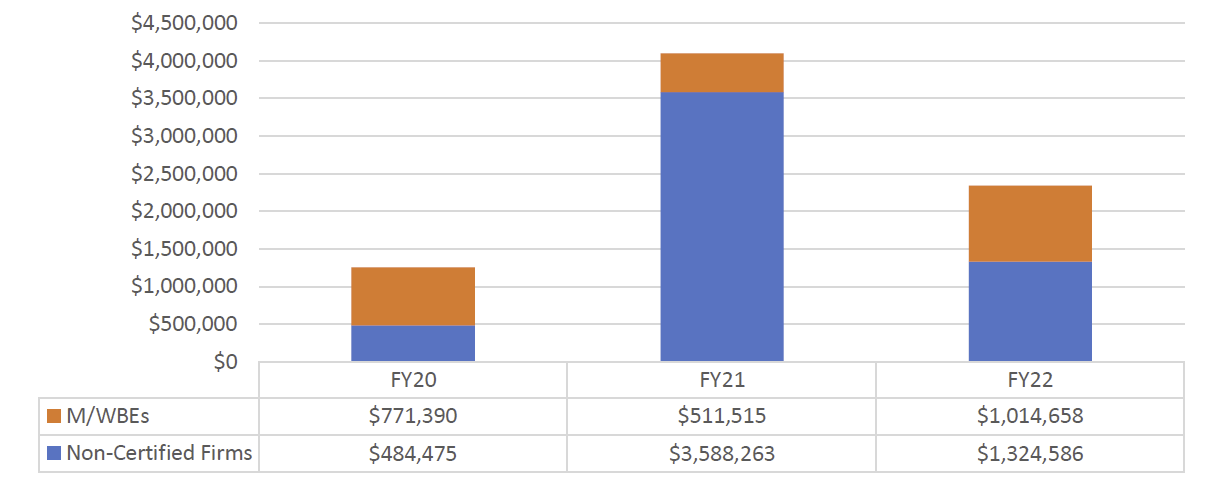
Chart 54: FY22 Value of LL 174-Eligible Contracts and POs, by Race and Gender
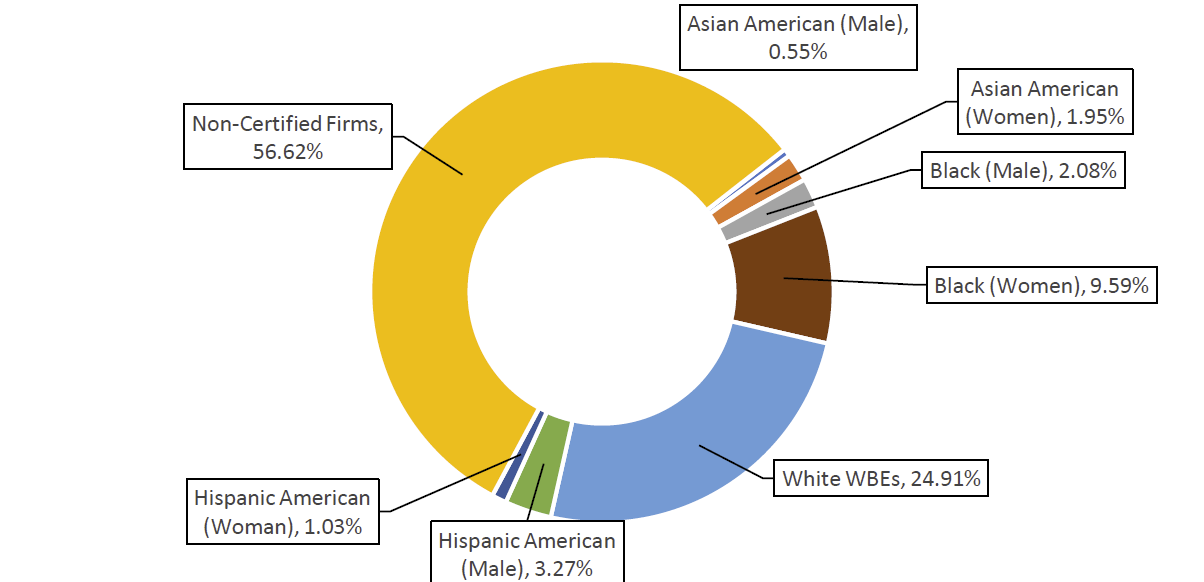
Table 76: Registered M/WBE NCSPs – FY20-22
| FY | Count | Total Value | AVG Value | Citywide AVG Value |
| FY20 | 6 | $337,647 | $56,275 | $79,27 |
| FY21 | 13 | $698,678 | $53,744 | $105,121 |
| FY22 | 5 | $897,475 | $179,495 | $134,907 |
| Grand Total | 24 | $1,933,800 | $80,575 | $104,232 |
Chart 55: Share of M/WBE Contracts Registered Late – FY20-22
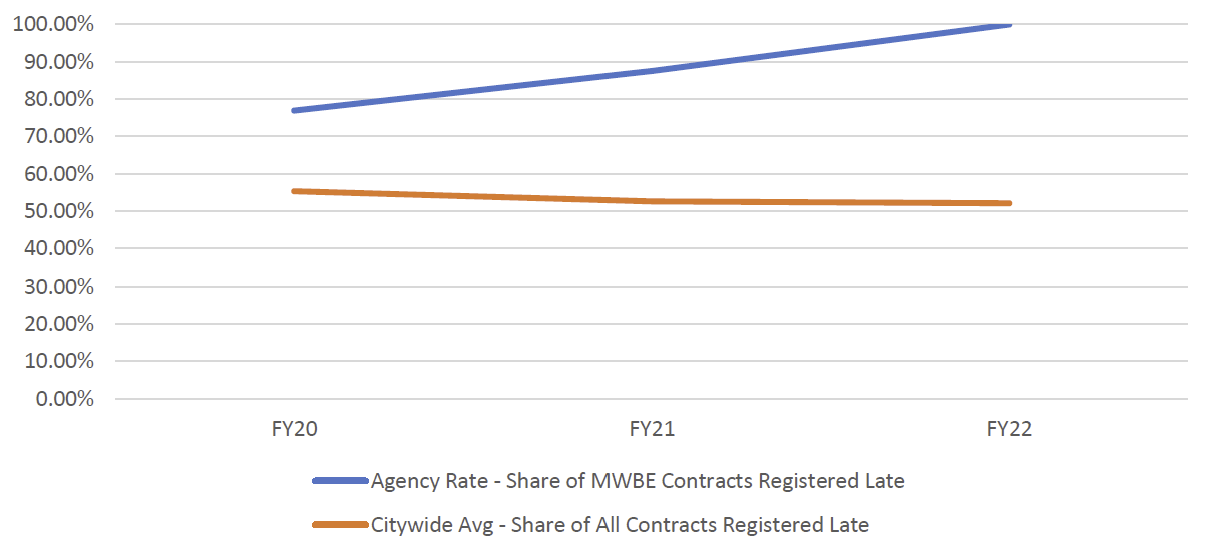
Chart 56: FY22 Contract and PO Value, by M/WBE Category and Industry
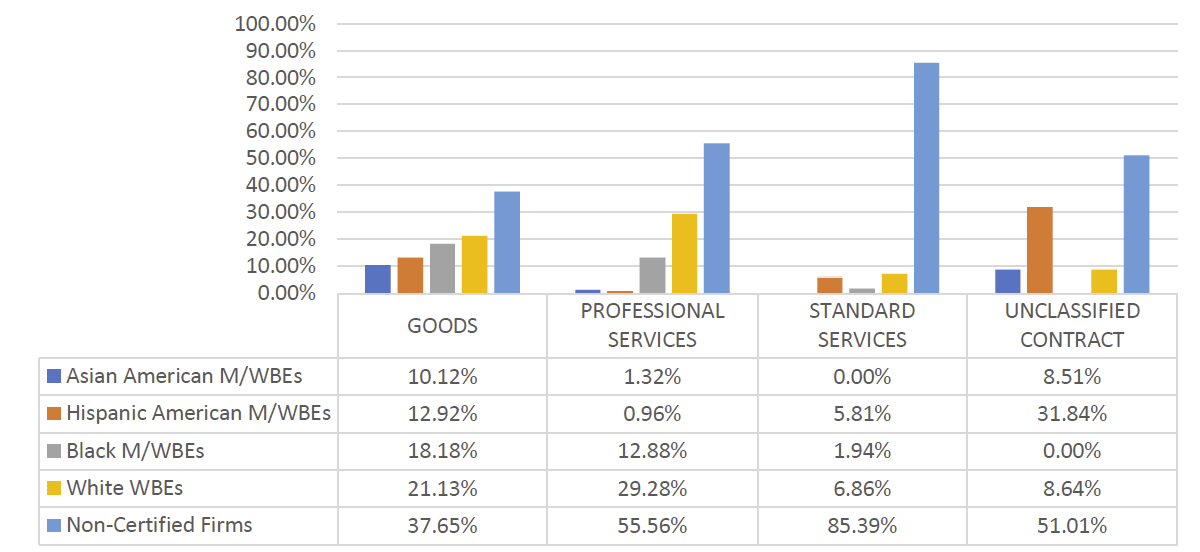
Table 77: LL 174-Eligible Prime Spend, FY20-22
| M/WBE Category | FY20 | FY21 | FY22 | |||
|---|---|---|---|---|---|---|
| Spend | % Share | Spend | % Share | Spend | % Share | |
| M/WBE ALL | $1,039,363 | 40.06% | $1,067,370 | 54.84% | $1,999,013 | 66.28% |
| Non-Certified | $1,555,460 | 59.94% | $879,015 | 45.16% | $1,017,023 | 33.72% |
| Total | $2,594,823 | 100.00% | $1,946,385 | 100.00% | $3,016,037 | 100.00% |
Department of Buildings (DOB)
The majority of DOB’s procurement portfolio is for Goods, which (when exceeding $1 million) are exempt from LL 174 participation goals. DOB’s total LL 174-eligible registered contract value shows a significant decrease from prior fiscal years. For FY22, the share of contract value registered to M/WBEs is much higher than the Citywide average (79.63%). DOB registered a higher percentage of contract value to Hispanic American MBEs (28%) and Black M/WBEs (16%) than most agencies. DOB has higher rates of retroactivity than the Citywide average with over 90% of contracts registered after the contract start date.
DOB’s share of LL 174-eligible spending with M/WBEs has generally increased since FY20 although there was a modest decline from FY21 levels. While there was no LL 174-eligible spend with sub vendors in FY20, almost all the LL 174-eligible sub vendor spending since FY21 has gone to M/WBEs.
Table 78: LL 174-Eligible Contracts and POs – FY20-22
| Certification Status | # of Contracts | % Share of Contracts | Total Registered Contract Value | % Share of Registered Contract Value |
| FY20 | 203 | N/A | $9,082,412 | N/A |
| Non-Certified | 92 | 45.32% | $646,372 | 7.12% |
| M/WBE | 111 | 54.68% | $8,436,040 | 92.88% |
| FY21 | 162 | N/A | $3,504,470 | N/A |
| Non-Certified | 83 | 51.23% | $1,994,981 | 56.93% |
| M/WBE | 79 | 48.77% | $1,509,488 | 43.07% |
| FY22 | 169 | N/A | $2,149,829 | N/A |
| Non-Certified | 76 | 44.97% | $437,898 | 20.37% |
| M/WBE | 93 | 55.03% | $1,711,930 | 79.63% |
| Grand Total | 534 | N/A | $14,736,713 | N/A |
Chart 57: FY22 Value of LL 174-Eligible Prime Contracts and POs
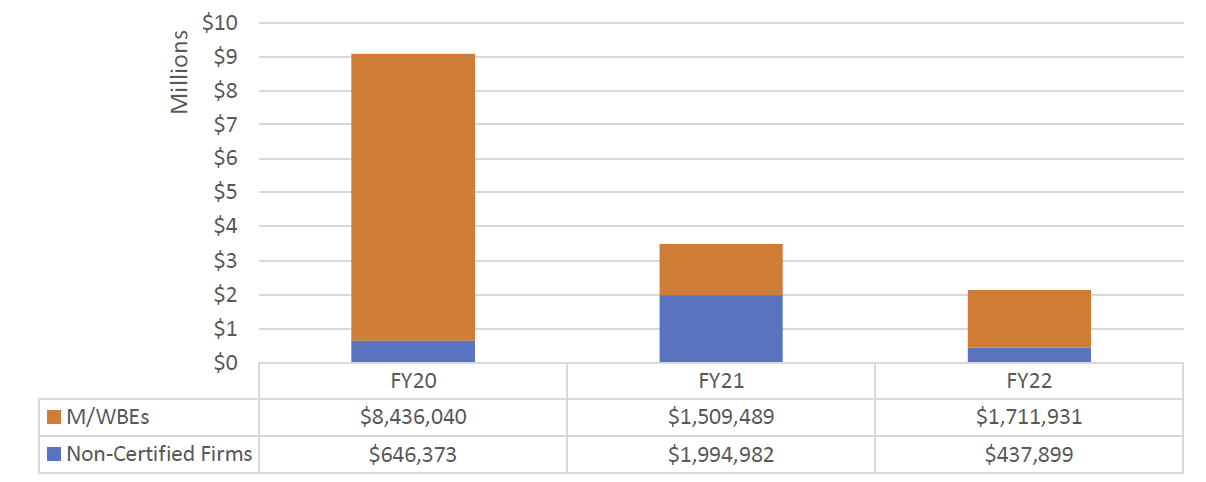
Chart 58: FY22 Value of LL 174-Eligible Contracts and POs, by Race and Gender
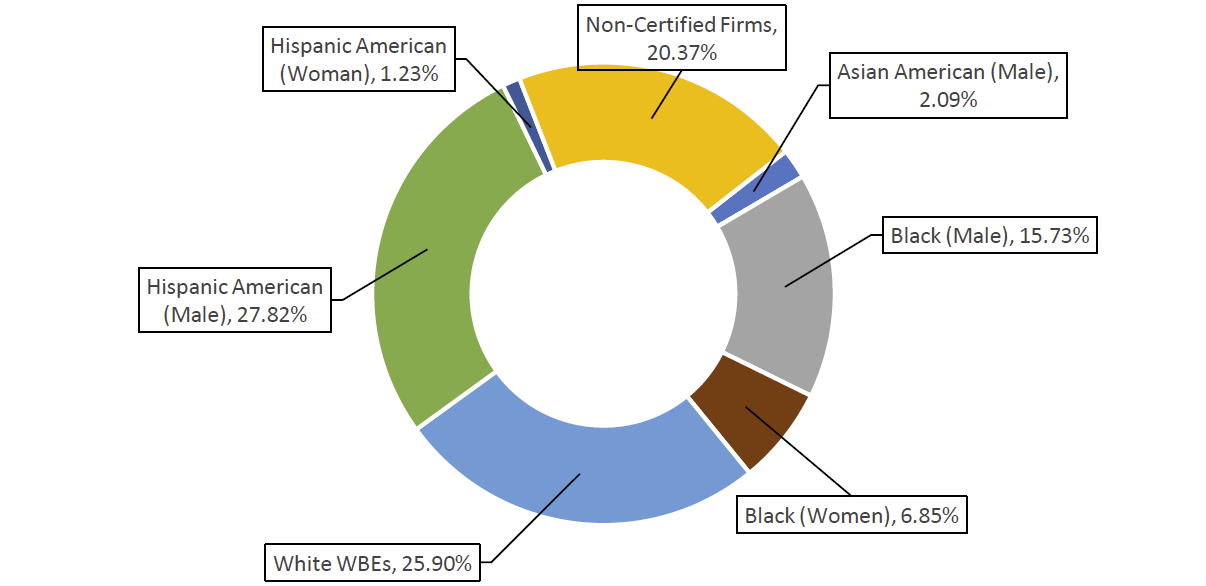
Table 79: Registered M/WBE NCSPs – FY20-22
| FY | Count | Total Value | AVG Value | Citywide AVG Value |
| FY20 | 20 | $1,364,703 | $68,235 | $79,27 |
| FY21 | 16 | $1,153,615 | $72,101 | $105,121 |
| FY22 | 13 | $1,240,717 | $95,440 | $134,907 |
| Grand Total | 49 | $3,759,036 | $76,715 | $104,232 |
Chart 59: Share of M/WBE Contracts Registered Late – FY20-22
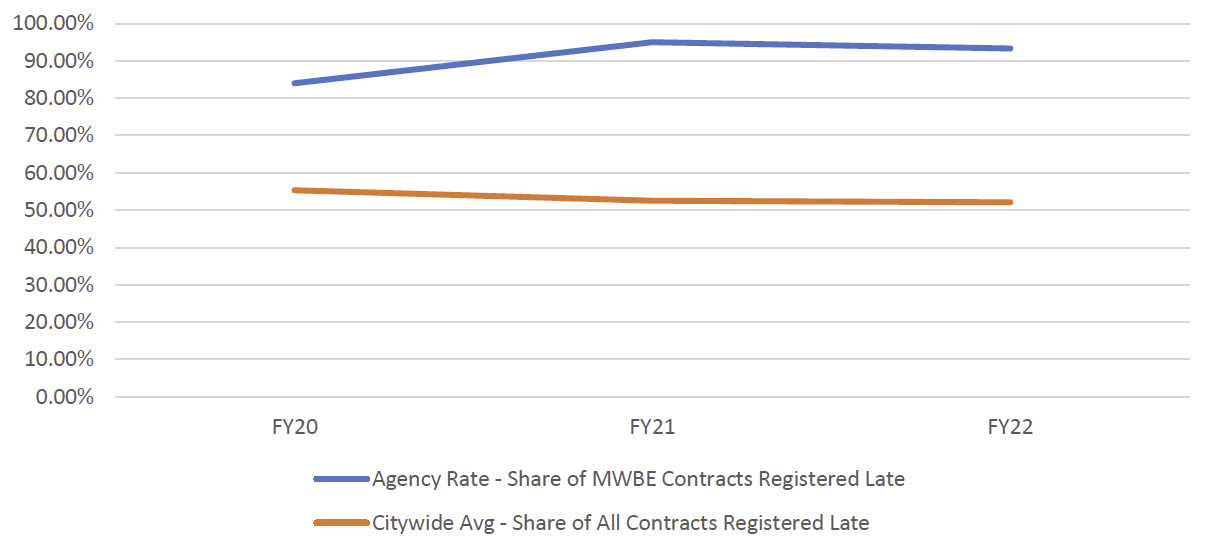
Chart 60: FY22 Contract and PO Value, by M/WBE Category and Industry
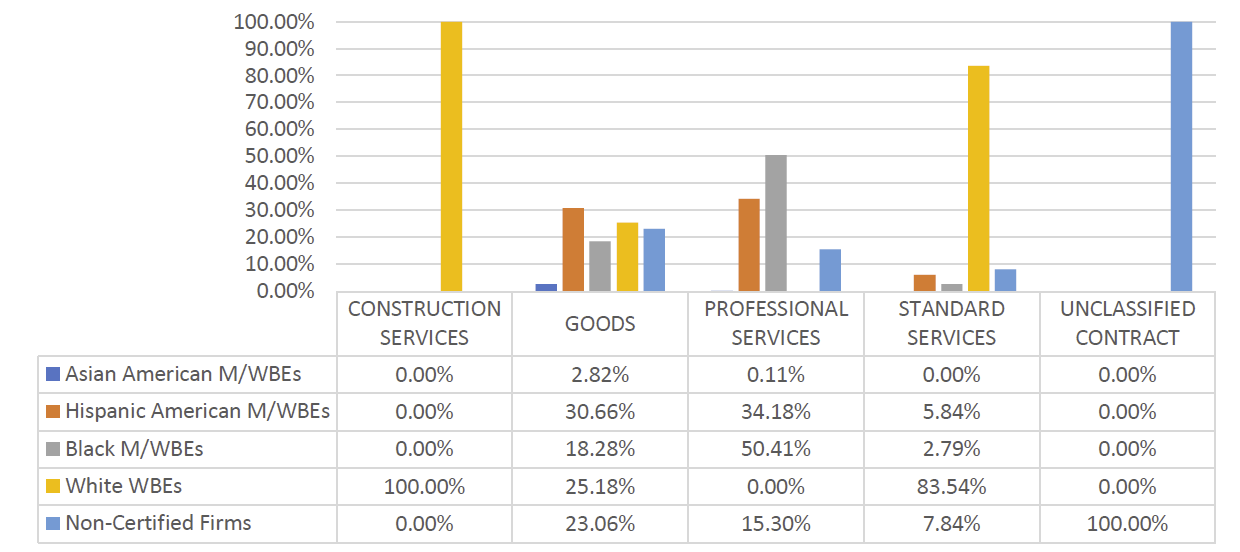
Table 80: LL 174-Eligible Approved Subcontracts – FY20-22
| Certification Status | # of Contracts | % Share of Contracts | Total Registered Contract Value | % Share of Registered Contract Value |
| FY21 | 1 | 100.00% | $634,202 | 100.00% |
| Sub – Non-Certified | 1 | 100.00% | $634,202 | 100.00% |
Table 81: LL 174-Eligible Prime Spend, FY20-22
| FY20 | FY21 | FY22 | ||||
|---|---|---|---|---|---|---|
| M/WBE Category | Spend | % Share | Spend | % Share | Spend | % Share |
| M/WBE ALL | $5,645,897 | 21.26% | $5,328,880 | 30.11% | $4,569,351 | 26.84% |
| Non-Certified | $20,916,482 | 78.74% | $12,369,028 | 69.89% | $12,452,834 | 73.16% |
| Total | $26,562,379 | 100.00% | $17,697,908 | 100.00% | $17,022,185 | 100.00% |
Table 82: LL 174-Eligible Sub Vendor Spend, FY20-22
| FY20 | FY21 | FY22 | ||||
|---|---|---|---|---|---|---|
| M/WBE Category | Spend | % Share | Spend | % Share | Spend | % Share |
| M/WBE ALL | $0 | N/A | $83,886 | 81.72% | $62,762 | 100.00% |
| Non-Certified | $0 | N/A | $18,765 | 18.28% | $0 | 0.00% |
| Total | $0 | 100.00% | $102,651 | 100.00% | $62,762 | 100.00% |
Department of Correction (DOC)
DOC has a mid-sized procurement portfolio – over a third of which is for human services, which are exempt from LL 174 participation goals. Therefore, the data included here represents only a share of DOC’s total procurement portfolio. DOC’s FY22 share of LL 174-eligible contract value registered to M/WBEs is higher than the Citywide average (63%). The largest M/WBE share of registered contract value is to businesses owned by white women, then Black male-owned MBEs. DOC registered a higher percentage of contract value to Black male-owned MBEs than most agencies (15%), mostly in Goods and then Professional Services. The share of DOC’s LL 174 spending with both M/WBE prime and sub vendors has declined in FY22 relative to the past two fiscal years.
Table 83: LL 174-Eligible Contracts and POs – FY20-22
| Certification Status | # of Contracts | % Share of Contracts | Total Registered Contract Value | % Share of Registered Contract Value |
| FY20 | 474 | N/A | $26,561,190 | N/A |
| Non-Certified | 258 | 54.43% | $20,395,220 | 76.79% |
| M/WBE | 216 | 45.57% | $6,165,970 | 23.21% |
| FY21 | 327 | N/A | $10,947,843 | N/A |
| Non-Certified | 145 | 44.34% | $6,848,104 | 62.55% |
| M/WBE | 182 | 55.66% | $4,099,738 | 37.45% |
| FY22 | 399 | N/A | $10,331,039 | N/A |
| Non-Certified | 150 | 37.59% | $3,819,625 | 36.97% |
| M/WBE | 249 | 62.41% | $6,511,413 | 63.03% |
| Grand Total | 1,200 | N/A | $47,840,073 | 100.00% |
Chart 61: FY22 Value of LL 174-Eligible Prime Contracts and POs
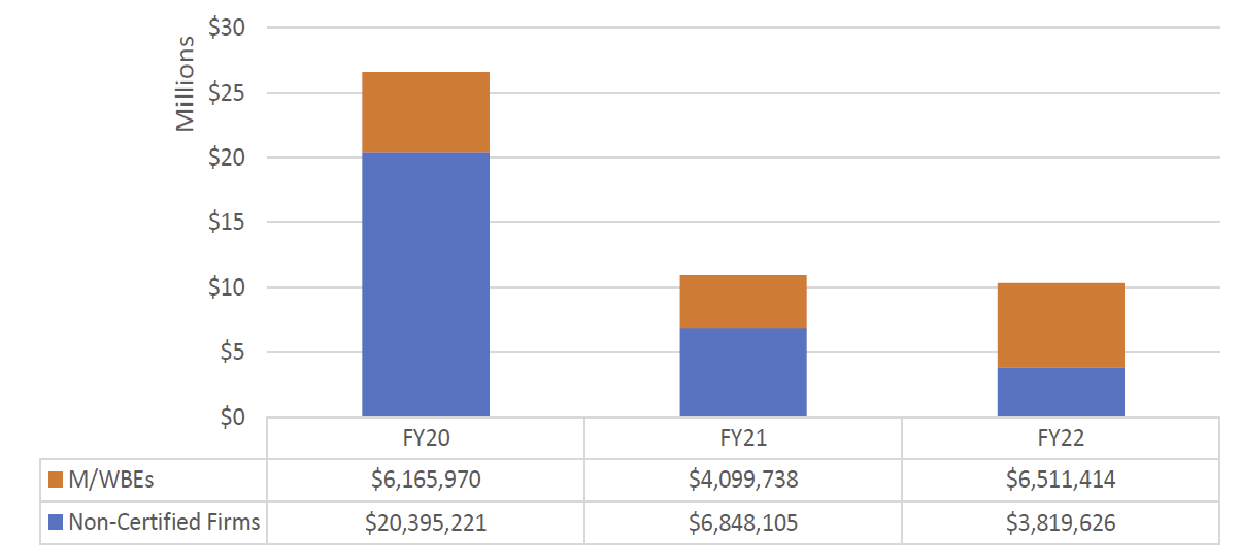
Chart 62: FY22 Value of LL 174-Eligible Contracts and POs, by Race and Gender
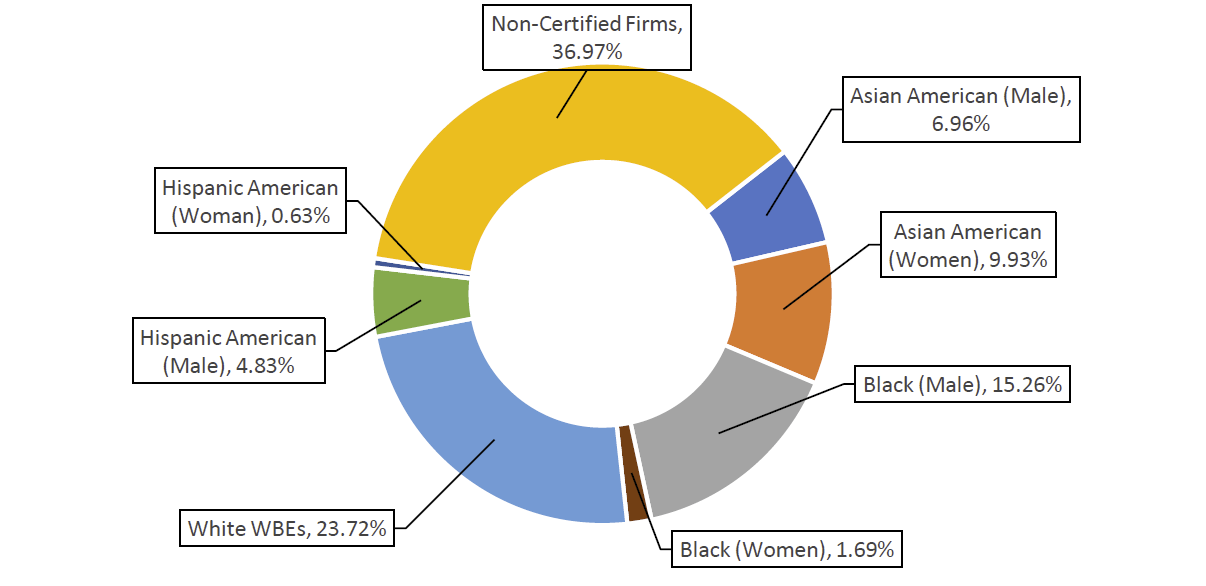
Table 84: Registered M/WBE NCSPs – FY20-22
| FY | Count | Total Value | AVG Value | Citywide AVG Value |
| FY20 | 60 | $5,354,327 | $89,239 | $79,27 |
| FY21 | 5 | $303,336 | $60,667 | $105,121 |
| FY22 | 23 | $2,989,177 | $129,964 | $134,907 |
| Grand Total | 88 | $8,646,841 | $98,260 | $104,232 |
Chart 63: Share of M/WBE Contracts Registered Late – FY20-22
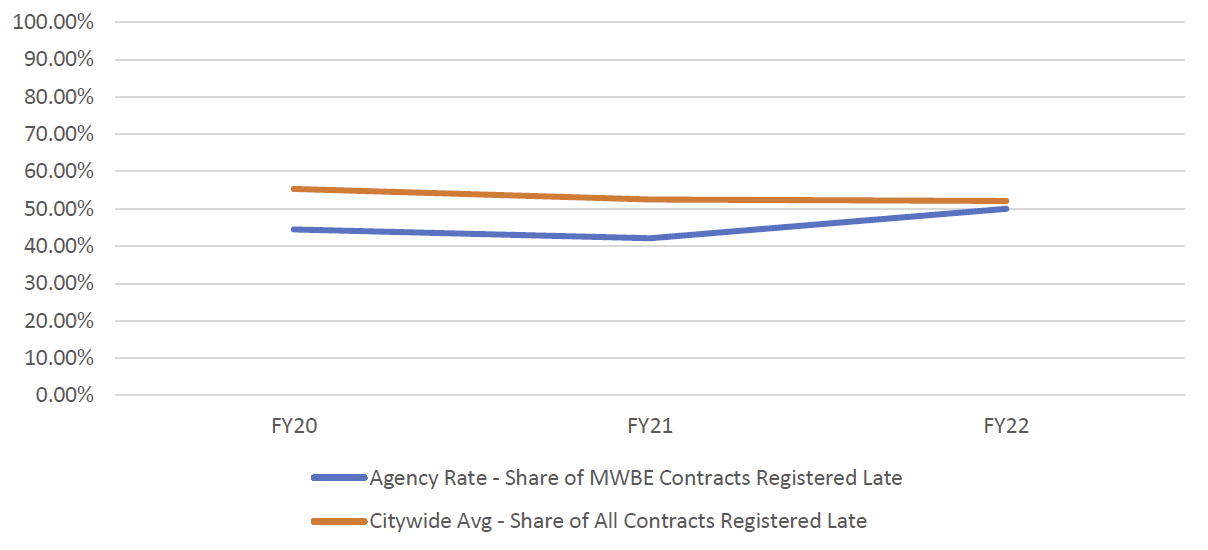
Chart 64: FY22 Contract and PO Value, by M/WBE Category and Industry
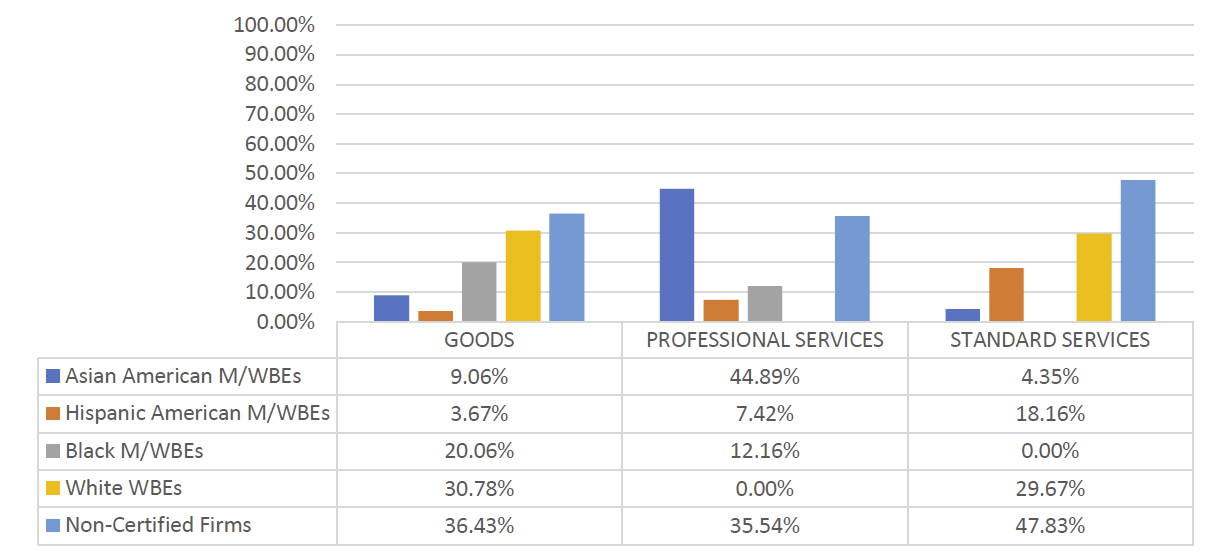
Table 85: LL 174-Eligible Approved Subcontracts – FY20-22
| Certification Status | # of Contracts | % Share of Contracts | Total Registered Contract Value | % Share of Registered Contract Value |
| FY20 | 11 | N/A | $1,179,961 | N/A |
| Sub – Non-Certified | 11 | 100.00% | $1,179,961 | 100.00% |
| FY21 | 2 | N/A | $213,799 | N/A |
| Sub – Non-Certified | 2 | 100.00% | $213,799 | 100.00% |
| FY21 | 1 | N/A | $500,000 | N/A |
| Sub – Non-Certified | 1 | 100.00% | $500,000 | 100.00% |
Table 86: LL 174-Eligible Prime Spend, FY20-22
| FY20 | FY21 | FY22 | ||||
|---|---|---|---|---|---|---|
| M/WBE Category | Spend | % Share | Spend | % Share | Spend | % Share |
| M/WBE ALL | $14,080,067 | 14.32% | $10,015,467 | 8.37% | $20,386,143 | 9.97% |
| Non-Certified | $84,224,256 | 85.68% | $109,684,634 | 91.63% | $184,014,792 | 90.03% |
Table 87: LL 174-Eligible Sub Vendor Spend, FY20-22
| FY20 | FY21 | FY22 | ||||
|---|---|---|---|---|---|---|
| M/WBE Category | Spend | % Share | Spend | % Share | Spend | % Share |
| M/WBE ALL | $622,743 | 91.17% | $745,900 | 91.84% | $77,500 | 60.12% |
| Non-Certified | $60,280 | 8.83% | $66,236 | 8.16% | $51,417 | 39.88% |
| Total | $683,023 | 100.00% | $812,136 | 100.00% | $128,917 | 100.00% |
Department of Education (DOE)
Although the DOE is not a mayoral agency and was not subject to LL 174 participation goals in FY22, in December 2022, the DOE’s November 2022 Panel for Educational Policy approved changes to their Procurement Policy and Procedures (“PPP”) that allow DOE to implement procurement pursuant to LL 174. The same State legislative authority that permitted DOE to amend its PPP Rules to allow for LL 174 was the basis for the PEP approving an amendment in January 2022 PEP authorizing the DOE to use the M/WBE NCSP method. Given all that, and because DOE has the largest procurement portfolio in the City, it is important to understand the level of M/WBE participation in its procurement. It is also helpful as a measure for where the PPP Rule changes and DOE policies should be focused on improving. If the same LL 174 participation goals were applied to the DOE in FY22, it would have registered over $1.5 billion in eligible contracts. Of this, the share of contract volume and contract value registered to M/WBEs is well below the Citywide average (each at about 6%). The DOE only utilized the M/WBE NCSP method ten times in FY22; however, the average value of these contracts is $417,833- which is much higher than the Citywide average. This demonstrates that the DOE has intentionally utilized this method to direct high-value contracting opportunities to M/WBEs. Unlike most agencies, DOE’s human service portfolio, largely due to its contracts for early childhood education, include a sizeable portion of for-profit entities, many of which are M/WBEs. The numbers below are not reflective of awards made to M/WBE early childhood providers because human service programs are exempt from LL 174.
The DOE spends more money against LL 174-eligible contracts each FY than any other agency. As discussed in greater detail in the Annual Report, the overwhelming driver of DOE’s procurement count is driven by lower dollar value purchases at or below its simplified procurement thresholds that generally do not exceed $25,000. The share of LL 174-eligible spending with M/WBEs has remained under 5% each FY going back to FY20. There was no recorded subcontract spending that could have been subject to LL 174 participation goals since FY20. There were zero approved subcontractors in PIP for FY20, FY21, or FY22.
Table 88: LL 174-Eligible Contracts and POs – FY20-22
| Certification Status | # of Contracts | % Share of Contracts | Total Registered Contract Value | % Share of Registered Contract Value |
| FY20 | 73,761 | N/A | $560,390,491 | N/A |
| Non-Certified | 69,873 | 94.73% | $417,896,399 | 74.57% |
| M/WBE | 3,888 | 5.27% | $142,494,091 | 25.43% |
| FY21 | 56,237 | N/A | $214,728,282 | N/A |
| Non-Certified | 52,760 | 93.82% | $185,316,152 | 86.30% |
| M/WBE | 3,477 | 6.18% | $29,412,129 | 13.70% |
| FY22 | 87,969 | N/A | $1,507,378,507 | N/A |
| Non-Certified | 83,059 | 94.42% | $1,422,935,897 | 94.40% |
| M/WBE | 4,910 | 5.58% | $84,442,610 | 5.60% |
| Grand Total | 217,967 | N/A | $2,282,497,281 | N/A |
Chart 65: FY22 Value of LL 174-Eligible Prime Contracts and POs
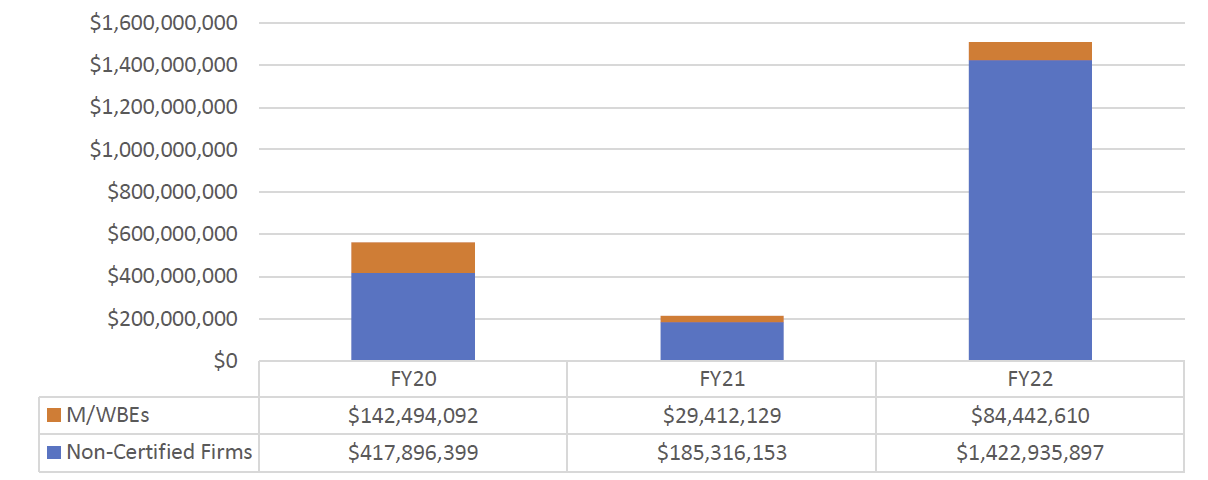
Chart 66: FY22 Value of LL 174-Eligible Contracts and POs, by Race and Gender
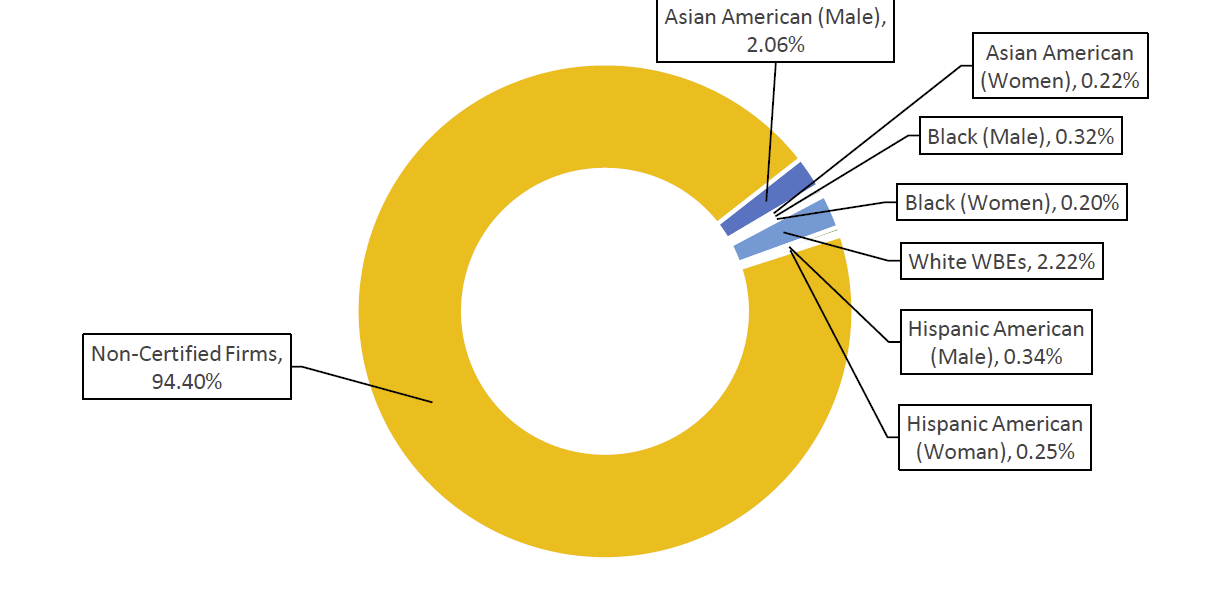
Table 89: Registered M/WBE NCSPs – FY20-22
| FY | Count | Total Value | AVG Value | Citywide AVG Value |
| FY20 | 0 | $0 | $0 | $79,27 |
| FY21 | 1 | $200,200 | $200,200 | $105,121 |
| FY22 | 10 | $4,178,330 | $417,833 | $134,907 |
| Grand Total | 11 | $4,378,530 | $398,048 | $104,232 |
Chart 67: Share of M/WBE Contracts Registered Late – FY20-22[35]
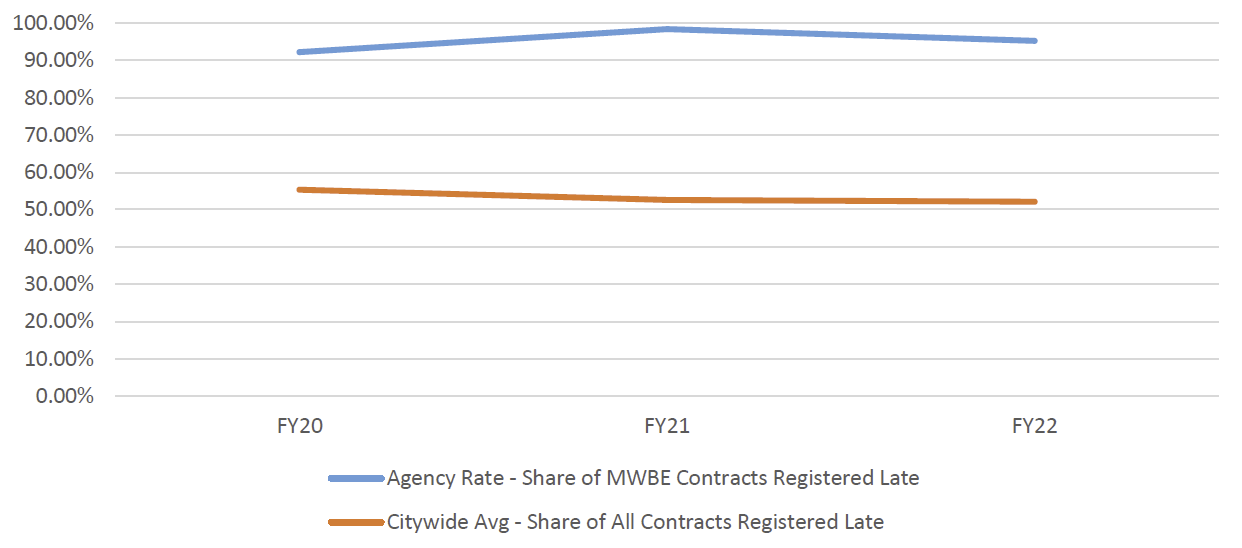
Chart 68: FY22 Contract and PO Value, by M/WBE Category and Industry
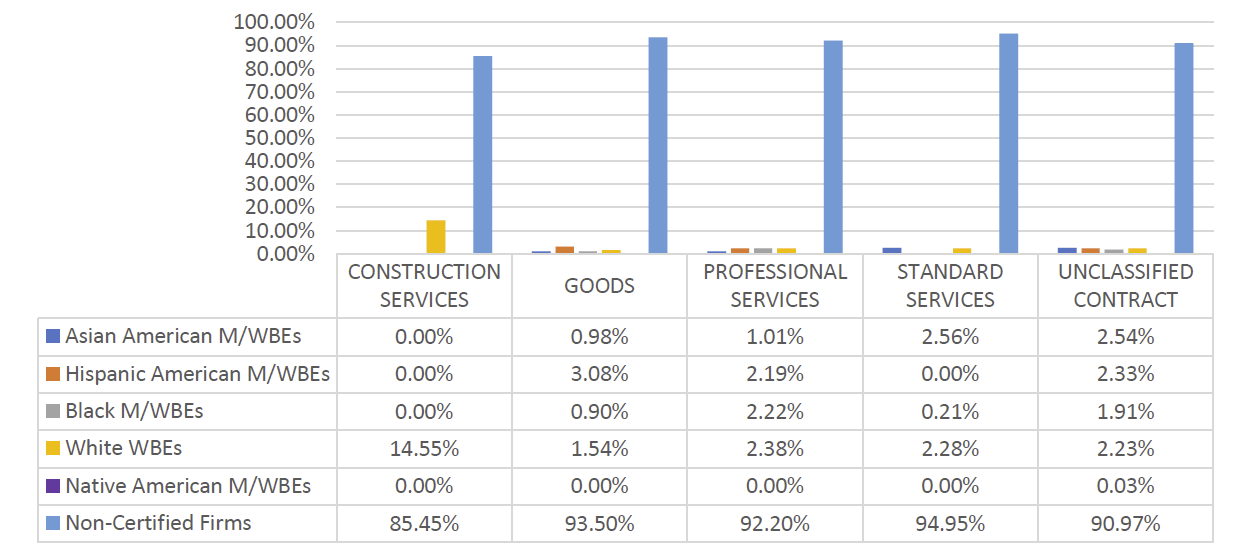
Table 90: LL 174-Eligible Prime Spend, FY20-22
| M/WBE Category | FY20 | FY21 | FY22 | |||
|---|---|---|---|---|---|---|
| Spend | % Share | Spend | % Share | Spend | % Share | |
| M/WBE ALL | $195,843,490 | 4.70% | $187,068,311 | 3.81% | $294,811,119 | 4.78% |
| Non-Certified | $3,970,291,277 | 95.30% | $4,726,100,145 | 96.19% | $5,875,608,114 | 95.22% |
| Total | $4,166,134,767 | 100.00% | $4,913,168,456 | 100.00% | $6,170,419,233 | 100.00% |
Department of Finance (DOF)
DOF registered 23 new contracts and 223 POs in FY22 (valuing nearly $13.5 million). The share of contract value and count registered to M/WBEs is lower than the Citywide average (7.43% and 37.8%, respectively). The share of LL 174-eligible prime spending with M/WBEs has remained relatively flat at around 10% since FY20. The share of LL 174-eligible spending with M/WBEs is at the highest levels since FY20 at nearly 15%.
Table 91: LL 174-Eligible Contracts and POs – FY20-22
| Certification Status | # of Contracts | % Share of Contracts | Total Registered Contract Value | % Share of Registered Contract Value |
| FY20 | 267 | N/A | $124,483,652 | N/A |
| Non-Certified | 138 | 51.69% | $120,713,703 | 96.97% |
| M/WBE | 129 | 48.31% | $3,769,949 | 3.03% |
| FY21 | 209 | N/A | $68,187,415 | N/A |
| Non-Certified | 134 | 64.11% | $65,075,707 | 95.44% |
| M/WBE | 75 | 35.89% | $3,111,707 | 4.56% |
| FY22 | 246 | N/A | $13,551,776 | N/A |
| Non-Certified | 153 | 62.20% | $12,544,654 | 92.57% |
| M/WBE | 93 | 37.80% | $1,007,121 | 7.43% |
| Grand Total | 722 | N/A | $206,222,845 | N/A |
Chart 69: FY22 Value of LL 174-Eligible Prime Contracts and POs
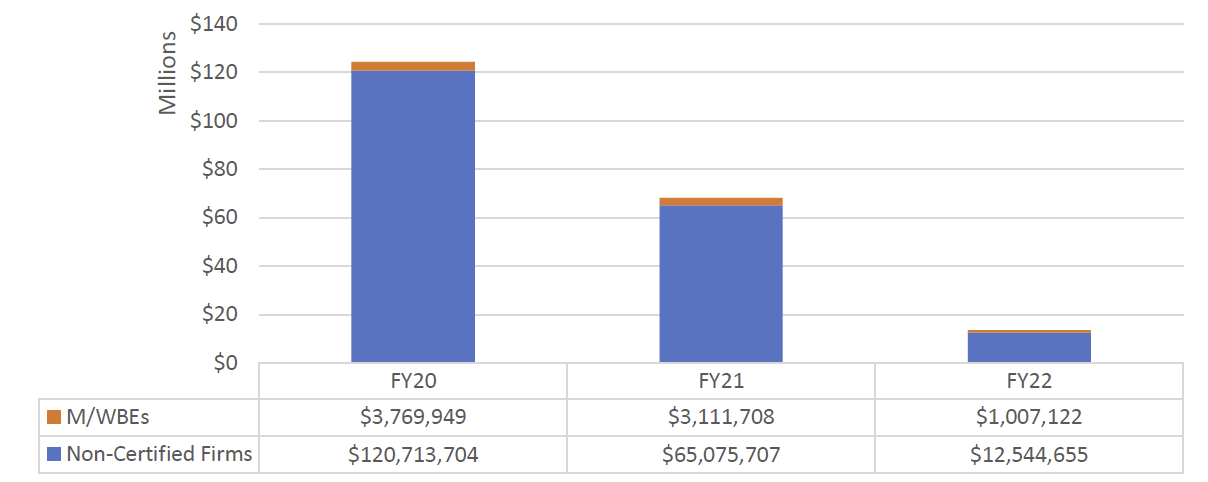
Chart 70: FY22 Value of LL 174-Eligible Contracts and POs, by Race and Gender
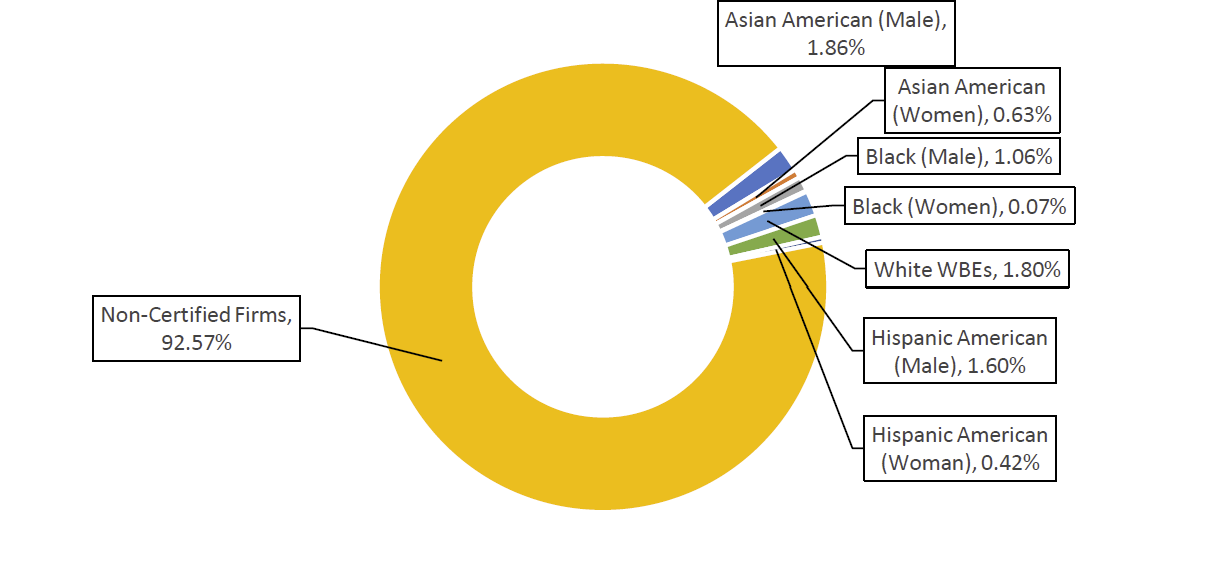
Table 92: Registered M/WBE NCSPs – FY20-22
| FY | Count | Total Value | AVG Value | Citywide AVG Value |
| FY20 | 19 | $1,437,859 | $75,677 | $79,27 |
| FY21 | 13 | $2,505,101 | $192,700 | $105,121 |
| FY22 | 13 | $1,008,929 | $77,610 | $134,907 |
| Grand Total | 45 | $4,951,889 | $110,042 | $104,232 |
Chart 71: Share of M/WBE Contracts Registered Late – FY20-22
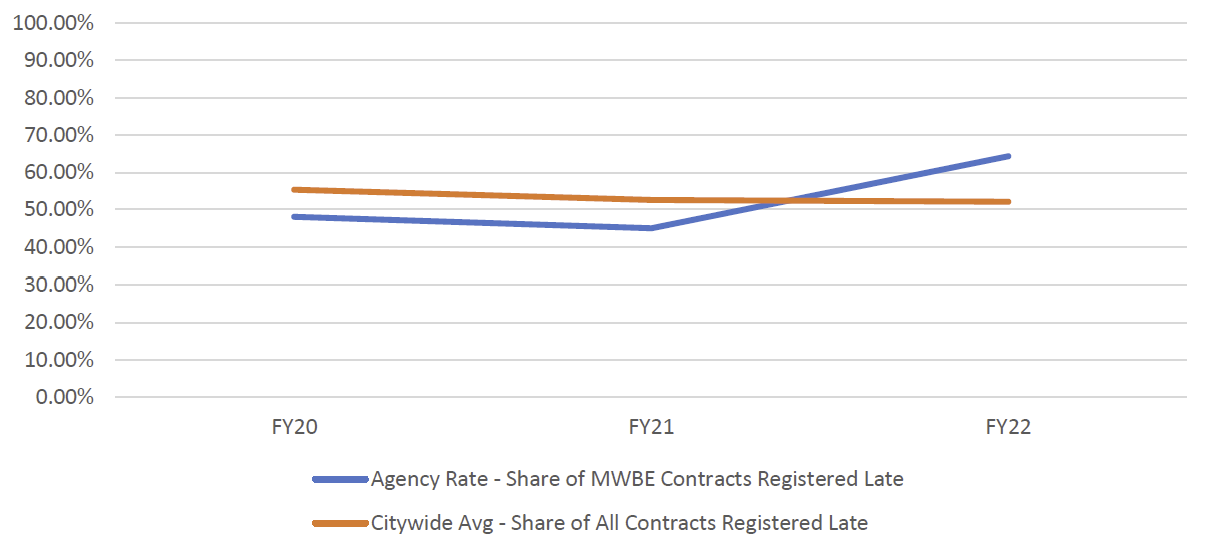
Chart 72: FY22 Contract and PO Value, by M/WBE Category and Industry
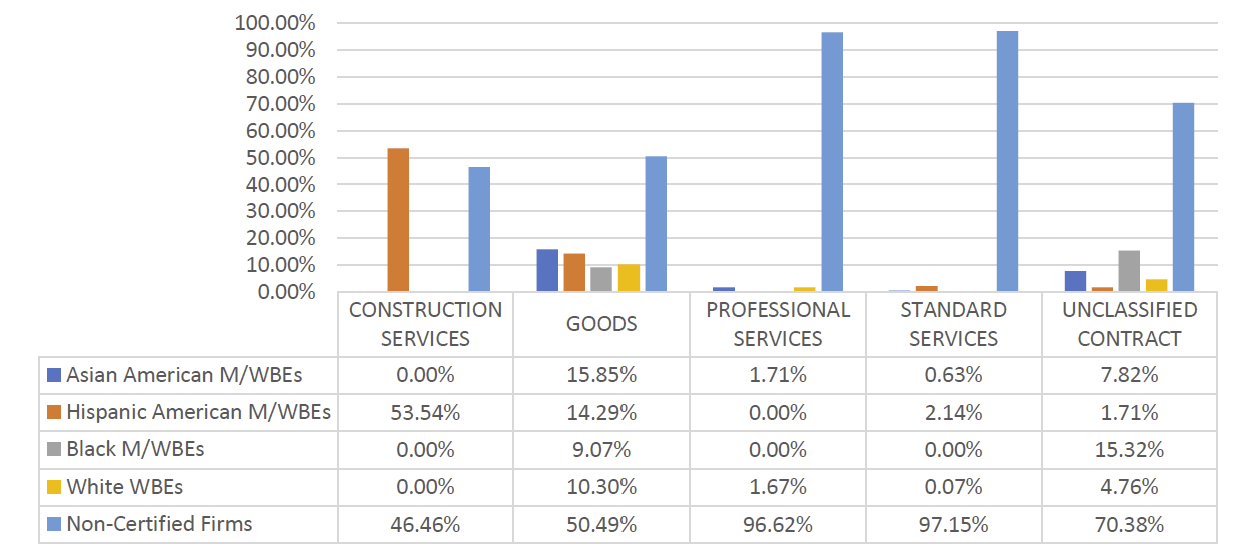
Table 93: LL 174-Eligible Approved Subcontracts – FY20-22
| Certification Status | # of Contracts | % Share of Contracts | Total Registered Contract Value | % Share of Registered Contract Value |
| FY20 | 19 | N/A | $42,497,087 | N/A |
| Sub – Non-Certified | 17 | 89.47% | $42,104,000 | 99.08% |
| Sub – M/WBE | 2 | 10.53% | $393,087 | 0.92% |
Table 94: LL 174-Eligible Prime Spend, FY20-22
| M/WBE Category | FY20 | FY21 | FY22 | |||
|---|---|---|---|---|---|---|
| Spend | % Share | Spend | % Share | Spend | % Share | |
| M/WBE ALL | $5,442,452 | 10.03% | $5,135,689 | 10.30% | $5,029,056 | 9.13% |
| Non-Certified | $48,834,839 | 89.97% | $44,738,446 | 89.70% | $50,042,699 | 90.87% |
| Total | $54,277,292 | 100.00% | $49,874,135 | 100.00% | $55,071,755 | 100.00% |
Table 95: LL 174-Eligible Sub Vendor Spend, FY20-22
| M/WBE Category | FY20 | FY21 | FY22 | |||
| Spend | % Share | Spend | % Share | Spend | % Share | |
|---|---|---|---|---|---|---|
| M/WBE ALL | $350,809 | 8.50% | $34,692 | 6.49% | $851,762 | 14.71% |
| Non-Certified | $3,776,685 | 91.50% | $499,927 | 93.51% | $4,937,724 | 85.29% |
| Total | $4,127,494 | 100.00% | $534,619 | 100.00% | $5,789,485 | 100.00% |
Department of Health and Mental Hygiene (DOHMH)
DOHMH predominantly contracts with vendors for human services, which are exempt from LL 174 participation goals. Therefore, the data included here represents a relatively small share of DOHMH’s total procurement portfolio. For these contracts, the share of value registered to M/WBEs was higher than the Citywide average (32.35%). DOHMH utilized the M/WBE NCSP method over 70 times, which is a slight decrease from prior fiscal years but nevertheless higher than most agencies. As is the case with most human services agencies, DOHMH has higher rates of retroactivity than the Citywide average, though this has improved slightly since FY21. The share of DOHMH’s LL 174-eligible spending with M/WBE prime vendors has held just under 30% since FY20. While the total value of LL 174-eligible spending with sub vendors is at its highest level since FY20, the relative share going to M/WBEs has declined since FY20.
Table 96: LL 174-Eligible Contracts and POs – FY20-22
| Certification Status | # of Contracts | % Share of Contracts | Total Registered Contract Value | % Share of Registered Contract Value |
| FY20 | 985 | N/A | $16,010,516 | N/A |
| Non-Certified | 572 | 58.07% | $6,928,735 | 43.28% |
| M/WBE | 413 | 41.93% | $9,081,781 | 56.72% |
| FY21 | 954 | N/A | $40,410,810 | N/A |
| Non-Certified | 535 | 56.08% | $29,877,216 | 73.93% |
| M/WBE | 419 | 43.92% | $10,533,593 | 26.07% |
| FY22 | 1,071 | N/A | $132,376,231 | N/A |
| Non-Certified | 558 | 52.10% | $89,546,809 | 67.65% |
| M/WBE | 513 | 47.90% | $42,829,422 | 32.35% |
| Grand Total | 3,010 | N/A | $188,797,558 | N/A |
Chart 73: FY22 Value of LL 174-Eligible Prime Contracts and POs
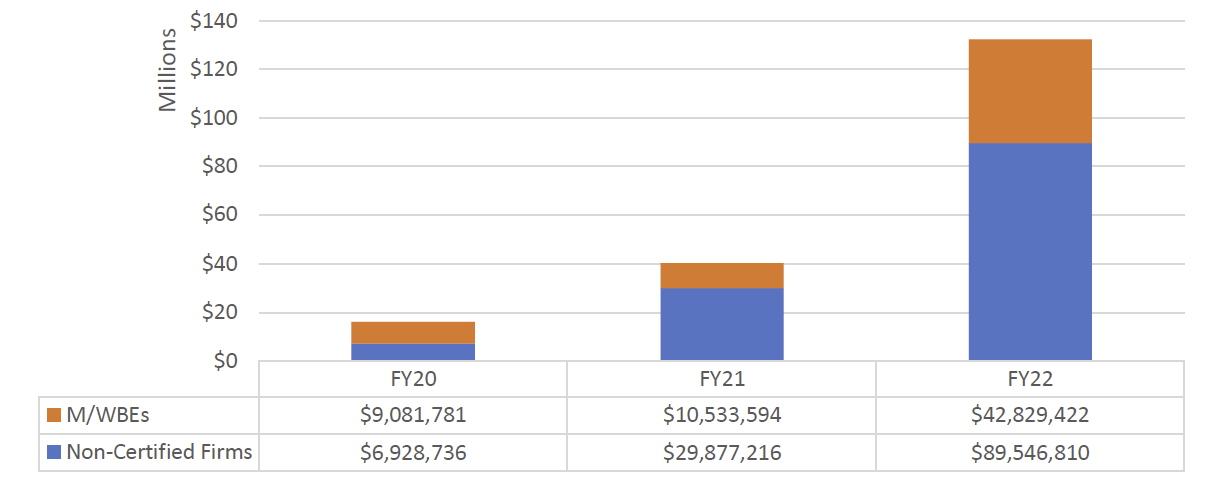
Chart 74: FY22 Value of LL 174-Eligible Contracts and POs, by Race and Gender
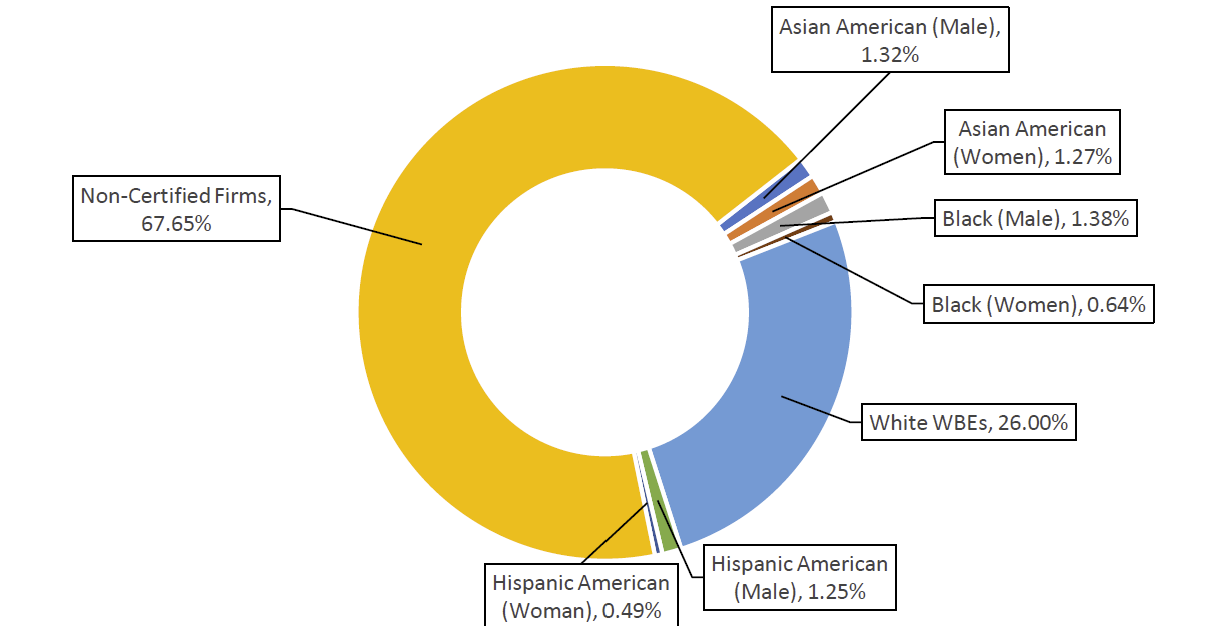
Table 97: Registered M/WBE NCSPs – FY20-22
| FY | Count | Total Value | AVG Value | Citywide AVG Value |
| FY20 | 108 | $7,179,761 | $66,479 | $79,27 |
| FY21 | 98 | $7,148,224 | $72,941 | $105,121 |
| FY22 | 73 | $8,170,499 | $111,925 | $134,907 |
| Grand Total | 279 | $22,498,484 | $80,640 | $104,232 |
Chart 75: Share of M/WBE Contracts Registered Late – FY20-22
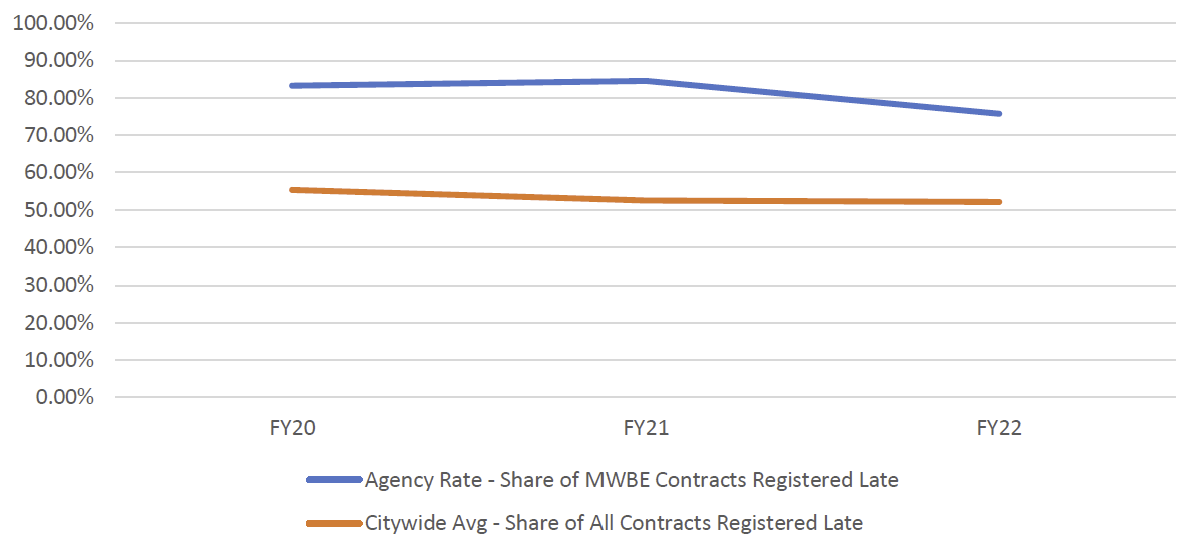
Chart 76: FY22 Contract and PO Value, by M/WBE Category and Industry
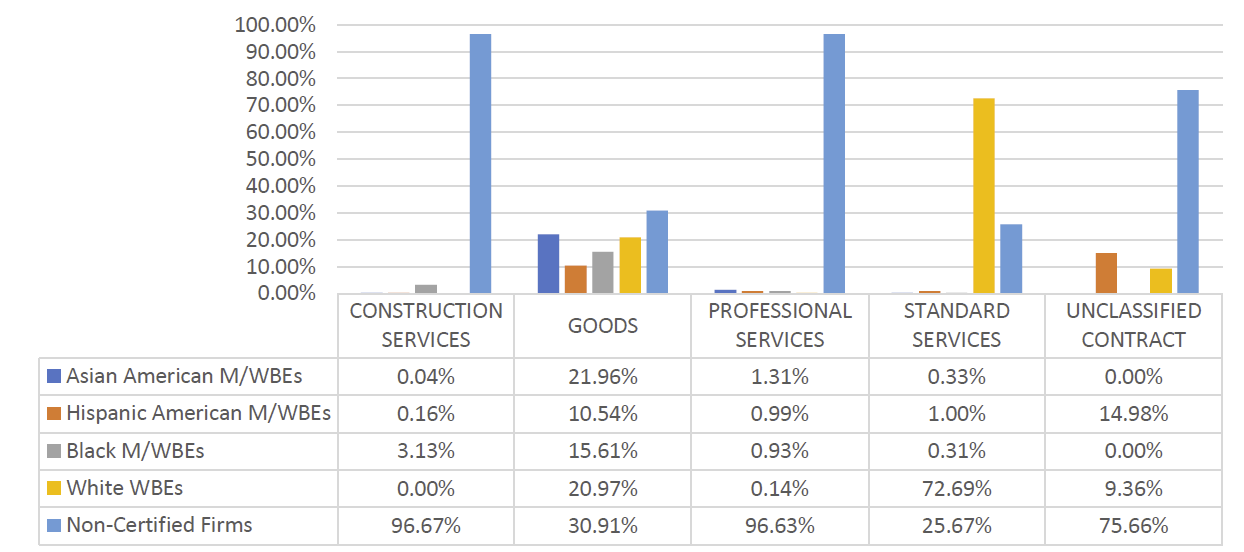
Table 98: LL 174-Eligible Approved Subcontracts – FY20-22
| Certification Status | # of Contracts | % Share of Contracts | Total Registered Contract Value | % Share of Registered Contract Value |
| FY20 | 4 | N/A | $373,357 | N/A |
| Sub – Non-Certified | 4 | 100.00% | $373,357 | 100.00% |
| FY21 | 8 | N/A | $2,067,892 | N/A |
| Sub – Non-Certified | 8 | 100.00% | $2,067,892 | 100.00% |
| FY22 | 238 | N/A | $21,699,511 | N/A |
| Sub – Non-Certified | 236 | 99.16% | $21,507,511 | 99.12% |
| Sub – M/WBE | 2 | 0.84% | $192,000 | 0.88% |
Table 99: LL 174-Eligible Prime Spend, FY20-22
| M/WBE Category | FY20 | FY21 | FY22 | |||
|---|---|---|---|---|---|---|
| Spend | % Share | Spend | % Share | Spend | % Share | |
| M/WBE ALL | $22,595,600 | 29.42% | $26,290,389 | 26.33% | $31,243,367 | 28.10% |
| Non-Certified | $54,201,811 | 70.58% | $73,577,418 | 73.67% | $79,961,337 | 71.90% |
| Total | $76,797,411 | 100.00% | $99,867,807 | 100.00% | $111,204,703 | 100.00% |
Table 100: LL 174-Eligible Sub Vendor Spend, FY20-22
| M/WBE Category | FY20 | FY21 | FY22 | |||
|---|---|---|---|---|---|---|
| Spend | % Share | Spend | % Share | Spend | % Share | |
| M/WBE ALL | $80,000 | 100.00% | $92,680 | 54.71% | $206,750 | 66.30% |
| Non-Certified | $0 | 0.00% | $76,728 | 45.29% | $105,069 | 33.70% |
| Total | $80,000 | 100.00% | $169,407 | 100.00% | $311,819 | 100.00% |
Department of Investigation (DOI)
DOI has a relatively small contracting portfolio, registering 14 new LL 174-eligible contracts and 149 POs in FY22 (valuing nearly $13.5 million). The share of LL 174-eligible contract value and count registered to M/WBEs is lower than the Citywide average (12.76% and 31.9%, respectively). DOI’s share of LL 174-eligible spending with M/WBEs has declined marginally each year since FY20, never surpassing 4%. There was no recorded LL 174-eligible subcontract spending since FY20. There were zero approved subcontractors in PIP for FY20, FY21, or FY22.
Table 101: LL 174-Eligible Contracts and POs – FY20-22
| Certification Status | # of Contracts | % Share of Contracts | Total Registered Contract Value | % Share of Registered Contract Value |
| FY20 | 233 | N/A | $7,590,125 | N/A |
| Non-Certified | 165 | 70.82% | $7,176,956 | 94.56% |
| M/WBE | 68 | 29.18% | $413,168 | 5.44% |
| FY21 | 165 | N/A | $2,105,405 | N/A |
| Non-Certified | 112 | 67.88% | $1,654,104 | 78.56% |
| M/WBE | 53 | 32.12% | $451,300 | 21.44% |
| FY22 | 163 | N/A | $4,559,070 | N/A |
| Non-Certified | 111 | 68.10% | $3,977,463 | 87.24% |
| M/WBE | 52 | 31.90% | $581,607 | 12.76% |
| Grand Total | 561 | N/A | $14,254,601 | N/A |
Chart 77: FY22 Value of LL 174-Eligible Prime Contracts and POs
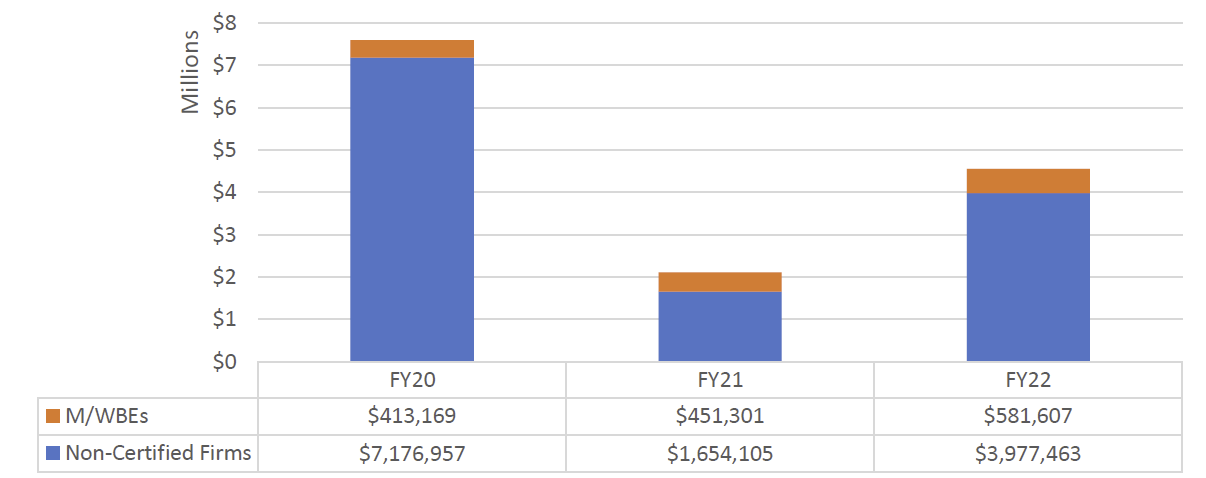
Chart 78: FY22 Value of LL 174-Eligible Contracts and POs, by Race and Gender
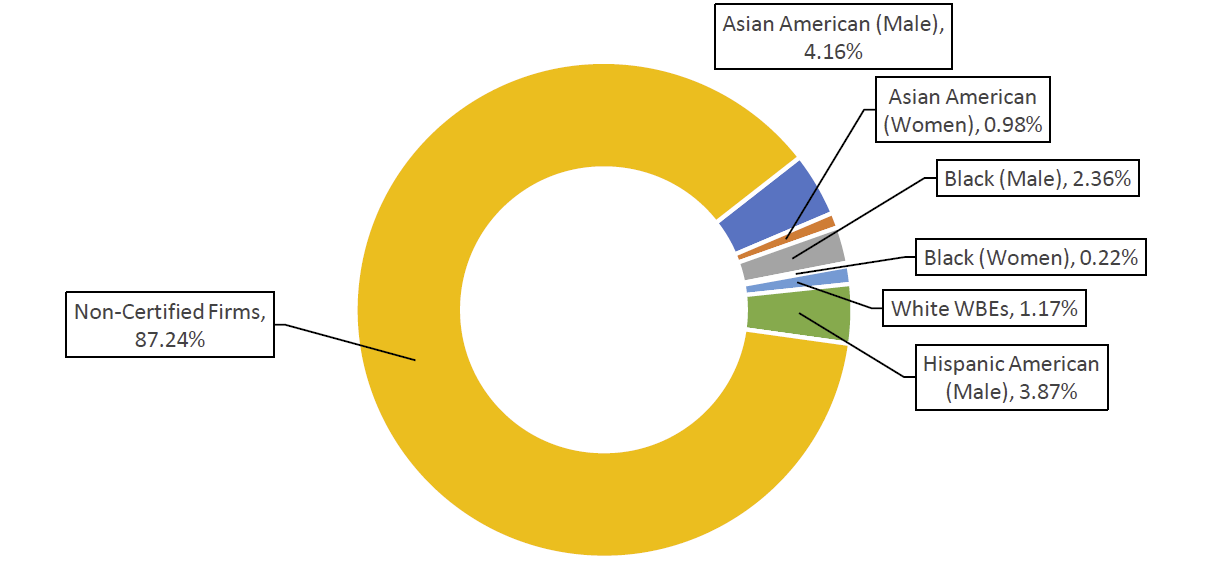
Table 102: Registered M/WBE NCSPs – FY20-22
| FY | Count | Total Value | AVG Value | Citywide AVG Value |
| FY20 | 0 | $0 | $0 | $79,27 |
| FY21 | 0 | $0 | $0 | $105,121 |
| FY22 | 3 | $176,192 | $58,731 | $134,907 |
| Grand Total | 3 | $176,192 | $58,731 | $104,232 |
Chart 79: Share of M/WBE Contracts Registered Late – FY20-22
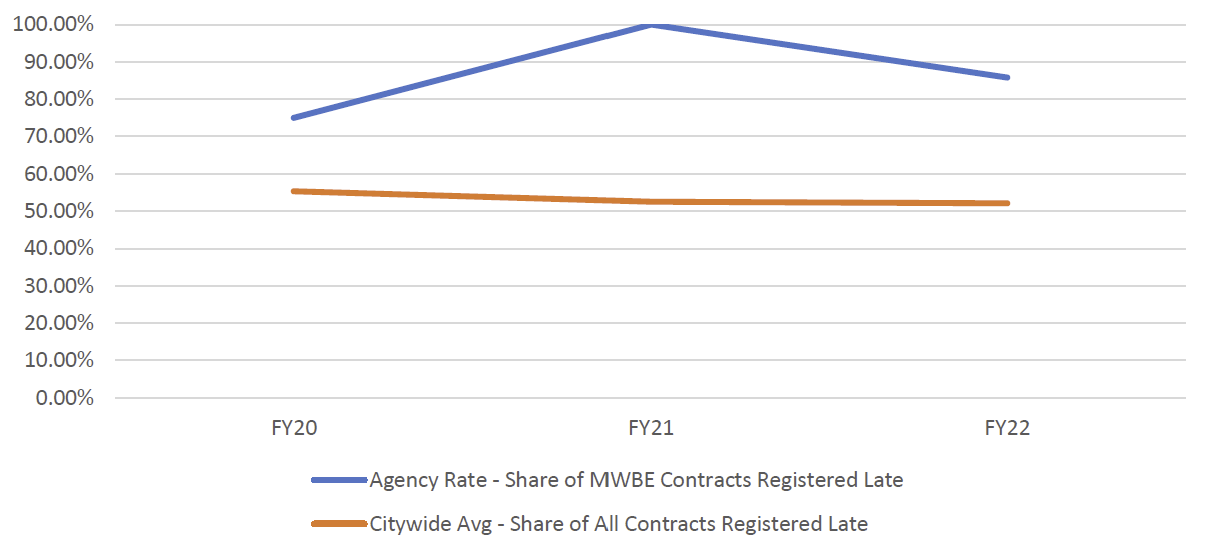
Chart 80: FY22 Contract and PO Value, by M/WBE Category and Industry
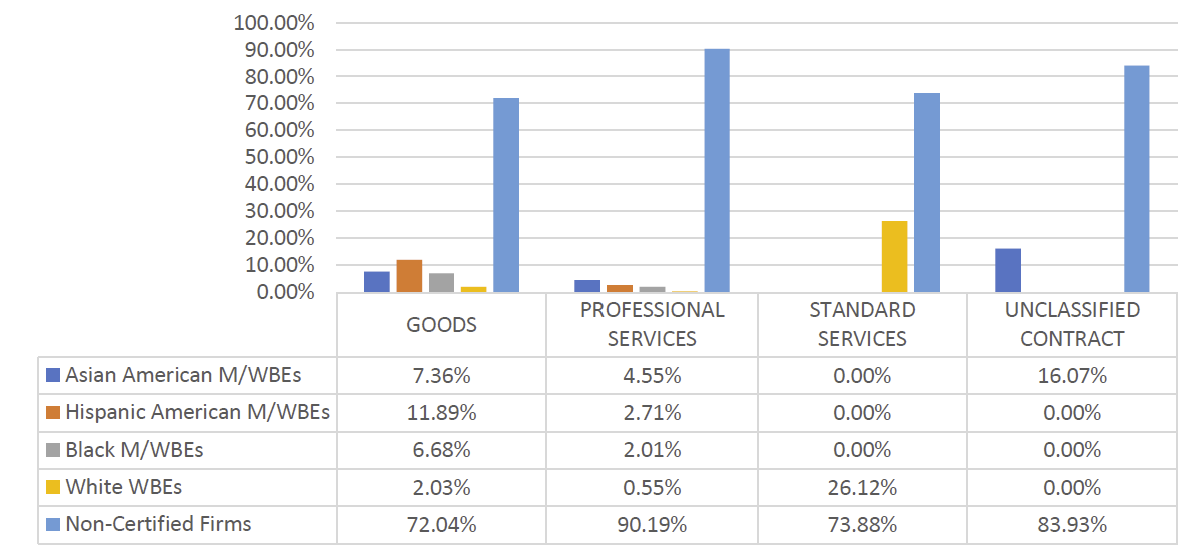
Table 103: LL 174-Eligible Prime Spend, FY20-22
| M/WBE Category | FY20 | FY21 | FY22 | |||
| Spend | % Share | Spend | % Share | Spend | % Share | |
|---|---|---|---|---|---|---|
| M/WBE ALL | $658,354 | 3.99% | $663,364 | 2.85% | $611,926 | 2.65% |
| Non-Certified | $15,828,264 | 96.01% | $22,603,469 | 97.15% | $22,505,616 | 97.35% |
| Total | $16,486,617 | 100.00% | $23,266,833 | 100.00% | $23,117,542 | 100.00% |
Department of Probation (DOP)
DOP predominantly contracts with vendors for human services, which are exempt from LL 174 participation goals. Therefore, the data included here represents a relatively small share of DOP’s total procurement portfolio. DOP registered six new contracts and 148 POs that were LL 174-eligible in FY22. Of these, the share of contract value registered to M/WBEs is higher than the Citywide average (28.89%). DOP utilized the M/WBE NCSP method only two times in FY22, in comparison to eight times in FY20. There were zero approved LL 174-eligible subcontractors in PIP for FY20, FY21, or FY22. The share of LL 174-eligible spending with M/WBEs has incrementally increased each year since FY20. There was no recorded LL 174-eligible subcontract spending since FY20.
Table 104: LL 174-Eligible Contracts and POs – FY20-22
| Certification Status | # of Contracts | % Share of Contracts | Total Registered Contract Value | % Share of Registered Contract Value |
| FY20 | 142 | N/A | $1,490,593 | N/A |
| Non-Certified | 112 | 78.87% | $868,794 | 58.29% |
| M/WBE | 30 | 21.13% | $621,798 | 41.71% |
| FY21 | 128 | N/A | $1,532,258 | N/A |
| Non-Certified | 100 | 78.13% | $624,540 | 40.76% |
| M/WBE | 28 | 21.88% | $907,717 | 59.24% |
| FY22 | 154 | N/A | $1,195,208 | N/A |
| Non-Certified | 113 | 73.38% | $849,895 | 71.11% |
| M/WBE | 41 | 26.62% | $345,312 | 28.89% |
| Grand Total | 424 | N/A | $4,218,061 | N/A |
Chart 81: FY22 Value of LL 174-Eligible Prime Contracts and POs
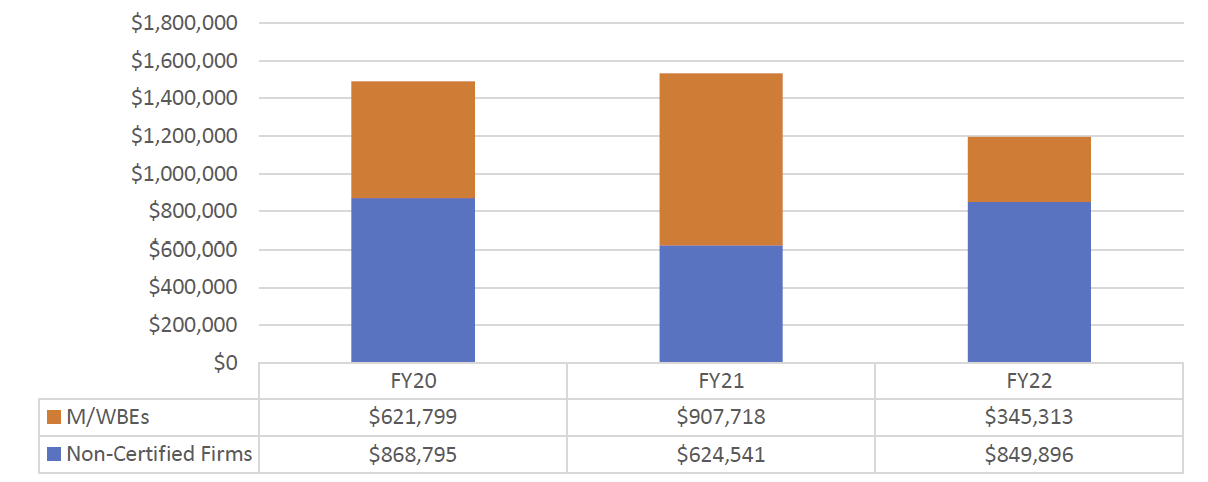
Chart 82: FY22 Value of LL 174-Eligible Contracts and POs, by Race and Gender
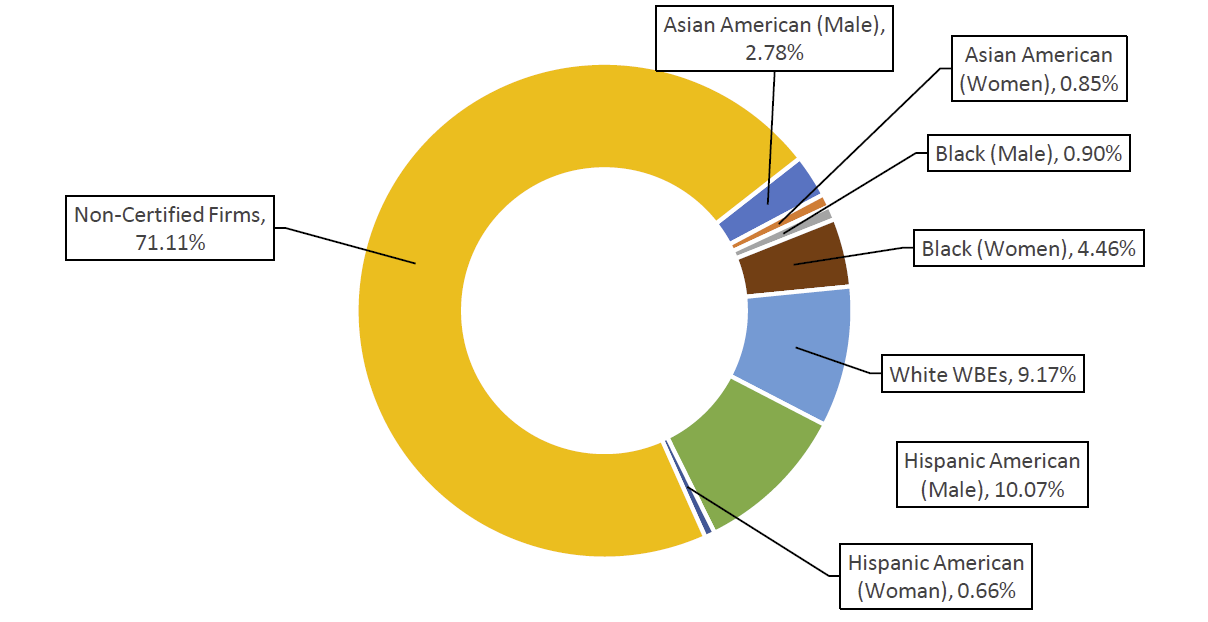
Table 105: Registered M/WBE NCSPs – FY20-22
| FY | Count | Total Value | AVG Value | Citywide AVG Value |
| FY20 | 8 | $489,126 | $61,141 | $79,27 |
| FY21 | 7 | $742,752 | $106,107 | $105,121 |
| FY22 | 2 | $103,935 | $51,968 | $134,907 |
| Grand Total | 17 | $1,335,813 | $78,577 | $104,232 |
Chart 83: Share of M/WBE Contracts Registered Late – FY20-22
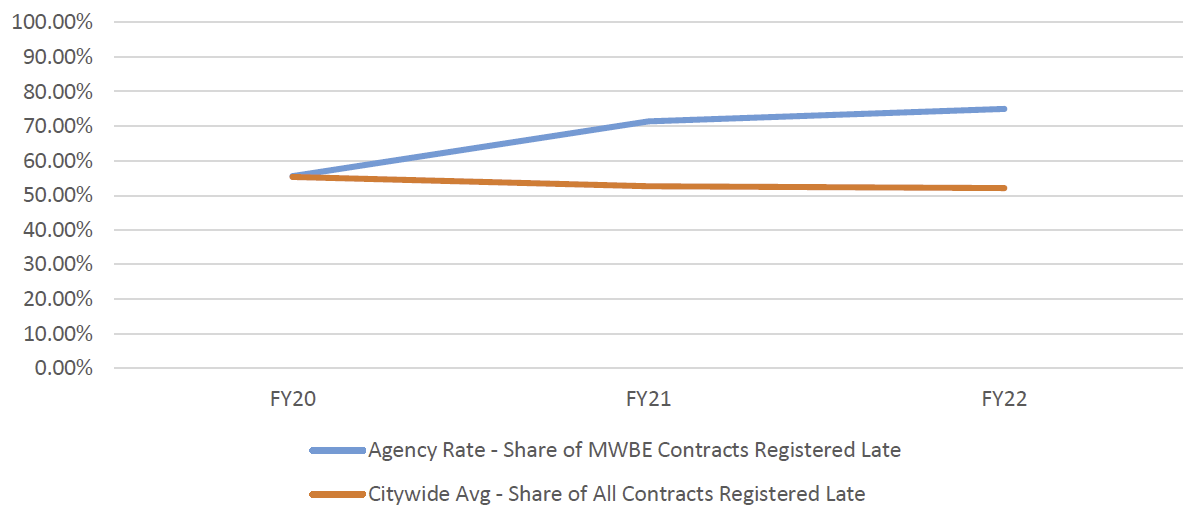
Chart 84: FY22 Contract and PO Value, by M/WBE Category and Industry
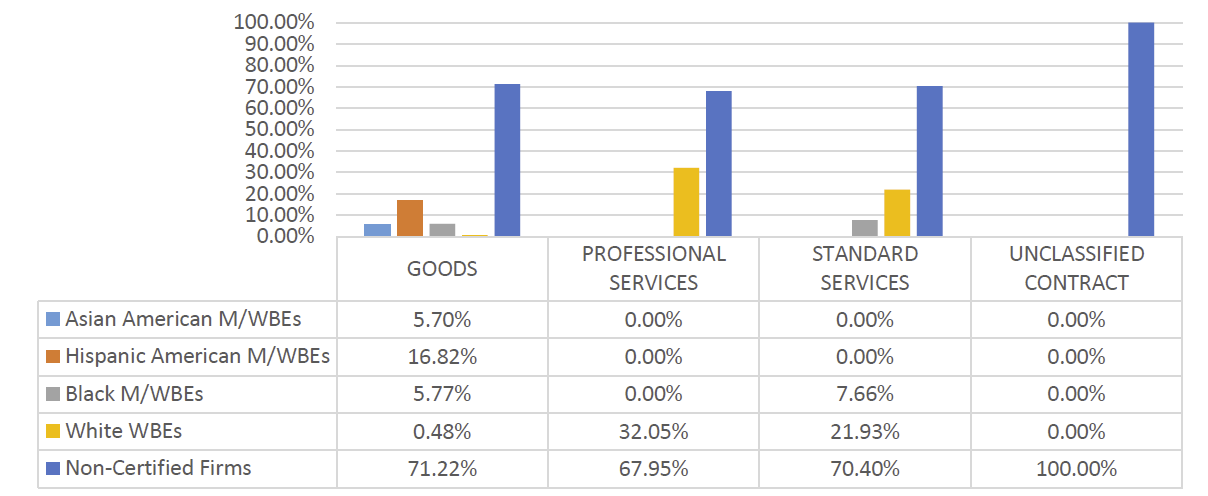
Table 106: LL 174-Eligible Prime Spend, FY20-22
|
M/WBE Category |
FY20 | FY21 | FY22 | |||
| Spend | % Share | Spend | % Share | Spend | % Share | |
|---|---|---|---|---|---|---|
| M/WBE ALL | $870,554 | 17.14% | $595,342 | 18.27% | $746,484 | 20.20% |
| Non-Certified | $4,208,672 | 82.86% | $2,662,543 | 81.73% | $2,948,098 | 79.80% |
| Total | $5,079,226 | 100.00% | $3,257,885 | 100.00% | $3,694,582 | 100.00% |
Department of Records and Information Services (DORIS)
DORIS has a small contracting portfolio, registering four new LL 174-eligible contracts and 111 POs in FY22 (valuing about $800,000). Though small, the share of contract value registered to M/WBEs is higher than the Citywide average (33.42%) – most of the value was registered to businesses owned by white women and Asian American males. DORIS’ share of LL 174-eligible spending with M/WBEs is at its highest level since FY20, at over 45%. The value of LL 174-eligible spending with M/WBE subcontractors is almost equivalent to prime spend since FY21. There were two approved subcontractors for LL 174-eligible contracts in PIP for FY20, FY21, or FY22 – both were non-certified firms.
Table 107: LL 174-Eligible Contracts and POS – FY20-22
| Certification Status | # of Contracts | % Share of Contracts | Total Registered Contract Value | % Share of Registered Contract Value |
| FY20 | 110 | N/A | $660,950 | N/A |
| Non-Certified | 77 | 70.00% | $498,156 | 75.37% |
| M/WBE | 33 | 30.00% | $162,794 | 24.63% |
| FY21 | 79 | N/A | $1,844,961 | N/A |
| Non-Certified | 63 | 79.75% | $1,670,266 | 90.53% |
| M/WBE | 16 | 20.25% | $174,694 | 9.47% |
| FY22 | 115 | N/A | $804,943 | N/A |
| Non-Certified | 91 | 79.13% | $535,894 | 66.58% |
| M/WBE | 24 | 20.87% | $269,049 | 33.42% |
| Grand Total | 304 | N/A | $3,310,856 | N/A |
Chart 85: FY22 Value of LL 174-Eligible Prime Contracts and POs
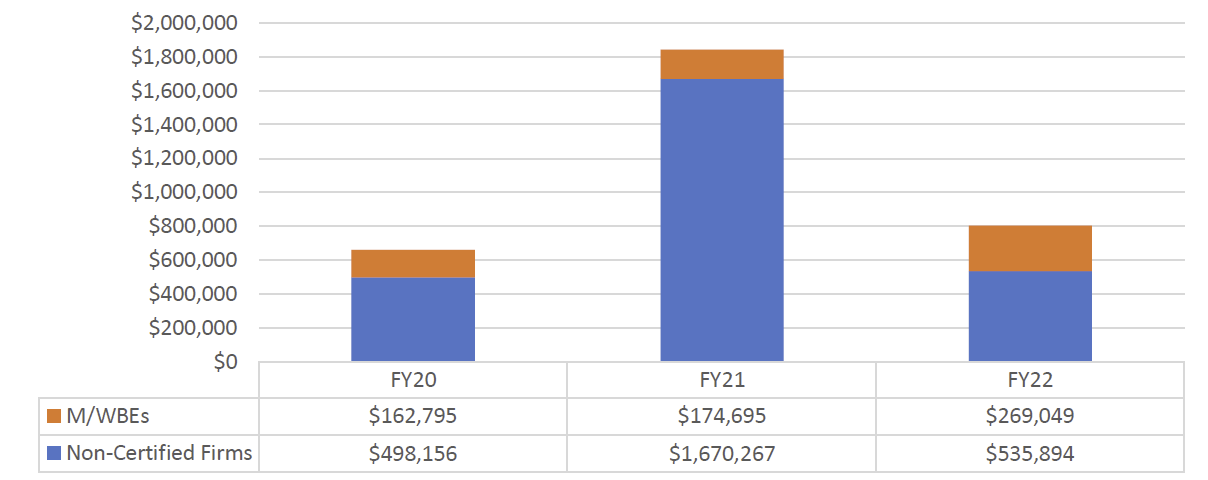
Chart 86: FY22 Value of LL 174-Eligible Contracts and POs, by Race and Gender
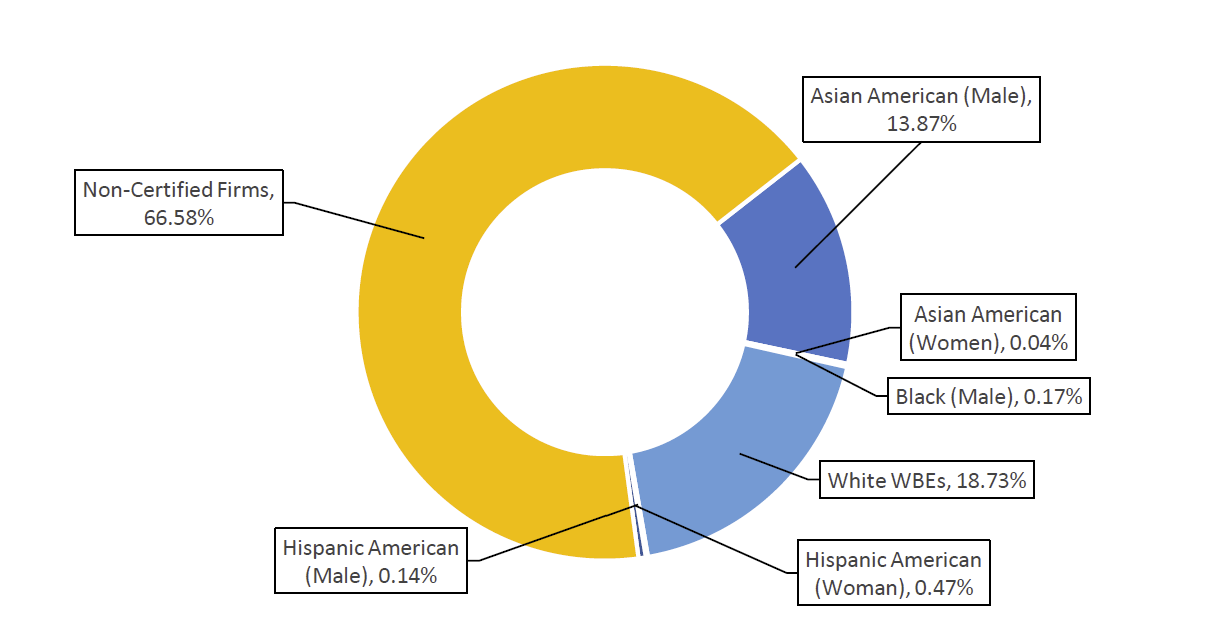
Table 108: Registered M/WBE NCSPs – FY20-22
| FY | Count | Total Value | AVG Value | Citywide Average Value |
| FY20 | 2 | $50,788 | $25,394 | $79,27 |
| FY21 | 3 | $107,498 | $35,833 | $105,121 |
| FY22 | 4 | $195,854 | $48,964 | $134,907 |
| Grand Total | 9 | $354,140 | $39,349 | $104,232 |
Chart 87: Share of M/WBE Contracts Registered Late – FY20-22 –
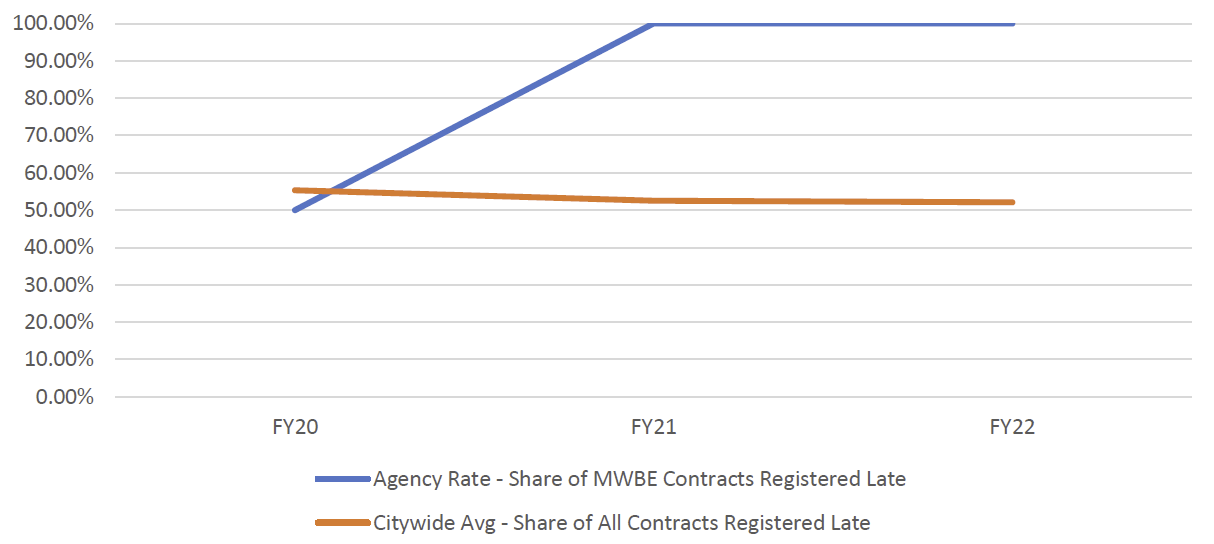
Chart 88: FY22 Contract and PO Value, by M/WBE Category and Industry
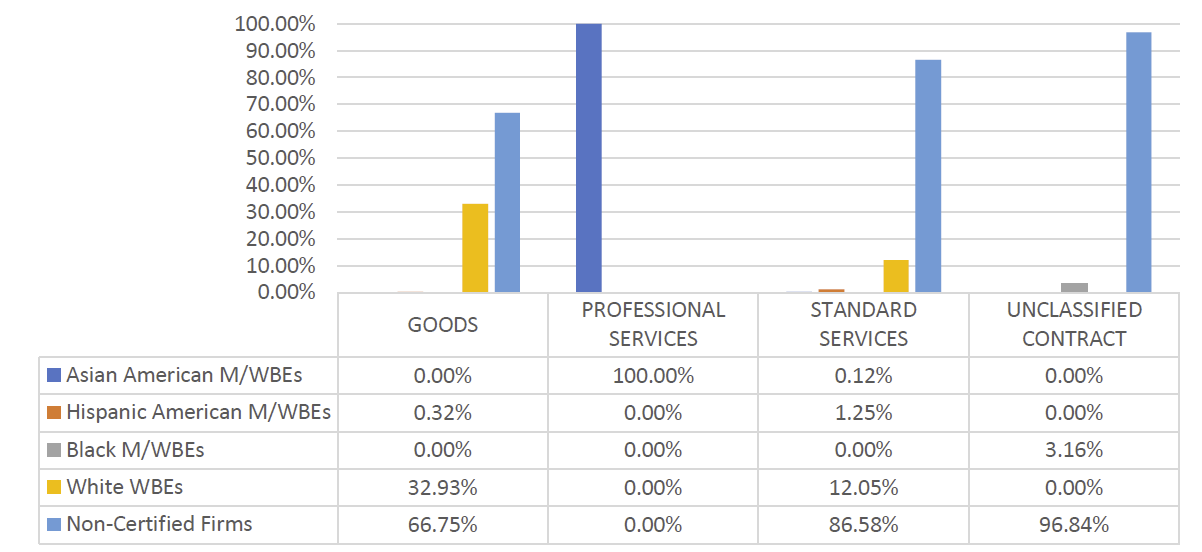
Table 109: LL 174-Eligible Approved Subcontracts – FY20-22
| Certification Status | # of Contracts | % Share of Contracts | Total Registered Contract Value | % Share of Registered Contract Value |
| FY21 | 2 | N/A | $1,300,000 | N/A |
| Sub – Non-Certified | 2 | 100.00% | $1,300,000 | 100.00% |
Table 110: LL 174-Eligible Prime Spend, FY20-22
| M/WBE Category | FY20 | FY21 | FY22 | |||
|---|---|---|---|---|---|---|
| Spend | % Share | Spend | % Share | Spend | % Share | |
| M/WBE ALL | $401,714 | 43.63% | $151,775 | 11.21% | $587,031 | 45.27% |
| Non-Certified | $519,052 | 56.37% | $1,202,019 | 88.79% | $709,760 | 54.73% |
| Total | $920,766 | 100.00% | $1,353,795 | 100.00% | $1,296,791 | 100.00% |
Table 111: LL 174-Eligible Sub Vendor Spend, FY20-22
| M/WBE Category | FY20 | FY21 | FY22 | |||
|---|---|---|---|---|---|---|
| Spend | % Share | Spend | % Share | Spend | % Share | |
| M/WBE ALL | $0 | N/A | $385,610 | 100.00% | $548,492 | 100.00% |
| Non-Certified | $0 | N/A | $0 | 0.00% | $0 | 0.00% |
| Total | $0 | 100.00% | $385,610 | 100.00% | $548,492 | 100.00% |
Department of Transportation (DOT)
DOT has one of the largest procurement portfolios in the City, a large portion of which are exempt from LL 174 participation goals. In FY22, DOT procured some of the highest value contracts across the City, which tend to be CSBs and CSPs given that DOT heavily procures for construction and construction-related services. The data included here represents a very small share of DOT’s total procurement portfolio. Though the count of these contracts registered to M/WBEs is relatively consistent with the Citywide average, the share of contract value is lower (11%). Most of DOT’s M/WBE contracts were registered for Goods purchases. DOT is in the top 5 agencies for the count of contracts registered utilizing the M/WBE NCSP method (63 times in FY22), though the average value of these contracts is lower than the Citywide average.
The value of LL 174-eligible spending with M/WBEs at DOT has declined in FY22 relative to previous years. The share of LL 174-eligible spending with M/WBE primes has been under 10% each year since FY20 but DOT has directed more than half of subcontract spending with M/WBEs each year during this period.
Table 112: LL 174-Eligible Contracts and POS – FY20-22
| Certification Status | # of Contracts | % Share of Contracts | Total Registered Contract Value | % Share of Registered Contract Value |
| FY20 | 632 | N/A | $639,593,680 | N/A |
| Non-Certified | 364 | 57.59% | $612,814,507 | 95.81% |
| M/WBE | 268 | 42.41% | $26,779,172 | 4.19% |
| FY21 | 510 | N/A | $398,888,146 | N/A |
| Non-Certified | 255 | 50.00% | $371,340,929 | 93.09% |
| M/WBE | 255 | 50.00% | $27,547,217 | 6.91% |
| FY22 | 707 | N/A | $432,734,073 | N/A |
| Non-Certified | 384 | 54.31% | $386,766,619 | 89.38% |
| M/WBE | 323 | 45.69% | $45,967,453 | 10.62% |
| Grand Total | 1,849 | N/A | $1,471,215,899 | N/A |
Chart 89: FY22 Value of LL 174-Eligible Prime Contracts and POs
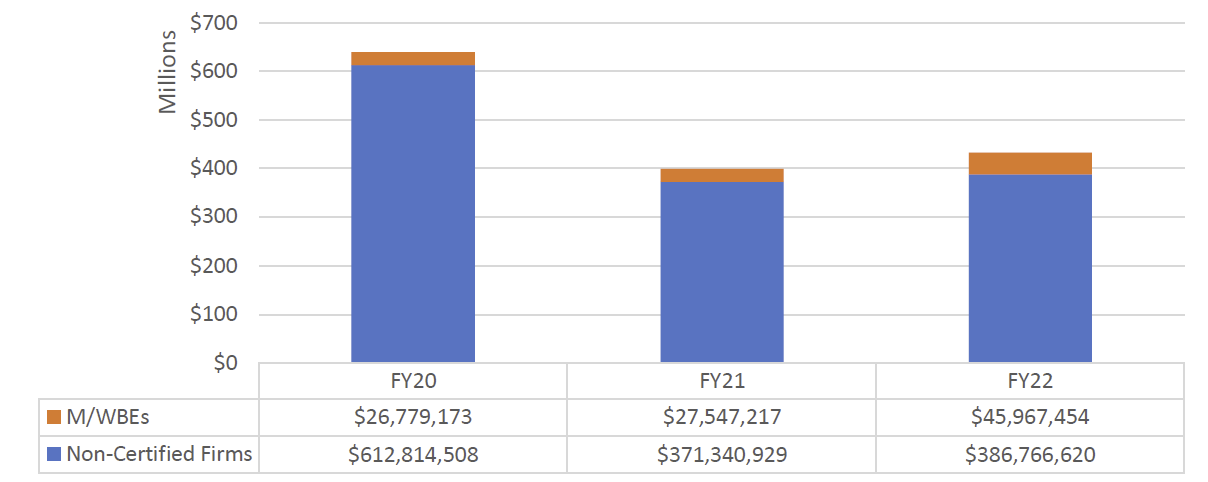
Chart 90: FY22 Value of LL 174-Eligible Contracts and POs, by Race and Gender
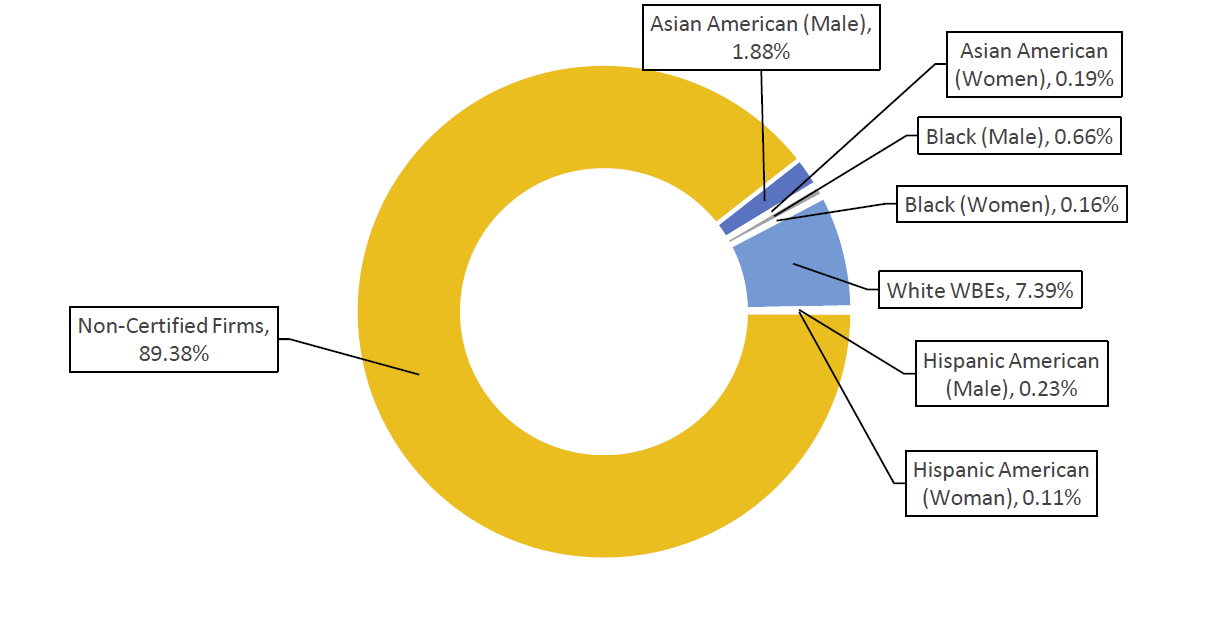
Table 113: Registered M/WBE NCSPs – FY20-22
| FY | Count | Total Value | AVG Value | Citywide AVG Value |
| FY20 | 65 | $5,817,032 | $89,493 | $79,27 |
| FY21 | 44 | $3,887,964 | $88,363 | $105,121 |
| FY22 | 63 | $7,784,673 | $123,566 | $134,907 |
| Grand Total | 172 | $17,489,669 | $101,684 | $104,232 |
Chart 91: Share of M/WBE Contracts Registered Late – FY20-22
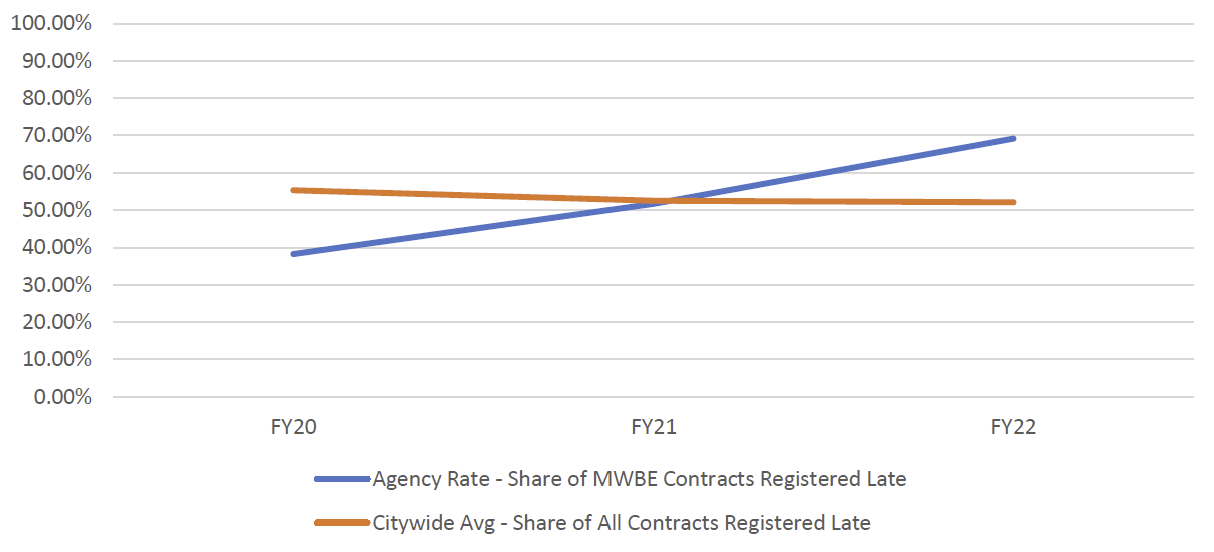
Chart 92: FY22 Contract and PO Value, by M/WBE Category and Industry
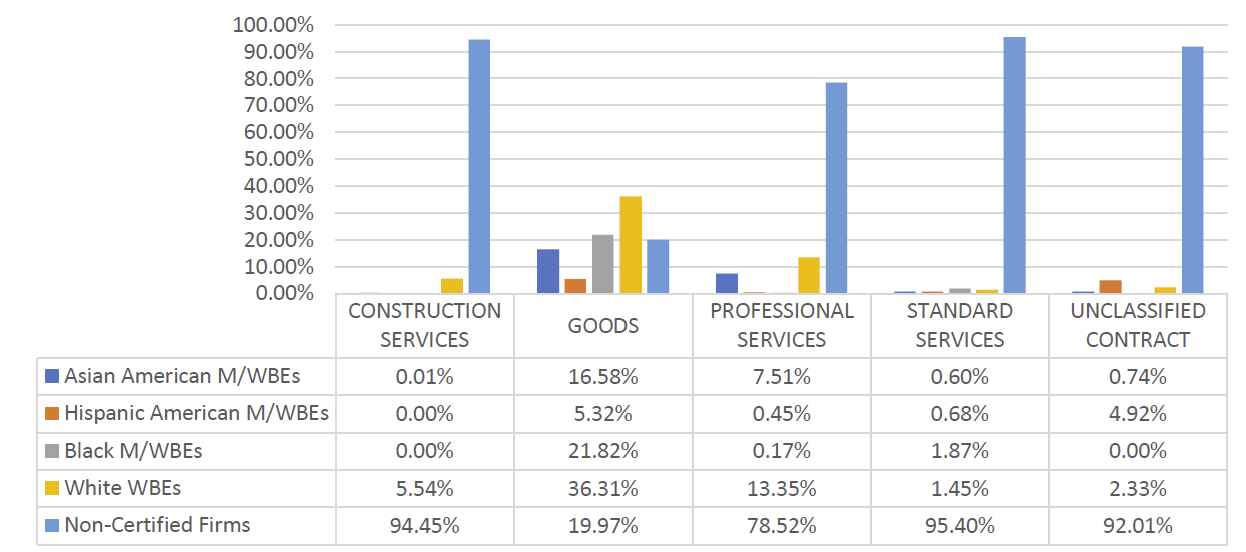
Table 114: LL 174-Eligible Approved Subcontracts – FY20-22
| Certification Status | # of Contracts | % Share of Contracts | Total Registered Contract Value | % Share of Registered Contract Value |
| FY20 | 165 | N/A | $162,340,052 | N/A |
| Sub – Non-Certified | 158 | 95.76% | $161,647,589 | 99.57% |
| Sub – M/WBE | 7 | 4.24% | $692,463 | 0.43% |
| FY21 | 143 | N/A | $95,724,903 | N/A |
| Sub – Non-Certified | 138 | 96.50% | $94,177,814 | 98.38% |
| Sub – M/WBE | 5 | 3.50% | $1,547,089 | 1.62% |
| FY22 | 88 | N/A | $36,911,768 | N/A |
| Sub – Non-Certified | 78 | 88.64% | $35,657,151 | 96.60% |
| Sub – M/WBE | 10 | 11.36% | $1,254,617 | 3.40% |
Table 115: LL 174-Eligible Prime Spend, FY20-22
| FY20 | FY21 | FY22 | ||||
|---|---|---|---|---|---|---|
| M/WBE Category | Spend | % Share | Spend | % Share | Spend | % Share |
| M/WBE ALL | $98,657,812 | 9.28% | $80,867,285 | 7.50% | $65,477,322 | 7.46% |
| Non-Certified | $964,143,906 | 90.72% | $997,220,065 | 92.50% | $812,192,242 | 92.54% |
| Total | $1,062,801,718 | 100.00% | $1,078,087,350 | 100.00% | $877,669,564 | 100.00% |
Table 116: LL 174-Eligible Sub Vendor Spend, FY20-22
| FY20 | FY21 | FY22 | ||||
|---|---|---|---|---|---|---|
| M/WBE Category | Spend | % Share | Spend | % Share | Spend | % Share |
| M/WBE ALL | $19,316,761 | 52.62% | $16,742,429 | 61.66% | $7,965,059 | 60.35% |
| Non-Certified | $17,393,801 | 47.38% | $10,410,786 | 38.34% | $5,234,038 | 39.65% |
| Total | $36,710,562 | 100.00% | $27,153,215 | 100.00% | $13,199,098 | 100.00% |
Department of Parks and Recreation (DPR)
DPR has a very large procurement portfolio, including many purchases for high-value contracts for Renewals, Sole Source, and Government-to-Government procurements that are exempt from LL 174 participation goals. The data included here, therefore, represents only a small share of DPR’s procurements. Still, DPR procured over $541 million in LL 174-eligible contracts in FY22- which is nearly double the value from FY21. The share of this contract value that was registered to M/WBEs is higher than the Citywide average (35%). DPR registered a higher percentage of contract value to Hispanic American MBEs than most agencies (19%), mostly for Goods and Standard Services. DPR utilized the M/WBE NCSP method more often than most agencies (50), with a higher average value than most agencies ($142,539).
The share of LL 174-eligible spending with prime M/WBEs at DPR has remained general steady since FY20, hovering around 20%. While M/WBE sub vendors received the largest value of LL 174-eligible spending in FY22 since FY20, the share of total sub vendor spending declined slightly from FY21 levels to 60.11%.
Table 117: LL 174-Eligible Contracts and POS – FY20-22
| Certification Status | # of Contracts | % Share of Contracts | Total Registered Contract Value | % Share of Registered Contract Value |
| FY20 | 1,831 | N/A | $416,009,240 | N/A |
| Non-Certified | 1,080 | 58.98% | $296,649,601 | 71.31% |
| M/WBE | 751 | 41.02% | $119,359,639 | 28.69% |
| FY21 | 1,111 | N/A | $241,873,563 | N/A |
| Non-Certified | 602 | 54.19% | $194,968,596 | 80.61% |
| M/WBE | 509 | 45.81% | $46,904,967 | 19.39% |
| FY22 | 1,872 | N/A | $541,361,474 | N/A |
| Non-Certified | 1,072 | 57.26% | $351,554,941 | 64.94% |
| M/WBE | 800 | 42.74% | $189,806,532 | 35.06% |
| Grand Total | 4,814 | N/A | $1,199,244,279 | N/A |
Chart 93: FY22 Value of LL 174-Eligible Prime Contracts and POs
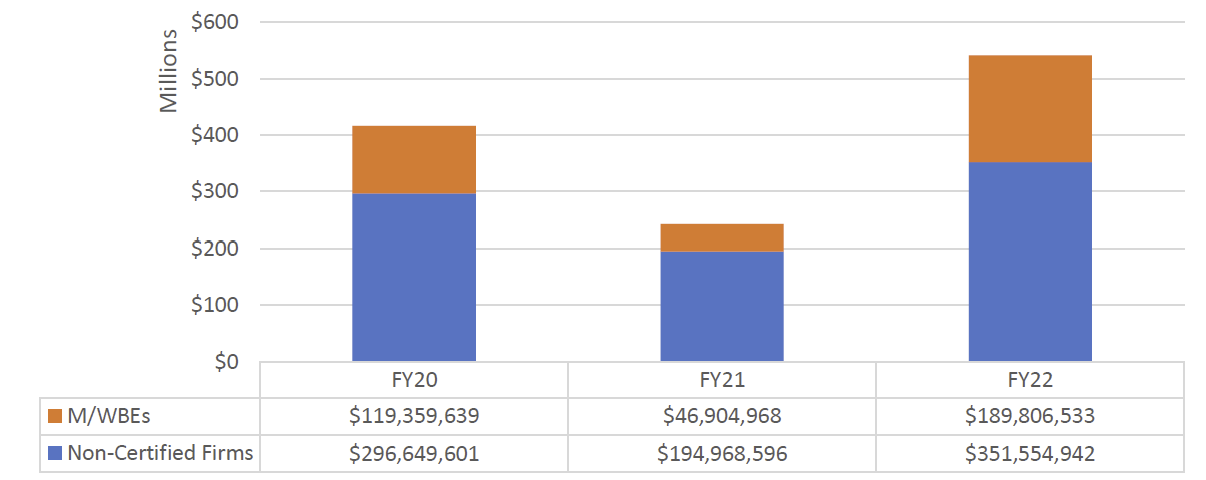
Chart 94: FY22 Value of LL 174-Eligible Contracts and POs, by Race and Gender
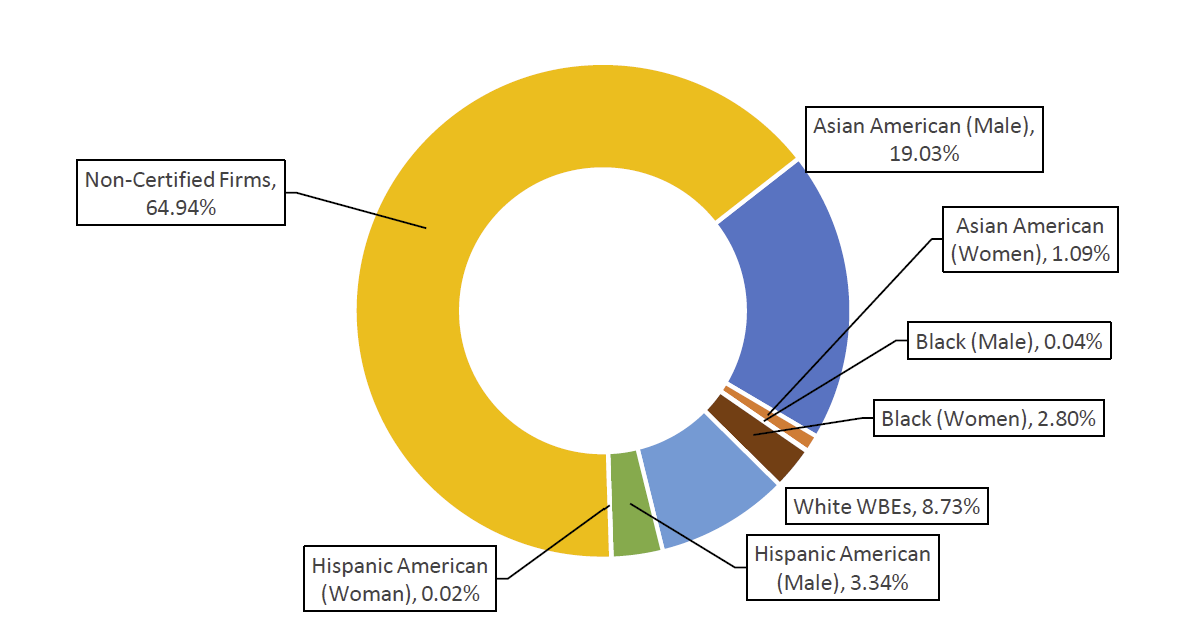
Table 118: Registered M/WBE NCSPs – FY20-22
| FY | Count | Total Value | AVG Value | Citywide AVG Value |
| FY20 | 29 | $1,755,679 | $60,541 | $79,27 |
| FY21 | 44 | $6,434,621 | $146,241 | $105,121 |
| FY22 | 50 | $7,126,971 | $142,539 | $134,907 |
| Grand Total | 123 | $15,317,271 | $124,531 | $104,232 |
Chart 95: Share of M/WBE Contracts Registered Late – FY20-22
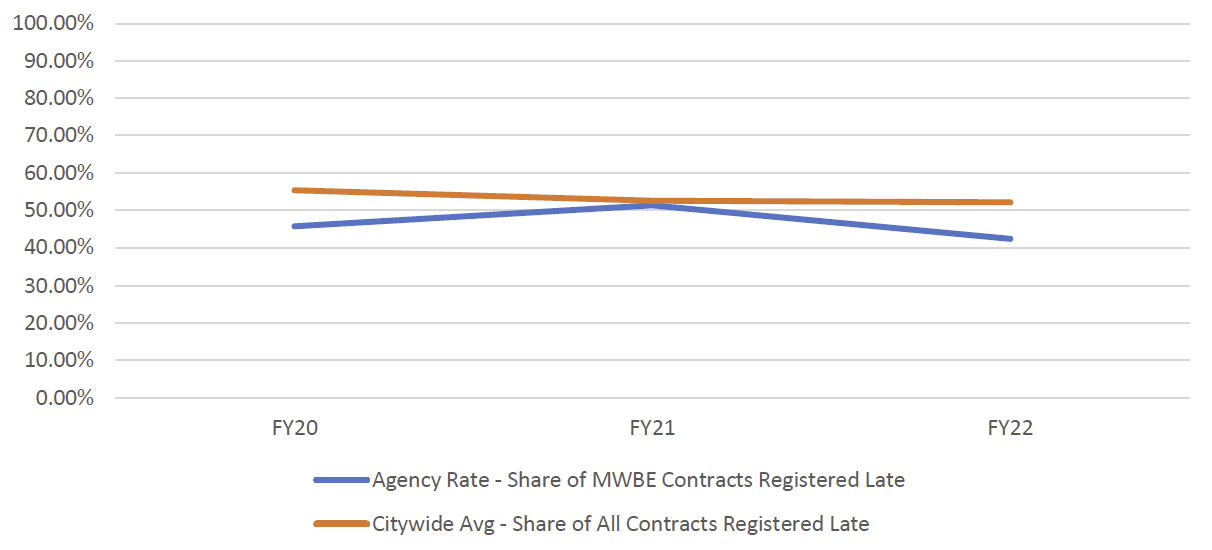
Chart 96: FY22 Contract and PO Value, by M/WBE Category and Industry
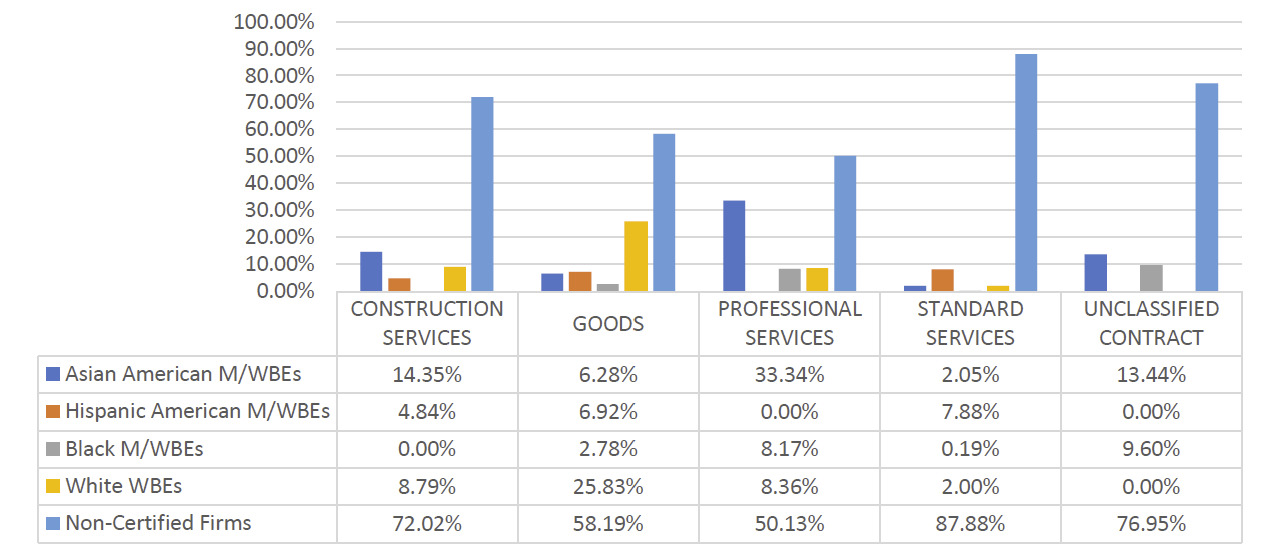
Table 119: LL 174-Eligible Approved Subcontracts – FY20-22
| Certification Status | # of Contracts | % Share of Contracts | Total Registered Contract Value | % Share of Registered Contract Value |
| FY20 | 1,061 | N/A | $135,630,925 | N/A |
| Sub – Non-Certified | 740 | 69.75% | $111,923,062 | 82.52% |
| Sub – M/WBE | 321 | 30.25% | $23,707,863 | 17.48% |
| FY21 | 535 | N/A | $74,124,233 | N/A |
| Sub – Non-Certified | 394 | 73.64% | $66,952,778 | 90.33% |
| Sub – M/WBE | 141 | 26.36% | $7,171,455 | 9.67% |
| FY22 | 909 | N/A | $116,534,880 | N/A |
| Sub – Non-Certified | 625 | 68.76% | $103,590,007 | 88.89% |
| Sub – M/WBE | 284 | 31.24% | $12,944,873 | 11.11% |
Table 120: LL 174-Eligible Prime Spend, FY20-22
| M/WBE Category | FY20 | FY21 | FY22 | |||
|---|---|---|---|---|---|---|
| Spend | % Share | Spend | % Share | Spend | % Share | |
| M/WBE ALL | $99,223,913 | 21.48% | $87,925,687 | 20.89% | $66,752,732 | 19.00% |
| Non-Certified | $362,605,175 | 78.52% | $333,007,388 | 79.11% | $284,557,459 | 81.00% |
| Total | $461,829,088 | 100.00% | $420,933,074 | 100.00% | $351,310,192 | 100.00% |
Table 121: LL 174-Eligible Sub Vendor Spend, FY20-22
| M/WBE Category | FY20 | FY21 | FY22 | |||
|---|---|---|---|---|---|---|
| Spend | % Share | Spend | % Share | Spend | % Share | |
| M/WBE ALL | $23,097,657 | 57.14% | $11,394,143 | 73.12% | $24,114,516 | 60.11% |
| Non-Certified | $17,324,519 | 42.86% | $4,189,129 | 26.88% | $15,999,682 | 39.89% |
| Total | $40,422,176 | 100.00% | $15,583,272 | 100.00% | $40,114,198 | 100.00% |
Department of Sanitation (DSNY)
DSNY has one of the largest procurement portfolios across the City. This includes many large-dollar-value Goods and Renewals that are exempt from LL 174 participation goals. The data included here, therefore, represents only a small share of DSNY’s procurements. Still, DSNY procured nearly $45 million in LL 174-eligible contracts. The share of this contract value that was registered to M/WBEs is higher than the Citywide average (34%). DSNY registered a higher percentage of contract value to Black male-owned MBEs than most agencies (9%), mostly for Professional Services. DSNY utilized the M/WBE NCSP method more often than most agencies (49), with a higher average value than most agencies ($156,621). DSNY registered more late contracts in FY22 than in prior FYs (66% in FY22, compared to 27% in FY20).
The share of LL 174-eligible spending with M/WBE prime vendors has not surpassed 4% since FY20. However, the share and value of LL 174-eligible spending with M/WBE sub vendors has increased each year since FY20, surpassing 50% in FY22.
Table 122: LL 174-Eligible Contracts and POS – FY20-22
| Certification Status | # of Contracts | % Share of Contracts | Total Registered Contract Value | % Share of Registered Contract Value |
| FY20 | 996 | N/A | $72,503,653 | N/A |
| Non-Certified | 595 | 59.74% | $41,287,292 | 56.95% |
| M/WBE | 401 | 40.26% | $31,216,361 | 43.05% |
| FY21 | 854 | N/A | $38,234,633 | N/A |
| Non-Certified | 527 | 61.71% | $29,541,801 | 77.26% |
| M/WBE | 327 | 38.29% | $8,692,831 | 22.74% |
| FY22 | 872 | N/A | $44,496,211 | N/A |
| Non-Certified | 540 | 61.93% | $29,299,754 | 65.85% |
| M/WBE | 332 | 38.07% | $15,196,456 | 34.15% |
| Grand Total | 2,722 | N/A | $155,234,497 | N/A |
Chart 97: FY22 Value of LL 174-Eligible Prime Contracts and POs
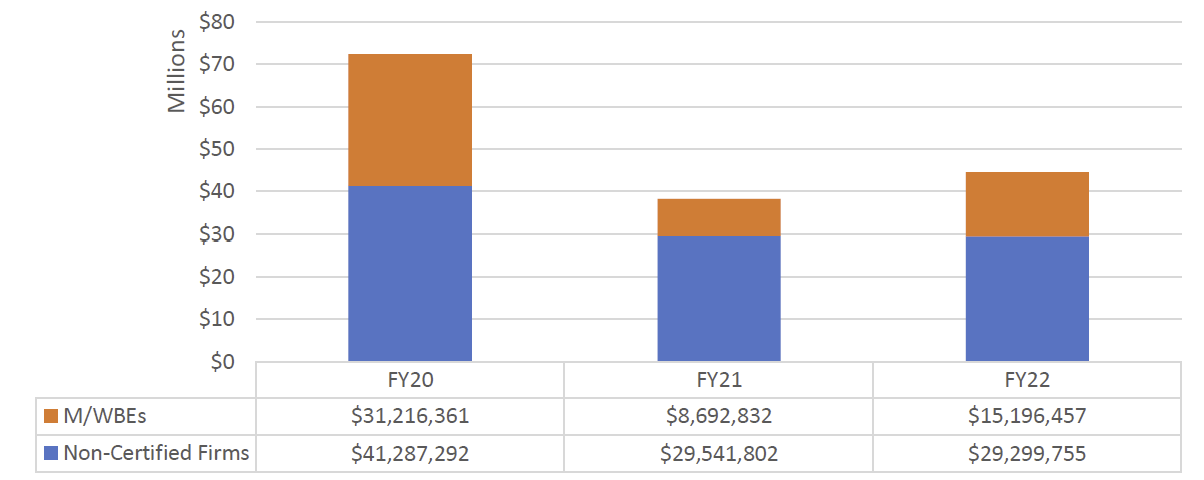
Chart 98: FY22 Value of LL 174-Eligible Contracts and POs, by Race and Gender
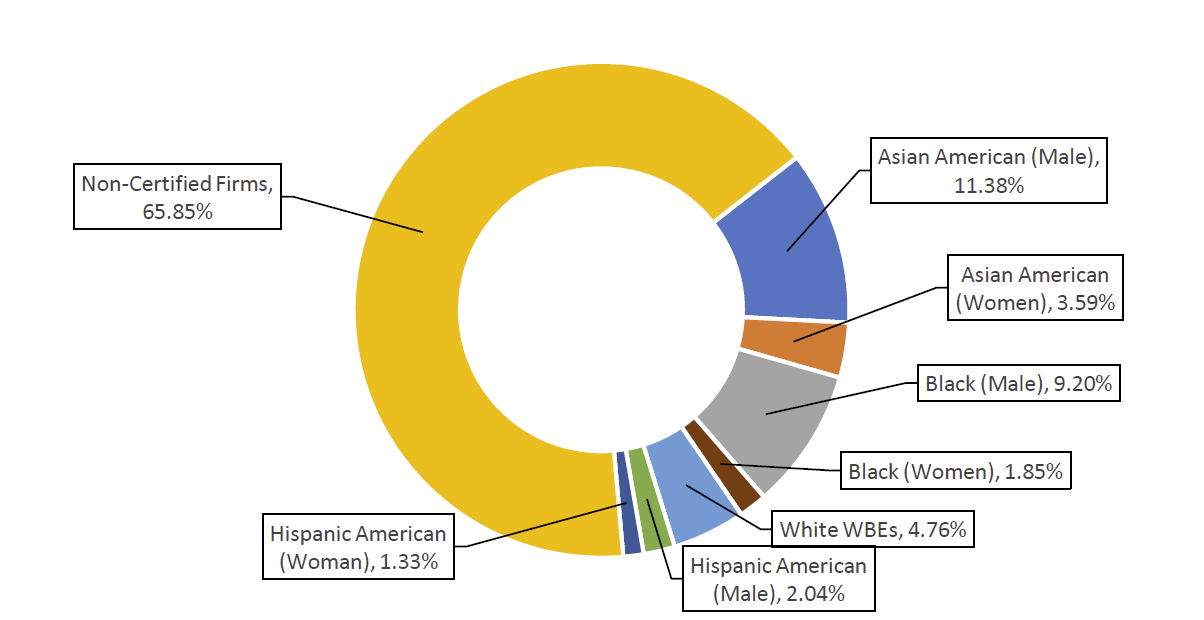
Table 123: Registered M/WBE NCSPs – FY20-22
| FY | Count | Total Value | AVG Value | Citywide AVG Value |
| FY20 | 79 | $7,132,795 | $90,289 | $79,27 |
| FY21 | 82 | $7,423,693 | $90,533 | $105,121 |
| FY22 | 49 | $7,674,444 | $156,621 | $134,907 |
| Grand Total | 210 | $22,230,932 | $105,862 | $104,232 |
Chart 99: Share of M/WBE Contracts Registered Late – FY20-22
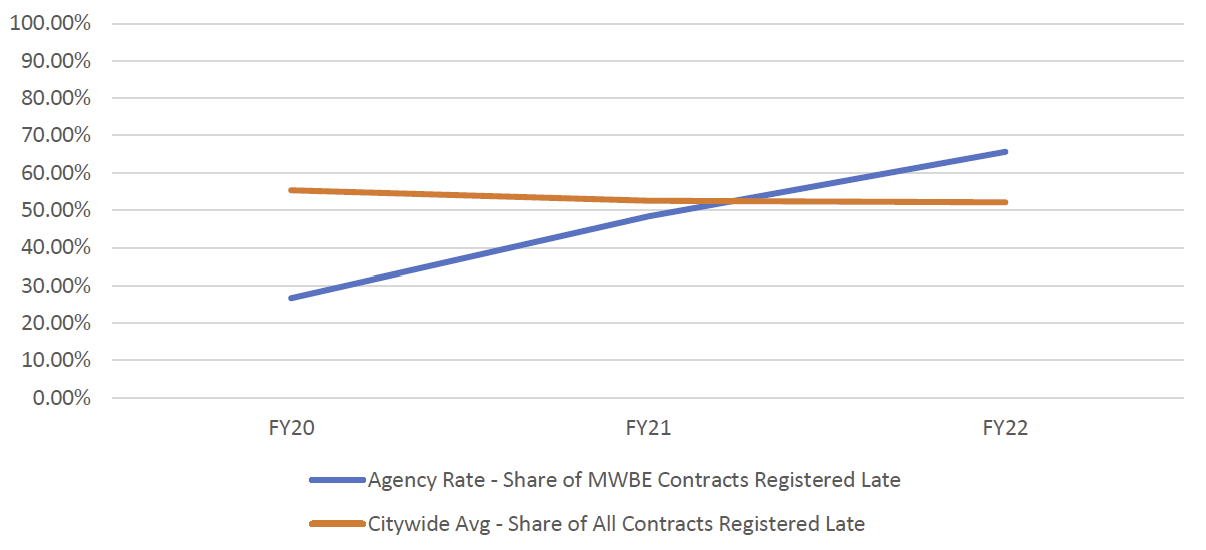
Chart 100: FY22 Contract and PO Value, by M/WBE Category and Industry
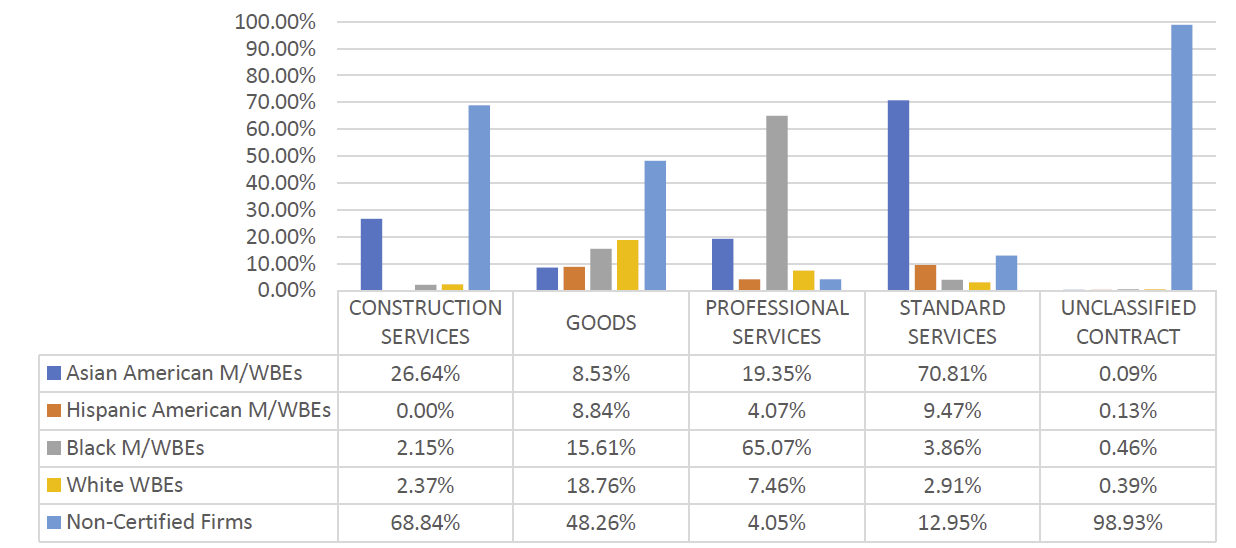
Table 124: LL 174-Eligible Approved Subcontracts – FY20-22
| Certification Status | # of Contracts | % Share of Contracts | Total Registered Contract Value | % Share of Registered Contract Value |
| FY20 | 44 | N/A | $12,769,211 | N/A |
| Sub – Non-Certified | 24 | 54.55% | $5,198,980 | 40.71% |
| Sub – M/WBE | 20 | 45.45% | $7,570,231 | 59.29% |
| FY21 | 6 | N/A | $990,794 | N/A |
| Sub – Non-Certified | 4 | 66.67% | $949,112 | 95.79% |
| Sub – M/WBE | 2 | 33.33% | $41,682 | 4.21% |
| FY22 | 11 | N/A | $4,137,085 | N/A |
| Sub – Non-Certified | 2 | 18.18% | $13,100 | 0.32% |
| Sub – M/WBE | 9 | 81.82% | $4,123,985 | 99.68% |
| Grand Total | 61 | N/A | $17,897,090 | N/A |
Table 125: LL 174-Eligible Prime Spend, FY20-22
| M/WBE Category | FY20 | FY21 | FY22 | |||
|---|---|---|---|---|---|---|
| Spend | % Share | Spend | % Share | Spend | % Share | |
| M/WBE ALL | $24,319,546 | 3.32% | $15,452,846 | 2.00% | $31,024,822 | 3.97% |
| Non-Certified | $708,619,178 | 96.68% | $756,565,369 | 98.00% | $749,924,131 | 96.03% |
| Total | $732,938,724 | 100.00% | $772,018,215 | 100.00% | $780,948,953 | 100.00% |
Table 126: LL 174-Eligible Sub Vendor Spend, FY20-22
| M/WBE Category | FY20 | FY21 | FY22 | |||
|---|---|---|---|---|---|---|
| Spend | % Share | Spend | % Share | Spend | % Share | |
| M/WBE ALL | $3,545,788 | 16.46% | $10,107,301 | 40.29% | $13,421,462 | 55.74% |
| Non-Certified | $17,991,003 | 83.54% | $14,976,259 | 59.71% | $10,656,159 | 44.26% |
| Total | $21,536,791 | 100.00% | $25,083,560 | 100.00% | $24,077,620 | 100.00% |
Department of Homeless Services (DHS)
DHS predominantly contracts with vendors for human services, which are exempt from LL 174 participation goals. In FY22, DHS procured some of the highest-dollar-value contracts across the City. The data included here represents a very small share of DHS’s total procurement portfolio. Of these, the share of LL 174-eligible contract value registered to M/WBEs is higher than the Citywide average (50.55%) – most of the value was registered to Asian American male-owned MBEs for Standard Services. DHS registered nine contracts using the M/WBE NCSP method, with an average value of $206,250 which is higher than the Citywide average. The share and value of DHS LL 174-eligible spending with M/WBEs has increased each year since FY20, reaching 14.31% in FY22. There was no recorded LL 174-eligible subcontract spending since FY20.
Table 127: LL 174-Eligible Contracts and POS – FY20-22
| Certification Status | # of Contracts | % Share of Contracts | Total Registered Contract Value | % Share of Registered Contract Value |
| FY20 | 120 | N/A | $18,656,560 | N/A |
| Non-Certified | 57 | 47.50% | $7,784,451 | 41.73% |
| M/WBE | 63 | 52.50% | $10,872,108 | 58.27% |
| FY21 | 66 | N/A | $42,171,697 | N/A |
| Non-Certified | 31 | 46.97% | $20,314,610 | 48.17% |
| M/WBE | 35 | 53.03% | $21,857,086 | 51.83% |
| FY22 | 76 | N/A | $24,398,988 | N/A |
| Non-Certified | 40 | 52.63% | $12,066,462 | 49.45% |
| M/WBE | 36 | 47.37% | $12,332,525 | 50.55% |
| Grand Total | 262 | N/A | $85,227,245 | N/A |
Chart 101: FY22 Value of LL 174-Eligible Prime Contracts and POs
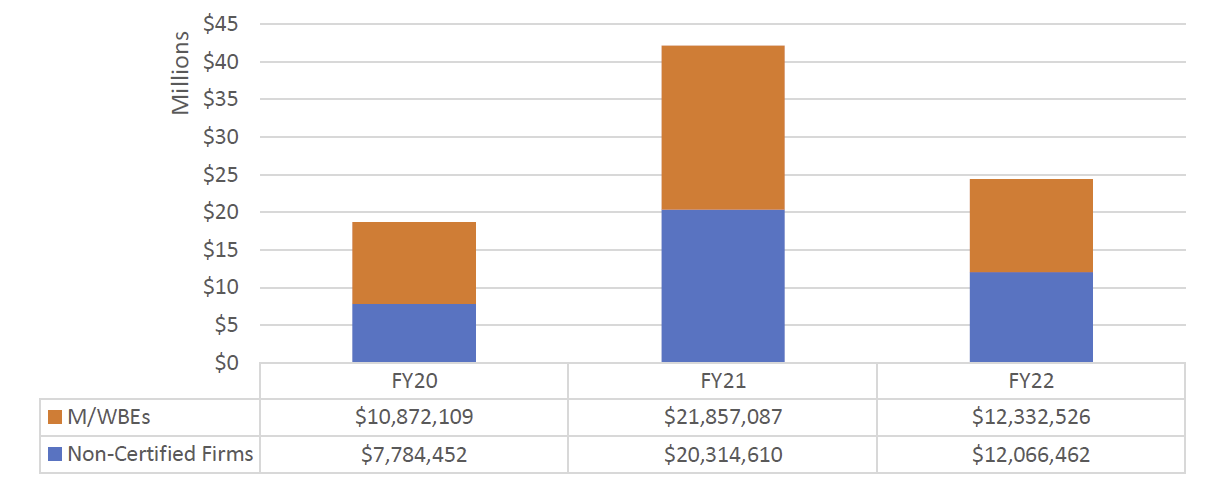
Chart 102: FY22 Value of LL 174-Eligible Contracts and POs, by Race and Gender
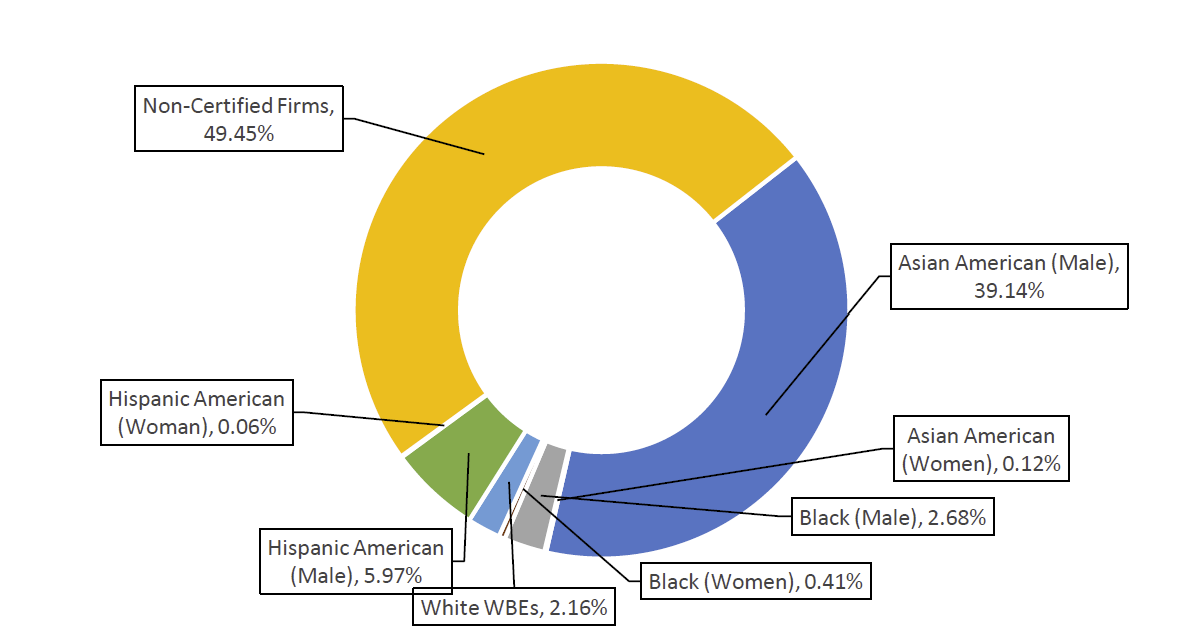
Table 128: Registered M/WBE NCSPs – FY20-22
| FY | Count | Total Value | AVG Value | Citywide AVG Value |
| FY20 | 12 | $1,138,776 | $94,898 | $79,27 |
| FY21 | 1 | $143,475 | $143,475 | $105,121 |
| FY22 | 9 | $1,856,253 | $206,250 | $134,907 |
| Grand Total | 22 | $3,138,504 | $142,659 | $104,232 |
Chart 103: Share of M/WBE Contracts Registered Late – FY20-22
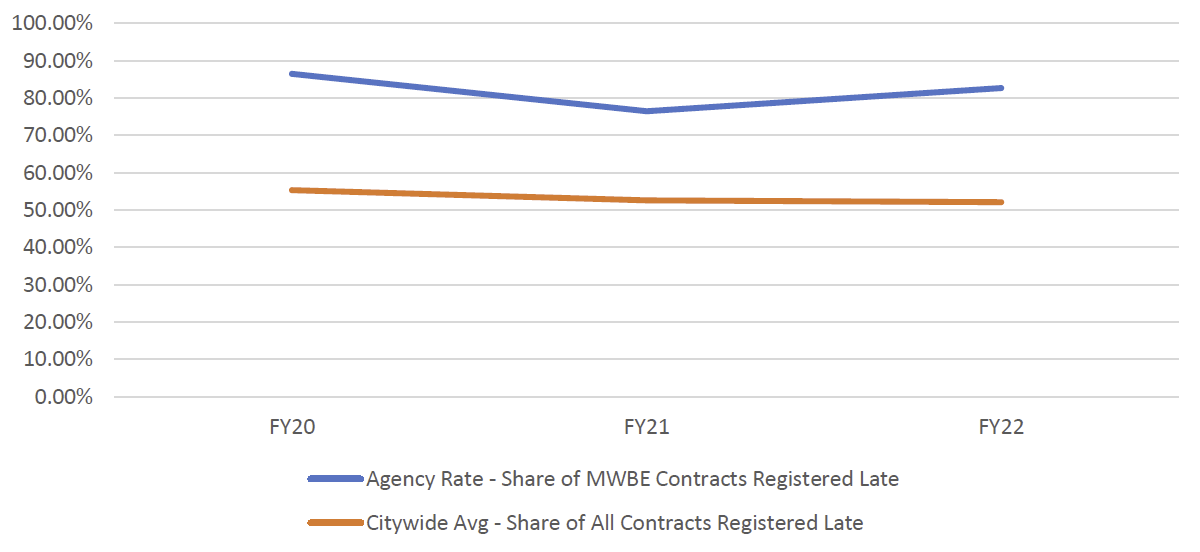
Chart 104: FY22 Contract and PO Value, by M/WBE Category and Industry
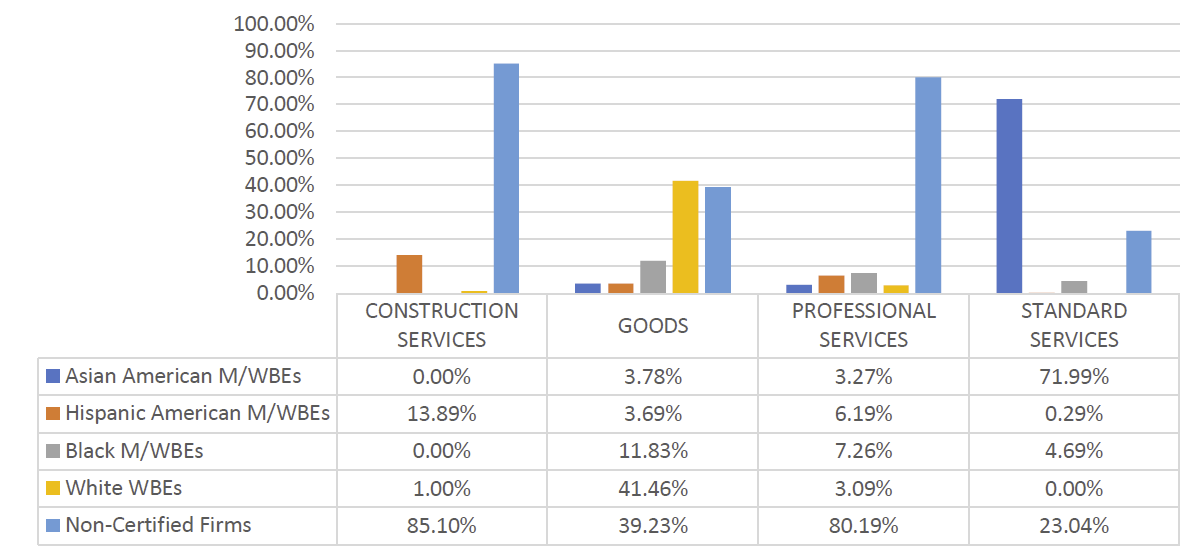
Table 129: LL 174-Eligible Approved Subcontracts – FY20-22
| Certification Status | # of Contracts | % Share of Contracts | Total Registered Contract Value | % Share of Registered Contract Value |
| FY20 | 7 | N/A | N/A | N/A |
| Sub – M/WBE | 7 | 100.00% | $1,772,370 | 100.00% |
Table 130: LL 174-Eligible Prime Spend, FY20-22
| M/WBE Category | FY20 | FY21 | FY22 | |||
|---|---|---|---|---|---|---|
| Spend | % Share | Spend | % Share | Spend | % Share | |
| M/WBE ALL | $9,584,605 | 8.38% | $12,690,435 | 13.60% | $13,761,062 | 14.31% |
| Non-Certified | $104,818,192 | 91.62% | $80,599,364 | 86.40% | $82,421,730 | 85.69% |
| Total | $114,402,797 | 100.00% | $93,289,799 | 100.00% | $96,182,792 | 100.00% |
Human Resources Administration (DSS/HRA)
HRA predominantly contracts with vendors for human services, which are exempt from LL 174 participation goals. The data included here represents a very small share of DHS’s total procurement portfolio. Of these, the share of LL 174-eligible contract value registered to M/WBEs is higher than the Citywide average (60%). HRA registered a higher percentage of contract value to Hispanic American women-owned MBEs than most agencies (13.9%), mostly in Standard Services. As is the case with most human services agencies, HRA registered nearly 90% of these contracts after the start of the contract. The share of LL 174-eligible spending with M/WBEs has increased in FY22 to 15.84%, the highest total since FY20.
Table 131: LL 174-Eligible Contracts and POS – FY20-22
| Certification Status | # of Contracts | % Share of Contracts | Total Registered Contract Value | % Share of Registered Contract Value |
| FY20 | 419 | N/A | $23,314,006 | N/A |
| Non-Certified | 162 | 38.66% | $12,063,143 | 51.74% |
| M/WBE | 257 | 61.34% | $11,250,862 | 48.26% |
| FY21 | 259 | N/A | $13,076,758 | N/A |
| Non-Certified | 105 | 40.54% | $7,236,851 | 55.34% |
| M/WBE | 154 | 59.46% | $5,839,906 | 44.66% |
| FY22 | 384 | N/A | $11,830,950 | N/A |
| Non-Certified | 149 | 38.80% | $4,654,801 | 39.34% |
| M/WBE | 235 | 61.20% | $7,176,148 | 60.66% |
| Grand Total | 1,062 | 100.00% | $48,221,714 | 100.00% |
Chart 105: FY22 Value of LL 174-Eligible Prime Contracts and POs
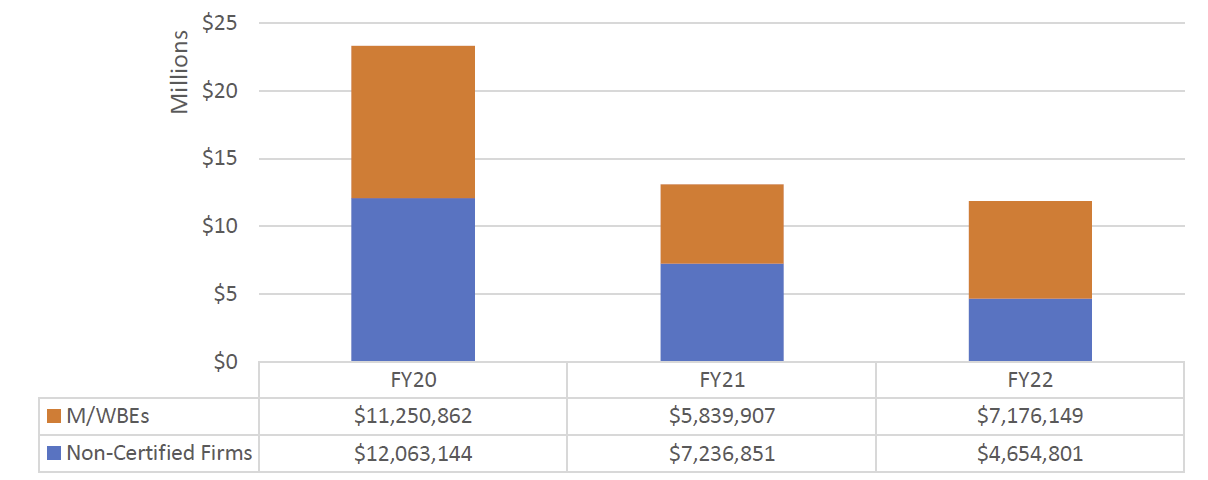
Chart 106: FY22 Value of LL 174-Eligible Contracts and POs, by Race and Gender
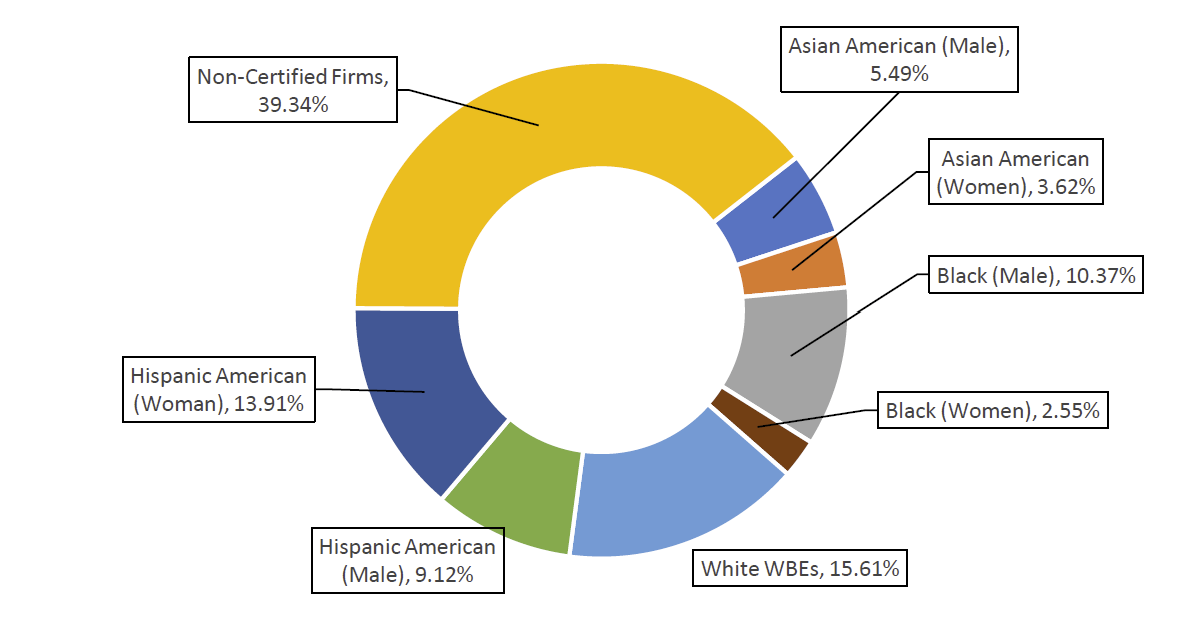
Table 132: Registered M/WBE NCSPs – FY20-22
| FY | Count | Total Value | AVG Value | Citywide AVG Value |
| FY20 | 29 | $4,041,953 | $139,378 | $79,27 |
| FY21 | 11 | $1,154,033 | $104,912 | $105,121 |
| FY22 | 30 | $3,618,295 | $120,610 | $134,907 |
| Grand Total | 70 | $8,814,282 | $125,918 | $104,232 |
Chart 107: Share of M/WBE Contracts Registered Late
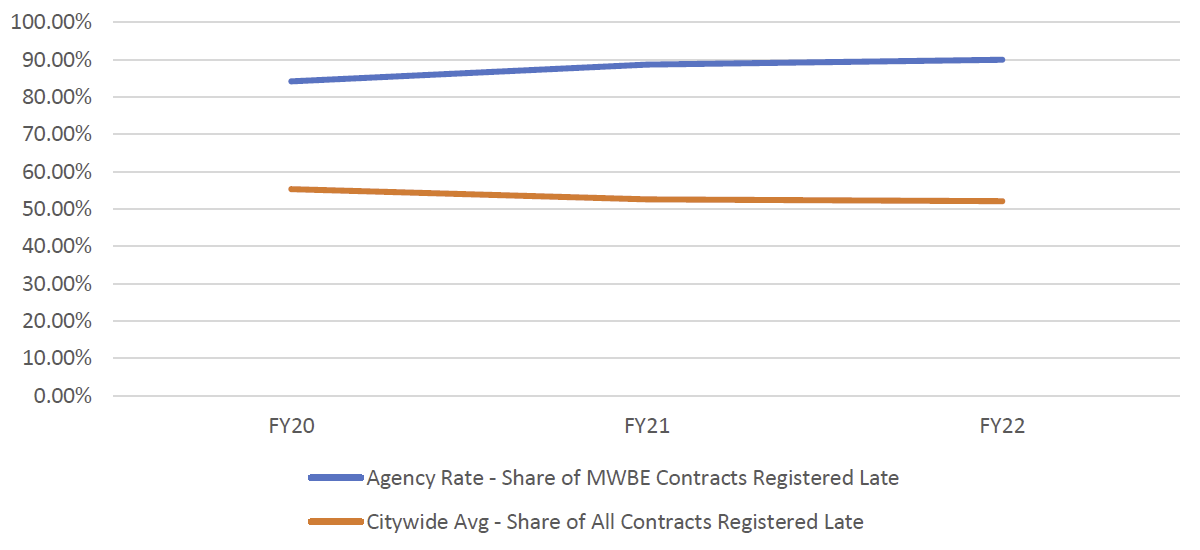
Chart 108: FY22 Contract and PO Value, by M/WBE Category and Industry
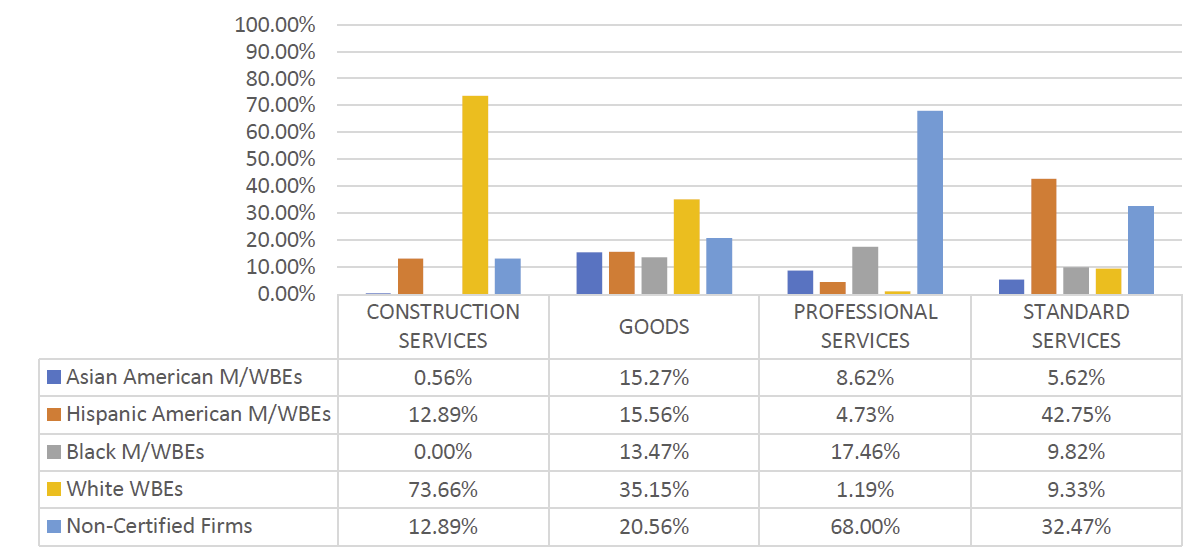
Table 133: LL 174-Eligible Approved Subcontracts – FY20-22
| Certification Status | # of Contracts | % Share of Contracts | Total Registered Contract Value | % Share of Registered Contract Value |
| FY20 | 2 | N/A | $463,735 | N/A |
| Sub – Majority | 2 | 100.00% | $463,735 | 100.00% |
| FY21 | 9 | N/A | $369,153 | N/A |
| Sub – M/WBE | 9 | 100.00% | $369,153 | 100.00% |
Table 134: LL 174-Eligible Prime Spend, FY20-22
| M/WBE Category | FY20 | FY21 | FY22 | |||
|---|---|---|---|---|---|---|
| Spend | % Share | Spend | % Share | Spend | % Share | |
| M/WBE ALL | $24,087,660 | 14.52% | $13,174,414 | 11.46% | $21,613,221 | 15.84% |
| Non-Certified | $141,820,349 | 85.48% | $101,776,392 | 88.54% | $114,799,765 | 84.16% |
| Total | $165,908,009 | 100.00% | $114,950,806 | 100.00% | $136,412,986 | 100.00% |
Table 135: LL 174-Eligible Sub Vendor Spend, FY20-22
| M/WBE Category | FY20 | FY21 | FY22 | |||
|---|---|---|---|---|---|---|
| Spend | % Share | Spend | % Share | Spend | % Share | |
| M/WBE ALL | $0 | 0.00% | $0 | N/A | $0 | 0.00% |
| Non-Certified | $1,980 | 100.00% | $0 | N/A | $6,533 | 100.00% |
| Total | $1,980 | 100.00% | $0 | 100.00% | $6,533 | 100.00% |
Department of Youth and Community Development (DYCD)
DYCD predominantly contracts with vendors for human services, which are exempt from LL 174 participation goals. In fact, 98% of DYCD’s procurement portfolio is for human services. Therefore, the data included here represents a very small share of DYCD’s total procurement portfolio. DYCD registered 22 LL 174-eligible new contracts and 181 POs. Of this, the share of contract value registered to M/WBEs and the share of spend is much higher than the Citywide average (73.79% and 54% respectively). DYCD registered a higher percentage of contract value to Hispanic American MBEs than most agencies (19.53%), mostly for Goods. As is the case with most human services agencies, DYCD has higher rates of retroactivity than the Citywide average, and rates have increased since FY21. The share of LL 174-eligible spending with M/WBEs has increased each year, surpassing 50% in FY22. However, this is largely a reflect of an overall decline in DYCD’s LL 174-eligible spending since FY20. There were zero approved subcontractors for LL 174-eligible contracts in PIP for FY20, FY21, or FY22.
Table 136: LL 174-Eligible Contracts and POS – FY20-22
| Certification Status | # of Contracts | % Share of Contracts | Total Registered Contract Value | % Share of Registered Contract Value |
| FY20 | 283 | N/A | $2,565,028 | N/A |
| Non-Certified | 130 | 45.94% | $920,403 | 35.88% |
| M/WBE | 153 | 54.06% | $1,644,624 | 64.12% |
| FY21 | 170 | N/A | $1,398,820 | N/A |
| Non-Certified | 87 | 51.18% | $545,775 | 39.02% |
| M/WBE | 83 | 48.82% | $853,045 | 60.98% |
| FY22 | 203 | N/A | $2,798,671 | N/A |
| Non-Certified | 95 | 46.80% | $733,396 | 26.21% |
| M/WBE | 108 | 53.20% | $2,065,275 | 73.79% |
| Grand Total | 656 | N/A | $6,762,520 | N/A |
Chart 109: FY22 Value of LL 174-Eligible Prime Contracts and POs
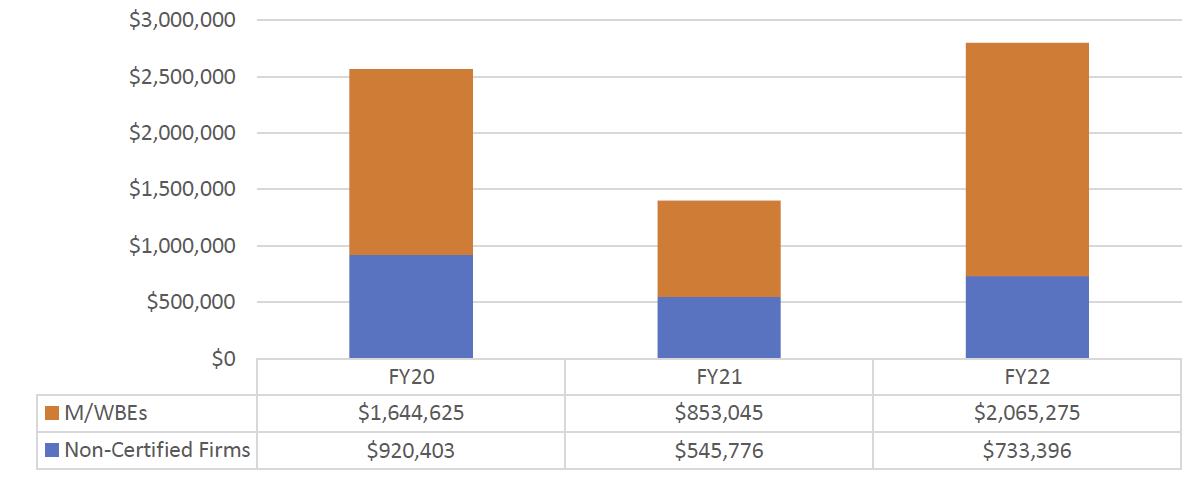
Chart 110: FY22 Value of LL 174-Eligible Contracts and POs, by Race and Gender
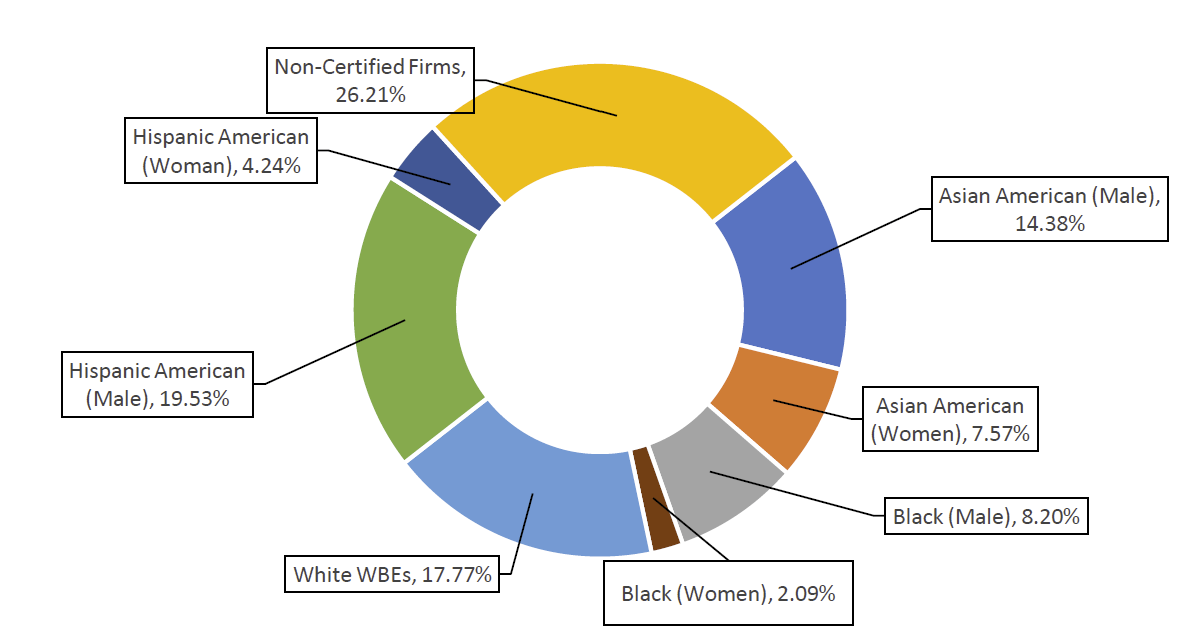
Table 137: Registered M/WBE NCSPs – FY20-22
| FY | Count | Total Value | AVG Value | Citywide AVG Value |
| FY20 | 17 | $1,417,937 | $83,408 | $79,27 |
| FY21 | 8 | $667,454 | $83,432 | $105,121 |
| FY22 | 19 | $1,707,343 | $89,860 | $134,907 |
| Grand Total | 44 | $3,792,735 | $86,199 | $104,232 |
Chart 111: Share of M/WBE Contracts Registered Late – FY20-22

Chart 112: FY22 Contract and PO Value, by M/WBE Category and Industry
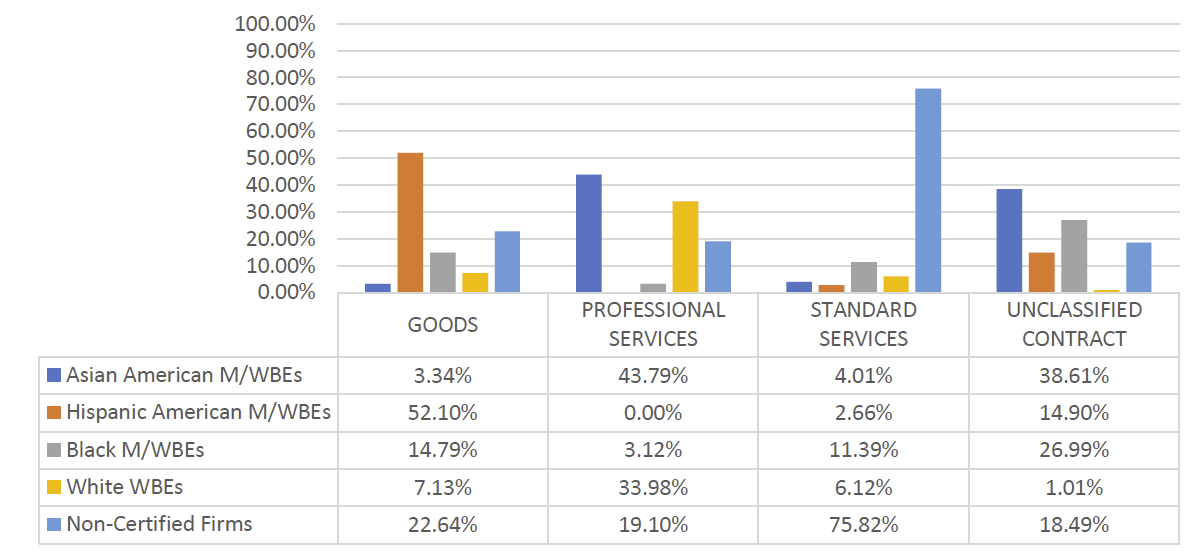
Table 138: LL 174- Eligible Prime Spend– FY20-22
| M/WBE Category | FY20 | FY21 | FY22 | |||
|---|---|---|---|---|---|---|
| Spend | % Share | Spend | % Share | Spend | % Share | |
| M/WBE ALL | $3,037,990 | 11.30% | $3,583,454 | 44.67% | $1,597,559 | 54.44% |
| Non-Certified | $23,840,124 | 88.70% | $4,438,264 | 55.33% | $1,337,177 | 45.56% |
| Total | $26,878,114 | 100.00% | $8,021,718 | 100.00% | $2,934,736 | 100.00% |
New York City Fire Department (FDNY)
FDNY registered 76 LL 174-eligible new contracts and 164 POs in FY22. FDNY effectively used the M/WBE NCSP method to direct purchases to Black M/WBEs, though this were for low-dollar-value contracts. 40% of contracts registered using this method were registered to Black M/WBEs, in comparison to a relative share of 6% of registered contract value to Black M/WBEs. FDNY registered roughly half of their contracts after the contract start date, which is consistent with the Citywide average. M/WBEs represent a large share of approved FDNY subcontractors (88% of the value and 67.15% of the spend). FDNY’s share of LL 174-eligible spending with M/WBE primes has been largely steady since FY20 but reached its highest level in FY22 at 19.69%. M/WBE sub vendors received the highest value of LL 174-eligible spending since FY20.
Table 139: LL 174-Eligible Contracts and POS – FY20-22
| Certification Status | # of Contracts | % Share of Contracts | Total Registered Contract Value | % Share of Registered Contract Value |
| FY20 | 278 | N/A | $68,555,983 | N/A |
| Non-Certified | 150 | 53.96% | $60,435,750 | 88.16% |
| M/WBE | 128 | 46.04% | $8,120,233 | 11.84% |
| FY21 | 319 | N/A | $38,372,807 | N/A |
| Non-Certified | 176 | 55.17% | $28,617,002 | 74.58% |
| M/WBE | 143 | 44.83% | $9,755,804 | 25.42% |
| FY22 | 240 | N/A | $35,831,730 | N/A |
| Non-Certified | 120 | 50.00% | $28,904,706 | 80.67% |
| M/WBE | 120 | 50.00% | $6,927,023 | 19.33% |
| Grand Total | 837 | N/A | $142,760,521 | N/A |
Chart 113: FY22 Value of LL 174-Eligible Prime Contracts and POs
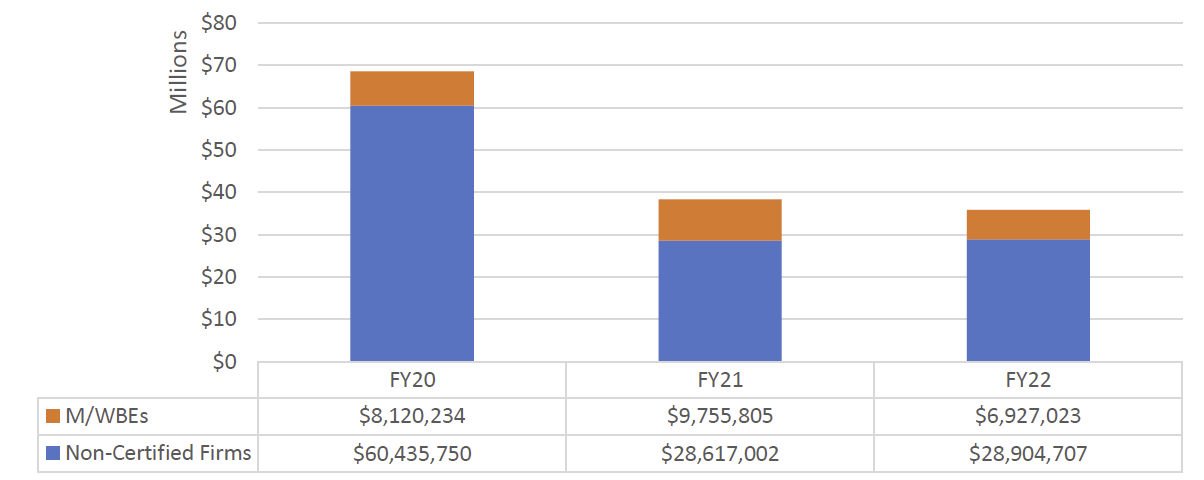
Chart 114: FY22 Value of LL 174-Eligible Contracts and POs, by Race and Gender
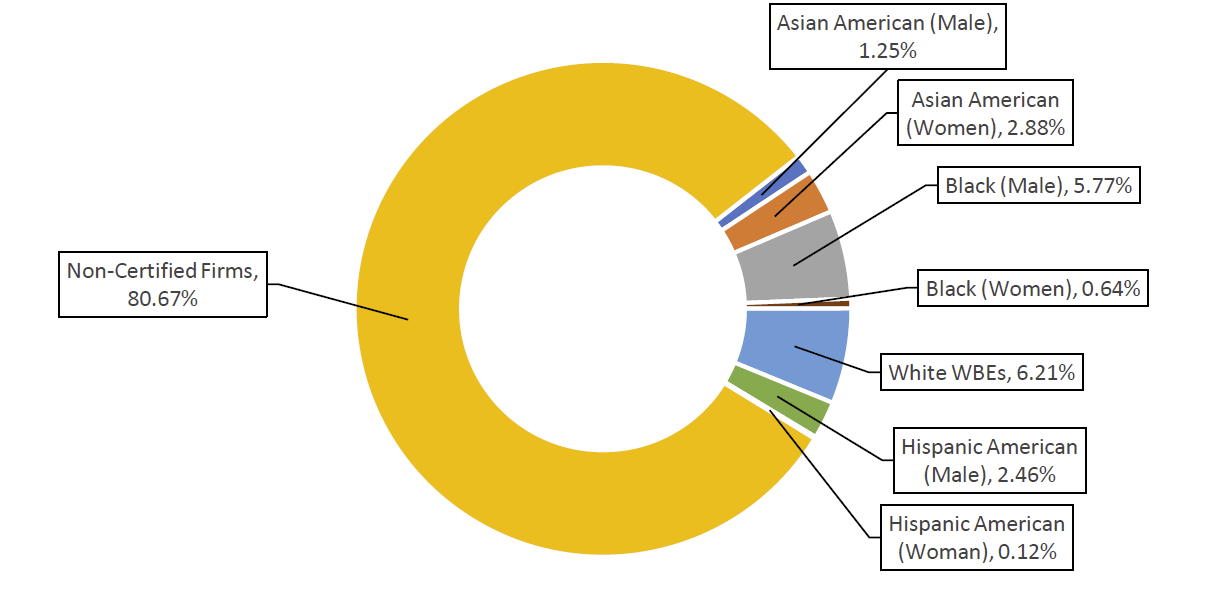
Table 140: Registered M/WBE NCSPs – FY20-22
| FY | Count | Total Value | AVG Value | Citywide AVG Value |
| FY20 | 70 | $5,660,256 | $80,861 | $79,27 |
| FY21 | 61 | $5,808,696 | $95,225 | $105,121 |
| FY22 | 57 | $5,929,416 | $104,025 | $134,907 |
| Grand Total | 188 | $17,398,368 | $92,545 | $104,232 |
Chart 115: Share of M/WBE Contracts Registered Late – FY20-22
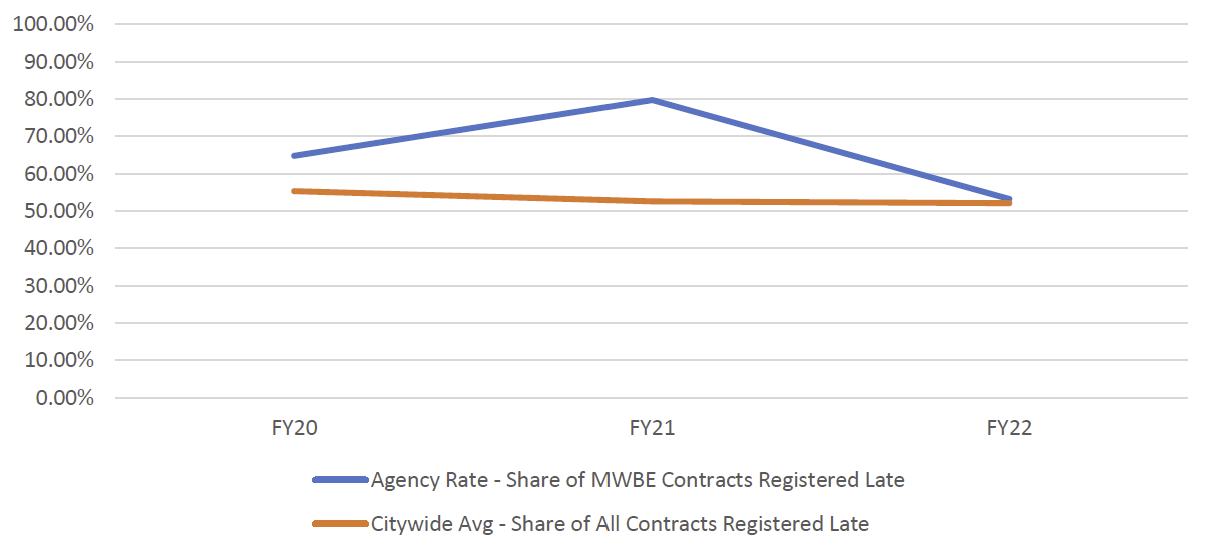
Chart 116: FY22 Contract and PO Value, by M/WBE Category and Industry
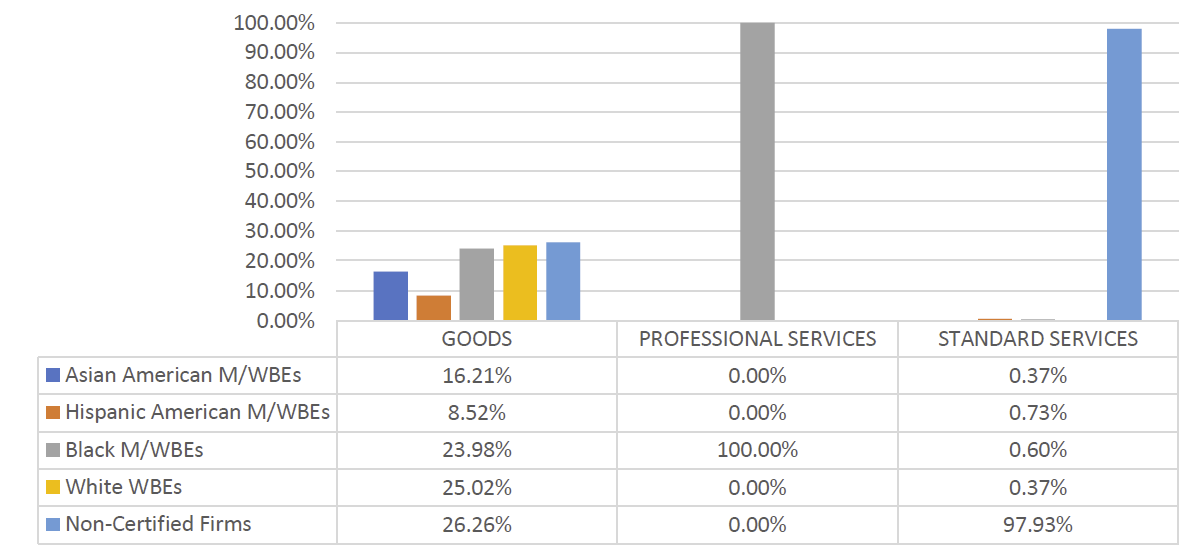
Table 141: LL 174-Eligible Approved Subcontracts – FY20-22
| Certification Status | # of Contracts | % Share of Contracts | Total Registered Contract Value | % Share of Registered Contract Value |
| FY20 | 76 | N/A | $37,605,554 | N/A |
| Sub – Non-Certified | 76 | 100.00% | $37,605,554 | 100.00% |
| FY21 | 19 | N/A | $7,586,431 | N/A |
| Sub – Non-Certified | 11 | 57.89% | $2,022,455 | 26.66% |
| Sub – M/WBE | 8 | 42.11% | $5,563,976 | 73.34% |
| FY22 | 22 | N/A | $3,929,863 | N/A |
| Sub – Non-Certified | 4 | 18.18% | $486,902 | 12.39% |
| Sub – M/WBE | 18 | 81.82% | $3,442,961 | 87.61% |
| Grand Total | 117 | N/A | $49,121,848 | N/A |
Table 142: LL 174-Eligible Prime Spend, FY20-22
| M/WBE Category | FY20 | FY21 | FY22 | |||
|---|---|---|---|---|---|---|
| Spend | % Share | Spend | % Share | Spend | % Share | |
| M/WBE ALL | $38,151,235 | 17.25% | $43,436,307 | 19.56% | $57,011,239 | 19.69% |
| Non-Certified | $183,003,796 | 82.75% | $178,657,035 | 80.44% | $232,554,412 | 80.31% |
| Total | $221,155,031 | 100.00% | $222,093,342 | 100.00% | $289,565,651 | 100.00% |
Table 143: LL 174-Eligible Sub Vendor Spend, FY20-22
| M/WBE Category | FY20 | FY21 | FY22 | |||
|---|---|---|---|---|---|---|
| Spend | % Share | Spend | % Share | Spend | % Share | |
| M/WBE ALL | $4,695,448 | 54.69% | $6,242,541 | 73.05% | $7,972,678 | 65.82% |
| Non-Certified | $3,889,445 | 45.31% | $2,303,183 | 26.95% | $4,139,834 | 34.18% |
| Total | $8,584,894 | 100.00% | $8,545,725 | 100.00% | $12,112,512 | 100.00% |
Department of Housing Preservation and Development (HPD)
HPD procures many goods and services annually. HPD registered more POs than any other LL 174 agencies in FY22. HPD also registered a high volume of Emergency Procurements in FY22 – many of which are exempt from LL 174 participation goals. The data included here, therefore, represents only a small share of HPD’s procurements. Still, HPD procured over $42 million in LL 174-eligible contracts in FY22. The share of this contract value that was registered to M/WBEs is higher than the Citywide average (55%). HPD registered a higher percentage of contract value to Asian American male-owned MBEs than most agencies (47%), mostly for Professional Services and Standard Services. HPD registered nearly all these M/WBE contracts late (97%).
HPD’s share of LL 174-eligible spending with M/WBE primes has not surpassed 5% in any year going back to FY21. The majority of LL 174-eligible spending on sub vendors has gone to M/WBEs since FY20, but the total value is small relative to prime dollars.
Table 144: LL 174-Eligible Contracts and POS – FY20-22
| Certification Status | # of Contracts | % Share of Contracts | Total Registered Contract Value | % Share of Registered Contract Value |
| FY20 | 11,073 | N/A | $25,319,502 | N/A |
| Non-Certified | 3,224 | 29.12% | $11,677,684 | 46.12% |
| M/WBE | 7,849 | 70.88% | $13,641,818 | 53.88% |
| FY21 | 13,595 | N/A | $31,244,561 | N/A |
| Non-Certified | 2,686 | 19.76% | $13,979,204 | 44.74% |
| M/WBE | 10,909 | 80.24% | $17,265,356 | 55.26% |
| FY22 | 13,641 | N/A | $42,202,673 | N/A |
| Non-Certified | 3,608 | 26.45% | $18,960,389 | 44.93% |
| M/WBE | 10,033 | 73.55% | $23,242,284 | 55.07% |
| Grand Total | 38,309 | N/A | $98,766,737 | N/A |
Chart 117: FY22 Value of LL 174-Eligible Prime Contracts and POs
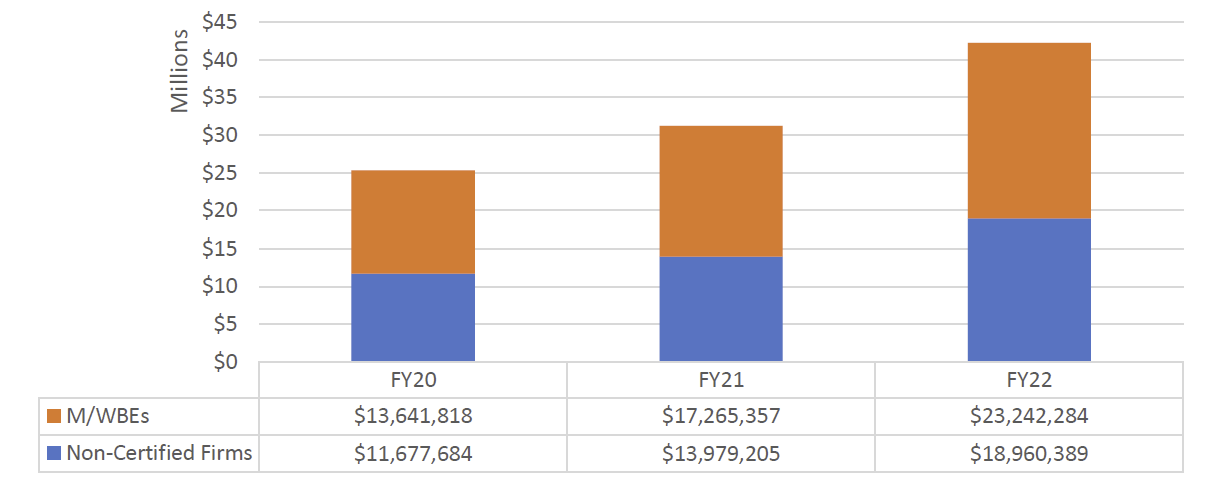
Chart 118: FY22 Value of LL 174-Eligible Contracts and POs, by Race and Gender
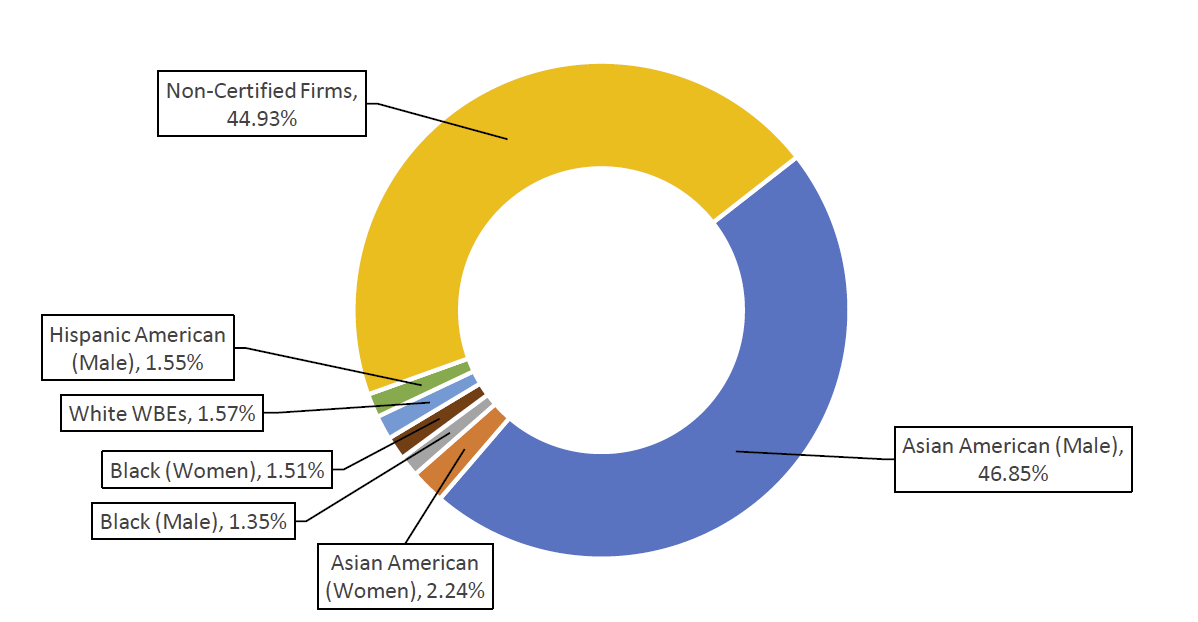
Table 145: Registered M/WBE NCSPs – FY20-22
| FY | Count | Total Value | AVG Value | Citywide AVG Value |
| FY20 | 18 | $1,570,655 | $87,259 | $79,27 |
| FY21 | 9 | $765,812 | $85,090 | $105,121 |
| FY22 | 11 | $1,072,096 | $97,463 | $134,907 |
| Grand Total | 38 | $3,408,563 | $89,699 | $104,232 |
Chart 119: Share of M/WBE Contracts Registered Late – FY20-22
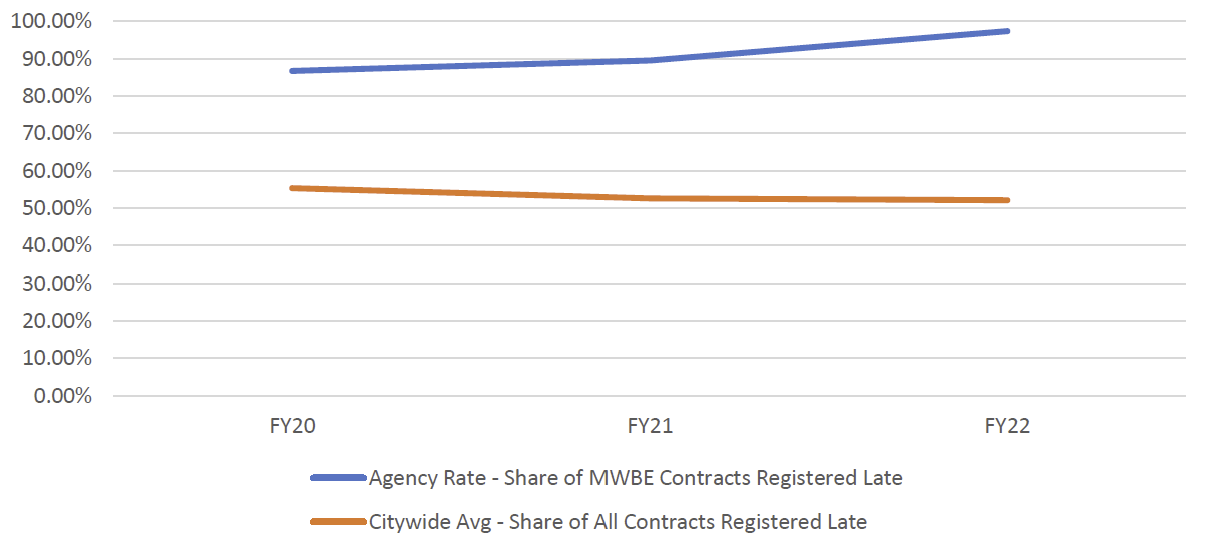
Chart 120: FY22 Contract and PO Value, by M/WBE Category and Industry
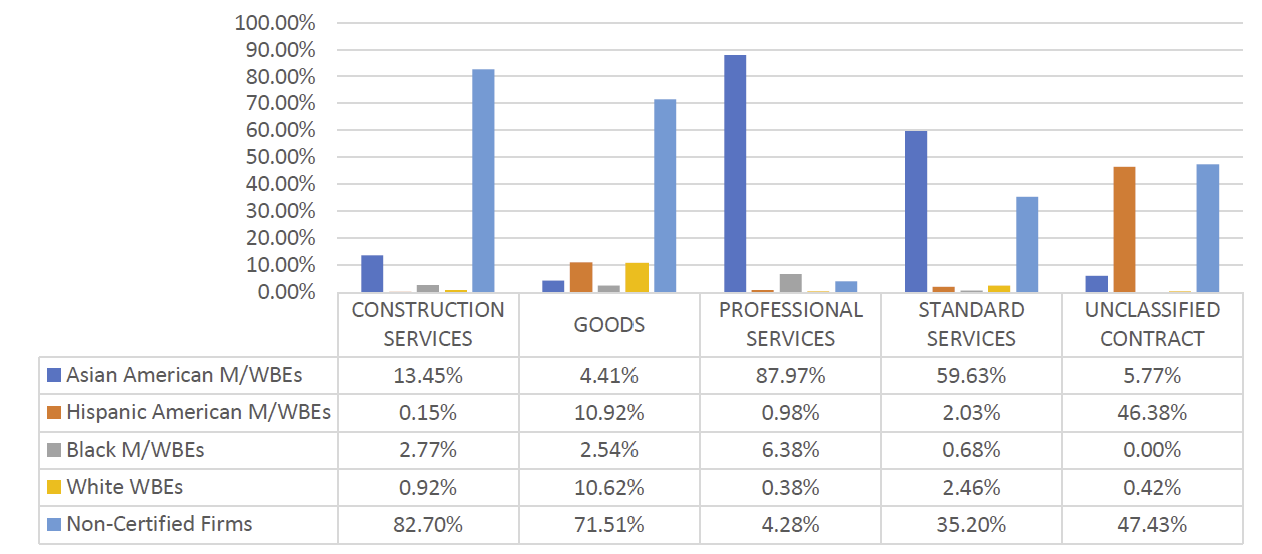
Table 146: LL 174-Eligible Approved Subcontracts – FY20-22
| Certification Status | # of Contracts | % Share of Contracts | Total Registered Contract Value | % Share of Registered Contract Value |
| FY20 | 12 | N/A | $158,178 | N/A |
| Sub – Non-Certified | 4 | 33.33% | $58,500 | 36.98% |
| Sub – M/WBE | 8 | 66.67% | $99,678 | 63.02% |
| FY21 | 50 | N/A | $844,651 | N/A |
| Sub – Non-Certified | 40 | 80.00% | $796,898 | 94.35% |
| Sub – M/WBE | 10 | 20.00% | $47,753 | 5.65% |
| FY22 | 28 | N/A | $1,680,060 | N/A |
| Sub – Non-Certified | 28 | 100.00% | $1,680,060 | 100.00% |
Table 147: LL 174-Eligible Prime Spend, FY20-22
| M/WBE Category | FY20 | FY21 | FY22 | |||
|---|---|---|---|---|---|---|
| Spend | % Share | Spend | % Share | Spend | % Share | |
| M/WBE ALL | $14,344,206 | 3.06% | $14,817,598 | 3.00% | $21,305,927 | 4.05% |
| Non-Certified | $454,575,245 | 96.94% | $478,296,455 | 97.00% | $504,253,105 | 95.95% |
| Total | $468,919,452 | 100.00% | $493,114,053 | 100.00% | $525,559,032 | 100.00% |
Table 148: LL 174-Eligible Sub Vendor Spend, FY20-22
| M/WBE Category | FY20 | FY21 | FY22 | |||
|---|---|---|---|---|---|---|
| Spend | % Share | Spend | % Share | Spend | % Share | |
| M/WBE ALL | $186,316 | 53.16% | $218,421 | 71.78% | $404,255 | 81.74% |
| Non-Certified | $164,160 | 46.84% | $85,858 | 28.22% | $90,313 | 18.26% |
| Total | $350,476 | 100.00% | $304,279 | 100.00% | $494,569 | 100.00% |
Law Department (LAW)
The Law Department registered 26 new LL 174-eligible contracts and 752 POs in FY22 (valuing about $27.5 million). The share of this contract value registered to M/WBEs is higher than the Citywide average (27.37%). The Law Department registered 100% of these contracts after their contract start date. The average value of a contract registered using the M/WBE NCSP method is higher than the Citywide average ($145,188). The share of LL 174-eligible spend with M/WBE primes has not exceeded 10% in any fiscal year going back to FY20, but M/WBEs received the highest dollar value of LL 174-eligible spending in FY22. There was no recorded LL 174-eligible subcontract spending since FY20.
Table 149: LL 174-Eligible Contracts and POS – FY20-22
| Certification Status | # of Contracts | % Share of Contracts | Total Registered Contract Value | % Share of Registered Contract Value |
| FY20 | 873 | N/A | $79,136,567 | N/A |
| Non-Certified | 714 | 81.79% | $68,330,970 | 86.35% |
| M/WBE | 159 | 18.21% | $10,805,597 | 13.65% |
| FY21 | 567 | N/A | $28,625,582 | N/A |
| Non-Certified | 469 | 82.72% | $22,864,775 | 79.88% |
| M/WBE | 98 | 17.28% | $5,760,806 | 20.12% |
| FY22 | 778 | N/A | $27,417,753 | N/A |
| Non-Certified | 550 | 70.69% | $19,913,243 | 72.63% |
| M/WBE | 228 | 29.31% | $7,504,510 | 27.37% |
| Grand Total | 2,218 | N/A | $135,179,904 | N/A |
Chart 121: FY22 Value of LL 174-Eligible Prime Contracts and POs
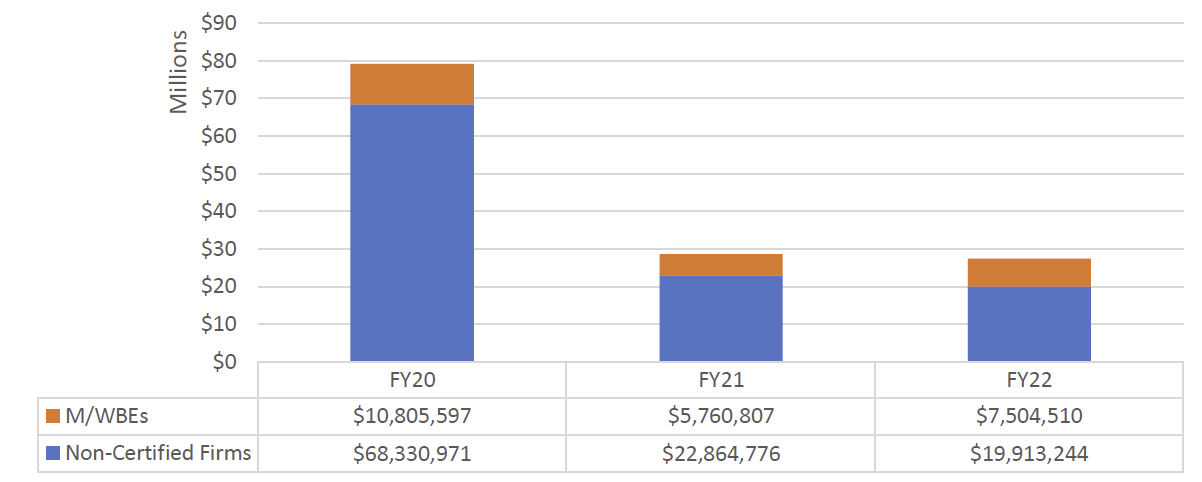
Chart 122: FY22 Value of LL 174-Eligible Contracts and POs, by Race and Gender
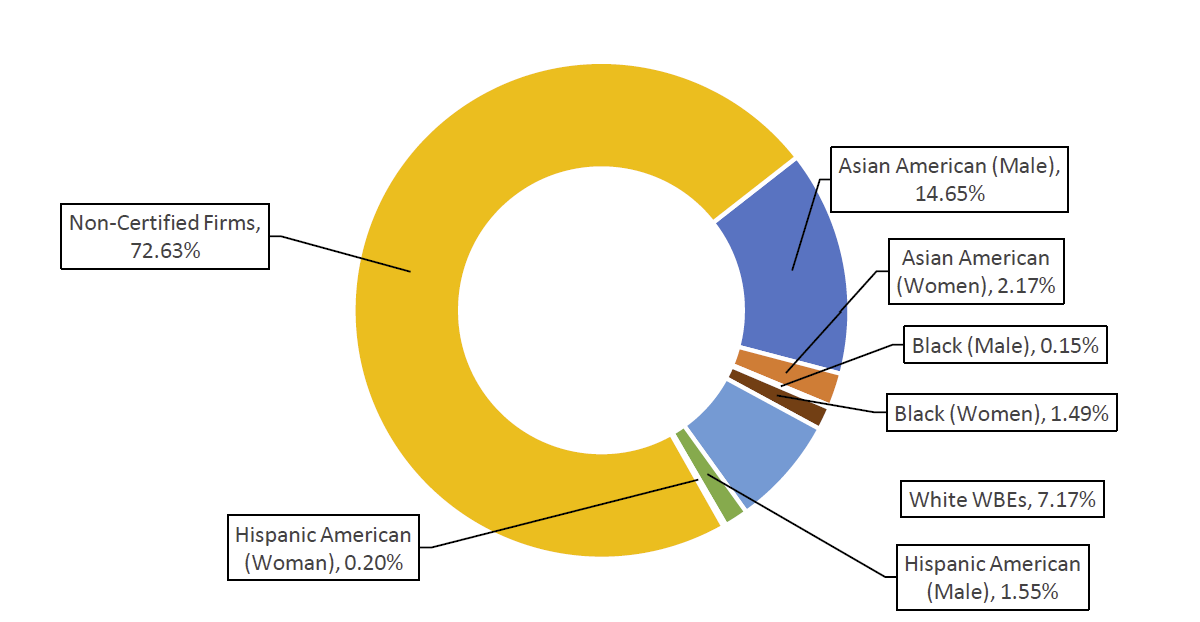
Table 150: Registered M/WBE NCSPs – FY20-22
| FY | Count | Total Value | AVG Value | Citywide AVG Value |
| FY20 | 13 | $1,111,293 | $85,484 | $79,27 |
| FY21 | 10 | $2,459,680 | $245,968 | $105,121 |
| FY22 | 6 | $871,127 | $145,188 | $134,907 |
| Grand Total | 29 | $4,442,100 | $153,176 | $104,232 |
Chart 123: Share of M/WBE Contracts Registered Late – FY20-22
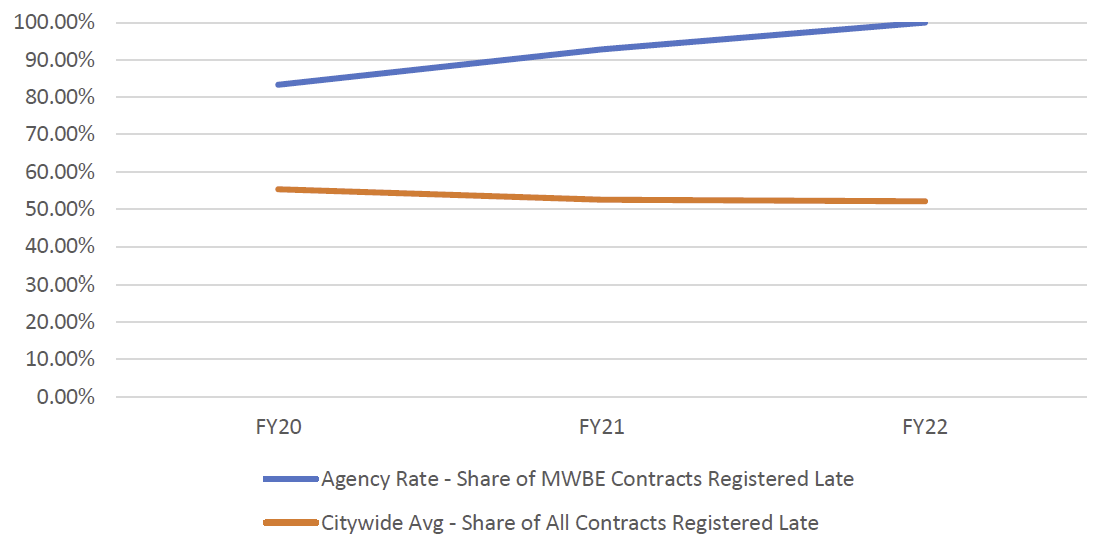
Chart 124: FY22 Contract and PO Value, by M/WBE Category and Industry
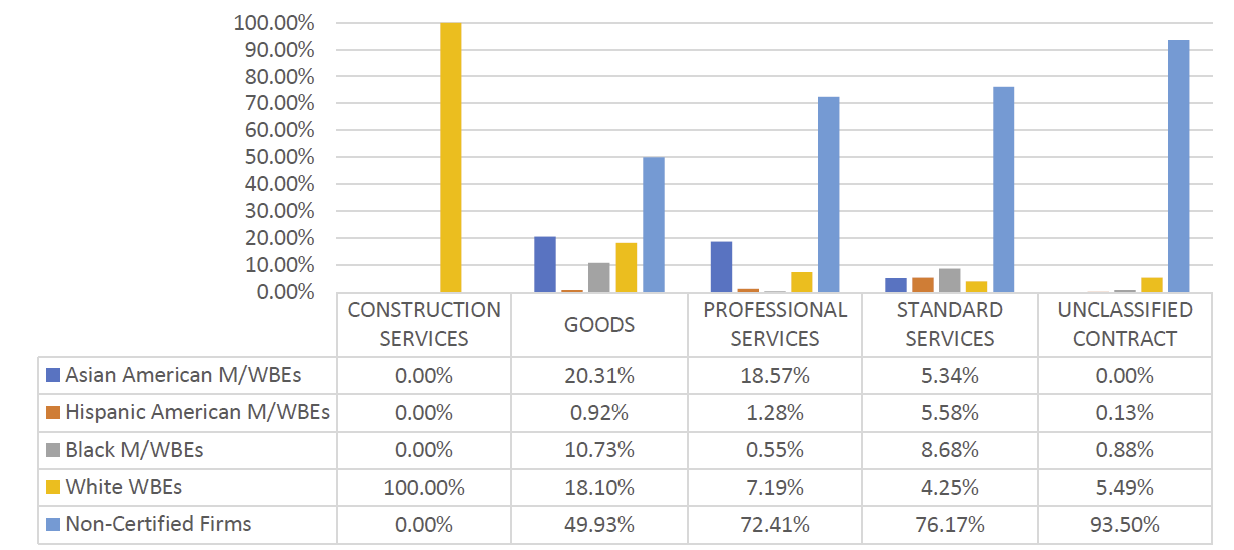
Table 151: LL 174-Eligible Approved Subcontracts – FY20-22
| Certification Status | # of Contracts | % Share of Contracts | Total Registered Contract Value | % Share of Registered Contract Value |
| FY20 | 3 | N/A | $8,020,000 | N/A |
| Sub – Non-Certified | 3 | 100.00% | $8,020,000 | 100.00% |
Table 152: LL 174-Eligible Prime Spend, FY20-22
| M/WBE Category | FY20 | FY21 | FY22 | |||
|---|---|---|---|---|---|---|
| Spend | % Share | Spend | % Share | Spend | % Share | |
| M/WBE ALL | $3,226,837 | 6.54% | $3,970,579 | 9.51% | $4,574,557 | 8.30% |
| Non-Certified | $46,148,222 | 93.46% | $37,801,551 | 90.49% | $50,510,331 | 91.70% |
| Total | $49,375,059 | 100.00% | $41,772,130 | 100.00% | $55,084,888 | 100.00% |
Landmarks Preservation Commission (LPC)
LPC has a very small contracting portfolio, only registering one new LL 174-eligible contract and 48 POs in FY22 (valuing about $225,000). Though small, the share of this contract value registered to M/WBEs is higher than the Citywide average (42.17%). LPC registered a higher percentage of contract value to Hispanic American women-owned MBEs than most agencies (17%). There were zero approved subcontractors for LL 174-eligible contracts in PIP for FY20, FY21, or FY22. The share of LL 174-eligible spending with M/WBE primes has exceeded 34% each year since FY20. There was no recorded LL 174-eligible subcontract spending since FY20
Table 153: LL 174-Eligible Contracts and POS – FY20-22
| Certification Status | # of Contracts | % Share of Contracts | Total Registered Contract Value | % Share of Registered Contract Value |
| FY20 | 44 | N/A | $294,832 | N/A |
| Non-Certified | 28 | 63.64% | $153,963 | 52.22% |
| M/WBE | 16 | 36.36% | $140,868 | 47.78% |
| FY21 | 32 | N/A | $263,004 | N/A |
| Non-Certified | 19 | 59.38% | $192,521 | 73.20% |
| M/WBE | 13 | 40.63% | $70,482 | 26.80% |
| FY22 | 49 | N/A | $224,213 | N/A |
| Non-Certified | 30 | 61.22% | $129,672 | 57.83% |
| M/WBE | 19 | 38.78% | $94,541 | 42.17% |
| Grand Total | 125 | N/A | $782,050 | N/A |
Chart 125: FY22 Value of LL 174-Eligible Prime Contracts and POs
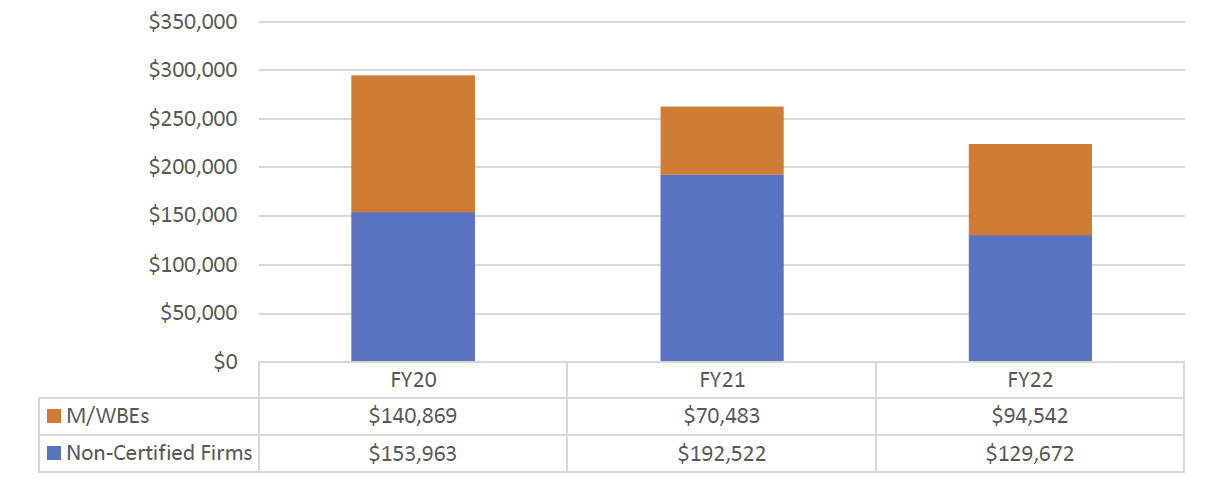
Chart 126: FY22 Value of LL 174-Eligible Contracts and POs, by Race and Gender
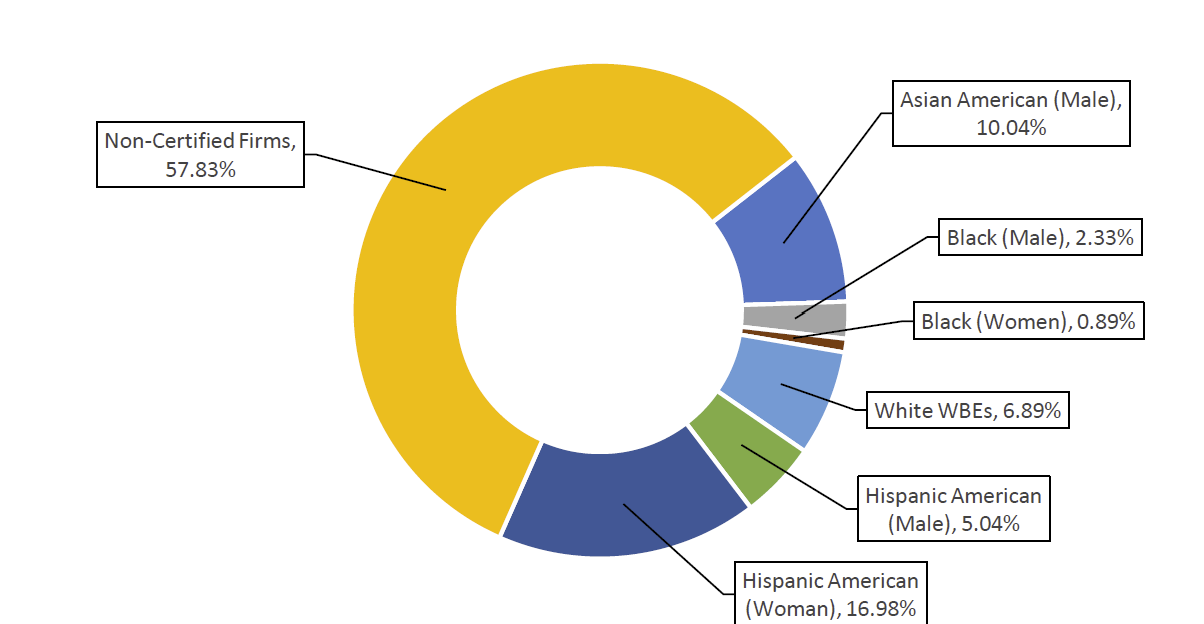
Table 154: Registered M/WBE NCSPs – FY20-22
| FY | Count | Total Value | AVG Value | Citywide AVG Value |
| FY20 | 0 | $0 | $0 | $79,27 |
| FY21 | 1 | $22,500 | $22,500 | $105,121 |
| FY22 | 1 | $22,500 | $22,500 | $134,907 |
| Grand Total | 2 | $45,000 | $22,500 | $104,232 |
Chart 127: Share of M/WBE Contracts Registered Late – FY20-22
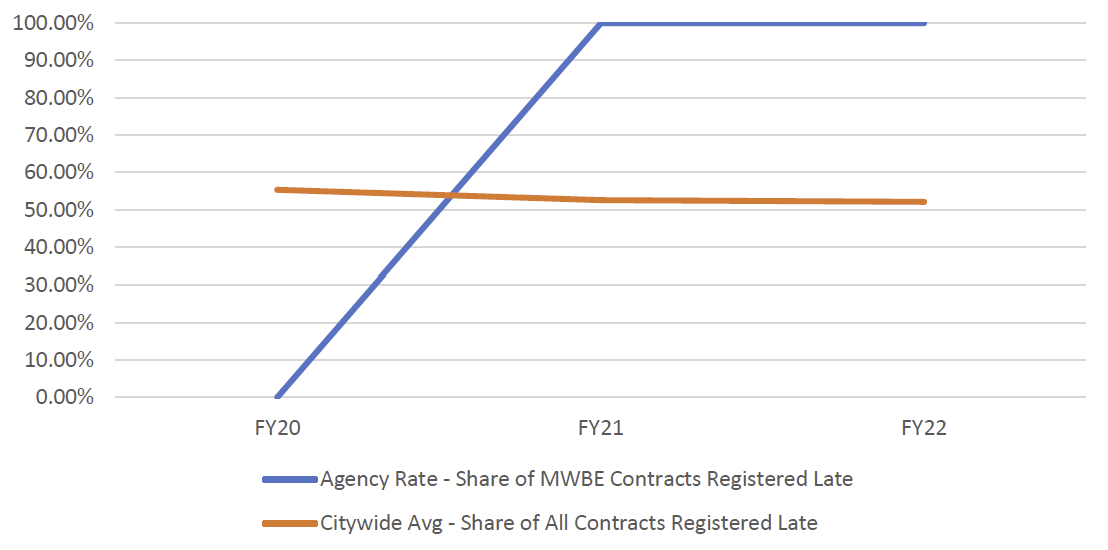
Chart 128: FY22 Contract and PO Value, by M/WBE Category and Industry
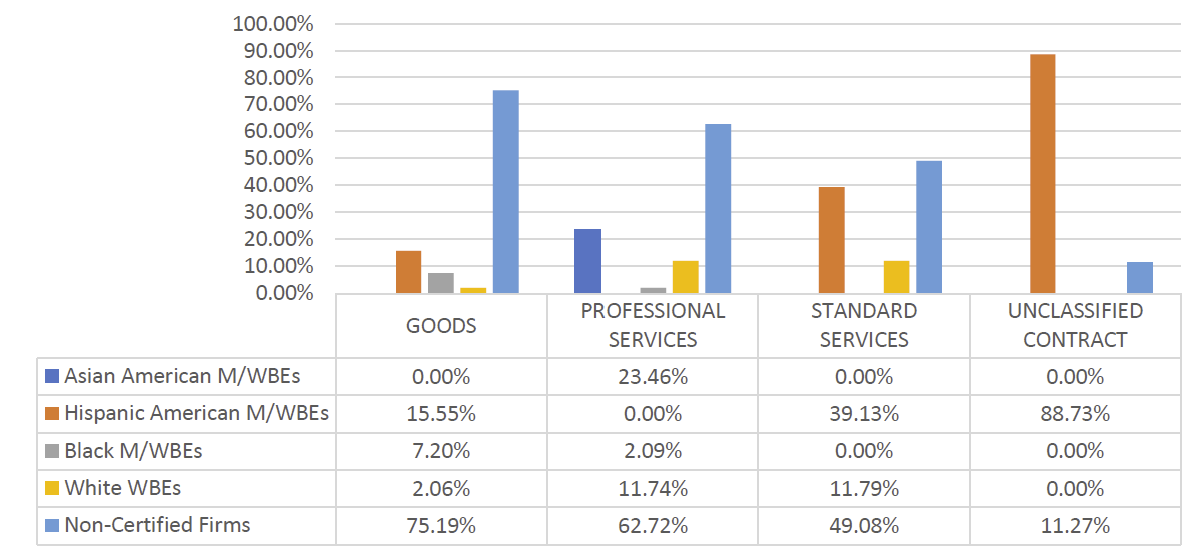
Table 155: LL 174-Eligible Prime Spend– FY20-22
|
M/WBE Category |
FY20 | FY21 | FY22 | |||
|---|---|---|---|---|---|---|
| Spend | % Share | Spend | % Share | Spend | % Share | |
| M/WBE ALL | $86,769 | 34.30% | $130,725 | 50.82% | $130,802 | 40.65% |
| Non-Certified | $166,203 | 65.70% | $126,507 | 49.18% | $191,008 | 59.35% |
| Total | $252,972 | 100.00% | $257,232 | 100.00% | $321,811 | 100.00% |
Mayoralty (MAYOR)
The Mayor is the City’s chief executive officer, setting the agenda for the City and its finances and appointing Deputy Mayors and heads of agencies to carry out policies. Various offices operate under the Mayor to support numerous administrative and policy functions. The Mayoralty largely contracts with vendors for human services, which are exempt from LL 174 participation goals. Therefore, the data included here only represents a share of the Mayoralty’s total procurement portfolio. The Mayoralty registered 50 new contracts and 371 POs eligible for LL 174 participation goals in FY22 valuing nearly $47 million. The share of registered contract value and count of contracts registered to M/WBEs is consistent with Citywide averages. Most of the contract value registered to M/WBEs was registered to businesses owned by white women. The share of the value of LL 174-eligible spending with M/WBEs primes was much lower than the Citywide average at 3.45% in FY22, however 100% of LL 174-eligible sub vendor spending has gone to M/WBEs since FY21. As is the case with most human services agencies, the Mayoralty has higher rates of retroactivity than the Citywide average (84.38%), though this has improved since FY21.
Table 156: LL 174-Eligible Contracts and POS – FY20-22
| Certification Status | # of Contracts | % Share of Contracts | Total Registered Contract Value | % Share of Registered Contract Value |
| FY20 | 417 | N/A | $7,721,259 | N/A |
| Non-Certified | 292 | 70.02% | $4,467,004 | 57.85% |
| M/WBE | 125 | 29.98% | $3,254,255 | 42.15% |
| FY21 | 331 | N/A | $98,897,179 | N/A |
| Non-Certified | 218 | 65.86% | $94,983,440 | 96.04% |
| M/WBE | 113 | 34.14% | $3,913,738 | 3.96% |
| FY22 | 421 | N/A | $46,709,075 | N/A |
| Non-Certified | 238 | 56.53% | $39,438,247 | 84.43% |
| M/WBE | 183 | 43.47% | $7,270,828 | 15.57% |
| Grand Total | 1,169 | N/A | $153,327,514 | N/A |
Chart 129: FY22 Value of LL 174-Eligible Prime Contracts and POs
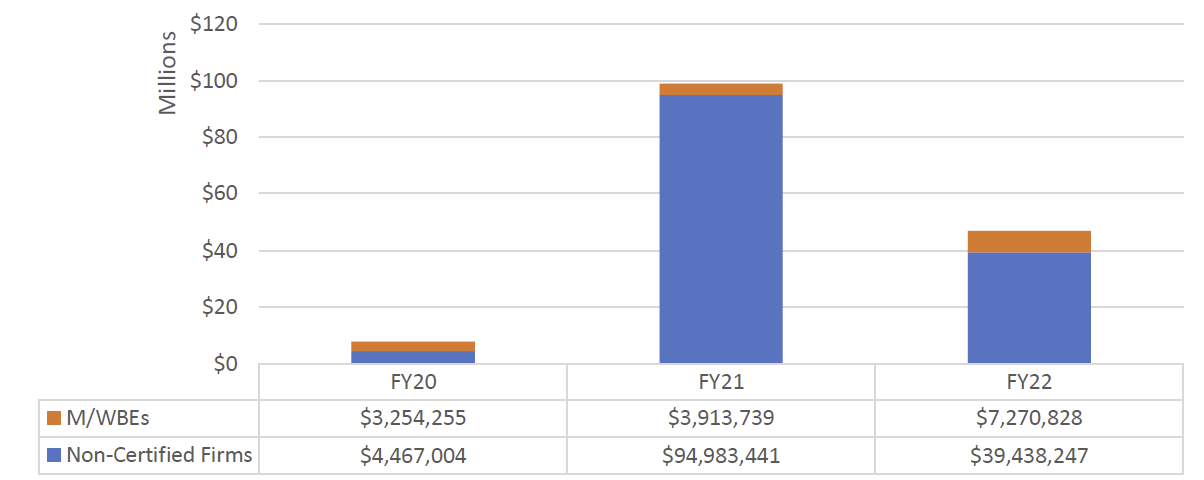
Chart 130: FY22 Value of LL 174-Eligible Contracts and POs, by Race and Gender
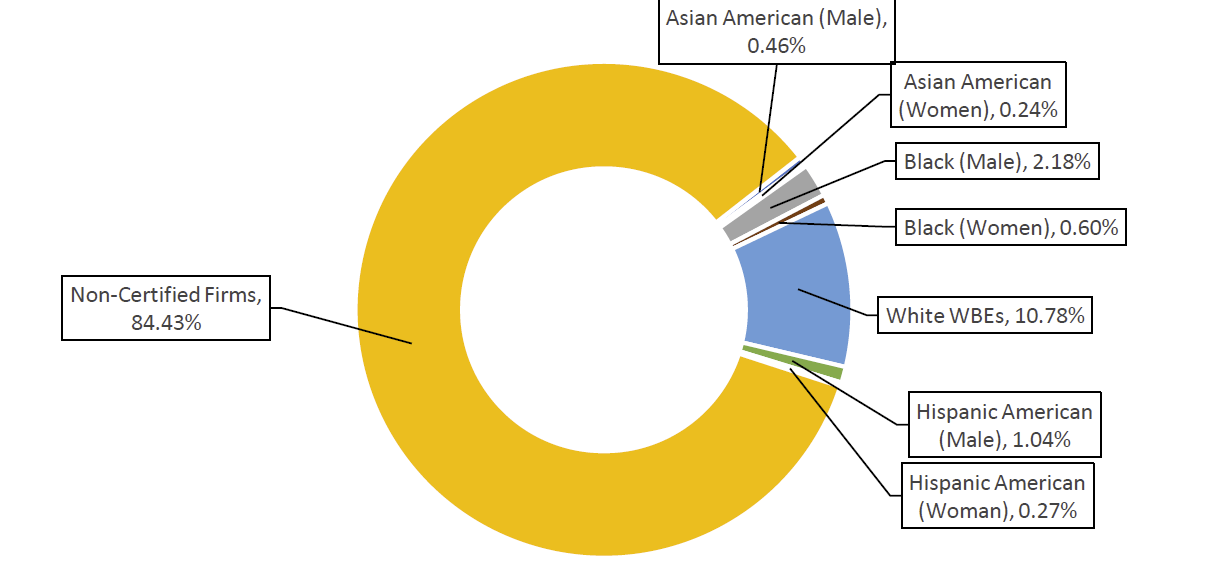
Table 157: Registered M/WBE NCSPs – FY20-22
| FY | Count | Total Value | AVG Value | Citywide AVG Value |
| FY20 | 28 | $2,470,418 | $88,229 | $79,27 |
| FY21 | 36 | $3,889,291 | $108,036 | $105,121 |
| FY22 | 25 | $2,372,122 | $94,885 | $134,907 |
| Grand Total | 89 | $8,731,831 | $98,110 | $104,232 |
Chart 131: Share of M/WBE Contracts Registered Late – FY20-22
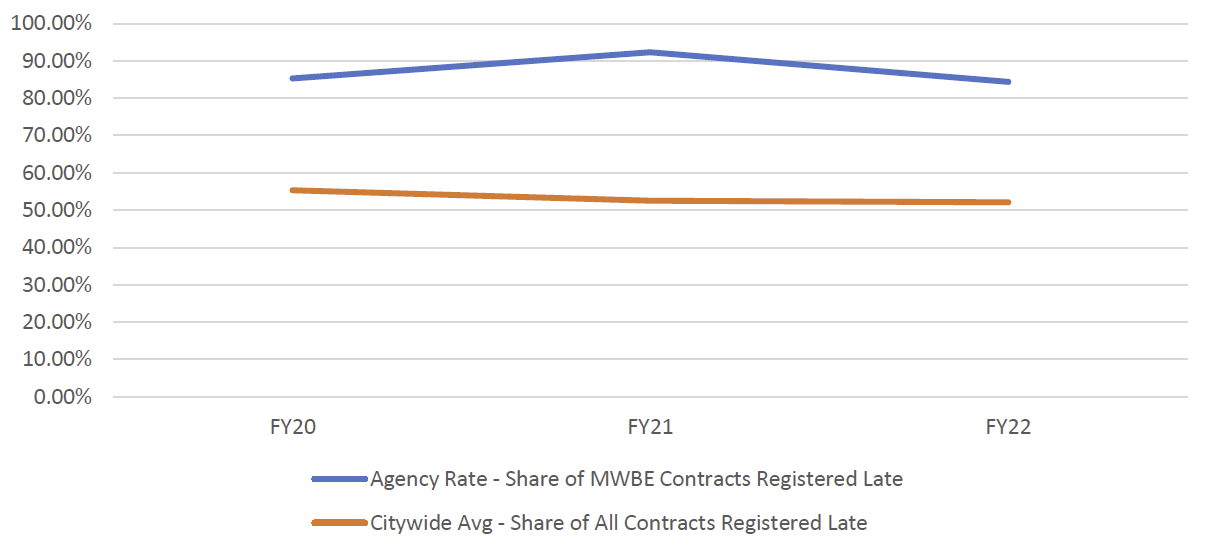
Chart 132: FY22 Contract and PO Value, by M/WBE Category and Industry
Table 158: LL 174-Eligible Approved Subcontracts – FY20-22
| Certification Status | # of Contracts | % Share of Contracts | Total Registered Contract Value | % Share of Registered Contract Value |
| FY20 | 4 | N/A | $70,880 | N/A |
| Sub – Non-Certified | 4 | 100.00% | $70,880 | 100.00% |
| FY21 | 3 | N/A | $349,132 | N/A |
| Sub – Non-Certified | 3 | 100.00% | $349,132 | 100.00% |
| FY22 | 9 | N/A | $144,220 | N/A |
| Sub – Non-Certified | 4 | 44.44% | $60,720 | 42.10% |
| Sub – M/WBE | 5 | 55.56% | $83,500 | 57.90% |
Table 159: LL 174-Eligible Prime Spend, FY20-22
| M/WBE Category | FY20 | FY21 | FY22 | |||
|---|---|---|---|---|---|---|
| Spend | % Share | Spend | % Share | Spend | % Share | |
| M/WBE ALL | $4,792,117 | 7.35% | $4,417,667 | 5.58% | $4,511,135 | 3.45% |
| Non-Certified | $60,418,971 | 92.65% | $74,788,125 | 94.42% | $126,084,069 | 96.55% |
| Total | $65,211,087 | 100.00% | $79,205,792 | 100.00% | $130,595,204 | 100.00% |
Table 160: LL 174-Eligible Sub Vendor Spend, FY20-22
| M/WBE Category | FY20 | FY21 | FY22 | |||
|---|---|---|---|---|---|---|
| Spend | % Share | Spend | % Share | Spend | % Share | |
| M/WBE ALL | $0 | 0.00% | $94,770 | 100.00% | $202,053 | 100.00% |
| Non-Certified | $84,032 | 100.00% | $0 | 0.00% | $0 | 0.00% |
| Total | $84,032 | 100.00% | $94,770 | 100.00% | $202,053 | 100.00% |
NYC Office of Emergency Management (NYCEM)
NYCEM registered over a hundred Emergency contracts in FY22, which are exempt from LL 174 participation goals. The data included here therefore represents a smaller share of the volume of NYCEM’s total procurement portfolio. NYCEM registered 49 new contracts and 237 POs eligible for LL 174 participation goals in FY22, totaling nearly $47 million. Of these, the share of contract value registered to M/WBEs is higher than the Citywide average (30.38%), which is a significant increase from FY21’s 1.53%. NYCEM has higher rates of retroactivity than the Citywide average, which has declined since FY21. NYCEM’s share of LL 174-eligible prime spending with M/WBEs declined each year since FY20. In FY22, 87% of NYCEM’s LL 174-eligible subcontractor spending went to M/WBE sub vendors, roughly 37% of which included Black M/WBEs.
Table 161: LL 174-Eligible Contracts and POS – FY20-22
| Certification Status | # of Contracts | % Share of Contracts | Total Registered Contract Value | % Share of Registered Contract Value |
| FY20 | 372 | N/A | $26,636,769 | N/A |
| Non-Certified | 248 | 66.67% | $23,895,996 | 89.71% |
| M/WBE | 124 | 33.33% | $2,740,772 | 10.29% |
| FY21 | 296 | N/A | $75,439,219 | N/A |
| Non-Certified | 190 | 64.19% | $74,286,079 | 98.47% |
| M/WBE | 106 | 35.81% | $1,153,139 | 1.53% |
| FY22 | 286 | N/A | $46,826,911 | N/A |
| Non-Certified | 185 | 64.69% | $32,600,419 | 69.62% |
| M/WBE | 101 | 35.31% | $14,226,491 | 30.38% |
| Grand Total | 954 | N/A | $148,902,901 | N/A |
Chart 133: FY22 Value of LL 174-Eligible Prime Contracts and POs
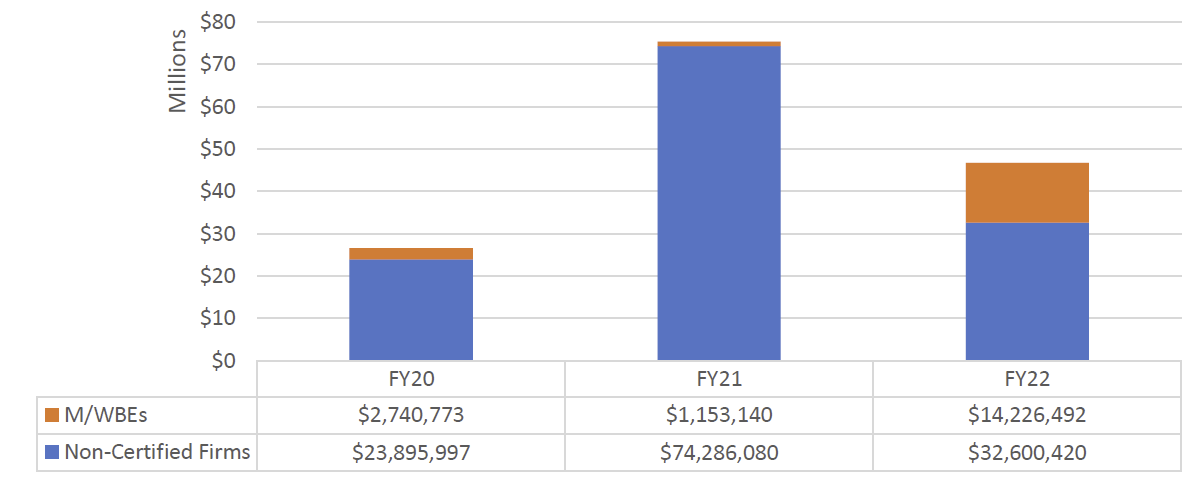
Chart 134: FY22 Value of LL 174-Eligible Contracts and POs, by Race and Gender
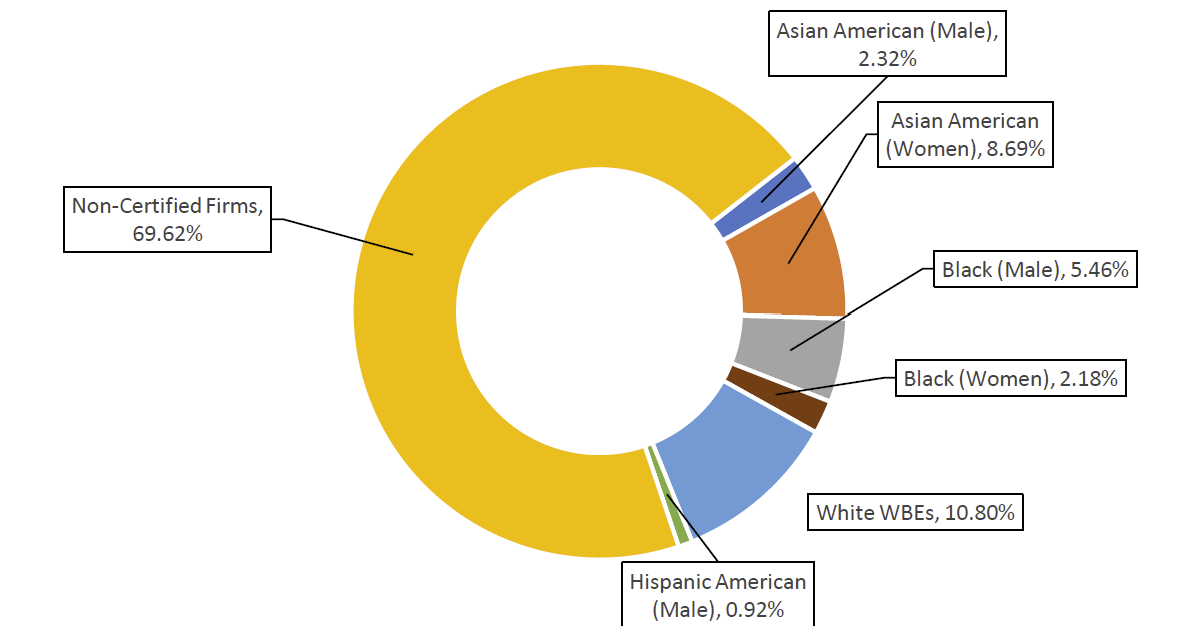
Table 162: Registered M/WBE NCSPs – FY20-22
| FY | Count | Total Value | AVG Value | Citywide AVG Value |
| FY20 | 13 | $1,601,454 | $123,189 | $79,27 |
| FY21 | 7 | $287,644 | $41,092 | $105,121 |
| FY22 | 10 | $898,725 | $89,873 | $134,907 |
| Grand Total | 30 | $2,787,823 | $92,927 | $104,232 |
Chart 135: Share of M/WBE Contracts Registered Late – FY20-22
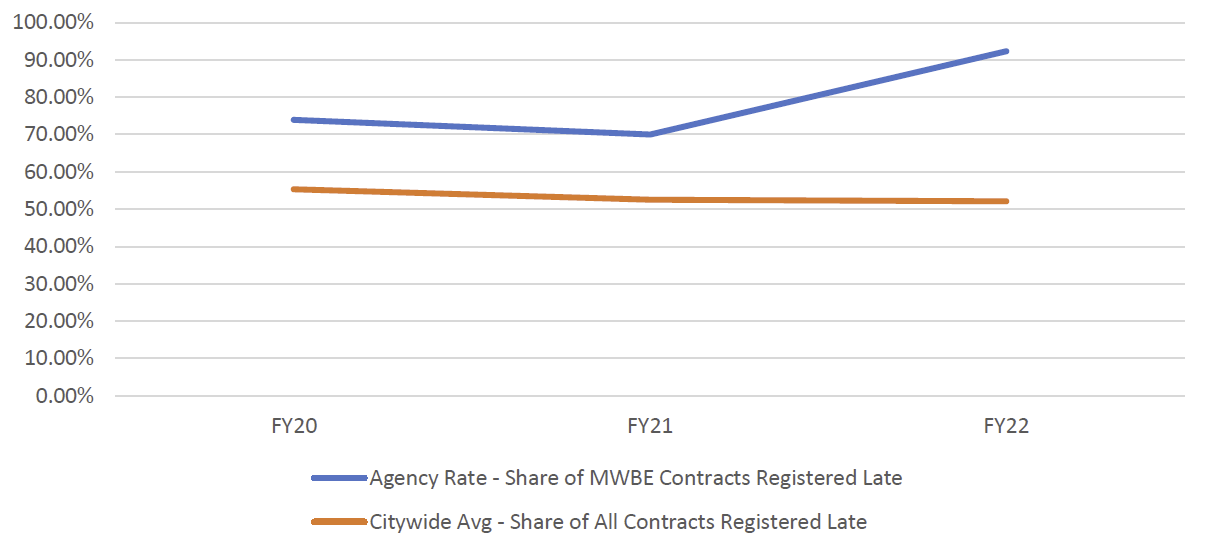
Chart 136: FY22 Contract and PO Value, by M/WBE Category and Industry
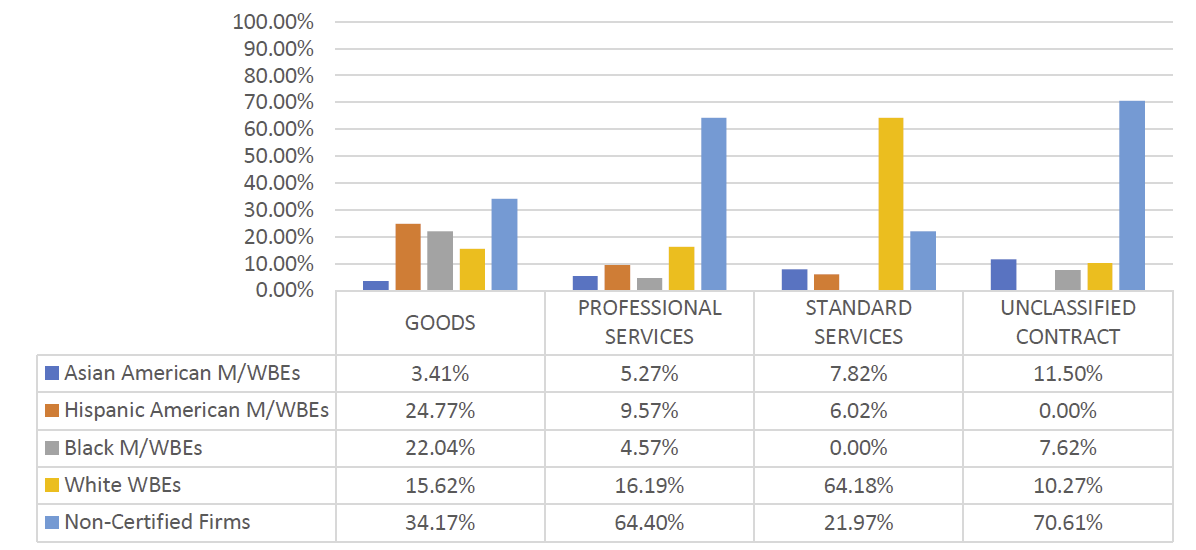
Table 163: LL 174-Eligible Approved Subcontracts – FY20-22
| Certification Status | # of Contracts | % Share of Contracts | Total Registered Contract Value | % Share of Registered Contract Value |
| FY20 | 10 | N/A | $16,800,000 | N/A |
| Sub – Non-Certified | 10 | 100.00% | $16,800,000 | 100.00% |
Table 164: LL 174-Eligible Prime Spend, FY20-22
|
M/WBE Category |
FY20 | FY21 | FY22 | |||
|---|---|---|---|---|---|---|
| Spend | % Share | Spend | % Share | Spend | % Share | |
| M/WBE ALL | $3,065,719 | 11.91% | $7,356,684 | 9.28% | $1,932,584 | 7.95% |
| Non-Certified | $22,673,896 | 88.09% | $71,903,895 | 90.72% | $22,379,313 | 92.05% |
| Total | $25,739,615 | 100.00% | $79,260,580 | 100.00% | $24,311,897 | 100.00% |
Table 165: LL 174-Eligible Sub Vendor Spend, FY20-22
| M/WBE Category | FY20 | FY21 | FY22 | |||
|---|---|---|---|---|---|---|
| Spend | % Share | Spend | % Share | Spend | % Share | |
| M/WBE ALL | $178,010 | 100.00% | $2,247,882 | 96.04% | $2,663,396 | 87.74% |
| Non-Certified | $0 | 0.00% | $92,638 | 3.96% | $372,146 | 12.26% |
| Total | $178,010 | 100.00% | $2,340,519 | 100.00% | $3,035,543 | 100.00% |
New York Police Department (NYPD)
NYPD mostly purchases Goods and is in the top five agencies by count of recorded POs in FY22. NYPD registered 2,486 POs and 260 new LL 174-eligible contracts, totaling a large LL 174-eligible procurement budget of over $73 million. Of this, the share of contract value registered to M/WBEs is higher than the Citywide average (38.56%). The share of LL 174-eligible M/WBE prime spend increased each year since FY20 and slightly exceeded Citywide averages in FY22 (29.06%). NYPD spent a higher percentage of funds with Asian American women-owned MBEs than most agencies (15.34%). Nearly all NYPD approved subcontractors in PIP are non-certified firms, though since FY20 more than 50% of NYPD subcontractor spending has been with M/WBEs. Over 70% of contracts were registered after the start date of the contract.
Table 166: LL 174-Eligible Contracts and POS – FY20-22
| Certification Status | # of Contracts | % Share of Contracts | Total Registered Contract Value | % Share of Registered Contract Value |
| FY20 | 2,880 | N/A | $44,551,021 | N/A |
| Non-Certified | 2,111 | 73.30% | $24,003,671 | 53.88% |
| M/WBE | 769 | 26.70% | $20,547,350 | 46.12% |
| FY21 | 2,405 | N/A | $93,937,337 | N/A |
| Non-Certified | 1,670 | 69.44% | $67,881,122 | 72.26% |
| M/WBE | 735 | 30.56% | $26,056,215 | 27.74% |
| FY22 | 2,746 | N/A | $73,468,111 | N/A |
| Non-Certified | 1,770 | 64.46% | $45,135,509 | 61.44% |
| M/WBE | 976 | 35.54% | $28,332,601 | 38.56% |
| Grand Total | 8,031 | N/A | $211,956,470 | N/A |
Chart 137: FY22 Value of LL 174-Eligible Prime Contracts and POs
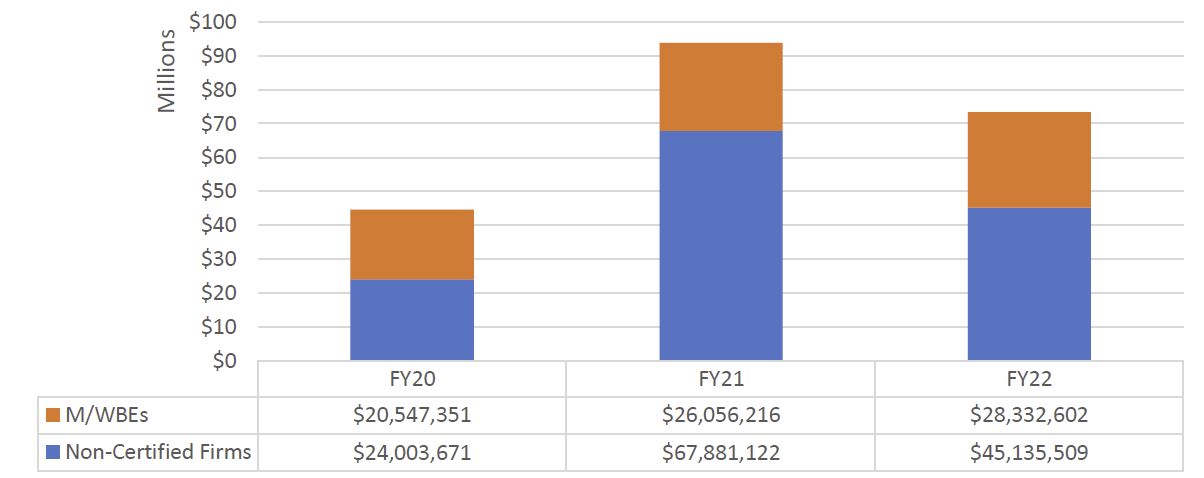
Chart 138: FY22 Value of LL 174-Eligible Contracts and POs, by Race and Gender
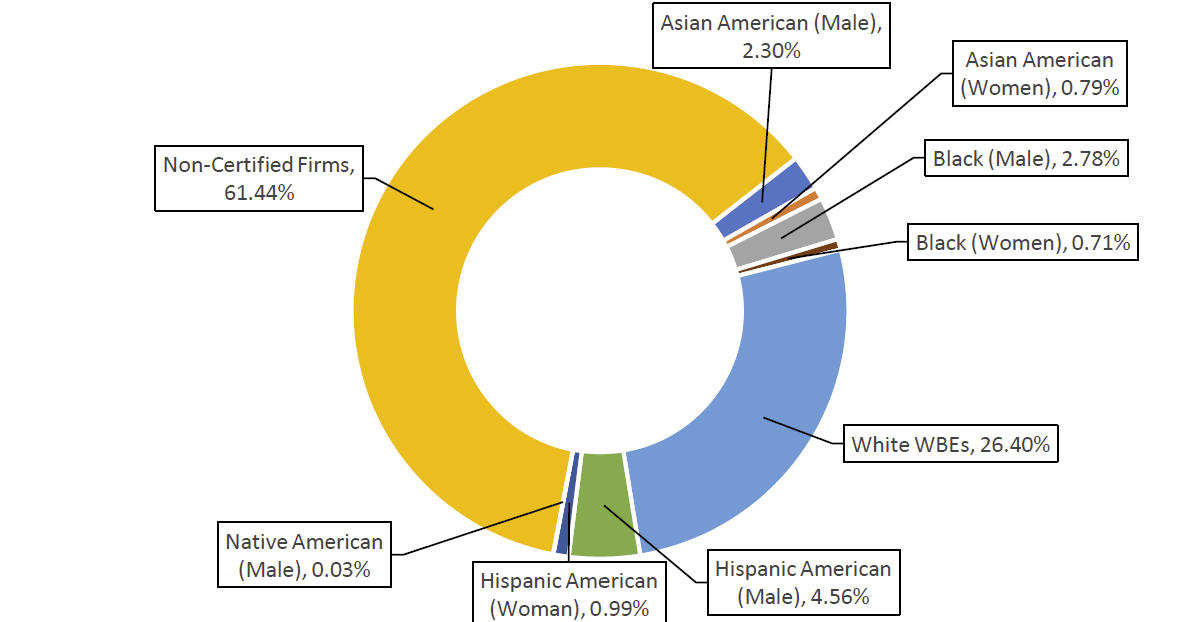
Table 167: Registered M/WBE NCSPs – FY20-22
| FY | Count | Total Value | AVG Value | Citywide AVG Value |
| FY20 | 94 | $5,295,940 | $56,340 | $79,27 |
| FY21 | 23 | $3,991,790 | $173,556 | $105,121 |
| FY22 | 23 | $3,938,366 | $171,233 | $134,907 |
| Grand Total | 140 | $13,226,096 | $94,472 | $104,232 |
Chart 139: Share of M/WBE Contracts Registered Late – FY20-22
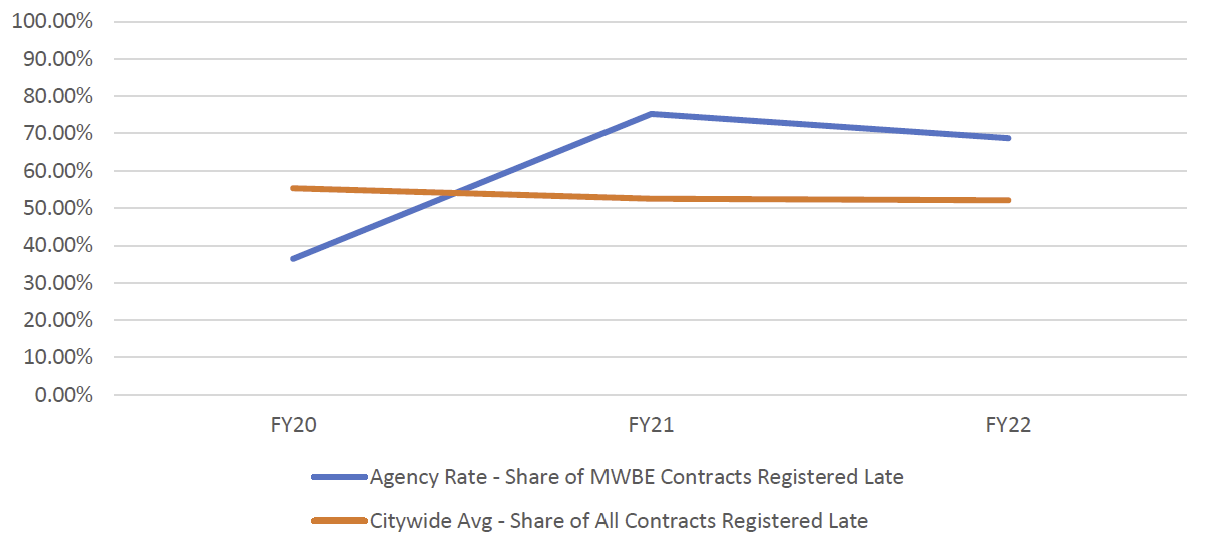
Chart 140: FY22 Contract and PO Value, by M/WBE Category and Industry
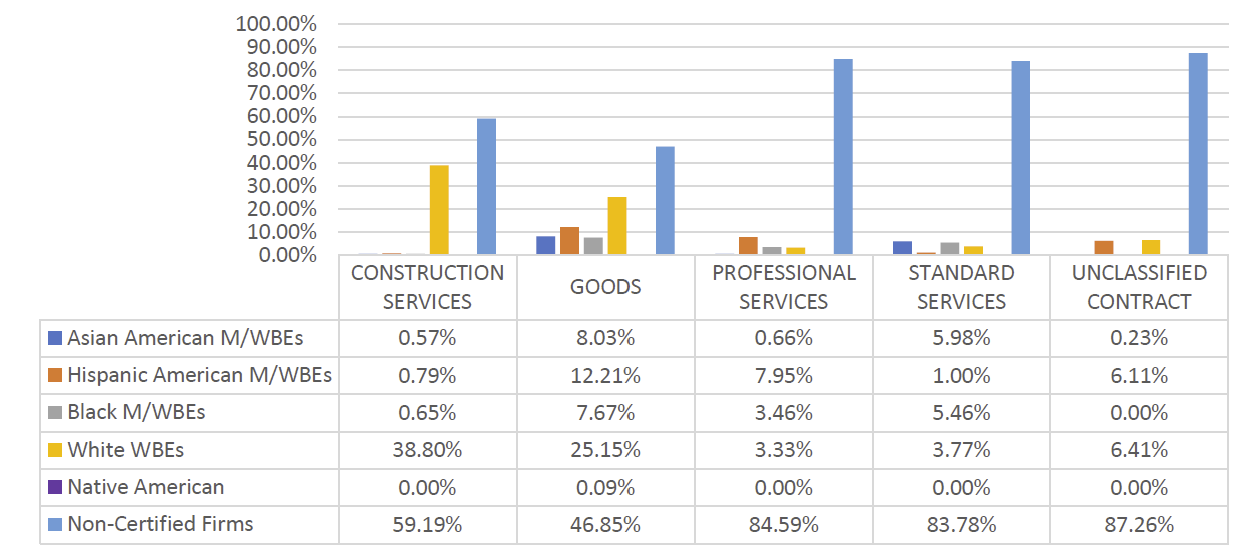
Table 168: LL 174-Eligible Approved Subcontracts – FY20-22
| Certification Status | # of Contracts | % Share of Contracts | Total Registered Contract Value | % Share of Registered Contract Value |
| FY20 | 8 | N/A | $4,157,360 | N/A |
| Sub – Non-Certified | 5 | 62.50% | $1,316,000 | 31.65% |
| Sub – M/WBE | 3 | 37.50% | $2,841,360 | 68.35% |
| FY21 | 19 | N/A | $11,672,222 | N/A |
| Sub – Non-Certified | 19 | 100.00% | $11,672,222 | 100.00% |
| FY22 | 7 | N/A | $10,542,942 | N/A |
| Sub – Non-Certified | 6 | 85.71% | $10,500,000 | 99.59% |
| Sub – M/WBE | 1 | 14.29% | $42,942 | 0.41% |
Table 169: LL 174-Eligible Prime Spend, FY20-22
| M/WBE Category | FY20 | FY21 | FY22 | |||
|---|---|---|---|---|---|---|
| Spend | % Share | Spend | % Share | Spend | % Share | |
| M/WBE ALL | $81,305,886 | 20.65% | $72,810,353 | 21.55% | $100,728,085 | 29.06% |
| Non-Certified | $312,351,202 | 79.35% | $265,079,656 | 78.45% | $245,916,431 | 70.94% |
| Total | $393,657,087 | 100.00% | $337,890,008 | 100.00% | $346,644,517 | 100.00% |
Table 170: LL 174-Eligible Sub Vendor Spend, FY20-22
| M/WBE Category | FY20 | FY21 | FY22 | |||
|---|---|---|---|---|---|---|
| Spend | % Share | Spend | % Share | Spend | % Share | |
| M/WBE ALL | $4,381,769 | 53.87% | $2,647,765 | 57.44% | $1,329,768 | 58.72% |
| Non-Certified | $3,752,335 | 46.13% | $1,961,897 | 42.56% | $934,876 | 41.28% |
| Total | $8,134,103 | 100.00% | $4,609,662 | 100.00% | $2,264,644 | 100.00% |
Office of Administrative Trials and Hearings (OATH)
OATH has a small contracting portfolio, registering nine new contracts and 106 POs in FY22 (valuing about $1.4 million). Though small, the share of contract value registered to M/WBEs is higher than the citywide average (57.55%). OATH has also contracted with most underutilized M/WBE Categories: 14.44% of contract value was registered to Asian American women-owned MBEs, 24% registered to Hispanic American M/WBEs, and 14% registered to Black M/WBEs in Professional Services and Goods. 87.5% of OATH contracts were registered after the contract start date, though this is a slight improvement from prior fiscal years. There were zero approved subcontractors in PIP for FY20, FY21, or FY22. The share of LL 174-elgible prime spending with M/WBEs has increased each year since FY20, reaching over 25% in FY22. There was no recorded LL 174-eligible subcontract spending since FY20.
Table 171: LL 174-Eligible Contracts and POS – FY20-22
| Certification Status | # of Contracts | % Share of Contracts | Total Registered Contract Value | % Share of Registered Contract Value |
| FY20 | 125 | N/A | $906,692 | N/A |
| Non-Certified | 52 | 41.60% | $215,220 | 23.74% |
| M/WBE | 73 | 58.40% | $691,472 | 76.26% |
| FY21 | 77 | N/A | $584,106 | N/A |
| Non-Certified | 33 | 42.86% | $159,311 | 27.27% |
| M/WBE | 44 | 57.14% | $424,794 | 72.73% |
| FY22 | 115 | N/A | $1,395,351 | N/A |
| Non-Certified | 41 | 35.65% | $592,281 | 42.45% |
| M/WBE | 74 | 64.35% | $803,069 | 57.55% |
| Grand Total | 317 | N/A | $2,886,150 | N/A |
Chart 141: FY22 Value of LL 174-Eligible Prime Contracts and POs
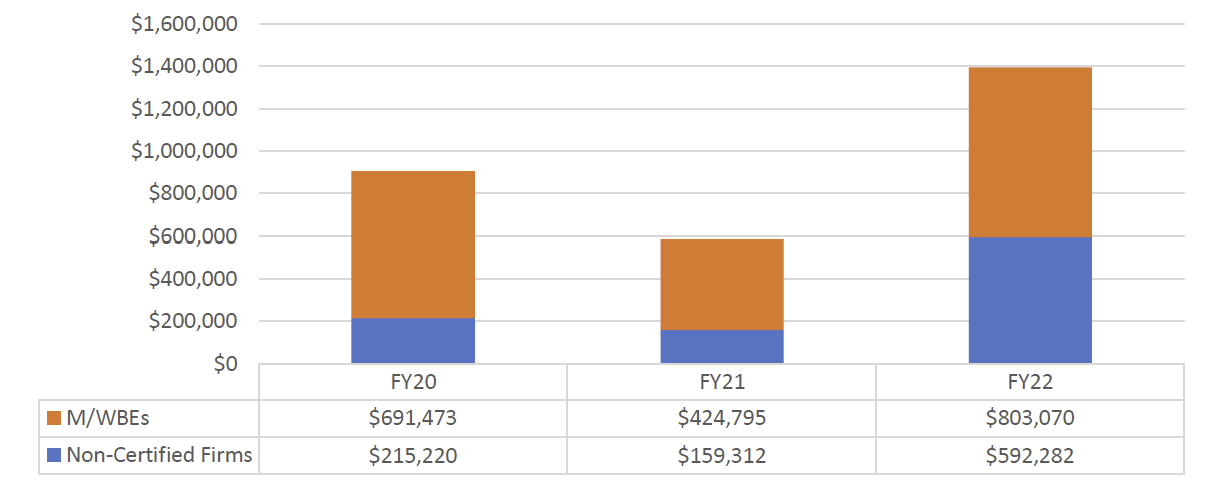
Chart 142: FY22 Value of LL 174-Eligible Contracts and POs, by Race and Gender
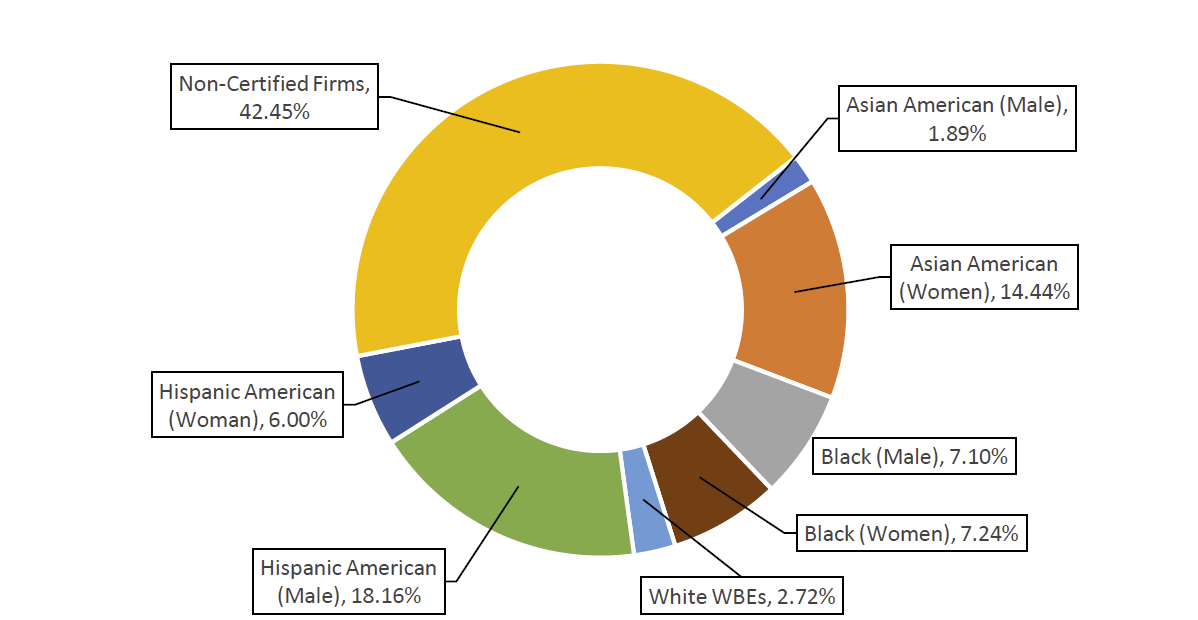
Table 172: Registered M/WBE NCSPs – FY20-22
| FY | Count | Total Value | AVG Value | Citywide AVG Value |
| FY20 | 7 | $483,020 | $69,003 | $79,27 |
| FY21 | 3 | $218,547 | $72,849 | $105,121 |
| FY22 | 8 | $548,806 | $68,601 | $134,907 |
| Grand Total | 18 | $1,250,373 | $69,465 | $104,232 |
Chart 143: Share of M/WBE Contracts Registered Late – FY20-22
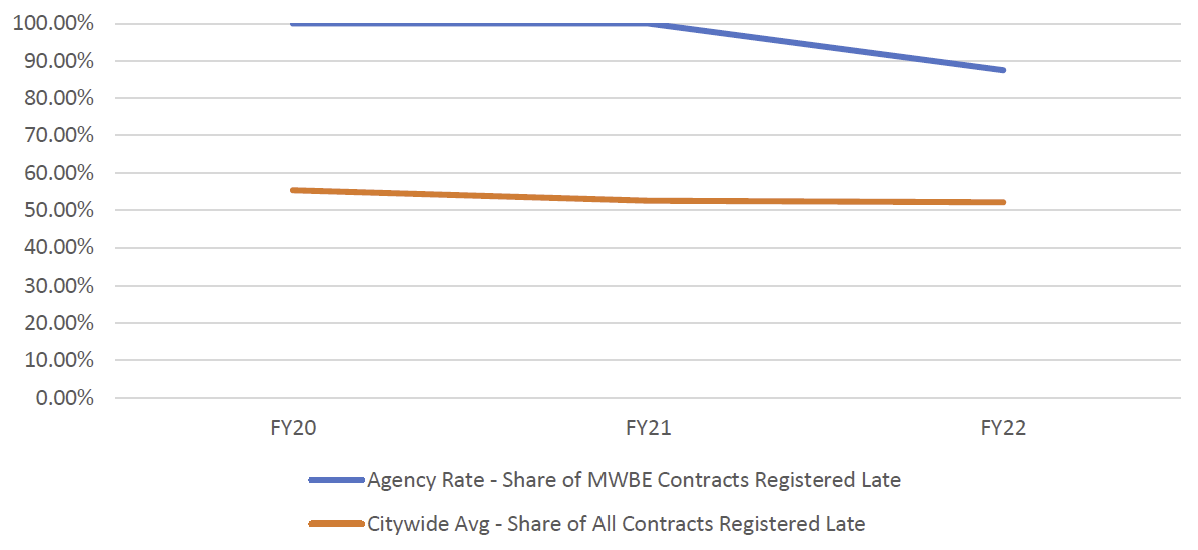
Chart 144: FY22 Contract and PO Value, by M/WBE Category and Industry
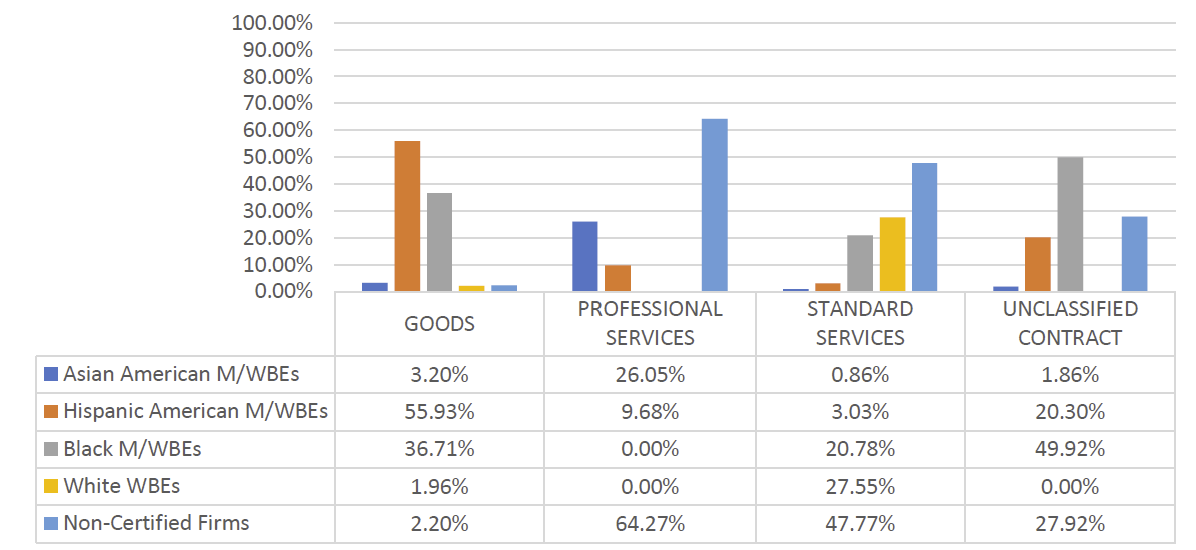
Table 173: LL 174-Eligible Prime Spend– FY20-22
| M/WBE Category | FY20 | FY21 | FY22 | |||
|---|---|---|---|---|---|---|
| Spend | % Share | Spend | % Share | Spend | % Share | |
| M/WBE ALL | $525,792 | 11.17% | $403,149 | 17.68% | $665,282 | 25.25% |
| Non-Certified | $4,183,244 | 88.83% | $1,877,747 | 82.32% | $1,969,794 | 74.75% |
| Total | $4,709,036 | 100.00% | $2,280,896 | 100.00% | $2,635,076 | 100.00% |
Office of Technology and Innovation (OTI)
OTI has a very large procurement portfolio, including high-value Intergovernmental Procurements and Renewals that are exempt from LL 174 participation goals. OTI procured three of the top ten most valuable Professional Services contracts in FY22. The data included here represents only a small share of OTI’s procurements. OTI procured nearly $67 million in LL 174-eligible contracts in FY22, which is a significant decrease from FY20. The share of this contract value that was registered to M/WBEs is higher than the citywide average (37%). OTI registered a higher percentage of contract value to underutilized categories, mostly for Goods and Professional Services, including Asian American women-owned MBEs (9%), Black M/WBEs (5%) and Hispanic American M/WBEs (4%). OTI utilized the M/WBE NCSP method more often than most agencies (99 times), with a higher average value than most agencies ($171,793). OTI registered more late contracts in FY22 than in prior FYs (85% in FY22, compared to 50% in FY20). While the value of LL 174 spending for both M/WBE prime and sub vendors increased each year since FY22, the overall share relative to non-certified firms has declined since FY20.
Table 174: LL 174-Eligible Contracts and POS – FY20-22
| Certification Status | # of Contracts | % Share of Contracts | Total Registered Contract Value | % Share of Registered Contract Value |
| FY20 | 370 | N/A | $297,414,765 | N/A |
| Non-Certified | 140 | 37.84% | $208,407,992 | 70.07% |
| M/WBE | 230 | 62.16% | $89,006,772 | 29.93% |
| FY21 | 326 | N/A | $150,429,382 | N/A |
| Non-Certified | 125 | 38.34% | $138,658,520 | 92.18% |
| M/WBE | 201 | 61.66% | $11,770,862 | 7.82% |
| FY22 | 454 | N/A | $66,906,419 | N/A |
| Non-Certified | 191 | 42.07% | $42,002,588 | 62.78% |
| M/WBE | 263 | 57.93% | $24,903,831 | 37.22% |
| Grand Total | 1,150 | N/A | $514,750,567 | N/A |
Chart 145: FY22 Value of LL 174-Eligible Prime Contracts and POs
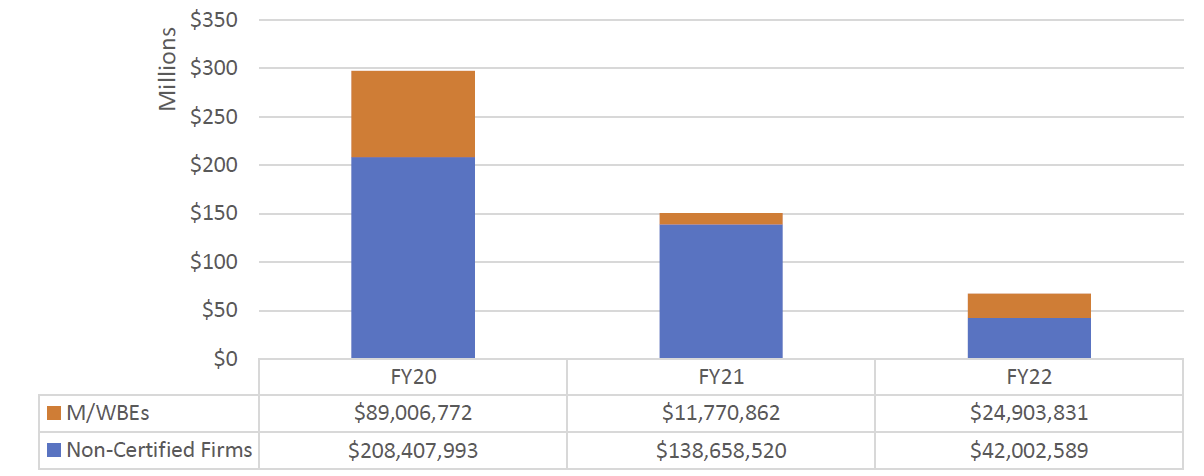
Chart 146: FY22 Value of LL 174-Eligible Contracts and POs, by Race and Gender
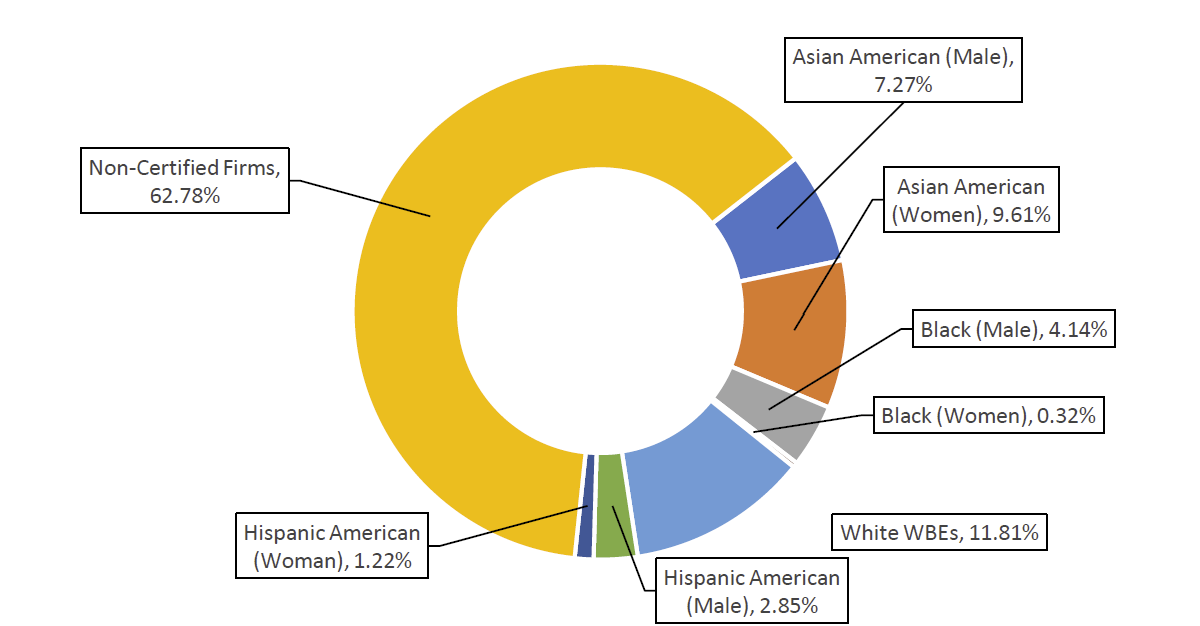
Table 175: Registered M/WBE NCSPs – FY20-22
| FY | Count | Total Value | AVG Value | Citywide AVG Value |
| FY20 | 77 | $5,338,445 | $69,330 | $79,27 |
| FY21 | 85 | $9,565,421 | $112,534 | $105,121 |
| FY22 | 99 | $17,007,508 | $171,793 | $134,907 |
| Grand Total | 261 | $31,911,374 | $122,266 | $104,232 |
Chart 147: Share of M/WBE Contracts Registered Late – FY20-22
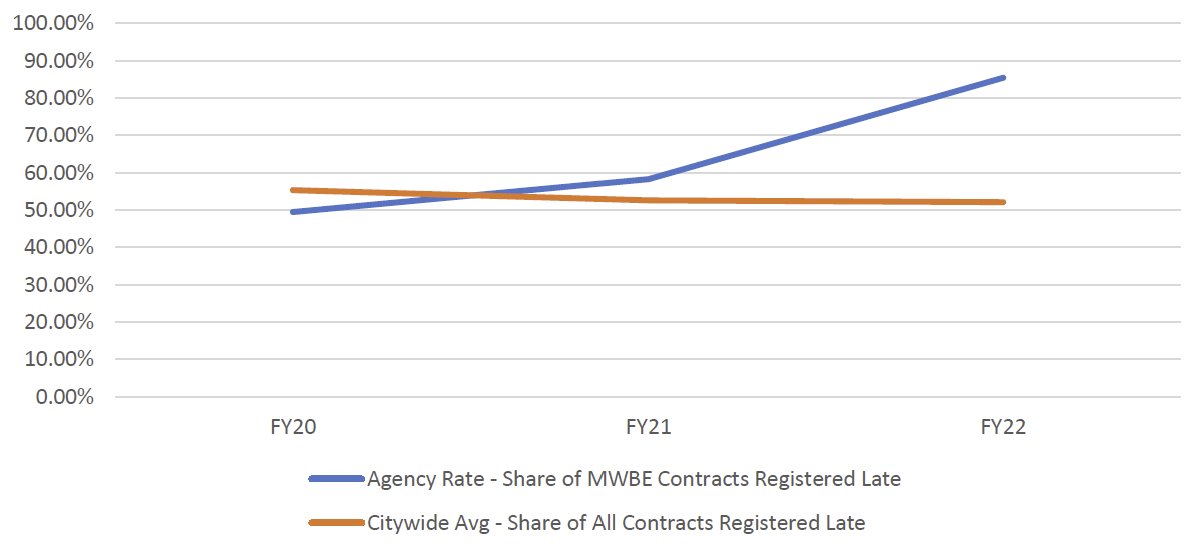
Chart 148: FY22 Contract and PO Value, by M/WBE Category and Industry
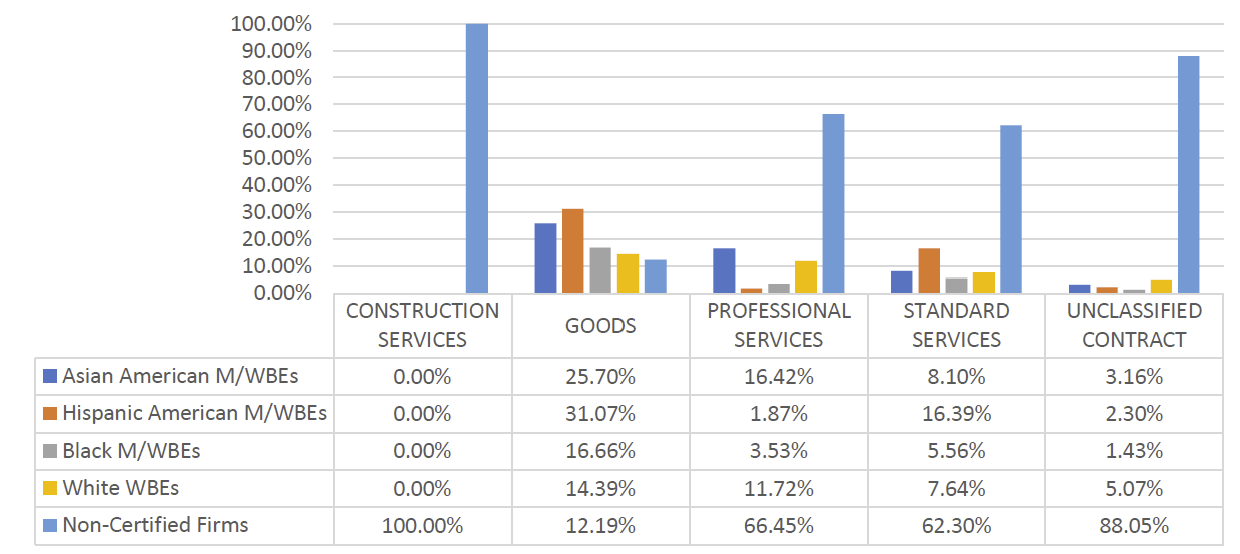
Table 176: LL 174-Eligible Approved Subcontracts – FY20-22
| Certification Status | # of Contracts | % Share of Contracts | Total Registered Contract Value | % Share of Registered Contract Value |
| FY20 | 14 | N/A | $61,228,700 | N/A |
| Sub – Non-Certified | 7 | 50.00% | $57,528,700 | 93.96% |
| Sub – MBWE | 7 | 50.00% | $3,700,000 | 6.04% |
Table 178: LL 174-Eligible Prime Spend, FY20-22
| M/WBE Category | FY20 | FY21 | FY22 | |||
|---|---|---|---|---|---|---|
| Spend | % Share | Spend | % Share | Spend | % Share | |
| M/WBE ALL | $95,356,268 | 40.66% | $97,468,735 | 18.91% | $121,640,848 | 27.33% |
| Non-Certified | $139,185,649 | 59.34% | $417,901,945 | 81.09% | $323,447,788 | 72.67% |
| Total | $234,541,917 | 100.00% | $515,370,680 | 100.00% | $445,088,636 | 100.00% |
Table 179: LL 174-Eligible Sub Vendor Spend, FY20-22
| M/WBE Category | FY20 | FY21 | FY22 | |||
|---|---|---|---|---|---|---|
| Spend | % Share | Spend | % Share | Spend | % Share | |
| M/WBE ALL | $794,008 | 16.96% | $1,509,192 | 43.48% | $1,060,077 | 11.29% |
| Non-Certified | $3,887,813 | 83.04% | $1,962,188 | 56.52% | $8,331,455 | 88.71% |
| Total | $4,681,820 | 100.00% | $3,471,379 | 100.00% | $9,391,532 | 100.00% |
Small Business Services (SBS)
SBS has one of the City’s largest procurement portfolios by value due to high-dollar Sole Source agreements with the New York City Economic Development Corporation (NYCEDC). NYCEDC is a nonprofit organization incorporated under the Not-for-Profit Corporation Law of the State of New York. SBS contracts with and retains NYCEDC to function as a development consultant and provide economic development-related services on behalf of the City.[36] Since SBS’s contracts with NYCEDC are not subject to LL 174 participation goals, the remaining value of SBS’s procurement portfolio in FY22 is just over $5 million.
The share of LL 174-eligible contract value going to M/WBEs was the highest at SBS of any rated agency in FY22 (90.13%). Black M/WBEs and White WBEs received the greatest shares of this value.
SBS’s share of LL 174-eligible spending with M/WBE primes has increased each year since FY20, reaching almost 17% in FY22. There was no recorded LL 174-eligible subcontract spending since FY20.
Table 180: LL 174-Eligible Contracts and POS – FY20-22
| Certification Status | # of Contracts | % Share of Contracts | Total Registered Contract Value | % Share of Registered Contract Value |
| FY20 | 114 | N/A | $5,482,260 | N/A |
| Non-Certified | 79 | 69.30% | $3,690,974 | 67.33% |
| M/WBEs | 35 | 30.70% | $1,791,286 | 32.67% |
| FY21 | 76 | N/A | $3,580,944 | N/A |
| Non-Certified | 49 | 64.47% | $216,786 | 6.05% |
| M/WBEs | 27 | 35.53% | $3,364,158 | 93.95% |
| FY22 | 89 | N/A | $5,046,579 | N/A |
| Non-Certified | 54 | 60.67% | $498,322 | 9.87% |
| M/WBEs | 35 | 39.33% | $4,548,258 | 90.13% |
| Grand Total | 279 | N/A | $14,109,784 | N/A |
Chart 149: FY22 Value of LL 174-Eligible Prime Contracts and POs
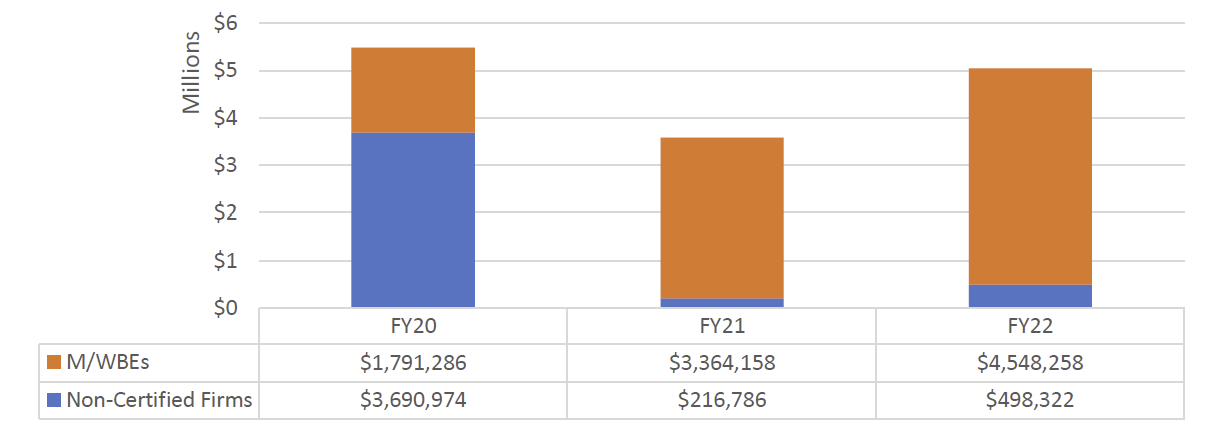
Chart 150: FY22 Value of LL 174-Eligible Contracts and POs, by Race and Gender
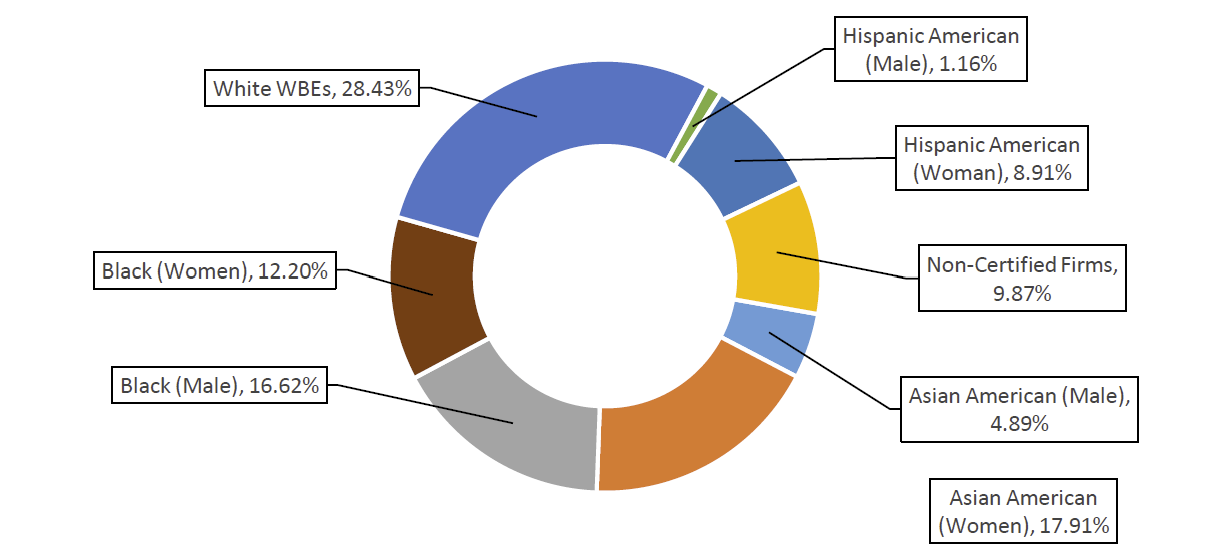
Table 181: Registered M/WBE NCSPs – FY20-22
| FY | Count | Total Value | AVG Value | Citywide AVG Value |
| FY20 | 11 | $1,522,732 | $138,430 | $79,27 |
| FY21 | 15 | $2,518,319 | $167,888 | $105,121 |
| FY22 | 24 | $4,985,107 | $207,713 | $134,907 |
| Grand Total | 50 | $9,026,158 | $180,523 | $104,232 |
Chart 151: Share of M/WBE Contracts Registered Late – FY20-22
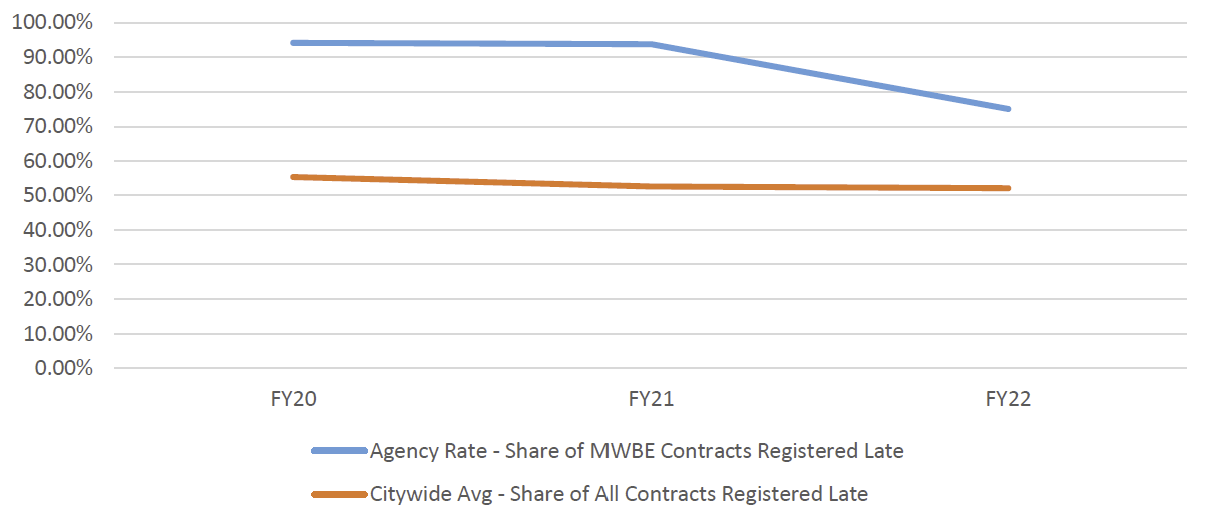
Chart 152: FY22 Contract and PO Value, by M/WBE Category and Industry
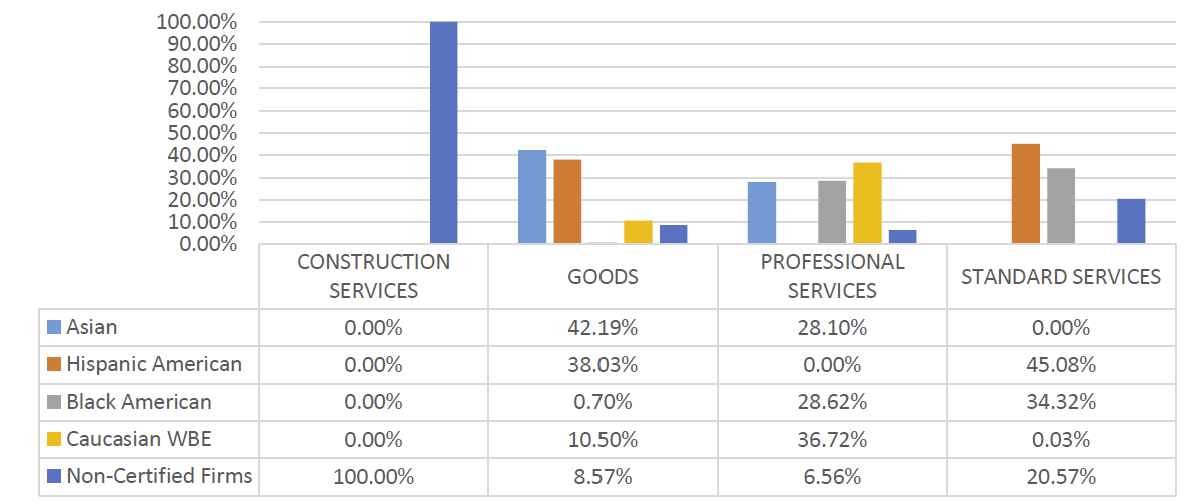
Table 182: LL 174-Eligible Approved Subcontracts – FY20-22
| Certification Status | # of Contracts | % Share of Contracts | Total Registered Contract Value | % Share of Registered Contract Value |
| FY20 | 3 | N/A | $66,400 | 100.00% |
| Sub – Majority | 3 | 100.00% | $66,400 | 100.00% |
Table 183: LL 174-Eligible Prime Spend, FY20-22
| M/WBE Category | FY20 | FY21 | FY22 | |||
| Spend | % Share | Spend | % Share | Spend | % Share | |
| M/WBE ALL | $4,750,309 | 5.70% | $4,779,793 | 10.40% | $8,249,043 | 16.91% |
| Non-Certified | $78,609,943 | 94.30% | $41,165,615 | 89.60% | $40,528,905 | 83.09% |
| Total | $83,360,252 | 100.00% | $45,945,408 | 100.00% | $48,777,949 | 100.00% |
Taxi and Limousine Commission (TLC)
TLC has a small contracting portfolio, registering three new contracts and 237 POs in FY22 (valuing approximately $2.3 million). Though small, the share of contract value registered to M/WBEs is higher than the citywide average (39.75%) – most of the value was registered to Asian American male-owned MBEs (for Professional Services) and Hispanic American male-owned MBEs (for Goods). The share of LL 174-eligible spending going to M/WBE prime vendors has declined below FY20 levels, after previously increasing in FY21. There was no recorded LL 174-eligible subcontract spending since FY20. Nearly all of TLC spending in FY22 was spent with businesses owned by white women. There were zero approved subcontractors in PIP for FY20, FY21, or FY22. All 3 of TLC’s contracts were registered after the contract start date.
Table 184: LL 174-Eligible Contracts and POS – FY20-22
| Certification Status | # of Contracts | % Share of Contracts | Total Registered Contract Value | % Share of Registered Contract Value |
| FY20 | 212 | N/A | $2,328,726 | N/A |
| Non-Certified | 141 | 66.51% | $1,278,489 | 54.90% |
| M/WBE | 71 | 33.49% | $1,050,237 | 45.10% |
| FY21 | 149 | N/A | $1,538,168 | N/A |
| Non-Certified | 115 | 77.18% | $1,064,168 | 69.18% |
| M/WBE | 34 | 22.82% | $473,999 | 30.82% |
| FY22 | 240 | N/A | $2,331,240 | N/A |
| Non-Certified | 178 | 74.17% | $1,404,528 | 60.25% |
| M/WBE | 62 | 25.83% | $926,711 | 39.75% |
| Grand Total | 601 | N/A | $6,198,135 | N/A |
Chart 153: FY22 Value of LL 174-Eligible Prime Contracts and POs
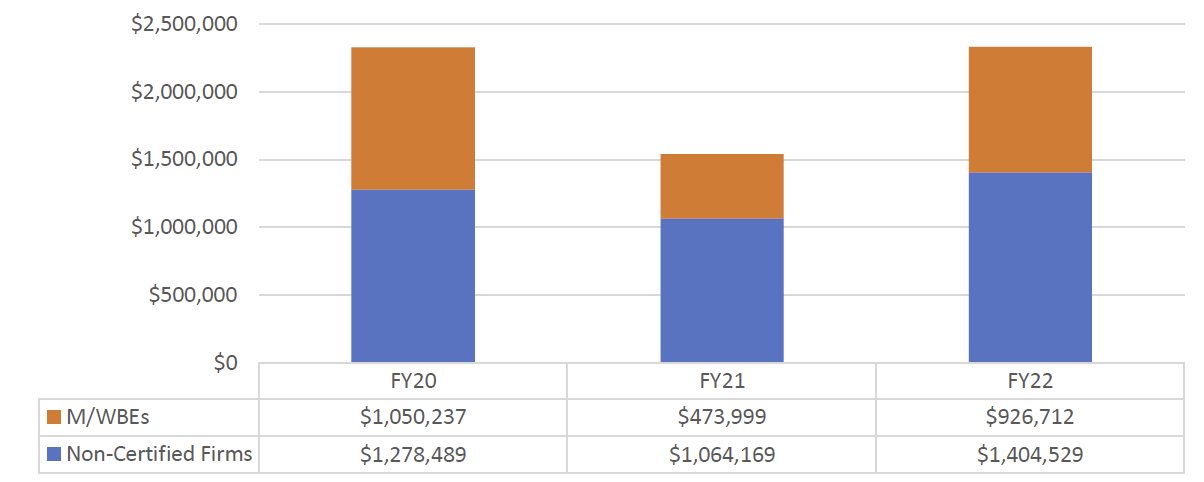
Chart 154: FY22 Value of LL 174-Eligible Contracts and POs, by Race and Gender
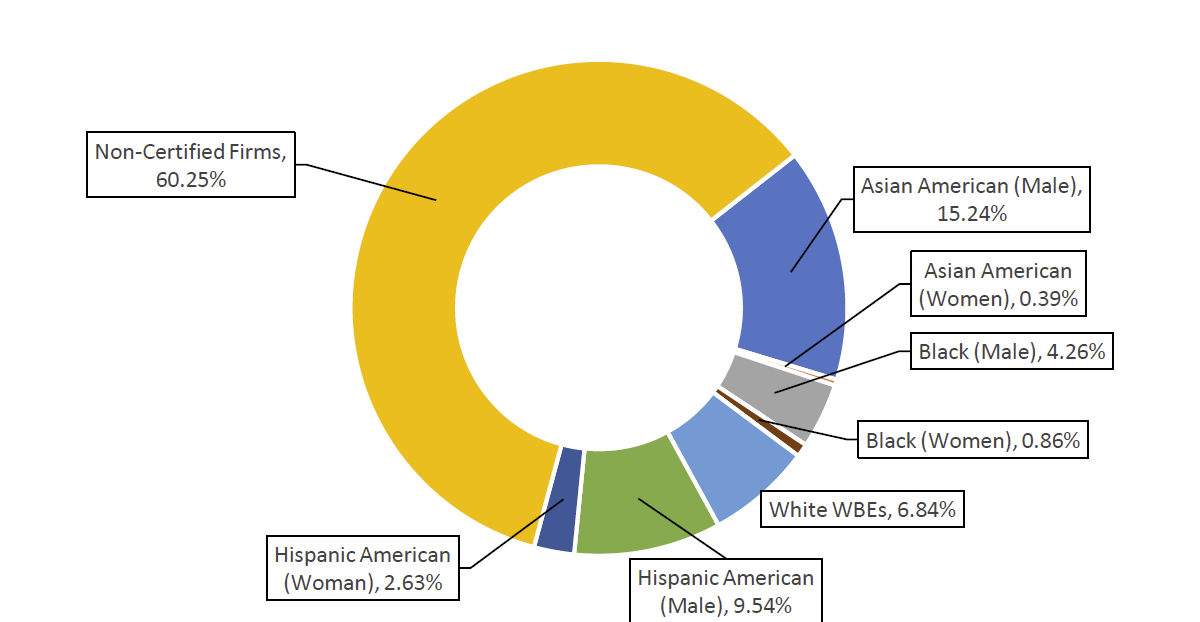
Table 185: Registered M/WBE NCSPs – FY20-22
| FY | Count | Total Value | AVG Value | Citywide AVG Value |
| FY20 | 7 | $521,645 | $74,521 | $79,27 |
| FY21 | 3 | $255,508 | $85,169 | $105,121 |
| FY22 | 4 | $469,211 | $117,303 | $134,907 |
| Grand Total | 14 | $1,246,365 | $89,026 | $104,232 |
Chart 155: Share of M/WBE Contracts Registered Late – FY20-22
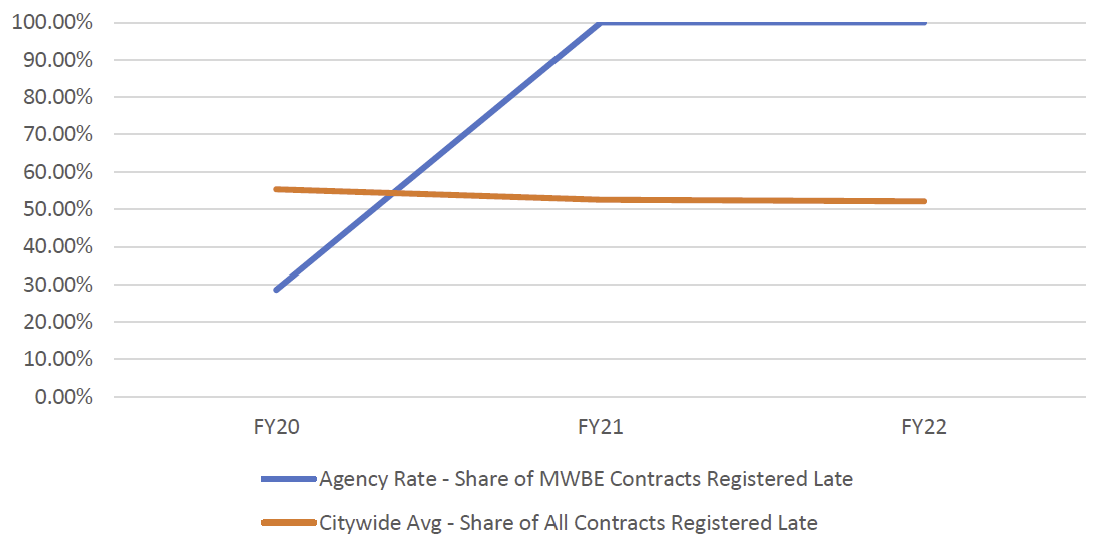
Chart 156: FY22 Contract and PO Value, by M/WBE Category and Industry
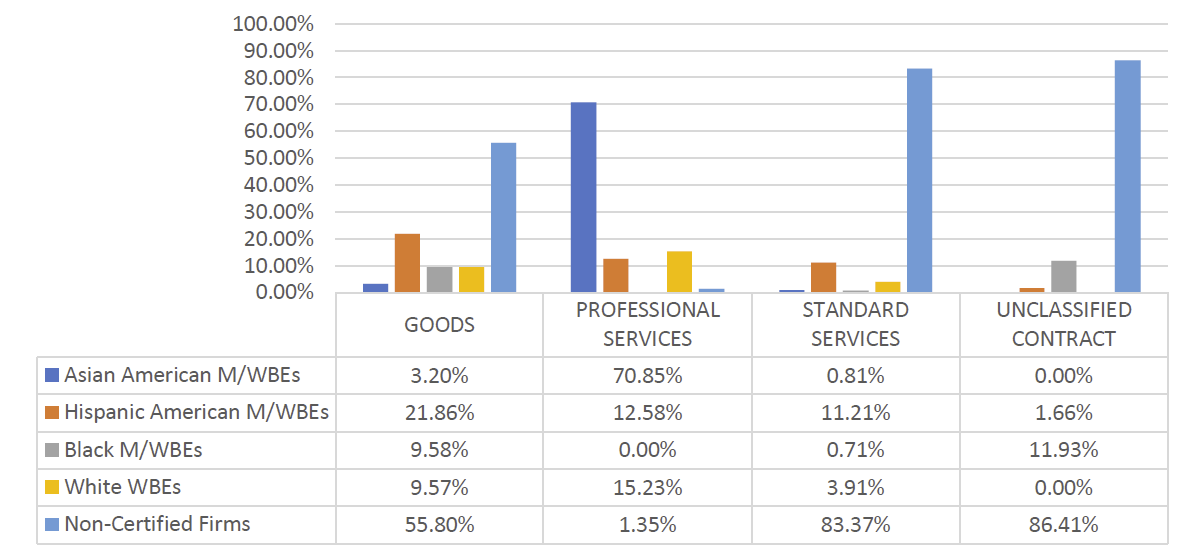
Table 186: LL 174-Eligible Prime Spend, FY20-22
| M/WBE Category | FY20 | FY21 | FY22 | |||
| Spend | % Share | Spend | % Share | Spend | % Share | |
| M/WBE ALL | $7,749,220 | 19.32% | $5,609,475 | 26.31% | $5,566,979 | 17.05% |
| Non-Certified | $32,364,931 | 80.68% | $15,713,807 | 73.69% | $27,078,749 | 82.95% |
| Total | $40,114,151 | 100.00% | $21,323,281 | 100.00% | $32,645,728 | 100.00% |
M/WBE Utilization by Industry
M/WBE utilization varies across different industries. M/WBEs receive the highest relative volume of contracts and POs in Standard Services procurements, then in Goods. This is consistent with the general relative volume of contracting across industries.
Table 187: FY22 Count of LL 174-Eligible Contract Registrations and POs, by Industry
|
Industry |
M/WBEs | Non-Certified Firms | ||
| # of Contracts and POs | % Share of Contracts and POs | # of Contracts and POs | % Share of Contracts and POs | |
| Construction | 207 | 37.98% | 338 | 62.02% |
| Goods < $1 million | 5,271 | 54.47% | 4,406 | 45.53% |
| Professional Services | 603 | 35.30% | 1,105 | 64.70% |
| Standard Services | 10,724 | 65.90% | 5,549 | 34.10% |
| Grand Total | 16,805 | 59.59% | 11,398 | 40.41% |
In reviewing the value of these registered contracts, M/WBEs see the highest percent shares in Goods where M/WBE registrations are worth over 50% of contract value. Conversely, M/WBE Construction contracts only represent 10% of registered contract value.
Table 188: FY22 Value of LL 174-Eligible Contract Registrations and POs, by Industry
| Industry | M/WBEs | Non-Certified | ||||
| Total Contract and PO Value | % Share of Contract and PO Value | Total Contract and PO Value | % Share of Contract and PO Value | |||
| Construction | $379,322,280 | 9.35% | $3,679,602,595 | 90.65% | ||
| Goods <$1 million | $91,147,171 | 56.17% | $71,120,120 | 43.83% | ||
| Professional Services | $410,033,659 | 31.73% | $882,092,100 | 68.27% | ||
| Standardized Services | $81,961,129 | 14.79% | $472,293,049 | 85.21% | ||
| Grand Total | $962,464,239 | 15.86% | $5,105,107,864 | 84.14% | ||
The average value of contracts subject to LL 174 participation goals in the Goods industry are closest to parity between M/WBE and Non-Certified firms relative to all other industries (roughly $86,000 vs $123,000). Still, the average value of contracts for M/WBEs are only about two thirds the average value of non-certified firms. While this signals that the City is more effectively utilizing M/WBEs in the Goods industry, contracts in this category of procurement are typically the lowest value given that LL 174 caps goals on Goods purchases up to and including $1 million.
Table 189: FY22 Average Value of LL 174-Eligible Registered Contracts, by Industry
| M/WBE Category | Construction – AVG Value | Professional Services – AVG Value | Standardized Services – AVG Value | Goods – AVG Value |
| All M/WBE | $2,506,431 | $1,129,131 | $414,201 | $85,565 |
| Non-Certified | $17,430,972 | $4,148,047 | $2,687,780 | $123,124 |
| % of Non-Certified Contract AVG | 14.38% | 27.22% | 15.41% | 69.50% |
Construction
PPB Rules define the construction service industry as dealing in the planning, design, or construction of real property or other public improvements.[37] In addition to engineering and construction work, this industry also includes contracts for painting, carpentry, plumbing and electrical installation, asbestos and lead abatement, carpet installation and removal, and demolition.
Disaggregated disparities are especially stark for Construction contracts. Though nearly 40% of Construction contracts are registered to M/WBEs, these M/WBE contracts only represent less than 10% of the value of all LL 174-eligible construction contracts. This is particularly true for women-owned MBEs. Only 3.30% of Construction contracts were registered to women-owned MBEs, representing only 0.16% of the contract value. These contrasts emphasize the need to increase the value of contracts registered to M/WBEs by bolstering the utilization of the best value method and PQLS (as discussed earlier in this Report).
These trends are true across many of the large agencies who purchase similar goods and services. Agencies who procure high volumes of construction services consistently show low utilizations of women-owned businesses (DEP, DOB, HPD).
Table 190: FY22 Construction Industry LL 174-Eligible Contract Registrations and POs, by Race and Gender
| M/WBE Category | # of Contracts and POs | % Share of Contracts and POs | Total Contract and PO Value | % Share of Contract and PO Value | AVG Contract and PO Value |
| All M/WBEs (Not Included in Grand Total | 207 | 37.98% | $379,322,280 | 9.35% | $1,832,475 |
| Asian American male-owned MBEs | 95 | 17.43% | $89,845,057 | 2.21% | $945,737 |
| Asian American women-owned MBEs | 12 | 2.20% | $5,550,267 | 0.14% | $462,522 |
| Black American male-owned MBEs | 10 | 1.83% | $15,582,719 | 0.38% | $1,558,272 |
| Black American women-owned MBEs | 2 | 0.37% | $389,930 | 0.01% | $194,965 |
| White WBEs | 58 | 10.64% | $229,075,045 | 5.64% | $3,949,570 |
| Hispanic American male-owned MBEs | 26 | 4.77% | $38,648,011 | 0.95% | $1,486,462 |
| Hispanic American women-owned MBEs | 4 | 0.73% | $231,250 | 0.01% | $57,813 |
| Non-Certified | 338 | 62.02% | $3,679,602,595 | 90.65% | $10,886,398 |
| Grand Total | 545 | 100.00% | $4,058,924,874 | 100.00% | $7,447,569 |
Chart 157: Share of Construction Industry Contract and PO Value, FY20-22
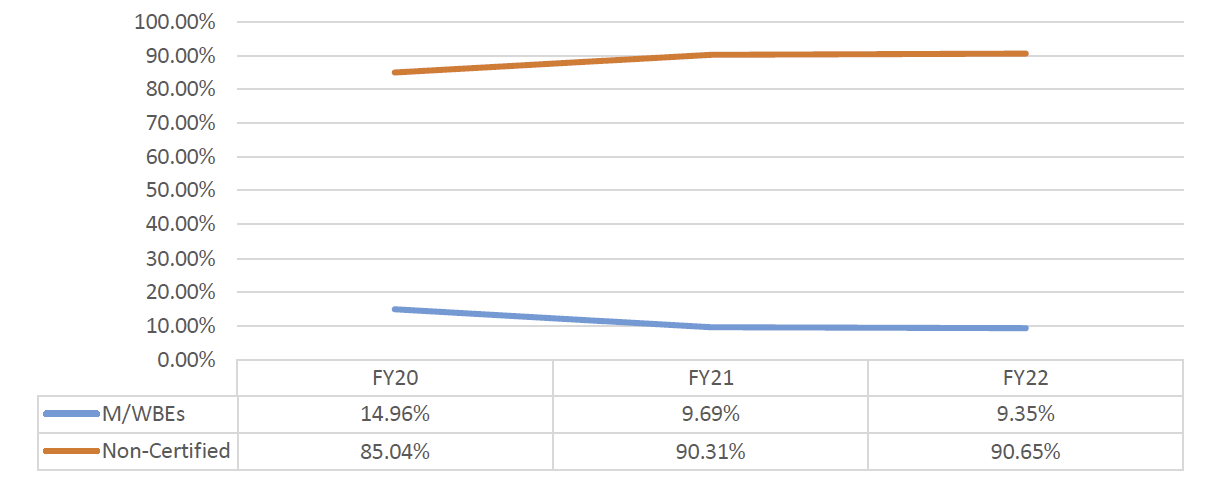
Goods Under $1 Million
The Goods industry is made up of contracts for physical items and personal property, including but not limited to equipment, materials, printing, and insurance.[38] Procurements related to consumables such as food and fuel may also fall into goods industry. Absent directives to delegate this authority, DCAS is mandated under the Charter to purchase, inspect, store, and distribute all goods, supplies, materials, equipment, and other personal property required by any City agency.[39] In some circumstances, including for the use of the M/WBE NCSP method, DCAS may delegate this authority to agencies in furtherance of allowing agencies to use their discretion to award contracts to M/WBEs.[40]
Agencies effectively utilize M/WBEs for Goods under $1 million, though it is noteworthy that these purchases are not very lucrative and individual purchases don’t necessarily have as much power to support a growing M/WBE. Over half of LL 174-eligible Goods purchases were registered to M/WBEs. The highest volume for these procurements going to M/WBEs were registered to businesses owned by white women and Hispanic American males. White WBEs and Black male-owned MBEs received the highest share of registered value among M/WBEs.
Table 191: FY22 Goods Industry (Under $1 Million) LL 174-Eligible Contract Registrations and POs, by Race and Gender
| M/WBE Category | # of Contracts and Pos | % Share of Contracts and POs | Total Contract and PO Value | % Share of Contract and PO Value | AVG Contract and PO Value |
| All M/WBEs (Not Included in Grand Total | 5,271 | 54.47% | $91,147,171 | 56.17% | $17,292 |
| Asian American male-owned MBEs | 756 | 7.81% | $8,948,487 | 5.51% | $11,837 |
| Asian American women-owned MBEs | 265 | 2.74% | $5,732,849 | 3.53% | $21,633 |
| Black American male-owned MBEs | 586 | 6.06% | $13,812,750 | 8.51% | $23,571 |
| Black American women-owned MBEs | 190 | 1.96% | $3,889,948 | 2.40% | $20,473 |
| White WBEs | 2,520 | 26.04% | $42,445,452 | 26.16% | $16,843 |
| Hispanic American male-owned MBE | 824 | 8.52% | $12,913,526 | 7.96% | $15,672 |
| Hispanic American women-owned MBEs | 129 | 1.33% | $3,384,183 | 2.09% | $26,234 |
| Native American male-owned MBEs | 1 | 0.01% | $19,976 | 0.01% | $19,976 |
| Non-Certified | 4,406 | 45.53% | $71,120,120 | 43.83% | $16,142 |
| Grand Total | 9,677 | 100.00% | $162,267,291 | 100.00% | $16,768 |
Chart 158: Share of Goods Industry (Under $1 million) Contract and PO Value, FY20-22
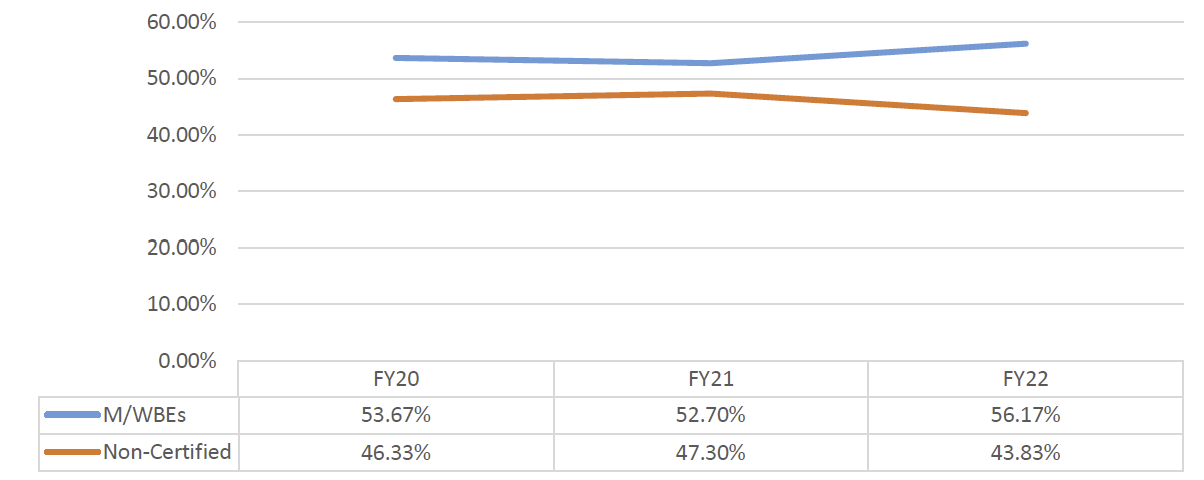
Professional Services
The Professional Services industry includes contracts for the provision of various kinds of expert advice and consulting, including legal services, medical services and information technology and construction-related consulting.[41] 35% of LL 174-eligible Professional Services contracts were registered to M/WBEs – representing about 32% of the value of these contracts. This rate has nearly doubled since FY20. Consistent with patterns addressed in other Sections of this report, the highest volume and share of value for these procurements were registered to businesses owned by white women and Asian American men.
Table 192: FY22 Professional Services Industry LL 174-Eligible Contract Registrations and POs, by Race and Gender
| M/WBE Category | # of Contracts and POs | % Share of Contracts and POs | Total Contract and PO Value | % Share of Contract and PO Value | AVG Contract and PO Value |
| All M/WBEs (Not Included in Grand Total | 603 | 35.30% | $410,033,659 | 31.73% | $679,989 |
| Asian American male-owned MBEs | 121 | 7.08% | $165,690,579 | 12.82% | $1,369,344 |
| Asian American women-owned MBEs | 103 | 6.03% | $39,795,273 | 3.08% | $386,362 |
| Black American male-owned MBEs | 80 | 4.68% | $25,956,519 | 2.01% | $324,456 |
| Black American women-owned MBEs | 51 | 2.99% | $27,145,197 | 2.10% | $532,259 |
| White WBEs | 138 | 8.08% | $114,534,828 | 8.86% | $829,963 |
| Hispanic American male-owned MBEs | 78 | 4.57% | $34,633,322 | 2.68% | $444,017 |
| Hispanic American women-owned MBEs | 32 | 1.87% | $2,277,941 | 0.18% | $71,186 |
| Non-Certified | 1,105 | 64.70% | $882,092,100 | 68.27% | $798,273 |
| Grand Total | 1,708 | 100.00% | $1,292,125,758 | 100.00% | $756,514 |
Chart 159: Share of Professional Services Industry LL 174-Eligible Contract and PO Value, FY20-22
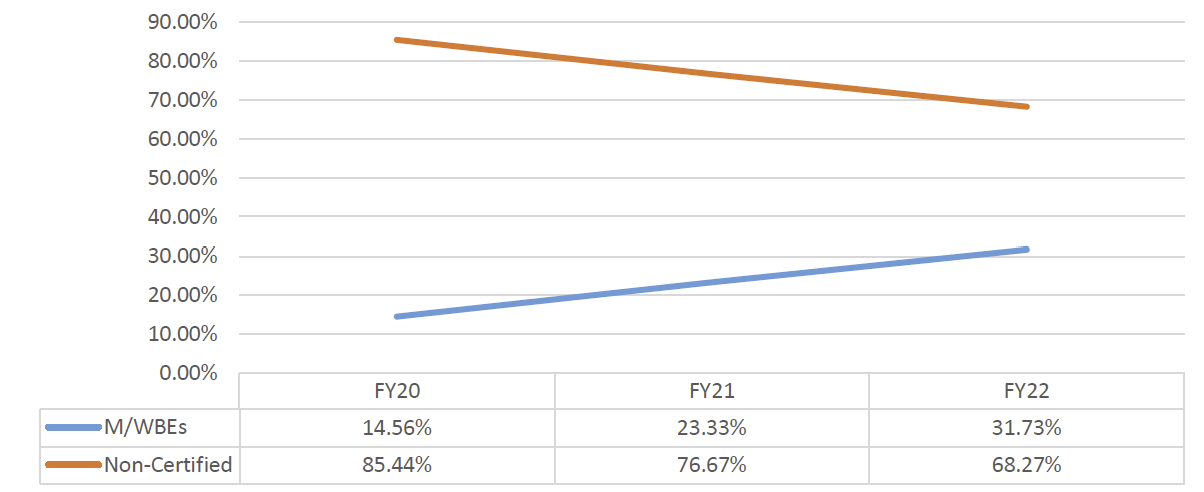
Standard Services
The Standard Services industry is composed of services other than Professional Services and Human/Client Services such as custodial services, security guard services, stenography services and office machine repair.[42] Contracts in Standard Services show clear evidence that M/WBEs are winning less lucrative contracts. Over 65% of LL 174-eligible Standard Services contracts were registered to M/WBEs, but these contracts only represent 15% of the contract value in this industry. Over half of Standard Services contracts were registered to Asian American male-owned MBEs, exceeding the share awarded even to non-certified firms (though the value of contracts awarded to non-certified firms was significantly higher than the value of contracts registered to Asian American male-owned MBEs).
Table 193: FY22 Standard Services Industry LL 174-Eligible Contract Registrations and POs, by Race and Gender
| M/WBE Category | # of Contracts and POs | % Share of Contracts and POs | Total Contract and PO Value | % Share of Contract and PO Value | AVG Contract and PO Value |
| All M/WBEs (Not Included in Grand Total | 10,724 | 65.90% | $81,961,129 | 14.79% | $7,643 |
| Asian American male-owned MBEs | 8,729 | 53.64% | $24,146,922 | 4.36% | $2,766 |
| Asian American women-owned MBEs | 464 | 2.85% | $1,827,032 | 0.33% | $3,938 |
| Black American male-owned MBEs | 111 | 0.68% | $3,542,594 | 0.64% | $31,915 |
| Black American women-owned MBEs | 68 | 0.42% | $2,402,451 | 0.43% | $35,330 |
| White WBEs | 1,110 | 6.82% | $40,124,062 | 7.24% | $36,148 |
| Hispanic American male-owned MBEs | 189 | 1.16% | $7,162,318 | 1.29% | $37,896 |
| Hispanic American women-owned MBEs | 53 | 0.33% | $2,755,750 | 0.50% | $51,995 |
| Non-Certified | 5,549 | 34.10% | $472,293,049 | 85.21% | $85,113 |
| Grand Total | 16,273 | 100.00% | $554,254,177 | 100.00% | $34,060 |
Chart 160: Share of Professional Services LL 174-Eligible Industry Contract and PO Value, FY20-22
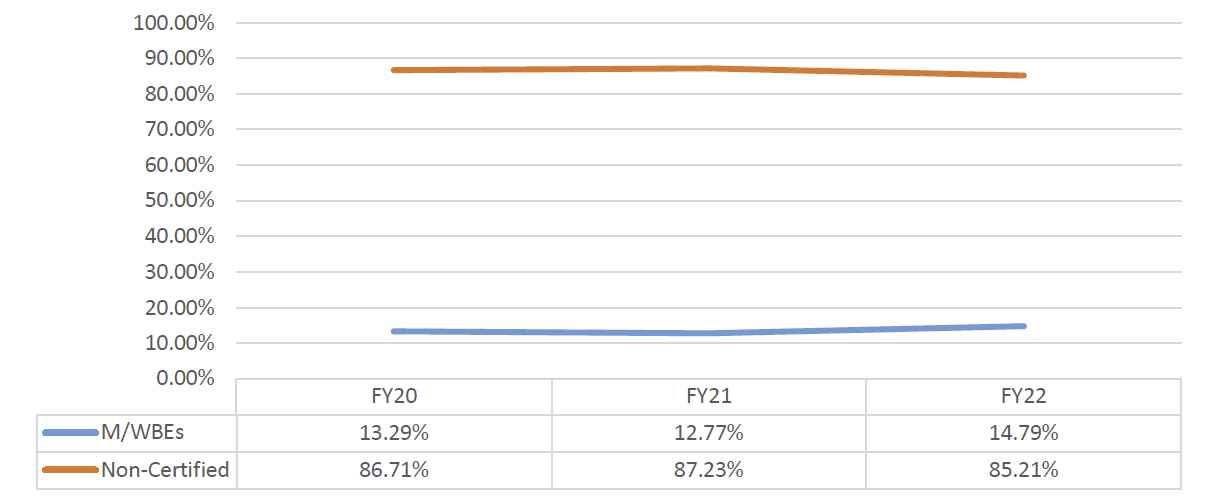
Industry Analysis of the M/WBE NCSP Method
Agencies most frequently use the M/WBE NCSP method to procure Goods, then Professional Services. Agencies don’t often utilize this method for Construction contracts. This is likely because such contracts are typically larger than the FY22 threshold of $500,000, or because these contracts often utilize federal funding that precludes the Agency from utilizing this method for contracts over $250,000 (if at all).
Table 194: Registrations Using the M/WBE NCSP Method, by Industry, FY20-22[43]
| Industry | # of Contracts | % Share of Contracts | Total Value | Industry Share of Value |
| FY20 | 1,190 | N/A | $94,340,220 | N/A |
| Construction Services | 7 | 0.59% | $477,808 | 0.51% |
| Goods | 754 | 63.36% | $55,427,932 | 58.75% |
| Professional Services | 263 | 22.10% | $22,378,792 | 23.72% |
| Standard Services | 106 | 8.91% | $10,875,862 | 11.53% |
| Unclassified Contract[44] | 60 | 5.04% | $5,179,827 | 5.49% |
| FY21 | 833 | N/A | $87,566,148 | N/A |
| Construction Services | 24 | 2.88% | $6,829,862 | 7.80% |
| Goods | 427 | 51.26% | $33,865,275 | 38.67% |
| Professional Services | 262 | 31.45% | $32,345,329 | 36.94% |
| Standard Services | 80 | 9.60% | $10,360,733 | 11.83% |
| Unclassified Contract | 40 | 4.80% | $4,164,950 | 4.75% |
| FY22 | 944 | N/A | $127,352,292 | N/A |
| Construction Services | 29 | 3.07% | $7,717,444 | 6.06% |
| Goods | 414 | 43.86% | $43,575,368 | 34.22% |
| Professional Services | 347 | 36.76% | $51,187,359 | 40.19% |
| Standard Services | 113 | 11.97% | $16,354,962 | 12.84% |
| Unclassified Contract | 41 | 4.35% | $8,517,159 | 6.69% |
| Grand Total | 2967 | N/A | $309,258,661 | N/A |
Conclusion
The City has implemented many measures to incentivize agencies to contract with M/WBEs and to increase their share of contracts and funding. Unfortunately, these measures continue to fall short on delivering equity for M/WBEs. There is no one perfect magic wand solution to the decades of systemic racism that have contributed to today’s picture. However, there are real, tangible steps we can take now to address some of the biggest problems contributing to this perpetuated inequity. This Report prioritizes six major issue areas that are contributing to low utilization numbers and have developed a series of recommendations to address needed procedural updates, systematic enhancements, and legislative reforms. Together, these steps will mitigate some predominant underlying problems and will help close the gap to increase the share of contracts and lucrative opportunities that go to M/WBEs.
Appendix A: Procurement Methods, Tools, and Laws at Play
As detailed in the Annual Report, contracts are vehicles by which City agencies are able to provide critical goods and services to the public. Agencies make the determination of what contracts are needed to support their programmatic missions. These may be contracts to support essential agency operations (e.g., securing office supplies or IT services for its staff) or contracts that enable the agency to fulfill certain policy initiatives like expanding 5G access. The Annual Report includes a Primer section that in greater detail illustrates the process from identifying the need from a procurement through registration of a contract with the Comptroller’s Office. For purposes of this Report, we cover the most prevalent procurement methods, tools and laws that govern the ways in which the City contracts with M/WBEs.
In general, a combination of relevant Executive Orders, Local Laws and other applicable rules and laws, set forth the procedural requirements for each procurement method available to City agencies. This section of the Report will highlight key components of the City’s contracting processes that impact M/WBE utilization across mayoral agencies as well as the Department of Education (DOE) and the Office of the Comptroller.[45] The independent City agencies (such as DOE), or other agencies (such as state agencies, boards, libraries, and other corporations that perform public functions in the City) may have their own independent procurement procedures, laws, and regulations and M/WBE programs.
- Procurement Methods with Discretion that provide flexibility to City agencies to make direct contract awards to M/WBEs without formal competition.
- Other Procurement Methods that on their own or supported by supplemental procurement tools are designed to provide exclusive or more advantageous opportunities by which the City can award contracts to M/WBEs.
- Goal Based Program which requires that for procurements covered by LL, agencies establish participation goals that yield M/WBE prime and/or subcontracting contracts.
Procurement Methods with Discretion
The PPB Rules authorize agencies to choose from multiple procurement methods that allow contracting agencies latitude to make direct contract awards to M/WBEs without formal competition.
Small Purchases: “5+10” Rule
Small Purchases enable agencies to procure goods, services, and construction above the Micropurchase method limits without formal competition or public advertisement as long as the amount of the contract is below a “small purchase limit” set by the PBB and the City Council, currently $100,000. [46][47]
The PPB Rules outline a competition objective for the award of Small Purchases, currently known as the “5+10” method, that aims to facilitate M/WBE participation by limiting the number of non-certified vendors that can compete for opportunities while enabling agencies to include as many M/WBEs in the competition pool as it wishes. [48] Specifically, contracting agencies are required to solicit bids from a list of five randomly selected non-certified vendors and at least ten M/WBE vendors when making awards for goods and services (over $20,000) as well as construction (over $35,000), as long as the total value of the contract, including future modifications, does not exceed $100,000. The “5+10” procurement method is not supported by PASSPort; rather agencies seeking to utilize this method must access FMS, which is a separate containing a module that facilitates the solicitation and award. Through this system, vendors are randomly selected from the citywide bidders list based on FMS commodity codes (which we discuss in more detail later in this section) selected by the contracting agency. Agencies may proceed even if only one responsive bid or offer is received, as long as the ACCO determines the price to be fair and reasonable, the vendor responsible and that other vendors were given an opportunity to respond.
Small Purchases: M/WBE Noncompetitive (NCSP) Method
First introduced in 2017 and since amended, the M/WBE NCSP method, codified under Section 3-08 of the PPB Rules, is designed to increase M/WBEs’ share in City contracts by providing contracting agencies with a tool to make direct contract awards up to thresholds authorized by the State with limited, targeted competition. Initially, in 2017 the NCSP method threshold was only up to $150,000 and limited to goods and services, but not construction procured using only City dollars. In November of 2019, pursuant to additional State legislative authority, the PPB unanimously voted to amend the City’s Rules to both increase the threshold up to $500,000 and expand the eligible industries to include construction. The NYC Law Department subsequently issued guidance to agencies that now permits the use of the method for federally funded procurements up to $250,000 and with certain procedural limitations. In general, contracting agencies leverage this method by soliciting at least three (3) quotes from certified M/WBEs and then award the contract to a responsible vendor that offers a fair and reasonable price.
On October 6, 2022, New York State enacted new legislation increasing the dollar threshold for eligible procurements from M/WBEs from $500,000 to $1 million.[49] In line with prior legislative approvals, this provides the City with the legal authority to codify changes in the PPB Rules to reflect the increased dollar threshold. Recognizing this historic opportunity, Comptroller Lander urged the PPB to convene to immediately commence the procedural process to enact the amendment. As a result, in December 2022 and for the first time in three years the PPB convened and unanimously approved amending the PPB Rules to raise the threshold to not only align with the current State legislative authority up to $1 million, but also offers the flexibility to swiftly implement increases moving forward.
In January 2023, the Capital Process Reform Task Force released its final set of immediate recommendations, including advocacy in support of further State Legislative authority to increase the M/WBE NCSP method threshold to up to $1.5 million, consistent with the threshold for other public entities such as the Metropolitan Transportation Authority (MTA). As of the date of this Report, we are grateful to the Governor for including this threshold increase in her FY24 proposed budget and look forward to continuing our advocacy along with our taskforce partners.
In FY22 the M/WBE NCSP method yielded the largest share of registered M/WBE procurement contracts (35.38%). Surpassing both the count and value totals from FY21, in FY22 city agencies registered 961 M/WBE NCSP contracts, valued at $129,422,285.
While not yet codified in the PPB as a standalone procurement method, agencies are able to make purchases directly from M/WBEs up to the increased threshold using the Innovative Procurement method, which authorizes agencies to utilize procurement methods that may not yet be set forth in the Rules.[50]
Micropurchase Procurement Method
Set within the Small Purchase Rule, Micropurchase procurements are those that do not exceed $20,000 for most goods and services, or up to $35,000 for construction. Unlike Small Purchases, which require limited competition but offer discretion in choice, when not exceeding the micropurchase thresholds (inclusive of future modifications) agencies may buy from any available responsible vendor at a fair price, without any competition. Despite this discretion, the Rules require that agencies making micropurchases ensure that the purchases are distributed appropriately, including to M/WBEs.
Other Procurement Methods
The PPB Rules also provide City contracting agencies with many other methods to contract with M/WBEs, even if they offer agencies less discretion when selecting a vendor. While these methods often have longer and more detailed procedures and cycle times, they generally yield larger contracts. City agencies must deliberately and more effectively utilize these award methods to increase the share of lucrative contracts awarded to M/WBEs.
Competitive Sealed Bid Method
The CSB is the default award method under the PPB Rules, General Municipal Law (GML) 103 and most other municipal procurement rules.[51] It functions to award contracts to responsive and responsible vendors that provide the lowest price point for a particular good, service, or construction while still meeting the agency‘s programmatic requirements and needs. Agencies must specify their requirements and criteria for vendors, which may include contractual terms and conditions, as well as minimum qualifications that must be met by the vendor, by issuing an invitation for bid (IFB).[52] CSBs are most often used for contracts pertaining to goods and construction. In fact, absent specific directives from other legal authority, CSBs are the required method for any contracts pertaining to public work contracts.[53]
Agencies may also solicit CSBs by sending notice to a list of prequalified vendors. Agencies may establish prequalified vendor lists (“PQVLs”) for multiple different types or sizes of projects. While opportunities for vendors to join an agency’s prequalified group must be continuously available to the public, and notice placed at least annually in the City Record, these lists are intended to save time by ensuring that prospective vendors have already been determined to hold the requisite experience, or to otherwise be capable of meeting the City’s needs.[54] While vendors must still be found responsible by an agency before being awarded a new CSB contract, agencies can conduct a preliminary background check on vendors while establishing a PQVL to reduce the risk of complications.
When properly implemented, dedicated PQVLs are a tool that must be effectively deployed to direct larger dollar contracts to M/WBE prime vendors, as discussed earlier in this Report.
Competitive Sealed Proposal (CSP) Method
The CSP method is another competitive method whereby agencies solicit for goods, services, or construction-related services via a Requests for Proposal (“RFP”). RFPs are generally used with the scope of a need is not well defined, and an agency needs to understand an applicant vendor’s approach in order to make an award determination. Agencies must award proposals that are determined to be the most advantageous to the City, and may take into consideration price and other criteria, whose relative weight must be set forth in the RFP relating to technical approach, organizational capability, organizational capacity, and M/WBE status.[55] Other factors outside of the RFP cannot be considered by agencies when making award decisions, although there are generally multiple rounds of evaluation and opportunities for vendors to interview or present their proposal to an agency.[56] Like with CSBs, agencies can also issue an RFP notice to a PQVL list.
CSPs are also the tool most often used to establish service requirements contracts. Most often, requirements contracts are registered with a value that merely represent capacity. Through requirements contracts, vendors only receive actual dollar-value awards through project specific task orders. As discussed earlier in this Report, it is critical that agencies ensure that M/WBEs that are awarded requirements contracts are ultimately awarded task orders.
Best Value Preferences for M/WBEs
In January 2020, the City adopted amendments to the PPB Rules allowing contracting agencies to consider M/WBE status when evaluating bids and proposals.[57]
Specifically, for a CSB that is typically awarded to the lowest responsible bidder, contracting agencies are authorized to give an M/WBE bidder a 10% price preference. This means that an M/WBE’s bid price will be evaluated as if it were 10% lower, which may result in more awards to M/WBEs that maintain competitive pricing.
Alternatively, for a CSP, the City must provide either a 10%-point preference or, if the proposal score meets or exceeds a minimum threshold for quality, either a 10% price preference or a 10%-point preference to an M/WBE’s proposal score. These quantitative preferences are required to be applied to CSP’s for goods, standard services, and professional services. Note that for construction-related consulting services, rather than 10%, M/WBEs must receive a 5%-point preference. As noted earlier in this report, contracting agencies can increase M/WBE utilization by leveraging best value tools when using the CSB and CSP methods of procurement.
Negotiated Acquisition Contracts
Under section 3-04 of the PPB rules, agencies can move to limit competition via a negotiated acquisition procurement when the ACCO determines, with CCPO approval, that:
- There is a time-sensitive situation where a vendor must be retained quickly to meet the terms of a court order or consent decree, to avoid loss of available funding, to ensure continuity of services, or similar.
- There are a limited number of vendors available and able to perform required work.
- There is a compelling need to extend a contract beyond the typical twelve-month limit
- There is a need to procure legal services or consulting services in support of current or anticipated litigation, investigative or confidential services.
- There are previously unforeseen or unforeseeable construction-related service needs, typically after construction has begun, that cannot be addressed by a change order or other contract modification.
Negotiated acquisition extensions are typically used when agencies have exhausted all contractual renewals, as well as contract extensions permitted by other sections of the PPB Rules, because goods or services were needed for a longer time than originally anticipated, or because the agency has not been able to procure a replacement contract in a timely manner.
In spite of the fact that Negotiated Acquisition contracts are supported by a particular need that may dictate a preferred vendor, the LL still mandates that agencies make reasonable efforts to meet participation goals by requiring that they engage in outreach activities that encourage M/WBEs to complete for these procurements.[58]
There were 1,028 negotiated acquisitions registered in FY22 for a total value of $3,185,698,675.[59]
Emergency Procurement Contracts
The Charter and PPB rules define an emergency condition as “an unforeseen danger to life, safety, property, or a necessary service” which creates an immediate and serious need for goods, services, or construction that cannot be met quickly enough through normal procurement methods.[60] Agencies seeking to utilize this procurement method must solicit and receive prior approval from the Comptroller’s Office and Corporation Council. They must also seek to obtain as much competition in vendor selection as is possible and practical given the conditions of the emergency.
Agencies then submit a formal emergency declaration to the Comptroller’s Office and Corporation Counsel for approval, and to the City Council for notice. The emergency declaration must include information about the emergency itself, the goods or services or construction needed, the projected cost, the vendor selected in the emergency procurement, and basis of the awarded vendor’s selection. While work can begin under the framework of the emergency declaration prior to a contract’s registration, agencies must still submit contract packages to the Comptroller’s Office for registration before funds are made available to pay vendors.
Mayor DeBlasio issued Executive Order 59 (“EO-59”) on July 28,2020 in response to the ongoing State of Emergency due to the threat of COVID-19. EO-59 stated that agencies “shall not categorically exempt Emergency contracts from M/WBE participation goals, and shall instead, to the extent practicable in light of the nature of the procurement, follow the procedures set forth in Section 6-129(h) and (i) of the N.Y.C. Administrative Code to set goals for the contract.” Even absent a policy directive to engage with M/WBEs, and similar to Negotiated Acquisitions, the LL mandates agencies to conduct outreach encouraging M/WBE to compete for Emergency procurement contracts.[61]
Participation Goals Program
Separate from the independent tools outlined above that can support the award of higher dollar value contracts to M/WBE prime vendors, agencies have a legally mandated responsibility to include M/WBE participation goals when using many of those methods as sourcing vehicles. As we discuss below, when used effectively, participation goals ensure maximum M/WBE utilization even in circumstances where the chosen procurement method does not result in a contract award to an M/WBE prime.
The inception of the City’s M/WBE program was borne out of a disparity study which is discussed further along in this Report. Currently, the City’s Program is currently governed by Section 6-129(b) of the Admin Code, which codifies Local Laws 174 and 176 enacted by the City Council in 2019. This legislation outlines mandated M/WBE participation goals for mayoral agencies and those of Elected Officials. As of this most recently amended guidance, contracting agencies are expected to establish and ensure that M/WBE participation goals are met for all eligible procurements in:
- Standardized services;
- Professional services;
- Construction services;
- Goods (up to $1 million)
There are some specified exceptions, including but not limited to:[62]
- Emergency procurements;
- Intergovernmental (NY State Office of General Services (OGS)/ U.S. General Services Administration (GSA)) procurements;
- Sole source contracts;
- Government-to-government procurements;
- Contracts subject to federal or state funding requirements that preclude the City from imposing M/WBE participation goals or impose their own Disadvantaged Business Enterprise (DBE), MBE, or WBE goals;
- Human services procurements;
- Any procurement that results in an award to a not-for-profit entity; and
- Any procurement that is not competitively awarded (i.e., Required Authorized Source, etc.)
On all eligible procurements, agencies are required to establish M/WBE participation goals that maximize M/WBE utilization. If an eligible procurement results in the establishment of requirements contracts with task/work orders that are individually registered, goals are not set on the prime contract, as the scopes of work may not yet be known. Rather, the task orders issued pursuant to the master agreement may be subject to goal setting. In establishing participation goals, the City is required to ensure that substantial progress is made toward attaining the citywide goals set forth in the LL in as short a time as practicable. It is important to note that the discretionary procurement methods discussed earlier are not excluded from the LL requirements, making it all the more critical that the City consider all eligible procurement methods as critical vehicles by which to attain higher M/WBE utilization.
These goals include specific contracting participation goals for each individual M/WBE category: “Black Americans, Asian Americans, Hispanic Americans, Native Americans, Women, and Emerging”. While the LL permits agencies to set an “unspecified goal,” which a vendor may meet by using an M/WBE regardless of certification category, when setting participation goals, agencies are required to consider the potential for the purchase to provide opportunities for specific categories of M/WBEs to develop greater capacity and to increase competition for city procurements.[63] In fact, Agency annual utilization plans, which are submitted to the speaker of the council and publicly posted, must include an explanation if any goal is different than the participation goal for the relevant group and industry classification as set forth in the LL. [64]
Monitoring a vendor’s compliance with the contractually required goal is outside the scope of this Report, though subcontractor compliance challenges are addressed earlier in this Report. It is important to understand that both an agency and the vendor’s compliance with goals is based on the dollar amount that is paid or obligated to be paid to an M/WBE. Therefore, the goal sets the legal benchmark for utilization, but prime and subcontract expenditures ultimately measure actual compliance and success.
As stated in the Executive Summary, much of the analyses in this Report focus on procurements subject to the City’s participation goals program.
Disparity Studies
New York City’s M/WBE program was created in 1992 in response to an initial disparity study that analyzed the availability and representation of M/WBEs in City contracting. The City is required to conduct this review at least once every two years.[65] To date, the City has produced only three disparity studies, the most recent of which was published in 2018, which analyzed data from July 2006 through July 2015. This 2018 disparity study found sufficient evidence of disparity and recommended that the City continue its M/WBE program in supporting of closing the gap. The 2018 disparity study supported the City’s goal of 30% utilization for M/WBEs, and informed the metrics used for disaggregated goals (by M/WBE category and by industry).
This Report includes a recommendation that the City swiftly proceed with the procurement of an updated disparity study to better reflect the state of the current economy. Visit this link to access a copy of the 2018 disparity study: https://www.nyc.gov/assets/mwbe/business/pdf/NYC-Disparity-Study-Report-final-published-May-2018.pdf
Resources
New York City agencies and vendors leverage many systems, platforms, and resources that support its contracting functions. This Report references many key technology resources that are particularly relevant when discussing contracting with M/WBEs. This Report identifies problems and recommends changes and enhancements that would make these, individually and collectively more valuable tools to support the increase to M/WBE utilization.
FY22 Annual Summary Contracts Report for the City of New York
The Comptroller’s Office is required to publish an annual summary report of contracts and agreements assumed by New York City during the previous fiscal year in accordance with section 6-116.2 of the Administrative Code. This “Annual Summary Contracts Report” was released on January 30, 2023, and aims to provide better transparency into what the city is buying and how these purchases are being made. The Annual Summary Contracts Report includes plain data on over 17,000 registered procurement actions made by the City, representing a value of over $43 billion. This M/WBE utilization report is a follow-up to the Annual Summary Contracts Report that will focus on the share of City registered contracts going to M/WBEs, subject to LL 174.
A copy of the report can be found at: https://comptroller.nyc.gov/reports/annual-contracts-report/#_ftn134
Financial Management System (FMS)
FMS is the City’s computerized accounting and financial data management system that is jointly administered by the Mayor and Comptroller and managed by the Financial Information Services Agency (FISA). FMS is the central repository of the accounting, budgetary and contracting activity for all city agencies. To properly track expenses and revenues, agencies are required to specifically identify the type of contract submitted for registration by selecting from a list of predetermined contract type codes in FMS. Award method categories indicate how the City selects vendors for a particular contract. This Report also references “Industry classifications” which are not entered by agencies into FMS but are instead derived from various FMS data points to reveal procurement trends by sector.
The majority of the data analyses in this Report pertaining to registered contracts were sourced from FMS.
Payee Information Portal (PIP)
All vendors are required to register and create an account in PIP to do business with the City of New York. PIP is managed by FISA and enables vendors to view financial transactions, register for Electronic Funds Transfer (EFT) payments, enroll in citywide bidders’ lists, report on subcontractors, and record payments made to subcontractors among other features.
Checkbook NYC
In July of 2010 the Comptroller’s Office launched Checkbook NYC, an online transparency tool that for the first time placed the City’s day-to-day spending in the public domain. Using an intuitive dashboard approach that combines a series of graphs and user-friendly tables, Checkbook NYC provides up-to-date information about the City’s financial condition.
Checkbook NYC has been ranked the top transparency tool in the nation for tracking government spending by the United States Public Interest Research Group and was named New York City 2013 “Best External Application” by Government Technology Magazine.
Checkbook NYC also contains a majority of the City’s contract data. This tool enables users to examine data on its “Contracts” tab by fiscal year (or other date ranges), procurement category, contract types, and more.
Online Directories of Certified Vendors
SBS Online Directory of NYC Certified Businesses
New York City M/WBEs are certified by SBS.[66] The SBS Online Directory of NYC Certified Businesses is a searchable list of M/WBE, Locally-based enterprises (LBE), and Emerging Business Enterprises (EBE) businesses certified by the City of New York. It includes contact information for these firms, as well as details regarding their expertise, experience, and more. As of June 30, 2022 (the end of FY22), the SBS Online Directory of Certified Vendors included 10,768 M/WBEs. Visit this link to access the SBS Online Directory: https://sbsconnect.nyc.gov/certification-directory-search/
Empire State Directory
There is a separate certification process for becoming a New York State certified M/WBE, defined by Article 15-A of the New York State Executive Law. The New York State M/WBE Directory is a searchable list of State certified M/WBEs, searchable by commodity code, location, work region, industry, and business size.
- Visit this link to access more information about the New York State M/WBE certification process: https://esd.ny.gov/doing-business-ny/mwbe/mwbe-certification-eligibility-requirements
- Visit this link to access the NYS M/WBE directory of certified firms: https://ny.newnycontracts.com/
PASSPort
This online vendor management and procurement system is managed by MOCS. PASSPort is where vendors and mayoral Agencies exchange information to create and manage vendor accounts, make determinations for contract awards, and complete performance evaluations. This platform is designed to increase transparency, reduce administrative burdens, and build more collaborative relationships for positive financial impact. Visit this link to access PASSPort: https://passport.cityofnewyork.us/
PASSPort Public
PASSPort Public is a portal that is designed for data transparency and provides the public with insight into the City procurement system. The portal provides up-to-date information and status updates concerning vendors, solicitations, and contract registrations. Visit this link to access PASSPort Public: https://a0333-passportpublic.nyc.gov/
MOCS M/WBE Reporting
As of FY14, MOCS is required to publish quarterly reports on the progress of the M/WBE Program. The M/WBE Reports page on the MOCS website shares current and historical M/WBE reports and M/WBE Noncompetitive small purchase Compliance Report. Visit this link to access the M/WBE Reports Page: https://www.nyc.gov/site/mocs/partners/m-wbe-reports.page
City Record Online (CROL)
The City Record Online (CROL) is a fully searchable database of notices published in the City Record newspaper which includes but is not limited to public hearings and meetings, public auctions and sales, solicitations and awards and official rules proposed and adopted by city agencies. Visit this link to access CROL: https://a856-cityrecord.nyc.gov/
M/WBEs are encouraged to use CROL to receive notice and learn about current and upcoming procurement opportunities.
Agency Procurement Plans (LL-1 and LL-63)
Under Local Law 1, SBS and MOCS are required to publish an annual plan and schedule listing anticipated contracting opportunities for the coming fiscal year. These plans include the following information for each solicitation: the specific type and scale of the services to be procured, the term of the proposed contract, the method of solicitation the agency intends to utilize, and the anticipated fiscal year quarter of the planned solicitation. Similarly, under Local Law 63 of 2011, MOCS is required to publish a plan and schedule detailing the anticipated contract actions (for certain categories of procurement) of each City agency for the upcoming fiscal year. This requirement applies to contracts valued at more than $200K providing standard or professional services, including against agency task orders.
Both contracting plans are useful tools to give vendors notice about potential upcoming procurement opportunities with each agency.
These plans are available on the MOCS website. Visit: https://nyc.gov/site/mocs/reporting/local-law-1-procurements.page
Appendix B: M/WBE Asset Managers & Public Finance
The NYC Office of the Comptroller Bureau of Asset Management and Bureau of Public Finance released a report in November 2022 detailing the share of pension investments with M/WBE asset managers and emerging managers & the role of M/WBEs in public finance. The New York City Retirement Systems had a total of $16.82 billion in investments with or committed to M/WBE managers as of June 30, 2022. Those investments amount to 11.65% of U.S.-based actively managed assets, or approximately 7% of the total assets under management. In Fiscal Year 2022, the City of New York contracted with M/WBE firms for 30.4% of bond underwriting, 41.5% of financial and swap advising, and 22.3% of bond counsel.
The report is available at: https://comptroller.nyc.gov/reports/mwbe-and-emerging-manager-pension-investments-mwbe-participation-in-the-bureau-of-public-finance/
Appendix C: LL 174 Exclusions
In order to analyze the City’s utilization of M/WBEs in areas subject to LL 174 participation goals, this report excluded contracts and spending that fell into one of the following categories, pursuant to § 6-129(q) of the Administrative Code.
Award Method LL 174 Exclusions
| Award Method Code | Award Method |
| 5 | Sole Source |
| 6 | Emergency |
| 7 | Lessee Negotiation |
| 8 | Loan Negotiation |
| 9 | Rental Subsidy Negotiation |
| 10 | Renewal of Contract |
| 11 | Determined by Legal Mandate |
| 12 | Boro Needs/Discretionary Fund |
| 13 | Petition Private Use/Franchise |
| 14 | Concessionaire by Procedure |
| 15 | Renewal Franchise/Concession |
| 16 | Exempt Concession – Public Bid |
| 17 | Government-to-Government |
| 18 | Non-Procurement Transaction |
| 24 | Contract Conversion |
| 25 | Intergovernmental Procurement |
| 26 | Determined by Government Mandate |
| 28 | Buy Against |
| 29 | Assignment |
| 40 | DOE Listing Application |
| 41 | Cable Service Negotiation |
| 42 | Professional Membership Negotiation |
| 43 | Subscriptions Etc. per PPB |
| 44 | Public Utility |
| 45 | Small Purchase – Public Utility |
| 51 | Grants |
| 61 | Small Purchase – Renewal |
| 62 | Small Purchase – Intergovernmental |
| 68 | Force Account Negotiation |
| 78 | Real Estate Sales and Purchases |
| 79 | Watershed Land Negotiation |
| 99 | Miscellaneous |
| 100 | Small Purchase – Subscription etc. |
| 101 | Small Purchase – Professional Membership |
| 102 | Small Purchase – Grants |
| 103 | Small Purchase – Government-to-Government |
| 104 | Small Purchase – Assignment |
| 105 | Condemnations – Exempt OCA Processing |
| 106 | Small Purchase – Buy Against |
| 107 | Small Purchase Watershed Land Acquisition |
| 251 | Intergovernmental Procurement Renewal |
| 511 | Grant Renewal |
Contract Type LL 174 Exclusions
| Contract Type Code | Contract Type |
| 15 | Franchises |
| 17 | Revocable Consents |
| 18 | Permits |
| 20 | Concessions |
| 25 | Corpus Funded |
| 26 | Compensating Balance from Proceeds |
| 29 | Other Expense Contract or Revenue Related |
| 30 | Miscellaneous Revenue – No Expense |
| 35 | Lessee |
| 36 | Miscellaneous Property Rental |
| 39 | Lessor – Revenue |
| 40 | Lessor – Accounting Lines Exist |
| 41 | Cable Service |
| 42 | Professional Membership |
| 43 | Subscriptions |
| 44 | Public Utility |
| 46 | Requirements – Goods (Over $1 million) |
| 65 | Loans |
| 68 | Force Account Agreement |
| 70 | Programs |
| 72 | Programs (Not Tax Levy Funded) |
| 78 | Real Estate Sales and Purchases |
| 79 | Watershed Land Acquisition |
| 83 | Condemnations – Exempt OCA Processing |
| 85 | Intra-Agency Fund Agreements |
| 88 | New York City Bond Financing |
Industry LL 174 Exclusions
| Industry |
| Human Services |
| Goods (Over $1 million) |
Vendor-Related 174 Exclusions
| Vendor |
| NYC Economic Development Corporation |
| NYC Housing Authority |
Appendix D: Summary of Agencies Rated in This Report
This report rated M/WBE utilization among Mayoral Agencies, as well as the Department of Education and the Office of the Comptroller. The table below displays applicable agency codes names, and short names.
| Agency Code | Agency | Agency Short Name |
| 002 | Mayoralty | MAYOR |
| 015 | Office of the Comptroller | COMP |
| 017 | Department of Emergency Management | NYCEM |
| 025 | Law Department | LAW |
| 030 | Department of City Planning | DCP |
| 032 | Department of Investigation | DOI |
| 040 | Department of Education | DOE |
| 054 | Civilian Complaint Review Board | CCRB |
| 056 | Police Department | NYPD |
| 057 | Fire Department | FDNY |
| 068 | Administration for Children’s Services | ACS |
| 069 | Human Resources Administration (Department of Social Services) | HRA (DSS) |
| 071 | Department of Homeless Services | DHS |
| 072 | Department of Correction | DOC |
| 096 | Human Resources Administration | HRA |
| 125 | Department for the Aging | DFTA |
| 126 | Department of Cultural Affairs | DCLA |
| 136 | Landmarks Preservation Commission | LPC |
| 156 | NYC Taxi and Limousine Commission | TLC |
| 226 | Commission on Human Rights | HRC |
| 260 | Department of Youth and Community Development | DYCD |
| 781 | Department of Probation | DOP |
| 801 | Department of Small Business Services | SBS |
| 806 | Housing Preservation and Development | HPD |
| 810 | Department of Buildings | DOB |
| 816 | Department of Health and Mental Hygiene | DOHMH |
| 820 | Office of Administrative Trials and Hearings | OATH |
| 826 | Department of Environmental Protection | DEP |
| 827 | Department of Sanitation | DSNY |
| 829 | Business Integrity Commission | BIC |
| 836 | Department of Finance | DOF |
| 841 | Department of Transportation | DOT |
| 846 | Department of Parks and Recreation | DPR |
| 850 | Department of Design and Construction | DDC |
| 856 | Department of Citywide Administrative Services | DCAS |
| 857 | DCAS Division of Municipal Supply Service[67] | DCAS (DMSS) |
| 858 | Department of Information Technology and Telecommunications | DoITT |
| 860 | Department of Records and Information Services | DORIS |
| 866 | Department of Consumer Affairs | DCA |
Appendix E: Award Method Analysis Categories
This appendix provides additional information about the types of contracts and POs included in the analysis reflected in Table 11 and Table 12.
| Award Method Analysis Category | Award Method Codes (Unless Otherwise Specified) |
| Competitive Sealed Bid Contracts | 1, 3 |
| Competitive Sealed Proposal Contracts | 2, 22 |
| Accelerated Procurement Contracts | 27 |
| Demonstration Project Contracts | 23 |
| Innovative Procurement Contracts | 20 |
| Micropurchase Contracts | 30, 38, POs under $20k, POs under 35k under (CT 5 or CT 48 only) |
| Negotiated Acquisition Contracts | 21, 211 |
| Small Purchase Contracts – General | 31, 32, 35, 36, 37, 109, 111, 112, 113, POs over 35k, POs between 20k-35k (except for CT 5 and 48). |
| Small Purchase Contracts – M/WBE | 72 |
Appendices F-J: Additional Data
Appendix F: Summary of Contract and PO Totals, Subject to LL 174 Participation Goals
- This appendix contains a summary of contract and PO data (count and value) by agency and M/WBE Category
- Visit this link to view data:
https://comptroller.nyc.gov/wp-content/uploads/2023/02/Appendix-F_LL174_ContractsPOs.xlsx
Appendix G: Summary of Spend Data, Subject to LL 174 Participation Goals
- This appendix contains a dashboard (tab 1) and summary data (tab 2) displaying spend by year, agency, and prime/sub contract type.
- Visit this link to view data:
https://comptroller.nyc.gov/wp-content/uploads/2023/02/Appendix-G_LL174_SpendData.xlsx
Appendix H: Summary of M/WBE NCSP Registrations
- This appendix contains a summary of MWBE NCSP registration data (count and value) by agency and M/WBE category. Note, only data for agencies rated in this report are included in appendix H.
- Visit this link to view data:
https://comptroller.nyc.gov/wp-content/uploads/2023/02/Appendix-H_MWBE_NCSPs_LL174RatedAgencies.xlsx
Appendix I: Retroactive Contract Registrations by Agency
- This appendix contains a summary of all registered procurement contracts (not just subject to LL 174 participation goals) by agency and retroactivity status.
- As noted in the DOE section of this Report, lower dollar value purchases at or below DOE’s simplified procurement threshold, which generally does not exceed $25,000, were excluded from this analysis.
- Visit this link to view data:
https://comptroller.nyc.gov/wp-content/uploads/2024/02/Appendix-I_Retroactivity_LL174RatedAgencies-1.xlsx
Appendix J: Summary of Approved Subcontracts, Subject to LL 174 Participation Goals
- This appendix contains a summary of approved subcontracts (count and value), by agency, subject to LL 174 participation goals.
- Visit this link to view data:
https://comptroller.nyc.gov/wp-content/uploads/2023/02/Appendix-J_LL174_ApprovedSubcontracts.xlsx
Acknowledgments
Michael D’Ambrosio, Assistant Comptroller for the Bureau of Contract Administration and Kerri Nagorski, Director of Procurement Policy and Partnerships, were the lead authors of this report with support from Dan Roboff, Director of Procurement Research Analysis and Reporting, Charlette Hamamgian, Deputy Comptroller, Daphnie Agami, Senior Advisor and Counsel to the Deputy Comptroller, Naomi Dann, Communications Director, and Sadye Campoamor, Chief Equity Officer. The data analysis was led by Dan Roboff, Director of Procurement Research Analysis and Reporting. Report design was completed by Archer Hutchinson, Creative Director. Troy Chen, Edward Sokolowski, and Nicole Boone from the Comptroller’s Bureau of Information Systems and Technology, as well as REI Systems Inc, provided consulting and other support for this Report. Claire Pozniak and Mounir Lamrhari from the Comptroller’s Audit Bureau provided additional data and graphics support. The Comptroller’s Office of the General Counsel has reviewed portions of this report.
Thank you to the M/WBE community and advocates for important contributions to this report, including the M/WBEs and agencies that participated in the Comptroller’s Office focus groups in Fall 2022.
Thank you as well to Robert Wu, Feliks Lev, and Suzanne Barbee at the Financial Information Services Agency for generously providing their time and expertise.
Endnotes
[1] A note on terminology: For the purposes of this report, “M/WBE” refers to a City-Certified Minority or Women-Owned Business Enterprise. Terms used in this report such as “Minority” and “Hispanic” are based on the NYC Administrative Code and Local Law 174 and align with the certification status in the various systems and databases designed to implement those laws. Such terms are necessary for measurement, but they also have many shortcomings. They often do not reflect how people refer to themselves and fail to convey the expansiveness of human identities. There are no categories for people of two or more races, LGBTQ contractors, or people with disabilities. New York City is already a “majority minority” city. While this report is designed to measure outcomes under the existing legal framework, legislative or administrative changes would be welcome to update the categories better reflect the diverse population of New York City.
[2] https://www.nyc.gov/office-of-the-mayor/news/063-23/mayor-adams-outlines-working-people-s-agenda-nyc-second-state-the-city-address#/0 (January 26, 2023)
[3] The City’s M/WBE Program is currently governed by Section 6-129(b) of the N.Y.C. Administrative Code, which codifies Local Laws 174 and 176 enacted by the City Council in 2019. This figure includes many areas of contracting that are not subject to LL 174 participation goals, including human services contracts (which account for over a third of the total volume of registered contracts citywide). It also does not include emergency contracts or contracts for non-mayoral agencies.
[4] At the end of FY22, there were 10,768 certified vendors in the SBS Directory. 1,912 unique M/WBEs had a registered prime contract, subcontract, or PO in FY22.
[5] State legislation was adopted granting authority to the DOE to utilize the same framework as LL 174 in 2020. The Panel for Educational Policy approved this change during FY23.
[6] See Appendix C for a full list of exclusions used to arrive at a subset of contracts subject to LL 174 participation goals.
[7] https://www.census.gov/quickfacts/newyorkcitynewyork
[8] Though it is not a mayoral agency, the “M/WBE Utilization by Agency” section of this Report includes utilization data for the Comptroller’s Office for purposes of transparency and shared accountability. This section also includes Department of Education (DOE) utilization data, given the size and value of its contracting portfolio.
[9] In FY22 there was one PO registered to a male-owned Native American MBE.
[10] Zero new prime contracts were awarded to Native American M/WBEs in FY22, and the value of purchase orders amounted to less than .01% of total value in each FY, so Native American M/WBEs were not included in this chart.
[11] See Appendix E for more details about the types of contracts and POs included in this analysis.
[12] Numbers in this table for “Micropurchase Contracts” and “Small Purchase Contracts – General” include Purchase Orders
[13] These numbers reflect the citywide total of M/WBE NCSP registrations. Among LL 174-rated agencies, 827 M/WBE NCSPs were registered in FY22.
[14] Numbers in this table for “Micropurchase Contracts” and “Small Purchase Contracts – General” include Purchase Order data. See Appendix E for additional information.
[15] There were only three Innovative Procurement contracts registered to M/WBEs relative to 100 such contracts for Non-Certified firms. The M/WBE average is skewed by a Design Build contract that was registered to a white WBE for $125 million.
[16] This average may have been skewed by a single large contract which was awarded to a M/WBE for $176 million.
[17] MOCS FY2022 Annual Compliance Report
[18] Due to source data limitations, a specific number that shows the full scope of M/WBEs currently doing business with the City is not available, as many M/WBEs may be doing business through a current contract that was registered in a prior fiscal year.
[19] MOCS publishes all agency LL-63 plans on its website: https://www.nyc.gov/site/mocs/reporting/local-law-63-procurements.page
[20] N.Y.C. Admin. Code §6-129 defines “Minority group” to say that “that the commissioner shall be authorized to add additional groups to this definition upon a finding that there is statistically significant disparity between the availability of firms owned by individuals in such a group and the utilization of such firms in city procurement.”
[21] 9 RCNY §4-13(c)
[22] N.Y.C. Admin. Code §6-129(i)(6)(a)
[23] In April 2022, then First Deputy Mayor Lorraine Grillo announced the development of a Capital Process Reform Task Force. The Comptroller’s Office is a proud and active member of the Task Force, which seeks to advance legislative and procedural changes in support of a more efficient and equitable capital process. The final set of immediate recommendations from this Task Force were published in January 2023.
[24] N.Y.C. Admin. Code §6-129(m)
[25] These numbers exclude registered M/WBE NCSPs that were listed as registered to Non-Certified firms at the time this data was pulled from FMS in January 2023. These records may reflect businesses that have lost their M/WBE certification since registration or agency input errors.
[26] Agencies are permitted to increase the value of M/WBE NCSP method contract through a contract modification so long as they do not exceed the stipulated threshold. The agency must also comply with any necessary rules and procedures for the contract modification.
[27] Federal Acquisition Rules cap the usage of the M/WBE NCSP award method at $250,000 for contracts funded with federal dollars. This may prevent agencies from utilizing this method for contracts with combined funding sources (that include $250,000 or more dollars from federal funds).
[28] These numbers exclude registered M/WBE NCSPs that were listed as registered to Non-Certified firms at the time this data was pulled from FMS in January 2023. These records may reflect businesses that have lost their M/WBE certification since registration or agency input errors.
[29] This table does not include records attributed to Non-Certified vendors. The total number of contracts and average of all M/WBE contracts in this table reflect all LL 174-rated agencies, the DOE, and the Comptroller’s Office. There were 2,513 contracts registered to M/WBEs in this universe, for an average value of $857,132.
[30] Executive Order 26 was signed on February 16, 2023
[31] NYCEDC is a nonprofit organization incorporated under the Not-for-Profit Corporation Law of the State of New York. SBS contracts with and retains EDC to function as a development consultant and provide economic development-related services on behalf of the City.
[32] The data in this section uses rules employed by Checkbook NYC to assign industry classifications based on contract characteristics such as award category, contract type, and expense category. Contracts that could not be mapped to the Construction, Goods, Professional Services, or Standard Service industries using these rules were labeled as “unclassified contracts.”
[33] DBEs are for-profit small business concerns where socially and economically disadvantaged individuals own at least a 51% interest and also control management and daily business operations. African Americans, Hispanics, Native Americans, Asian-Pacific and Subcontinent Asian Americans, and women are presumed to be socially and economically disadvantaged. Other individuals can also qualify as socially and economically disadvantaged on a case-by-case basis. The federal Department of Transportation’s DBE program is designed to remedy ongoing discrimination and the continuing effects of past discrimination in federally-assisted highway, transit, airport, and highway safety financial assistance transportation contracting markets nationwide. More information can be found at this link: https://www.transportation.gov/civil-rights/disadvantaged-business-enterprise/definition-disadvantaged-business-enterprise
[34] Two contracts were excluded from this analysis because they are considered non-procurement corpus-related contracts.
[35] The overwhelming driver of DOE’s procurement volume is driven by lower dollar value purchases at or below its simplified procurement threshold, which generally does not exceed $25,000. These contracts were excluded from Chart 67.
[36] NYCEDC has its own Minority, Women-Owned, and Disadvantaged Business Enterprises (M/W/DBE) program that is not included in this Report.
[37] 9 RCNY §1-01(e)
[38] 9 RCNY §1-01(e)
[39] NYC Charter §823(a)
[40] As of January 10, 2023, DCAS, the Comptroller, and MOCS have authorized agencies to make purchases of goods using the M/WBE NCSP method up to $1,000,000 without involving DCAS. Notwithstanding the above, the DCAS Office of Citywide Procurement (OCP) shall continue procuring all fuel, furniture, and vehicles regardless of dollar value. Agencies may continue procuring non-bulk food (e.g., event catering) and public health/safety gods (i.e., commodities used to protect the general welfare of the public including, but not limited to, medical supplies, law enforcement equipment, emergency response supplies/equipment and fire/life safety equipment) at values not to exceed $100,000 per twelve-month period.
[41] 9 RCNY §1-01(e)
[42] 9 RCNY §1-01(e)
[43] This table does not include M/WBE NCSPs registered to firms that were not listed as certified in FMS as of January 2023.
[44] The data in Table 194 uses rules employed by Checkbook NYC to assign industry classifications based on contract characteristics such as award category, contract type, and expense category. Contracts that could not be mapped to the Construction, Goods, Professional Services, or Standard Service industries using these rules were labeled as “unclassified contracts.”
[45] N.Y.C. Admin. Code §6-129(i)(6)(a) defines “Agency” as a ”city, county, borough, or other office, position, administration, department, division, bureau, board or commission, or a corporation, institution or agency of government, the expenses of which are paid in whole or in part from the city treasury.”
[46] 9 RCNY §3-08
[47] The M/WBE NCSP method is an exception to this threshold
[48] 9 RCNY §3-08
[50] Governed by PPB Rule §3-12
[51] GML §103 and applicable sections of the Code of Federal Regulations (CFR)
[52] NYC Charter §313
[53] GML § 100(5)
[54] NYC Charter §324
[55] PPB Rules §3-03(a)
[56] NYC Charter §319
[57] See PPB Rules §1-01(e), 3-02(o)(1)(iv), 3-03(a)(1), 3-03(g), and 3-03(g)(6)
[58]N.Y.C. Admin. Code §6-129(h)(2)(a)(e)
[59] NYC Office of the Comptroller Annual Summary Contracts Report Section “Group 2: Limited or Non-competitive Methods”
[60] NYC Charter §315 and 9 RCNY §3-06
[61] N.Y.C. Admin. Code §6-129(h)(2)(a)
[62] The data analyses pertaining to LL 174 participation goals included in this report use exclusions that align with these specified exceptions, detailed further in Appendix C.
[63] N.Y.C. Admin. Code §6-129(g)(2)
[64] N.Y.C. Admin. Code §6-129(g)(1)
[65] Pursuant to §11-61(d)(4)(a) of the Rules of the City of New York
[66] Chapter 11(B) of Title 66 of the Rules of the City of New York lays out the City’s M/WBE Certification Program within SBS’ division of economic and financial opportunity.
[67] For the purposed of this report, registered contracts and POs under the DCAS Division of Municipal Supply Service were attributed to DCAS