Comments on New York City’s Preliminary Budget for Fiscal Year 2023 and Financial Plan for Fiscal Years 2022-2026
I. Executive Summary
The Preliminary Budget closes the $2.88 billion budget gap projected in November, on the strength of an expected $2.77 billion surplus in FY 2022, derived primarily from $1.60 billion in additional tax revenues and savings of $866 million from the Program to Eliminate the Gap (PEG). Out-year gaps are $2.72 billion in FY 2024, $2.23 billion in FY 2025 and $3.01 billion in FY 2026.
The Comptroller’s Office’s analysis of the Financial Plan indicates that the City could end FY 2022 with $1.37 billion in additional resources, driven by higher tax revenues (noting that tax collections through January are $1.6 billion ahead of the November projection, and nearly the same as the Mayor’s total projected increase, with five months remaining in the fiscal year). However, expense risks outweigh tax revenue offsets for the remainder of the plan, with net risks of $119 million in FY 2023, increasing to $1.42 billion in FY 2026. As a result, gaps could reach $3.25 billion in FY 2024, $2.93 billion in FY 2025, and $4.43 billion in FY 2026.
The FY 2023 Preliminary Budget totals $98.54 billion, $8.0 billion less than the modified FY 2022 budget. The drop is attributable to lower Federal COVID relief, which falls to $2.33 billion in FY 2023 from $10.20 billion in FY 2022. Over the five years of the plan, Federal COVID relief, excluding $750 million in unrestricted FEMA relief and $294 million in unrestricted State and Local Fiscal Recovery Fund grants, totals $15.24 billion.
Both the Comptroller’s and the Mayor’s baseline economic scenarios assume growth will slow down in tandem with inflation as the economy adjusts to higher interest rates. In these scenarios, there is a decline in personal income and business taxes, with the Mayor front-loading the drop in FY 2022. In the Mayor’s projections, the unexpected strength in the FY 2023 tentative assessment roll is tempered by the assumption of very high reductions from tax appeals. Due to the combination of lower growth in assessments and a higher share of uncollectible levy, the Mayor expects property tax receipts to grow on average by 1.6 percent per year versus the Comptroller’s 2.5 percent.
There are significant new needs proposed by the Mayor in the Preliminary Budget. The larger additions are in Fair Fares, Fair Futures, the Summer Youth Employment Program, and New Family Home Visits for a total of nearly $200 million a year in FY 2023 – FY 2026. The Mayor is also proposing to increase the City’s EITC at a cost of $250 million per year and the creation of two new tax programs to favor the provision of child care at a cost of $50 million per year.
The Financial Plan removes the previously assumed but unspecified labor savings of $500 million per year starting in FY 2023. The Financial Plan also partially addresses funding shortfalls in charter school tuition, pupil transportation, and homeless shelters. The funding is baselined and absorbs $548 million in FY 2023 and nearly $600 million on average in FY 2024-FY 2026. These costs and the removal of the unspecified labor savings are covered by PEG savings of $1.1 billion per year in FY 2023 – FY 2026.
In the Comptroller’s estimate, however, a combination of under-budgeting of recurring expenditures for overtime, charter school tuition, Carter cases, homeless shelters, rental assistance, paratransit, and prevailing wages for shelter security guards; along with the potential extension of a number of ongoing education initiatives supported by time-limited stimulus funds poses additional expense risks of $1.04 billion in FY 2023, $1.10 billion in FY 2024, $1.31 billion in FY 2025, and $2.00 billion in FY 2026.
While the Comptroller’s restated gaps remain manageable by historical standards, they do not reflect key risks. First, with all City labor agreements set to expire by 2023 and collective bargaining set to begin amidst rising inflation, the City’s reserve to fund labor contracts assumes no raises for the first two years and 1 percent raises each year after. A citywide full-year additional raise of 1 percent would cost $450 million annually. Economic risk is more difficult to quantify and stems from the possibility that a fast monetary tightening will push the economy into recession, particularly if repercussions from the Ukrainian conflict were to further stoke inflationary pressures.
In light of these risks, the Financial Plan falls short by increasing reserves by only a nominal amount. A structured approach is needed to regulate deposits into and withdrawals from the City’s Rainy Day Fund, in order to build an adequate cushion to limit the damage of fiscal tightening during future downturns.
Table 1. FY 2022 – FY 2026 Financial Plan
| ($ in millions) | FY 2022 | FY 2023 | FY 2024 | FY 2025 | FY 2026 | Change FYs 2022 –2026 | |
|---|---|---|---|---|---|---|---|
| Dollar | Percent | ||||||
| Revenues | |||||||
| Taxes: | |||||||
| General Property Tax | $29,554 | $31,034 | $31,291 | $31,466 | $31,526 | $1,972 | 6.7% |
| Other Taxes | 33,555 | 34,117 | 35,762 | 37,455 | 38,488 | 4,933 | 14.7% |
| Tax Audit Revenues | 921 | 721 | 721 | 721 | 721 | (200) | (21.7%) |
| Subtotal: Taxes | $64,030 | $65,872 | $67,774 | $69,642 | $70,735 | $6,705 | 10.5% |
| Miscellaneous Revenues | 7,250 | 6,980 | 7,036 | 7,065 | 7,092 | (158) | (2.2%) |
| Unrestricted Intergovernmental Aid | 1,044 | 0 | 0 | 0 | 0 | (1,044) | (100.0%) |
| Less: Intra-City Revenues | (2,153) | (1,850) | (1,848) | (1,838) | (1,838) | 315 | (14.6%) |
| Disallowances Against Categorical Grants | (15) | (15) | (15) | (15) | (15) | 0 | 0.0% |
| Subtotal: City-Funds | $70,156 | $70,987 | $72,947 | $74,854 | $75,974 | $5,818 | 8.3% |
| Other Categorical Grants | 1,149 | 1,013 | 1,006 | 1,005 | 1,001 | (148) | (12.9%) |
| Inter-Fund Revenues | 730 | 734 | 732 | 731 | 731 | 1 | 0.1% |
| Federal Categorical Grants | 18,014 | 9,385 | 8,644 | 7,928 | 6,902 | (11,112) | (61.7%) |
| State Categorical Grants | 16,490 | 16,417 | 16,642 | 16,888 | 16,943 | 453 | 2.7% |
| Total Revenues | $106,539 | $98,536 | $99,971 | $101,406 | $101,551 | ($4,988) | (4.7%) |
| Expenditures | |||||||
| Personal Service | |||||||
| Salaries and Wages | $31,235 | $30,599 | $30,676 | $30,880 | $31,197 | ($38) | (0.1%) |
| Pensions | 9,932 | 9,665 | 9,048 | 8,176 | 7,561 | (2,371) | (23.9%) |
| Fringe Benefits | 12,298 | 12,643 | 13,729 | 14,683 | 15,398 | 3,100 | 25.2% |
| Subtotal-PS | $53,465 | $52,907 | $53,453 | $53,739 | $54,156 | $691 | 1.3% |
| Other Than Personal Service | |||||||
| Medical Assistance | $6,546 | $6,494 | $6,494 | $6,494 | $6,494 | ($52) | (0.8%) |
| Public Assistance | 1,651 | 1,650 | 1,650 | 1,650 | 1,650 | (1) | (0.1%) |
| All Other | 41,891 | 33,820 | 33,428 | 33,542 | 33,251 | (8,640) | (20.6%) |
| Subtotal-OTPS | $50,088 | $41,964 | $41,572 | $41,686 | $41,395 | ($8,693) | (17.4%) |
| Debt Service | |||||||
| Principal | $3,318 | $4,051 | $4,188 | $4,120 | $4,202 | $884 | 26.6% |
| Interest & Offsets | 3,446 | 3,891 | 4,077 | 4,683 | 5,395 | 1,949 | 56.6% |
| Subtotal Debt Service | $6,764 | $7,942 | $8,265 | $8,803 | $9,597 | $2,833 | 41.9% |
| FY 2021 BSA and Discretionary Transfers | ($6,107) | $0 | $0 | $0 | $0 | $6,107 | (100.0%) |
| FY 2022 BSA | $3,732 | ($3,732) | $0 | $0 | $0 | ($3,732) | (100.0%) |
| Capital Stabilization Reserve | $0 | $250 | $250 | $250 | $250 | $250 | NA |
| General Reserve | $250 | $1,055 | $1,000 | $1,000 | $1,000 | $750 | 300.0% |
| Deposit to Rainy Day Fund | $500 | $0 | $0 | $0 | $0 | ($500) | (100.0%) |
| Less: Intra-City Expenses | ($2,153) | ($1,850) | ($1,848) | ($1,838) | ($1,838) | $315 | (14.6%) |
| Total Expenditures | $106,539 | $98,536 | $102,692 | $103,640 | $104,560 | ($1,979) | (1.9%) |
| Gap to be Closed | $0 | $0 | ($2,721) | ($2,234) | ($3,009) | ($3,009) | NA |
NOTE: Numbers may not add to totals due to rounding.
Table 2. Plan-to-Plan Changes
February 2022 Plan vs. November 2021 Plan
| ($ in millions) | FY 2022 | FY 2023 | FY 2024 | FY 2025 |
| Revenues | ||||
| Taxes: | ||||
| General Property Tax | $122 | $842 | $672 | $439 |
| Other Taxes | 1,481 | (407) | (462) | (232) |
| Tax Audit Revenues | 0 | 0 | 0 | 0 |
| Subtotal: Taxes | $1,603 | $435 | $210 | $207 |
| Miscellaneous Revenues | 110 | 449 | 498 | 498 |
| Unrestricted Intergovernmental Aid | 294 | 0 | 0 | 0 |
| Less: Intra-City Revenues | (69) | (401) | (398) | (394) |
| Disallowances Against Categorical Grants | 0 | 0 | 0 | 0 |
| Subtotal: City-Funds | $1,938 | $483 | $310 | $311 |
| Other Categorical Grants | 29 | 20 | 15 | 15 |
| Inter-Fund Revenues | 1 | 2 | 2 | 1 |
| Federal Categorical Grants | 1,500 | 101 | 31 | 13 |
| State Categorical Grants | 224 | 5 | 5 | 1 |
| Total Revenues | $3,692 | $611 | $363 | $341 |
| Expenditures | ||||
| Personal Service | ||||
| Salaries and Wages | ($138) | ($346) | ($412) | ($492) |
| Pensions | 0 | 0 | 0 | 0 |
| Fringe Benefits | (26) | 316 | 306 | 302 |
| Subtotal-PS | ($164) | ($30) | ($106) | ($190) |
| Other Than Personal Service | ||||
| Medical Assistance | $0 | $0 | $0 | $0 |
| Public Assistance | 0 | 0 | 0 | 0 |
| All Other | 1,235 | 924 | 927 | 1,096 |
| Subtotal-OTPS | $1,235 | $924 | $927 | $1,096 |
| Debt Service | ||||
| Principal | $0 | $0 | $24 | $26 |
| Interest & Offsets | (27) | (52) | (94) | (103) |
| Subtotal Debt Service | ($27) | ($52) | ($70) | ($77) |
| FY 2021 BSA and Discretionary Transfers | $0 | $0 | $0 | $0 |
| FY 2022 BSA | $2,767 | ($2,767) | $0 | $0 |
| Capital Stabilization Reserve | $0 | $0 | $0 | $0 |
| General Reserve | ($50) | $55 | $0 | $0 |
| Deposit to Rainy Day Fund | $0 | $0 | $0 | $0 |
| Less: Intra-City Expenses | ($69) | ($401) | ($398) | ($394) |
| Total Expenditures | $3,692 | ($2,271) | $353 | $435 |
| Gap to be Closed | $0 | $2,882 | $10 | ($94) |
NOTE Numbers may not add to totals due to rounding.
Table 3. Plan-to-Plan Changes
February 2022 Plan vs. June 2021 Plan
| ($ in millions) | FY 2022 | FY 2023 | FY 2024 | FY 2025 |
| Revenues | ||||
| Taxes: | ||||
| General Property Tax | $122 | $842 | $672 | $439 |
| Other Taxes | 1,552 | (407) | (462) | (232) |
| Tax Audit Revenues | 0 | 0 | 0 | 0 |
| Subtotal: Taxes | $1,674 | $435 | $210 | $207 |
| Miscellaneous Revenues | 377 | 508 | 575 | 591 |
| Unrestricted Intergovernmental Aid | 1,044 | 0 | 0 | 0 |
| Less: Intra-City Revenues | (262) | (410) | (409) | (404) |
| Disallowances Against Categorical Grants | 0 | 0 | 0 | 0 |
| Subtotal: City-Funds | $2,833 | $533 | $376 | $394 |
| Other Categorical Grants | 124 | 20 | 15 | 15 |
| Inter-Fund Revenues | 5 | 9 | 7 | 6 |
| Federal Categorical Grants | 4,317 | 141 | 41 | 20 |
| State Categorical Grants | 537 | 109 | 16 | 11 |
| Total Revenues | $7,816 | $812 | $455 | $446 |
| Expenditures | ||||
| Personal Service | ||||
| Salaries and Wages | ($188) | ($212) | ($270) | ($348) |
| Pensions | (105) | (804) | (1,612) | (2,421) |
| Fringe Benefits | (79) | 804 | 796 | 793 |
| Subtotal-PS | ($372) | ($212) | ($1,086) | ($1,976) |
| Other Than Personal Service | ||||
| Medical Assistance | $0 | $0 | $0 | $0 |
| Public Assistance | 0 | 0 | 0 | 0 |
| All Other | 5,033 | 1,509 | 1,358 | 1,541 |
| Subtotal-OTPS | $5,033 | $1,509 | $1,358 | $1,541 |
| Debt Service | ||||
| Principal | ($185) | $213 | ($113) | $40 |
| Interest & Offsets | (80) | (662) | (411) | (590) |
| Subtotal Debt Service | ($265) | ($449) | ($524) | ($550) |
| FY 2021 BSA and Discretionary Transfers | $0 | $0 | $0 | $0 |
| FY 2022 BSA | $3,732 | ($3,732) | $0 | $0 |
| Capital Stabilization Reserve | $0 | $0 | $0 | $0 |
| General Reserve | ($50) | $55 | $0 | $0 |
| Deposit to Rainy Day Fund | $0 | $0 | $0 | $0 |
| Less: Intra-City Expenses | ($262) | ($410) | ($409) | ($404) |
| Total Expenditures | $7,816 | ($3,239) | ($661) | ($1,389) |
| Gap To Be Closed | $0 | $4,051 | $1,116 | $1,835 |
NOTE: Numbers may not add to totals due to rounding.
Table 4. Risks and Offsets to the February 2022 Financial Plan
($ in millions, positive numbers decrease the gap and negative numbers increase the gap)
| FY 2022 | FY 2023 | FY 2024 | FY 2025 | FY 2026 | |
| City Stated Gap | $0 | $0 | ($2,721) | ($2,234) | ($3,009) |
| Tax Revenues | |||||
| Property Tax | $15 | $317 | $696 | $957 | $1,122 |
| Personal Income Tax | 426 | (257) | (165) | 49 | 114 |
| Business Taxes | 247 | 66 | (209) | (325) | (450) |
| Sales Tax | 214 | 361 | 55 | (98) | (89) |
| Real Estate Transaction Taxes | 416 | 37 | (135) | (301) | (452) |
| All Other | 7 | 27 | (60) | (54) | (54) |
| Audit | 80 | 250 | 250 | 250 | 250 |
| Subtotal Tax Revenues | $1,405 | $801 | $432 | $478 | $441 |
| Non-Tax Revenues | |||||
| Fines | $60 | $29 | $26 | $26 | $26 |
| Interest Income | 0 | 14 | 45 | 33 | $36 |
| Subtotal Non-Tax Revenues | $60 | $43 | $71 | $59 | $62 |
| Expenditures | |||||
| Overtime | ($431) | ($348) | ($150) | ($150) | (150) |
| Charter School Tuition | 0 | 0 | (240) | (320) | (500) |
| Carter Cases | (100) | (300) | (300) | (300) | ($300) |
| 3K Expansion | 0 | 0 | 0 | 0 | (376) |
| Special Ed Pre-K Expansion | 0 | 0 | 0 | (47) | (95) |
| DOE Mental Health Services | 0 | 0 | 0 | (37) | (86) |
| Community Schools Expansion/Sustainability | 0 | 0 | 0 | (27) | (54) |
| Homeless Shelters | 0 | (117) | (117) | (117) | (117) |
| Rental Assistance | 0 | (177) | (177) | (177) | (177) |
| Paratransit Funding | (28) | (55) | (77) | (91) | (105) |
| Prevailing Wage for Shelter Security Guards | 0 | (41) | (41) | (41) | (41) |
| VRDB Interest Savings | 30 | 75 | 75 | 75 | 75 |
| eFMAP Savings | 180 | 0 | 0 | 0 | 0 |
| General Reserve | 250 | 0 | 0 | 0 | 0 |
| Subtotal | ($99) | ($963) | ($1,027) | ($1,232) | ($1,926) |
| Total (Risks)/Offsets | $1,366 | ($119) | ($524) | ($695) | ($1,423) |
| Restated (Gap)/Surplus | $1,366 | ($119) | ($3,245) | ($2,929) | ($4,432) |
NOTE: Numbers may not add to totals due to rounding.
II. The City’s Economic Outlook
The U.S. Economy in 2021
The U.S. economy grew robustly in 2021, with real Gross Domestic Product (GDP) increasing 5.7 percent from 2020, and at an even faster annualized rate of 7.0 percent in the fourth quarter. It was the quickest pace of annual growth since 1984, driven by the ongoing rebound from the pandemic, low interest rates, and the $1.9 trillion in economic stimulus from the American Rescue Plan Act of 2021.
Seasonally adjusted U.S. employment rebounded to 149.1 million in December 2021, up from 143.0 million in January 2021, and only 2 percent below the all-time high of 152.5 million in February 2020. The seasonally adjusted U.S. unemployment rate fell from 6.4 percent in January 2021 to 3.9 percent in December, approaching the pre-pandemic low of 3.5 percent in January 2020.
Although over 6 million returned to work through the course of the year, many Americans who dropped out of the labor force during the pandemic, have stayed out. The seasonally adjusted labor force participation rate was 61.9 percent in December, up from a low of 60.2 percent in April 2020, but still well below the pre-pandemic 63.4 percent of February 2020.
This economic rebound occurred despite a pandemic which, by many measures, continued through the year. The CDC reports 459,365 U.S. deaths for which COVID was the primary or contributing factor in 2021, even higher than the 385,474 in 2020, the first year of the pandemic.
With the pandemic ongoing and the economy still reeling early in the year, the Federal government passed the American Rescue Plan Act of 2021 in March, providing $1.9 trillion in tax credits, fiscal aid to states, school aid, support for small businesses, rental assistance, and direct payments to Americans.
The Federal Reserve held the federal funds rate close to zero percent through the year, and continued its assets purchase program to provide liquidity and lower long-term rates, increasing its balance sheet by over $1.4 trillion in 2021.
Low borrowing costs and the ongoing desire of many to work from home stimulated demand for housing, particularly outside of major cities. The Case-Schiller home price index rose 18.8 percent in 2021, the fastest pace of home price appreciation since the 1987 inception of the index.
Rising home prices were just one factor driving U.S. inflation. The Consumer Price Index was up 7 percent in 12 months ending December 2021, the fastest rate of U.S. inflation in the since 1982. As low interest rates facilitated borrowing, and fiscal stimulus put more money in the pockets of many Americans, demand for goods rose. The U.S. economy struggled to meet this demand. Overseas goods production remained disrupted by COVID and COVID containment measures, such as those in China, and U.S. ports, particularly on the west coast, were congested by the large volume of imports. Domestically, decreased labor force participation meant fewer workers were available to move products around the county, onto shelves, and into the hands of consumers, exerting upward pressure on wages and consumer prices.
But rising inflation has not been contained to the markets for goods and homes. Inflation in the service sector, as measured by the CPI for services less rent of shelter, has been elevated for most of 2021 and hit 4.7 percent in January 2022, from January a year ago, the highest rate of increase since 2008. Service sector inflation has the potential to grow even worse with many still out of the labor force, and consumer demand transitioning back to pre-COVID spending patterns, which include more travel, dining out, and spending on entertainment and other services away from home.
U.S. Economic Outlook
As U.S. COVID cases, hospitalizations and deaths continue to fall without new COVID variants of concern on the horizon, inflation presents the greatest immediate threat to an ongoing U.S. economic recovery. Some price pressures are due to COVID-related supply chain disruptions, and can be expected to abate over time as the world’s economy adjusts. Some inflation is attributable to prices rebounding from depressed pandemic lows, particularly earlier in 2021, and is temporary. But some inflation is attributable to fiscal stimulus and loose monetary policy, which contribute to ongoing excess demand. The Federal Reserve will have to raise U.S. interest rates to slow the overheated economy and bring greater price stability.
Taming inflation without throwing the economy back into recession is delicate business. Prolonged periods of low interest rates have a tendency to inflate the prices of homes, stocks and other assets. When interest rates start rising it can reveal speculative excesses in new and over-leveraged sectors of the economy.
U.S. inflationary concerns are compounded by the war in Ukraine. Russia is a major exporter of oil, gas, and metals, and both Russia and Ukraine are among the world’s largest grain exporters. War and trade sanctions drive food and oil prices higher (prices which have a disproportionate impact on lower-income Americans), further complicating the Federal Reserve’s policy tightening without pushing the economy into a recession.
New York City’s Economic Condition and Outlook
New York City entered 2021 with private employment at a seasonally adjusted 3,464,000 in January, down from a pre-pandemic high of 4,095,000 in February 2020. A winter COVID surge peaked with over 8,000 cases on January 4th, 2021. Restaurants were closed to indoor dining, Broadway and many entertainment venues remained shuttered. The U.S. remained closed to most international visitors, schools were closed to in-person learning, and most office workers continued working remotely.
Nonetheless, newly approved vaccines brought the hope of a timely end to the pandemic, and a return to normal life. Vaccines remained in short supply through the winter months, with eligibility extended to those between 65 and 75 in January, to restaurant workers and taxi drivers in February, and those over age 50 in April. February also brought a return to indoor dining and fitness in New York City, and a return of middle-school students to in-person learning. High school students returned to schools in March.
However, the process of reopening was not smooth. The July wave caused by the Delta variant led most New York City businesses to postpone their return to offices. In August, New York City began requiring proof of vaccination for indoor dining, at gyms, and at indoor entertainment venues. In September, Broadway reopened with a vaccine mandate and mask requirement for theatre goers, and most municipal workers returned to offices full-time. In October, the City announced unvaccinated teachers would be put on unpaid leave, and in November announced the same would apply to other unvaccinated municipal employees. November also brought a reopening of the U.S. to international visitors. Through the course of the year greater vaccine availability, and widespread mandates, brought the vaccinated share of New York City residents steadily higher, rising above 80 percent in December.
Calendar year 2021 ended with the arrival of the even more infectious Omicron variant, and another winter COVID surge. 56,790 new cases were reported on December 27th, a pandemic high to be surpassed only by the 60,612 on January 3, 2022. However, the economic repercussions appear to have been less severe.
The reopening of the economy in 2021 fell short of a full return to normal. New York City private employment finished the year at a seasonally adjusted 3,682,000, up 218,000 from January, but 413,000 below the pre-pandemic peak of 4,095,000 in February of 2020. Job losses from pre-pandemic levels were concentrated in the Accommodation and Food Services and Retail sectors, and employment in these sectors is likely to remain depressed from pre-pandemic levels, as many of the office workers that once patronized Manhattan bars, restaurants and stores on a daily basis continue to work remotely, at least part of the time.
Table 5. New York City Employment and Changes as of December 2021
| (Seasonally Adjusted, thousands) | Dec. ‘21 | Change from Feb. 2020 Peak | Change from Apr. ‘20 Lows | Change from Jan. ‘21 | Change from Nov. ’21 |
| Total Private Employment | 3,682 | (413) | 509 | 218 | 15 |
| Financial Activities | 457 | (30) | (12) | (10) | (0) |
| Information | 222 | (7) | 16 | 14 | 2 |
| Professional and Business Serv. | 738 | (40) | 50 | 44 | 6 |
| Educational Services | 232 | (24) | 2 | 4 | (1) |
| Healthcare and Social Assistance | 799 | (21) | 88 | 26 | (1) |
| Arts, Entertainment & Recreation | 77 | (18) | 26 | 25 | 4 |
| Accommodation and Food Serv. | 251 | (122) | 143 | 78 | 2 |
| Other Services | 161 | (34) | 32 | 6 | (0) |
| Retail Trade | 301 | (44) | 71 | 15 | 2 |
| Wholesale Trade | 123 | (17) | 14 | 4 | 1 |
| Transportation and Warehousing | 121 | (14) | 22 | 15 | 1 |
| Utilities | 15 | (1) | (0) | (0) | (0) |
| Construction | 132 | (30) | 44 | (3) | (2) |
| Manufacturing | 53 | (12) | 14 | 0 | 1 |
Source: N.Y. Dept. of Labor, seasonally adjusted by NYC OMB
Continuing patterns of remote work present one of the greatest challenges to New York City’s economic recovery going forward. New York City’s holiday COVID surge depressed year-end office occupancy to 10 percent of pre-pandemic levels, the lowest in 2021.[1] Although office occupancy is recovering, telecommuting is likely to remain an important part of office work going forward, and this will continue to be felt in the demand for retail and office space.
Although New York City office vacancy fell to 124 million square feet at the end of 2021, down from a peak of almost 128 million square feet in the second quarter, it remains well above pre-pandemic levels. Average asking rents per square foot have fallen from a $69 at the end of 2019 to around $65 at the end of 2021.
Chart 1. Total New York City Office Square Footage Available for Rent, and Average Asking Rents

Source: CoStar
The Comptroller’s Office forecast has robust New York City economic and employment growth continuing in 2022, as COVID cases continue to decline without a resurgence from new COVID variants or resort to non-pharmaceutical interventions. Economic growth is forecast to slow in the outyears as interest rates rise steadily to rein in inflation, cooling asset and labor markets, but without throwing the economy into recession.
Table 6. Selected Economic Indicators, Annual Averages,
Comptroller and Mayor’s Forecast, 2021 to 2026
| 2021 | 2022 | 2023 | 2024 | 2025 | 2026 | ||
|---|---|---|---|---|---|---|---|
| SELECTED U.S. ECONOMIC INDICATORS (ANNUAL AVERAGES) | |||||||
| Real GDP (2012 $, % Change) | Comptroller | 5.7 | 3.9 | 2.9 | 2.6 | 2.2 | 2.1 |
| Mayor | 5.7 | 4.1 | 2.5 | 2.5 | 2.4 | 2.4 | |
| Payroll Jobs, (Change In Millions) | Comptroller | 3.9 | 5.5 | 2.7 | 1.5 | 1.0 | 0.8 |
| Mayor | 3.9 | 5.5 | 2.0 | 1.1 | 1.0 | 0.9 | |
| Fed Funds Rate, (Percent) | Comptroller | 0.1 | 0.4 | 1.4 | 2.2 | 2.4 | 2.4 |
| Mayor | 0.1 | 0.4 | 1.2 | 1.8 | 2.1 | 2.4 | |
| 10-Year Treasury Notes, (Percent) | Comptroller | 1.4 | 2.1 | 2.7 | 3.1 | 3.5 | 3.8 |
| Mayor | 1.4 | 1.8 | 2.4 | 2.7 | 2.9 | 3.0 | |
| SELECTED NYC ECONOMIC INDICATORS (ANNUAL AVERAGES) | |||||||
| Real GCP (2012 $, % Change) | Comptroller | 5.6 | 3.2 | 3.1 | 2.9 | 2.4 | 2.0 |
| Mayor | 10.8 | 6.7 | 4.2 | 3.3 | 2.9 | 2.9 | |
| Payroll Jobs, (Change In Thousands) | Comptroller | 44 | 237 | 132 | 127 | 30 | 3 |
| Mayor | 44 | 192 | 130 | 120 | 100 | 69 | |
| Wage-Rate Growth, (Percent) | Comptroller | 5.0 | 1.0 | 1.6 | 2.1 | 2.4 | 2.9 |
| Mayor | 5.2 | 2.2 | 2.5 | 2.3 | 1.9 | 2.5 | |
III. The FY 2023 Preliminary Budget
The FY 2023 Preliminary Budget released on February 16th totals $98.54 billion, $8.0 billion less than the modified FY 2022 budget. The decline in the budget stems primarily from a drop in Federal categorical grants as Federal COVID relief begins to wane. Federal categorical grants are projected to decline by $8.63 billion, with Federal COVID relief projected to drop by $7.87 billion to $2.33 billion in FY 2023, and taper off to $7 million by FY 2026. The City-funds FY 2023 Preliminary Budget, which is funded with City-generated revenues, is projected to increase by $831 million from FY 2022, a 1.18 percent growth.
The Preliminary Budget closes a $2.88 billion budget gap projected in November, primarily on the strength of a $2.77 billion increase in prepayments of a portion of FY 2023 debt service with FY 2022 budget surplus. Revenues in the Preliminary Budget are $611 million more than projected in the November Plan. However, a substantial portion of this is offset by an increase of $496 million in expenditures, excluding reductions from prepayments.
The increase in revenues stems primarily from revisions to City-funds revenues and Federal categorical grants which were revised upwards by $483 million and $101 million, respectively. Changes to Federal categorical stems primarily from technical modifications, about $51 million of which were revisions to grants from the Homeland Security Grant Program.
The City-funds revenue increase is driven by an increase of $833 million in property tax revenues, reflecting higher than expected taxable billable assessed value in the recent tentative property tax assessment roll. Non-property tax revenues were reduced by a net $107 million. Sales tax revenue was revised downward by $196 million, prompted by the emergence of the Omicron variant which the City expects will suppress consumer spending growth in the second half of FY 2022 and slow tourism recovery. Some of the downward revision to sales tax revenue is offset by increases in other non-property tax revenues, primarily increases of $59 million in business tax revenues, $14 million in commercial rent tax revenues, and $13 million in personal income tax (PIT) revenues. The City’s tax revenue forecast also includes three tax initiatives which, if enacted, will reduce tax revenues by $300 million annually, beginning in FY 2023. The tax initiatives propose increasing the earned income tax credit at a cost of $250 million annually; a property tax abatement to property owners for retrofitting property space for childcare centers at a cost of $25 million annually; and a childcare business tax credit for businesses providing child care space at their place of business at a cost of $25 million annually.
FY 2023 non-tax City-funds revenues show a modest increase of $43 million from the November Plan mainly as a result of a $58 million increase in its estimate of overnight interest revenue in anticipation of Fed funds rate increase over the Plan period. Technical adjustments to other non-tax revenues offset some of this increase.
Table 7. Changes to FY 2023 City-Funds Estimates
from the November 2021 Plan
| ($ in millions) | |
| Gap to be Closed – November 2021 Plan | ($2,882) |
| Revenues | |
|---|---|
| Property Tax Revenues | $833 |
| Non-Property Tax Revenues | (107) |
| Tax Program | (300) |
| Non-Tax Revenues | 43 |
| Revenues From PEGs | 14 |
| Total Revenue Changes | $483 |
| Expenditures | |
| Agency Expenditures | $926 |
| Savings from PEGs | (1,112) |
| Eliminate Unspecified Labor Savings | 500 |
| General Reserve | 55 |
| Total Expenditure Changes | $369 |
| Gap To Be Closed Before Prepayments | ($2,768) |
| FY 2022 Prepayment of FY 2023 Debt Service | $2,768 |
| Gap to be Closed – February 2022 Financial Plan | $0 |
FY 2023 City-funds expenditures, before accounting for the reduction in debt service from FY 2022 prepayments, show a net increase of $369 million from the November Plan. The increase is due to the elimination of $500 million of unspecified labor savings included in prior financial plans, a $926 million increase in agency spending driven by $799 million in new needs, and a $55 million increase to the FY 2023 General Reserve. Anticipated spending reductions of $1.11 billion from Program to Eliminate the Gap (PEG) initiatives offsets all but $369 million of the spending increase.
Major new need in six agencies, the Department of Education (DOE), the Administration for Children’s Services (ACS), the Department of Social Services (DSS), the Department of Homeless Services (DHS), the Department of Youth and Community Development (DYCD), and the Department of Health and Mental Hygiene (DOHMH) account for $745 million, or 93 percent, of the FY 2023 new needs, as shown in Table 8. With the exception of the increase in charter school tuition funding and the re-estimate of shelter cost, the new needs in these agencies represent the baselining of FY 2022 spending needs to the outyears of the Plan. While the City has fully funded the charter school tuition rate increase in FY 2023, the additional outyear funding addresses only half of the needs identified in prior estimates by the City.
Table 8. Major New Needs in Six Agencies Account for $745 million of FY 2023 New Needs
| Agency | Initiatives | FY 2022 | FY 2023 | FY 2024 | FY 2025 | FY 2026 |
|---|---|---|---|---|---|---|
| DOE | Charter Schools | $0 | $282 | $216 | $313 | $313 |
| Pupil Transportation | 0 | 134 | 184 | 185 | 185 | |
| ACS | Fair Futures | 0 | 13 | 13 | 13 | 13 |
| DSS | Fair Fares | 16 | 75 | 75 | 75 | 75 |
| DHS | Shelter Cost Re-estimate | 132 | 132 | 132 | 132 | 132 |
| DYCD | Summer Jobs | 0 | 22 | 22 | 22 | 22 |
| SYEP Slot Expansion | 8 | 57 | 57 | 57 | 57 | |
| DOHMH | New Family Home Visits | 0 | 30 | 31 | 31 | 31 |
| Total | $155 | $745 | $731 | $828 | $828 |
FY 2022 Budget Stabilization Account (BSA)
Since the November Plan, the City has recognized a net $2.77 billion of additional resources in the FY 2022 budget. Because these resources are not required to balance the current fiscal year’s budget, they are used to increase the FY 2022 Budget Stabilization Account (BSA), bringing the total FY 2022 BSA to $3.73 billion. The BSA will be used to prepay $1.96 billion of Transitional Finance Authority (TFA) Future Tax Secured (FTS) debt service and $1.77 billion of General Obligation (G.O.) debt service. As shown in Chart 2, these additional resources are the result of:
- A reduction of $50 million in the FY 2022 General Reserve;
- A net savings of $400 million from adjustments to prior-year accruals;
- Program to Eliminate the Gap savings of $866 million in FY 2022;
- An increase of $1.60 billion in tax revenues;
- An increase of $31 million in non-tax revenues; less
- Additional City-funds spending of $477 million
Chart 2. The February Plan Increases the BSA by $2.77 Billion
($ in millions)

Program to Eliminate the Gap (PEG)
On January 10, the City issued a letter to City agencies calling for agencies to develop program to eliminate the gap (PEG) to reduce agency City-funds by 3 percent in each of FY 2022 and FY 2023. Excluding savings from centrally budget expenses in the miscellaneous budget and debt service, agency PEGs total $820 million in FY 2022 and $943 million in FY 2023 — 2.1 percent and 2.7 percent, respectively, of the FY 2022 and FY 2023 November Plan City-funds expenditures in these agencies.
In total, including savings from debt service, and centrally funded expenditures, the February Plan PEGs total $1.99 billion in the first two years of the Plan and $5.36 billion over the Plan period. PEG initiatives are concentrated in FY 2022 and FY 2023 with outyear budget relief provided by recurring benefits from PEGs in the first two fiscal years of the Plan. As shown in Table 9, $407 million of the $866 million FY 2022 PEGs are recurring PEGs with estimated benefits of about $500 million in each of the outyear of the Plan. In FY 2023, all but $4 million of the PEGs are recurring PEGs, with estimated outyear benefits of more than $550 million annually. Recurring benefits account for almost 90 percent of the budget relief over the Plan period.
Table 9. Recurring PEGs Account for $4.81 Billion of the $5.36 Billion Budget Relief Over the Plan Period
| ($ in millions) | FY 2022 PEGs | FY 2023 PEGs | FY 2024 PEGs | FY 2025 PEGs | FY 2026 PEGs | Total |
|---|---|---|---|---|---|---|
| Total PEGs | ||||||
| FY 2022 Benefits | $866 | $0 | $0 | $0 | $0 | $866 |
| FY 2023 Benefits | 566 | 560 | 0 | 0 | 0 | 1,126 |
| FY 2024 Benefits | 515 | 579 | 19 | 0 | 0 | 1,113 |
| FY 2025 Benefits | 518 | 589 | 19 | 0 | 0 | 1,125 |
| FY 2026 Benefits | 516 | 595 | 19 | 0 | 0 | 1,129 |
| Total | $2,981 | $2,322 | $57 | $0 | $0 | $5,360 |
| Recurring PEGs | ||||||
| FY 2022 Benefits | $407 | $0 | $0 | $0 | $0 | $407 |
| FY 2023 Benefits | 499 | 556 | 0 | 0 | 0 | 1,055 |
| FY 2024 Benefits | 504 | 579 | 19 | 0 | 0 | 1,101 |
| FY 2025 Benefits | 510 | 589 | 19 | 0 | 0 | 1,118 |
| FY 2026 Benefits | 515 | 595 | 19 | 0 | 0 | 1,128 |
| Total | $2,435 | $2,317 | $57 | $0 | $0 | $4,809 |
Almost two thirds of the PEG benefits over the Plan period are from vacancy reductions Citywide and spending reductions in the Department of Education. Vacancy reductions account for 3,080 of the PEG headcount reduction in FY 2022, and more than 3,300 of the reductions in each of the outyears of the Plan, and is expected to generate savings of $127 million in FY 2022, and an average of $291 million in each of the outyears. DOE PEGs, excluding vacancy reductions, are estimated to generate savings of $256 million in FY 2022 and more than $483 million in each of the outyears. Savings in FY 2022 include $110 million in central reduction and $55 million in State pre-K revenue offset. In the outyears, lower enrollment is projected to generate savings of about $375 million a year along with reductions of 3,227 full-time headcount in each year. Overall, PEG initiatives are expected to reduce full-time headcount by 3,205 in FY 2022, 7,026 in FY 2023, and 7,044 in each of FY 2024 through FY 2026. Other significant PEG savings include accrual savings of $113 million in the Police Department from unfilled uniform and civilian positions in the current fiscal year, and savings of $33 million in FY 2022 and $49 million in each of the outyears in DHS from the closing of hotel shelters for families with children.
Risks and Offsets
As Table 10 shows, the Comptroller’s Office’s analysis of the February Plan shows additional resources of $1.37 billion in FY 2022 and risks beginning at $119 million in FY 2023 and growing to $1.42 billion by FY 2026. The additional resources in FY 2022 are due to the Comptroller’s Office’s higher revenue forecast in excess of expense risks. In the outyears, while the Comptroller’s Office’s revenue forecast is higher than the Plan projections in each year, they are more than offset by the Comptroller’s Office’s expenditure risks. The Comptroller’s Office projects that tax revenues will be above the Plan forecast by more than $1.4 billion in FY 2022, $801 million in FY 2023, and an average of $450 million in each of the outyears of the Plan. The Comptroller’s Office also projects higher non-tax revenues from fines and interest income in each year of the Plan, ranging from $43 million to $71 million. The Comptroller’s Office’s tax revenue forecast is discussed in more detail in “Comptroller’s Office Revisions and Projections, FY 2022 – FY 2026” beginning on page 21.
The Comptroller’s Office estimates that expenditures could exceed the Plan projections in each year of the Plan, beginning at $99 million in FY 2022 and growing to $1.92 billion by FY 2026. The largest risk in FY 2022 is attributable to overtime spending, which the City estimates will remain close to the lows experienced during the pandemic. However year-to-date spending indicates otherwise, as discussed in “Overtime” beginning on page 36.
Risks to the City’s expenditures beginning in FY 2023 reflect the lack of, or insufficient funding of recurring expenditures, the so-called fiscal cliffs. These shortfalls include funding for charter school tuition, Carter cases, homeless shelters, rental assistance, prevailing wages for shelter security guards, and a number of core education initiatives supported by stimulus funds. Altogether, fiscal cliffs pose risks of $635 million in FY 2023, $875 million in FY 2024, $1.07 billion in FY 2025, and $1.75 billion in FY 2026. Fiscal cliffs account for two-thirds of the expenditure risks in FY 2023, growing to 91 percent by FY 2026.
Other expenditure risks include the City’s funding for paratransit. While the State requires the City to increase its funding of the Metropolitan Transportation Authority’s (MTA) net paratransit deficit from 33 percent to 50 percent, funding for paratransit in the Financial Plan does not reflect the increase in funding requirement. The Comptroller’s Office estimates that increasing the funding to 50 percent would increase the City’s paratransit funding by $28 million in FY 2022 and $105 million by FY 2026.
The City’s conservative estimates of interest rates on variable rate debt bonds (VRDB) provide some offset to expenditure risks. The Comptroller’s Office estimates that debt service on VRDB could be less than the Plan projections by $30 million in FY 2022 and $75 million annually in FY 2023 through FY 2026.
Looming on the horizon is the upcoming round of collective bargaining which could pose a significant risk to the budget. The City set aside resources in its labor reserve assuming zero percent increases in the first two years of the contracts and 1 percent increase in each year thereafter. Each additional percentage point in wage increases would cost $450 million per year.
It should also be noted that the risk to the economic outlook is now tilted to the downside as the Federal Reserve will lift interest rates with the intention of lowering inflation without pushing the economy into a recession, while the Ukrainian conflict could introduce further inflationary pressures and push asset prices lower.
Overall, the Comptroller’s Office’s analysis of the Plan indicates that the City could end FY 2022 with a budget surplus of $1.37 billion and a deficit of $119 million in FY 2023. The analysis also shows larger gaps of $3.25 billion in FY 2024, $2.93 billion in FY 2025, and $4.43 billion in FY 2026.
Table 10. Risks and Offsets to the February 2022 Financial Plan
($ in millions, positive numbers decrease the gap and negative numbers increase the gap)
| FY 2022 | FY 2023 | FY 2024 | FY 2025 | FY 2026 | |
| City Stated Gap | $0 | $0 | ($2,721) | ($2,234) | ($3,009) |
| Tax Revenues | |||||
| Property Tax | $15 | $317 | $696 | $957 | $1,122 |
| Personal Income Tax | 426 | (257) | (165) | 49 | 114 |
| Business Taxes | 247 | 66 | (209) | (325) | (450) |
| Sales Tax | 214 | 361 | 55 | (98) | (89) |
| Real Estate Transaction Taxes | 416 | 37 | (135) | (301) | (452) |
| All Other | 7 | 27 | (60) | (54) | (54) |
| Audit | 80 | 250 | 250 | 250 | 250 |
| Subtotal Tax Revenues | $1,405 | $801 | $432 | $478 | $441 |
| Non-Tax Revenues | |||||
| Fines | $60 | $29 | $26 | $26 | $26 |
| Interest Income | 0 | 14 | 45 | 33 | $36 |
| Subtotal Non-Tax Revenues | $60 | $43 | $71 | $59 | $62 |
| Expenditures | |||||
| Overtime | ($431) | ($348) | ($150) | ($150) | (150) |
| Charter School Tuition | 0 | 0 | (240) | (320) | (500) |
| Carter Cases | (100) | (300) | (300) | (300) | ($300) |
| 3K Expansion | 0 | 0 | 0 | 0 | (376) |
| Special Ed Pre-K Expansion | 0 | 0 | 0 | (47) | (95) |
| DOE Mental Health Services | 0 | 0 | 0 | (37) | (86) |
| Community Schools Expansion/Sustainability | 0 | 0 | 0 | (27) | (54) |
| Homeless Shelters | 0 | (117) | (117) | (117) | (117) |
| Rental Assistance | 0 | (177) | (177) | (177) | (177) |
| Paratransit Funding | (28) | (55) | (77) | (91) | (105) |
| Prevailing Wage for Shelter Security Guards | 0 | (41) | (41) | (41) | (41) |
| VRDB Interest Savings | 30 | 75 | 75 | 75 | 75 |
| eFMAP Savings | 180 | 0 | 0 | 0 | 0 |
| General Reserve | 250 | 0 | 0 | 0 | 0 |
| Subtotal | ($99) | ($963) | ($1,027) | ($1,232) | ($1,926) |
| Total (Risks)/Offsets | $1,366 | ($119) | ($524) | ($695) | ($1,423) |
| Restated (Gap)/Surplus | $1,366 | ($119) | ($3,245) | ($2,929) | ($4,432) |
Revenue Analysis
Total revenues in the February Plan are estimated to decline over the plan period from $106.5 billion in FY 2022 to $101.5 billion in FY 2026. The projected decline is largely due to decreases in federal aid related to the pandemic that boosted City revenues in FY 2022. City-funds revenues are projected to grow from $72.0 billion in FY 2022 to $77.7 billion in FY 2026. These projections reflect the City’s assumption of continued economic recovery over the Plan with City employment expected to recover to reach pre-pandemic levels in FY 2025. Tax revenue growth is expected to be driven primarily by non-property tax revenues, which are expected to increase by $4.7 billion from $34.5 billion in FY 2022 to $39.2 billion in FY 2025. Property tax revenue is projected to increase significantly in FY 2023 by 5.0 percent, but the City projects that growth thereafter will remain essentially flat[2]. Non-tax City-funds revenues is projected to remain relatively stable, growing modestly from $5.10 billion in FY2022 to $5.25 billion by FY 2026.
Tax Revenues
The City revised local tax revenues upwards in the current fiscal year by $1.6 billion compared to the November Plan. The revision is just $30 million above year-to-date collection trends through January (Table 12). The City however, did not carry forward collection trends through the remainder of the fiscal year. Tax revenues fiscal year-to-date through January grew 3.8 percent, and the City projects they will end FY 2022 2.3 percent lower than in FY 2021. The City’s increased revenue projections for FY 2023 – FY 2026 are mainly due to higher estimates for property tax revenue while overall revisions to non-property tax revenues were minor as shown in Table 11 below. The City is also proposing three new tax programs which are estimated to cost the City $300 million beginning in FY 2023.
Table 11. Revisions to the City’s Tax Revenue Assumptions
February 2022 Plan vs. November 2021 Plan
| ($ in millions) | FY 2022 | FY 2023 | FY 2024 | FY 2025 |
| November 2021 Financial Plan | $62,427 | $65,437 | $67,564 | $69,435 |
| Revisions: | ||||
| Property Tax | 124 | 848 | 678 | 445 |
| Personal Income (PIT) | 428 | 13 | 49 | 109 |
| Business | 404 | 59 | (67) | $13 |
| Sales | 265 | (196) | (165) | (75) |
| Real-Estate Transactions | 342 | 0 | 0 | 0 |
| All Other | 40 | 11 | 15 | 15 |
| Tax Audit | 0 | 0 | 0 | 0 |
| Tax Program | (300) | (300) | (300) | |
| Total | $1,603 | $435 | $210 | $207 |
| February 2022 Financial Plan – Total | $64,030 | $65,872 | $67,774 | $69,642 |
Table 12. Current Year to date Collections Trend vs. November 2021 Plan
| ($ in millions) | YTD Variance Through Jan. 22 |
|---|---|
| Property Tax | ($18) |
| Personal Income | 412 |
| Business | 261 |
| Sales | 442 |
| Real Estate Transactions | 419 |
| Other | 57 |
| Total | $1,573 |
Comptroller’s Office Revisions and Projections, FY 2022 – FY 2026
The Comptroller also revised current fiscal year projections to reflect higher than anticipated collections. Unlike the City’s, the Comptroller’s forecast assumes that some of this strength will carry forward through the remainder of the fiscal year, particularly for sales tax, income and business tax revenue. For FYs 2023 – 2026 there are major differences particularly for the forecast of property tax revenues, which the Comptroller anticipates will be considerably higher than the City’s estimates. Other differences are summarized in Tables 13 and 14 below. Higher interest rates will have a dampening effect on asset prices causing personal income tax (PIT) revenue to decline in the near term, slowing the growth of corporate profits, and causing real estate transactions to decline. These corrections are relatively moderate in comparison to the sharp downturns that the City experienced in 2002 and 2009. The risk to the forecast are tilted downward as the Fed faced a tough balancing act even before factoring in geopolitical uncertainty. At the time of this report, the forecast does not incorporate potential downside effects deriving from the Ukrainian conflict.
A more detailed discussion of the major revenue sources and differences in projections follows.
Table 13. Risks and Offsets to the City’s Tax Revenue Projections
| ($ in millions) | FY 2022 | FY 2023 | FY 2024 | FY 2025 | FY 2026 |
| Property | $15 | $317 | $696 | $957 | $1,122 |
| PIT | 426 | (257) | (165) | 49 | 114 |
| Business | 247 | 66 | (209) | (325) | (450) |
| Sales | 214 | 361 | 55 | (98) | (89) |
| Real Estate Transaction | 416 | 37 | (135) | (301) | (452) |
| Other | 7 | 27 | (60) | (54) | (54) |
| Audit | 80 | 250 | 250 | 250 | 250 |
| Total | $1,405 | $801 | $431 | $478 | $441 |
Table 14. Tax Revenue Forecast, Growth Rates
| FY 2022 | FY 2023 | FY 2024 | FY 2025 | FY 2026 | FYs 2022 – 26 Average Annual Growth |
|
|---|---|---|---|---|---|---|
| Property | ||||||
| Mayor | -6.1% | 5.0% | 0.8% | 0.6% | 0.2% | 1.6% |
| Comptroller | -6.0% | 6.0% | 2.0% | 1.4% | 0.7% | 2.5% |
| PIT | ||||||
| Mayor | -6.1% | 3.9% | 4.0% | 4.1% | 1.9% | 3.5% |
| Comptroller | -3.3% | -0.8% | 4.7% | 5.6% | 2.3% | 2.9% |
| Business | ||||||
| Mayor | -4.4% | -0.2% | 0.6% | 2.8% | 4.7% | 2.0% |
| Comptroller | -0.9% | -2.7% | -3.4% | 1.2% | 3.1% | -0.5% |
| Sales | ||||||
| Mayor | 17.7% | 5.5% | 8.4% | 6.8% | 2.9% | 5.9% |
| Comptroller | 21.0% | 7.3% | 4.4% | 5.0% | 3.0% | 4.9% |
| Real Estate Transactions | ||||||
| Mayor | 28.2% | -9.4% | 5.6% | 5.4% | 2.9% | 0.9% |
| Comptroller | 49.6% | -21.1% | -2.0% | -1.7% | -3.5% | -7.5% |
| All Other | ||||||
| Mayor | 6.6% | 5.0% | 8.1% | 5.3% | 1.8% | 5.0% |
| Comptroller | 6.9% | 5.8% | 4.6% | 5.6% | 1.8% | 4.5% |
| Audit | ||||||
| Mayor | -19.2% | -21.7% | 0.0% | 0.0% | 0.0% | -5.9% |
| Comptroller | -12.1% | -3.0% | 0.0% | 0.0% | 0.0% | -0.8% |
| Total Tax with Audit | ||||||
| Mayor | -2.3% | 2.9% | 2.9% | 2.8% | 1.6% | 2.5% |
| Comptroller | -0.2% | 1.9% | 2.3% | 2.8% | 1.5% | 2.1% |
Property Taxes
Property tax revenue accounted for the most significant revision to the FY 2023 – FY 2026 projections for both the Comptroller and the City.[3] The higher estimates reflect recently released data from the Department of Finance (DOF) FY 2023 tentative roll which indicated that market values for most property types have rebounded significantly from the declines experienced last year. The most significant increase was for Class 4 commercial properties whose value, according to DOF’s estimates, rebounded by 11.7 percent in FY 2023 after last year’s decline of 17.4 percent Market values for most property types now exceed or are near pre-pandemic levels.[4]
Based on the tentative assessment roll alone, the City’s property tax levy would increase by almost $2.4 billion. Each year, however, adjustments occur from the time the tentative values are released in January to the final roll, released in May. There are two main sources for these adjustments — 1) data on property exemptions is not fully available when the tentative roll is released and 2) property owners can contest their tentative assessments. During the past five years these reductions have averaged 1.2 percent across all Class types. In the current Financial Plan, the City is assuming an overall reduction of 3.9 percent.
Table 15 summarizes the City’s and the Comptroller’s assumptions. The Comptroller concurs with the City’s assumption that reductions to assessments for Class 4 Properties could be almost 140 basis points higher than the average reduction. The current tentative roll indicates that Class B/C office market values have rebounded to almost 93 percent of their pre-pandemic level, similar to the recovery rate of Class A buildings. Based on office market data provided by Cushman and Wakefield, however, Class B/ C office properties have been disproportionally affected by higher direct vacancy rates.
The main difference between the Comptroller’s and the City’s estimates of the tentative to final roll reductions are due to different assumptions for residential Class 1 and Class 2 properties. The City is assuming that higher than average reductions will occur for both Class 1 and Class 2 properties. These assessments however appear to be in line with market value conditions. As reported by StreetEasy, rents and vacancies as of December 2021 for rental properties, which form the basis for Class 2 assessments, are near the pre-pandemic levels and therefore are generally consistent with the levels reported in the tentative assessment roll. Class 1 properties were largely unaffected by the pandemic as DOF market values also imply.
Table 15. Tentative to Final Roll Changes in Assessed Value: Comptroller vs City
| Class Type | OMB Declines Tentative to Final, $ M | OMB Declines Tentative to Final, % | Comptroller Declines Tentative to Final, $ M | Comptroller Declines Tentative to Final, % | 5 YrAvg Chg |
|---|---|---|---|---|---|
| Class 1 | -$615 | -2.6% | -$81 | -0.3% | -0.3% |
| Class 2 | -$3,400 | -3.1% | -$1,361 | -1.3% | -1.3% |
| Class 3 | -$112 | -0.6% | $276 | 1.4% | 1.4% |
| Class 4 | -$4,200 | -3.3% | -$4,134 | -3.3% | -1.9% |
| Overall | -$8,327 | -3.0% | -$5,299 | -1.9% | -1.2% |
As a result of the different assumptions regarding residential properties, the Comptroller’s starting point for the final FY 2023 levy is $203 million higher than the City’s. While both the Comptroller and the City assume slowing growth for residential properties due to higher interest rates and a slowing economy, the City assumes growth in assessed values of 1.2 percent, while the Comptroller forecasts growth of 2.6 percent. These differences account for most of the higher levy estimate over the remainder of the Plan. For Class 4 properties, both the Comptroller and the City assume that growth will be essentially flat as office properties continue to face headwinds from high vacancies and the potential impact of shifts in demand due to increased work from home. Differences in the levy forecast for Class 1 and 3 are also minor.
In addition to these differences in the levy forecast, the Comptroller’s office assumes that offsets in property tax collections resulting from delinquencies and cancellations will be about 50 basis points lower than the City’s estimate, or about $150 million – $200 million throughout the Plan period.
Real Estate Transaction Taxes
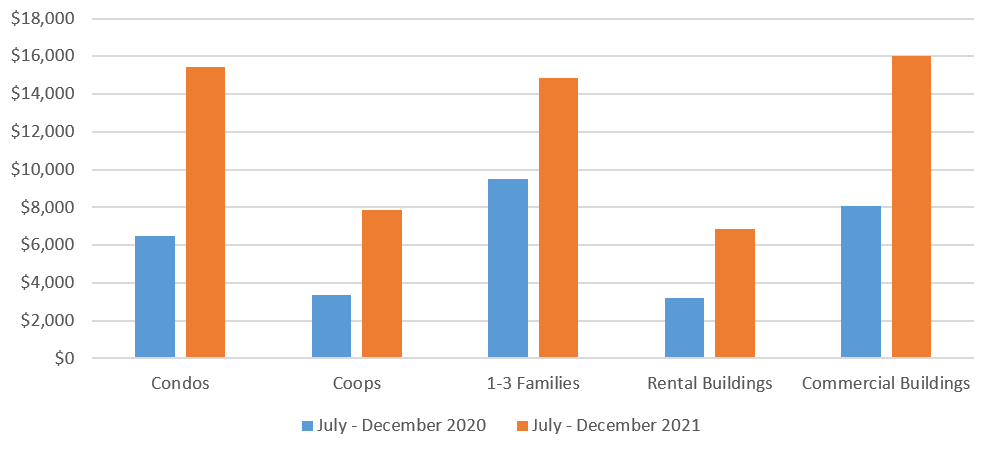
FY 2022 has been an exceptional year for real estate related taxes so far. Part of this strength is the result of the rebound from the complete halt that occurred in 2020 due to lockdowns and uncertainty that kept potential buyers on the sidelines. Once the City opened and the distribution of vaccines restored confidence, delayed purchases and new deals started to take place. All major real estate categories have witnessed significant gains in sales (Chart 3). The combined revenues from real estate-related taxes (the Real Property Transfer Tax and the Mortgage Recording Tax) in the first seven months of FY 2022 exceeded $1.84 billion — only $100 million short of the entire collections for FY 2021.
Chart 3. Real Estate Sales by Major Categories
($ in millions)
As a result of the bounce back from delayed deals and strong residential market recovery, the Comptroller’s Office projects an increase of 49.6 percent in the combined revenues from real estate-related taxes in FY 2022 to $2.9 billion (through January, the growth rate in FY 2022 is 94.6 percent). This is approximately $416 million higher than the City’s forecast. In the outyears, the combination of slowing growth in NYC employment and the drying up of refinancing activity due to increases in interest rates result in projected declines from FY 2022’s lofty levels. Differences with City’s forecast are summarized in Tables 13 and 14.
Personal Income Tax
Personal Income tax (PIT) collections continued to grow at a solid pace in FY 2022 and are 7.8 percent higher year to date through January. Much of the strength is due to withholding which was 9.8 percent higher year over year, reflective of both the continued rebound in City employment as well as strong wage growth from Wall Street bonuses. Non-withheld income is up by a more moderate 2.3 percent, due to unusual weakness in the offset component which is down by almost 38 percent.
The Comptroller’s and the City’s forecasts for withholding are very similar so the discussion of forecast differences is limited to non-withheld income.
Offsets are payments made by the State to the City to account for the fact that the exact distribution of liability between the State and the City is not known initially when filers submit estimated payments. As this distribution becomes known later, a true-up occurs which has resulted in the City receiving large payments from the State, typically in October. This year, however, the City only received $231 million compared to the $423 million it received in the prior year and the two years before then. The lower payment may be the result of the April 15 tax filing date being pushed back to May 15th last year. This provided the State with more information to pay the City upfront its share of estimated payments in May, therefore reducing October’s payment. Since the overall liability due to the City didn’t change, this simply moved the timing of receipts.
The question therefore, in addition to unusual uncertainty regarding April payments and liability, is the pattern of offsets going forward. [5] The Comptroller’s assumptions for FY 2022 and FY 2023 with regards to both April payments and offsets are significantly different compared to the City’s. The City is assuming that payments associated with non-withheld liability will drop quickly this year and then remain essentially flat in FY 2023, before slightly growing in FY 2024 (see Table 16 below). The Comptroller is assuming a lower decline to occur this year, with additional declines in FY 2023 and FY 2024 given the stock market’s recent performance. The forecast assumes a decline in the S&P500 to occur as a result of Fed tightening (8.9 percent between December 2021 and December 2022). The forecast does not incorporate potential repercussions from the Ukrainian conflict.
With regards to timing issues, the City anticipates offset payments to remain at almost half the 2021 level, attributing this lower level to a permanent change in the timing of payments.[6] The State’s recent budget however indicates that offset payments will likely be close to $1.4 billion in Fiscal Year 2023, a trend of payments that would be more consistent with past experience. The Comptroller’s Office assumes that after this year’s anomaly, offset payments will resume their normal timing pattern.
Table 16. Non-Withheld Income FY 2021-2024
| City | FY 2021 | FY 2022 | FY 2023 | FY 2024 |
| Estimated Payments + Settlements |
$3,685 | $2,699 | $2,674 | $2,764 |
| Offsets | 1,282 | 640 | 702 | 689 |
| Total | $4,967 | $3,339 | $3,376 | $3,453 |
| Comptroller | FY 2021 | FY 2022 | FY 2023 | FY 2024 |
| Estimated Payments
+ Settlements |
$3,685 | $2,950 | $2,206 | $2,238 |
| Offsets | 1,282 | 765 | 900 | 1,000 |
| Total | $4,967 | $3,715 | $3,106 | $3,238 |
In the Comptroller’s scenario, PIT resumes growth in the outyears of the Plan. The Comptroller’s outyear forecast for PIT growth in FY 2025 and FY 2026 is similar to the City’s, as shown in Table 14.
Sales Tax
The Comptroller projects sales tax revenue to grow by 21.0 percent in FY 2023. This increase is driven by a rebound in sales tax revenue related to the tourism sectors (accommodations, restaurants and bars and transit). Sales tax revenue from the tourism sector had collapsed at the height of pandemic due to travel restrictions and business closures. Restrictions imposed on foreign travelers, which were lifted only recently had a disproportionate impact on New York City. With the removal of most travel restrictions, City sales tax related to the tourism sectors rebounded to almost 80 percent of pre-pandemic levels as of December 2021. Despite concerns that the recent spread of the Omicron variant would once again sharply curtail travel and spending, the threat to tourism appears to be waning.
FY 2023 revenues are also boosted by the expiration of the distressed hospital sales interceptor which subtracted $250 million and $150 million from revenues in FY 2021 and 2022, respectively.[7] The rate of growth decelerates as tourism approaches pre-pandemic levels by the end of FY 2025 and year-over-year growth comparisons become less favorable. By the end of the Plan, sales tax growth slows to about 3 percent reflecting growth in employment and wages.
The differences with the City’s forecast are shown in Tables 13 and 14. As previously noted, the City did not carry forward the momentum from actual collections in the current or the next fiscal year (in fact, the City increases sales tax by slightly less than collections as of December 2021). As a result, the Comptroller’s estimates for sales tax revenues are considerably higher in the near term while outyear differences are more muted.
Business Income Taxes
Revenue from Business Taxes (GCT and UBT) combined grew strongly during the pandemic and year-to-date collections exceeded the November forecast by $261 million as of January. The current strength in local business tax revenue is due to both the surge in Wall Street profits to a near record $58 billion in the most recent year and favorable fiscal policy which provided direct assistance to corporations (through the Paycheck Protection Program) and boosted consumer income through expanded unemployment benefits and stimulus checks.
These tailwinds are not expected to continue in the remainder of the Plan. The Comptroller’s office projects a decline in Wall Street profits throughout the Plan period. As a result, the Comptroller estimates Business Tax revenue is projected to decline by almost 2.5 percent on average in FY 2022 through FY 2024 before stabilizing over the remainder of the Plan. The City is projecting even greater declines in the near term but a quicker recovery in the out years as shown in Tables 13 and 14.
Audit Revenues
The City’s forecast assumes that audit collections, which have averaged nearly $1 billion annually over the last decade will decline from an estimated $921 million in FY 2022 to $721 in the out years. While recognizing that audit revenues could be volatile, the Comptroller assumes that revenue from audits will hover more closely to the long-term average. The resulting differences between the City and the Comptroller’s forecast for audit revenue are shown in Table 13 and 14.
City Tax Programs
The City is proposing three tax programs to assist low-income households and households with children. The Mayor is asking the State to enact legislation that would boost the EITC the City provides to low income households from the current five percent match of Federal EITC. The cost to the City would be roughly $250 million. In addition, to help childcare needs the Mayor is proposing property tax credits for the retrofitting of childcare centers and business tax credits for the provision of onsite childcare. Together, the two programs are estimated to cost $50 million per year.
Miscellaneous Revenues
Miscellaneous revenues in the FY 2023 Preliminary Budget remain essentially unchanged from the November Plan with a net increase of $48 million to $5.13 billion. The revision reflects mainly increases of $65 million in projected revenues from interest income and $13 million in water and sewer revenues. These increases are partially offset by small declines in projected revenues from fines and forfeitures, charges for services and other miscellaneous revenues.[8]
The revised FY 2022 forecast also increased slightly from the November Plan projection by a net $41 million, including $10.5 million in PEGs. Projections for fines and forfeitures, licenses, franchises and permits, water and sewer and other miscellaneous revenues inched up by a combined $65 million while projections for rental income and charges for services declined by $2 million and $22 million respectively. Table 17 shows the changes in the FY 2022 miscellaneous revenue projections since the November Plan.
Table 17. Changes in FY 2022 Estimates
January 2022 Plan vs. November 2021 Plan
| ($ in millions) | November | January | Change |
| Licenses, Permits & Franchises | $657 | $672 | $15 |
| Interest Income | 9 | 9 | 0 |
| Charges for Services | 1,024 | 1,002 | ($22) |
| Water and Sewer Charges | 1,668 | 1,682 | 14 |
| Rental Income | 248 | 246 | ($2) |
| Fines and Forfeitures | 1,065 | 1093 | 28 |
| Other Miscellaneous | 385 | 393 | $8 |
| Total | $5,056 | $5,097 | $41 |
Revenue projections for licenses, permits and franchises increased by a net $15 million. This revision is mostly due to an increase of $27.9 million in mobile telecom franchises and a $5.7 million increase in payments from the LinkNYC program. Revenue projection from cable television franchise declined by $17 million, and ferry concessions and building permits declined by $2 million and $2.5 million respectively.
Charges for services declined by a net $22 million. This was primarily due to a projected $17 million decline in revenues from fire inspection fees and a decline in projected revenues from NYPD towing operations of $9 million due to the closing of the Manhattan Tow Pound in Pier 76. Projected revenues from fees associated with the 421-A Housing Program increased by $12 million.
Estimated revenues from fines and forfeitures increased by a net $28 million. This includes increases of $15 million in projected revenues from penalties related to late filling of Property Income and Expense (“RPIE”) statement, $15 million in bus lane camera fines and $4.5 million is speed camera fines. Projected court fines, Taxi and Limousine stipulation/settlement fines and health tribunal fines decreased by a combined $7.2 million. Estimated revenues for the category “other miscellaneous”, which comprises mostly non-recurring revenues increased by a net $8 million.
Revisions to the outyear miscellaneous revenue forecasts reflect primarily upward revisions to projected interest income to account for expected rises in short-term interest rates. Total miscellaneous revenue is projected to remain stable, averaging $5.2 billion annually in FYs 2023-2026.
Based on collection trends and changes in local laws, the Comptroller’s Office expects revenues from fines to be above the City’s forecast by $60 million in FY 2022, $29 million in FY 2023 and $26 million in each of FYs 2024-2026. These additional revenues result from the Comptroller’s Office projections for Environmental Control Board (ECB) fines (from the DOF collection unit), RPIE late penalties, as well as parking violation and camera fines. In addition, based on current interest rate forecasts, the Comptroller’s Office projects interest income will be above the City’s projection by $14 million in FY 2023, $45 million in FY 2024, $33 million in FY 2025 and $36 million in FY 2026. The Comptroller’s Office is also monitoring revenues from the contract with JC Decaux for the operation of the City’s bus stop shelters. The company has already missed two quarterly payments this fiscal year for a total of $30 million.
Federal and State Aid
The February Financial Plan projects total Federal and State aid of $35.55 billion (including unrestricted aid) in FY 2022, supporting over 33 percent of the City’s expenditure budget. Compared with the November Plan, the City has reflected an increase of $2.02 billion in the current year comprising of $1.79 billion in Federal aid and $224 million in State grants.
The increased Federal funding predominantly stems from continued recognition of COVID-related grants totaling about $1.66 billion. This includes $1.04 billion in Federal Emergency Management Agency (FEMA) reimbursement mainly for costs associated with test kits, vaccinations and testing and tracing activities. The City also recognizes $319 million in other stimulus funding that includes $152 million in Emergency Solutions Grant under the Coronavirus Aid, Relief, and Economic Security Act (CARES) for homeless assistance and prevention, $94 million in American Rescue Plan Act-State and Local Fiscal Recovery Funds (ARPA-SLFRF) for a variety of programs (more than half of which are for vaccine booster incentives and 311 personnel) and $51 million in ARPA transit funding mainly in support of Staten Island Ferry operations. In addition, the City has reflected $294 million in unrestricted aid funded with ARPA grants. According to the City, the $294 million stems from ARPA SLFRF-eligible spending that occurred in FY 2021 but were covered by other funding sources, hence making these receipts available as unrestricted aid in the current year.
The February Plan increases bring the total Federal stimulus funding anticipated by the City to $16.29 billion in FY 2022-FY 2026, as shown in Table 18. The largest component is the $6.70 billion in combined ARPA and Coronavirus Response and Relief Supplemental Appropriations Act (CRRSAA) education funding incorporated into the DOE budget, followed by $4.60 billion in ARPA-SLFRF and $3.29 billion in FEMA grants (including unrestricted aid) currently reflected in the February Plan. Together, these three major funding sources constitute nearly 90 percent of the Federal COVID stimulus funding assumed in the Plan.
Table 18. Projected Federal COVID Stimulus Funding
February 2022 Plan
| ($ in millions) | FY 2022 | FY 2023 | FY 2024 | FY 2025 | FY 2026 | Total |
| ARPA-SLFRF | $3,335.9 | $287.9 | $225.9 | $451.9 | $0.0 | $4,301.6 |
| ARPA-CRRSAA Education | 3,018.2 | 1,771.3 | 1,383.9 | 529.8 | 0.0 | 6,703.2 |
| FEMA | 2,536.0 | 4.0 | 1.0 | 0.0 | 0.0 | 2,541.0 |
| Coronavirus Relief Fund | 194.4 | 0.0 | 0.0 | 0.0 | 0.0 | 194.4 |
| Epidemiology and Laboratory Capacity Grants | 461.9 | 101.3 | 6.0 | 0.0 | 0.0 | 569.2 |
| All Other | 657.1 | 168.9 | 56.9 | 41.8 | 7.1 | 931.8 |
| Subtotal | $10,203.5 | $2,333.4 | $1,673.7 | $1,023.5 | $7.1 | $15,241.2 |
| Unrestricted Aid-FEMA | $750.0 | $0.0 | $0.0 | $0.0 | $0.0 | $750.0 |
| Unrestricted Aid-ARPA SLFRF | 294.0 | 0.0 | 0.0 | 0.0 | 0.0 | 294.0 |
| Subtotal | $1,044.0 | $0.0 | $0.0 | $0.0 | $0.0 | $1,044.0 |
| Grand Total | $11,247.5 | $2,333.4 | $1,673.7 | $1,023.5 | $7.1 | $16,285.2 |
Source: NYC Office of Management and Budget.
Under State grants, the majority of the February Modification increase is in education, comprising of charter supplemental tuition aid ($80 million), charter lease aid ($55 million) and pre-k administration grant ($55 million). An additional $35 million has been reflected in other areas mainly for social services, criminal justice and Board of Election programs.
In the FY 2023 Preliminary Budget, the City assumes $25.8 billion in Federal and State assistance, reflecting a modest increase of $106 million since the November Plan. The increase includes $46 million for the second installment of stimulus transit funding mainly for the Staten Island Ferry and $51 million in Homeland Security grants. Compared to the current fiscal year, Federal and State support of the expense budget would fall to 26 percent in FY 2023 as stimulus funding declines by nearly $9 billion year-over-year. Moreover, following the strong growth in State education aid in FY 2022, the City anticipates more modest growth over the Financial Plan. State aid is expected to grow at an annual rate of 0.7 percent, increasing from $16.5 billion in FY 2022 to $16.9 billion in FY 2026. Over the remainder of the Plan, Federal and State grants are projected to fall sequentially to $25.3 billion in FY 2024 and $24.8 billion in FY 2025 before reaching $23.8 billion in FY 2026, essentially mirroring the trend in stimulus funding in the latter years of the Plan.
State Executive Budget
On January 18th, Governor Hochul proposed a budget for the state fiscal year that begins on April 1st. As proposed, the state fiscal year (SFY) 2023 budget would have a negative net impact on the City’s Financial Plan of $114 million over the remainder of the current year, including $50 million in lost City sales tax revenue due to the extension of a temporary intercept, and a modest positive net impact in FY 2023 (Table 19).
For the first time in modern history, New York State forecasts baseline surpluses in every year of its financial plan, including a $5 billion surplus in the current year. Federal stimulus funds combined with higher-than-expected tax revenue, boosted by tax rate increases last year, have allowed the Governor to propose new spending programs while also committing to higher state reserve levels.
Under the Governor’s Executive Budget, the State would provide $2.2 billion in property tax relief for homeowners, $1 billion for healthcare worker bonuses, and an additional $350 million for tax relief to small businesses and an additional $100 million for New York City theaters and music venues. The Governor also set aside $2 billion in pandemic recovery funding for the Legislature to allocate.
However, the proposed State budget would also permanently extend the Distressed Provider Relief Fund, which intercepts $200 million in annual sales tax revenue from New York City and $50 million from other counties to support financially distressed healthcare facilities throughout the State. The original intercept was adopted in 2020 and was scheduled to expire this fiscal year. Similarly, the State Executive Budget proposes to permanently require the Office of the Manhattan District Attorney to annually transfer $40 million of revenue from deferred prosecution agreements to the Criminal Justice Discovery Compensation Fund to help fund statewide compliance with discovery laws.
Table 19. Potential Impact of Proposed FY 2023 State Budget
| ($ in millions) | FY 2022 | FY 2023 | Total Two-Year Impact |
| Formula-based School Aid | ($68) | $60 | ($8) |
| Other Positive Spending Impacts | $29 | $194 | $224 |
| Maintain child care market rate | $0 | $48 | $48 |
| Increase adoption support | $0 | $26 | $26 |
| Increase General Public Health Works | $3 | $14 | $16 |
| Increase transit operating aid | $11 | $45 | $57 |
| Increase other transportation aid | $15 | $62 | $77 |
| Other Negative Spending Impacts | ($15) | ($59) | ($73) |
| Changes to Public Assistance benefits | ($8) | ($32) | ($39) |
| Special education schools COLA | ($7) | ($27) | ($34) |
| Revenue Impacts | ($60) | ($192) | ($252) |
| Sales tax intercept | ($50) | ($200) | ($250) |
| Modernize tax law for vacation rentals | $0 | $28 | $28 |
| Small business tax relief | ($10) | ($20) | ($30) |
| Total Net Impact | ($114) | $3 | ($109) |
Source: NYS Division of Budget and NYC Office of Management and Budget
School Aid
The Governor’s proposed budget maintains the State’s commitment to fully fund Foundation Aid in FY 2024. Formula-based aid to the City would increase 4.5 percent from $11.8 billion to $12.3 billion, including a $345.9 million increase in Foundation Aid. Expense-based aids, including transportation aid and building aid, would be fully funded and increase by $185 million.
Outside of the budget, the State authorized an 11 percent cost-of-living adjustment (COLA) for special education provider rates. The City is responsible for 40 percent of the increase, at an estimated cost of $27 million in FY 2023. The Executive Budget also includes $100 million to address student learning loss and mental health to be provided over two years through the Recover from COVID School Program. Districts would be required to match State grants with their Federal pandemic relief funds.
The Executive Budget would also require all new school bus purchases or leases to be zero-emissions by July 1, 2027. The mandate would expand to all school busses on the road by July 1, 2035, closely mirroring New York City legislation that requires all school buses in use to be electric zero-emission by September 1, 2035.[9] The City would be able to claim transportation aid for zero-emission bus charging or hydrogen fueling stations, and school districts would be allowed to lease or finance zero-emission buses over a period of 10 years, rather than the current five years for diesel buses.
Other Executive Budget Proposals
The Governor’s budget would also replace existing 421a (“Affordable New York”) tax credits with a new incentive program. The proposed “Affordable Neighborhoods for New Yorkers” program would maintain the general structure of the old program but expand requirements for affordable housing. Other housing proposals in the State budget include allowing New York City to legalize existing accessory dwelling units (ADUs) on owner-occupied residential lots, repealing the maximum density of residential floor area ratio (FAR) in the City, and implementing new programs to encourage hotel and office space conversions in the City.
The Executive Budget would also increase State aid for public health and transportation, while enhancing and accelerating the provision of public assistance benefits at an estimated cost to New York City of $31.6 million in FY 2023. New costs would be offset by an estimated $28 million in FY 2023 by subjecting vacation rentals to the City’s hotel fee revenue and requiring vacation rental marketplace providers, such as AirBnB, to collect and remit sales taxes.
The Governor’s budget also includes proposals to extend design-build authority for certain New York City agencies for five years through December 31, 2027 and extend mayoral control of city schools for four years.
Expenditures Analysis
Total-funds FY 2023 expenditures in the February Financial Plan are projected to drop by $8.0 billion from FY 2022. Both FY 2022 and FY 2023 expenditures include prepayments which lower debt service expenditures in these fiscal years. In addition, FY 2022 expenditures are reduced by the use of FY 2021 resources to prepay part of retiree health insurance costs. FY 2022 expenditures are also further reduced by the take-down of the general reserve and the re-estimates of prior-year accruals. After adjusting for prepayments, and excluding re-estimates of prior-year accruals and reserves, expenditures are projected to drop by a smaller $7.60 billion to $100.96 billion, as shown in Table 20. However, the FY 2022 budget includes $8.55 billion of COVID-19 related expenditures which are expected to drop to $1.02 billion in FY 2023. Netting out COVID-19 related spending, expenditures are projected to grow by $880 million in FY 2023.
Table 20. FY 2022 – FY 2026 Expenditure Growth
Adjusted for Prepayments
| ($ in millions) | FY 2022 | FY 2023 | FY 2024 | FY 2025 | FY 2026 | Growth FYs 22-26 |
Annual Growth |
|---|---|---|---|---|---|---|---|
| Debt Service | $6,764 | $7,942 | $8,265 | $8,803 | $9,597 | 41.9% | 9.1% |
| Health Insurance | 7,568 | 8,042 | 9,007 | 9,838 | 10,429 | 37.8% | 8.3% |
| Other Fringe Benefits | 4,618 | 4,500 | 4,621 | 4,744 | 4,869 | 5.4% | 1.3% |
| Subtotal | $18,950 | $20,484 | $21,894 | $23,385 | $24,895 | 31.4% | 7.1% |
| Salaries and Wages | $30,853 | $30,197 | $30,275 | $30,484 | $30,801 | (0.2%) | (0.0%) |
| Pensions | 9,820 | 9,553 | 8,936 | 8,064 | 7,449 | (24.1%) | (6.7%) |
| Medicaid | 6,546 | 6,494 | 6,494 | 6,494 | $6,494 | (0.8%) | (0.2%) |
| Public Assistance | 1,651 | 1,650 | 1,650 | 1,650 | $1,650 | (0.0%) | (0.0%) |
| J & C | 1,337 | 908 | 925 | 941 | $958 | (28.3%) | (8.0%) |
| Contractual Services | 23,406 | 19,044 | 18,779 | 18,753 | 18,332 | (21.7%) | (5.9%) |
| Other OTPS | 16,002 | 12,633 | 12,490 | 12,618 | 12,731 | (20.4%) | (5.6%) |
| Subtotal | $89,615 | $80,479 | $79,549 | $79,005 | $78,415 | (12.5%) | (3.3%) |
| Expenditures Before Reserves and Prior-Year Re-estimates | $108,564 | $100,963 | $101,443 | $102,390 | $103,310 | (4.8%) | (1.2%) |
| Prior-Year Accruals Re-estimate | ($400) | $0 | $0 | $0 | $0 | ||
| Rainy Day Fund Deposit | $500 | $0 | $0 | $0 | $0 | ||
| General Reserve | $250 | $1,055 | $1,000 | $1,000 | $1,000 | ||
| Capital Stabilization Reserve | $0 | $250 | $250 | $250 | $250 | ||
| Total | $108,914 | $102,268 | $102,693 | $103,640 | $104,560 | (4.0%) | (1.0%) |
Note: Numbers may not add to totals due to rounding.
Over the Plan period, adjusted expenditures before reserves are projected to grow by 4.8 percent, as shown in Table 20. However, as discussed above, FY 2022 expenditure includes $8.55 billion of COVID-19 related spending which is projected to drop to $12 million by FY 2026. Net of COVID-19 spending, expenditures before reserve is projected to grow by 4.2 percent over the Plan period.
Headcount
Compared to the November 2021 Plan, the February 2022 Headcount Plan shows net decreases in year-end full-time headcount of 3,568 in FY 2022, 4,746 in FY 2023, 5,659 in FY 2024, and 6,544 in FY 2023 and FY 2025, as shown in Table 21. Driving the headcount reduction is the City’s PEG initiatives which is expected to reduce full-time headcount by 3,871 in FY 2022, 7,692 in FY 2023, and 7,710 in each of FY 2024 – FY 2026. Most of the PEG reductions is from vacancy reduction which is projected to be 3,746 in FY 2022, 4,035 in FY 2023, and 3,993 in each of FY 2024 – FY 2026. In the outyears, enrollment reduction is expected to reduce headcount by another 3,227 positions each year in the DOE. Headcount increases from the partial restoration of hiring and attrition management and other headcount adjustments offset some the PEG headcount reduction. The partial restoration of hiring and attrition management is estimated to increase full-time headcount by 1,005 a year beginning in FY 2023, while the DOE has reassigned the use of Federal stimulus funds in support of an increase of 1,778 positions in FY 2023 and 889 to partly offset the decrease in headcount from enrollment reductions.
Table 21. Full-time Headcount Changes
February 2022 Financial Plan vs. November 2021 Financial Plan
| FY 2022 | FY 2023 | FY 2024 | FY 2025 | |
| Pedagogical | ||||
| Dept. of Education | (126) | (1,678) | (2,567) | (3,456) |
| City University | (128) | (128) | (128) | (128) |
| Subtotal | (254) | (1,806) | (2,695) | (3,584) |
| Uniformed | ||||
| Police | 0 | 0 | 0 | 0 |
| Fire | 0 | 0 | 0 | 0 |
| Correction | 0 | 0 | 0 | 0 |
| Sanitation | 0 | (305) | (308) | (308) |
| Subtotal | 0 | (305) | (308) | (308) |
| Civilian | ||||
| Dept. of Education | 0 | (5,476) | (5,476) | (5,476) |
| City University | 0 | 0 | 0 | 0 |
| Police | (758) | 4,520 | 4,520 | 4,520 |
| Fire | (155) | (155) | (155) | (155) |
| Correction | 0 | 0 | 0 | 0 |
| Sanitation | (188) | (188) | (188) | (188) |
| Admin. for Children’s Services | (227) | (227) | (227) | (227) |
| Social Services | (663) | (695) | (695) | (695) |
| Homeless Services | (94) | (131) | (131) | (131) |
| Health and Mental Hygiene | 12 | 3 | 3 | 3 |
| Finance | (167) | (167) | (167) | (167) |
| Transportation | (108) | (131) | (126) | (122) |
| Parks and Recreation | (247) | (247) | (247) | (247) |
| All Other Civilians | (719) | 259 | 233 | 233 |
| Subtotal | (3,314) | (2,635) | (2,656) | (2,652) |
| Total | (3,568) | (4,746) | (5,659) | (6,544) |
Note: The November 2021 Plan did not include a Plan for FY 2026.
Despite the headcount reduction in the current Plan, year-end full-time headcount is projected to be above the FY 2021 year-end headcount through the Plan period. Headcount is projected to decrease from 306,291 in FY 2023 to 297,845 in FY 2026, compared to year-end full-time headcount of 291,101 on June 30, 2021.
Table 22. Total Funded Full-Time Year-End Headcount
February 2022 Financial Plan
| FY 2022 | FY 2023 | FY 2024 | FY 2025 | FY 2026 | |
| Pedagogical | |||||
| Dept. of Education | 127,815 | 126,892 | 127,022 | 126,151 | 123,367 |
| City University | 4,313 | 4,313 | 4,313 | 4,313 | 4313 |
| Subtotal | 132,128 | 131,205 | 131,335 | 130,464 | 127,680 |
| Uniformed | |||||
| Police | 35,030 | 35,030 | 35,030 | 35,030 | 35,030 |
| Fire | 10,945 | 10,952 | 10,952 | 10,952 | 10,952 |
| Correction | 7,460 | 7,060 | 7,060 | 7,060 | 7,060 |
| Sanitation | 7,482 | 7,391 | 7,388 | 7,388 | 7,388 |
| Subtotal | 60,917 | 60,433 | 60,430 | 60,430 | 60,430 |
| Civilian | |||||
| Dept. of Education | 13,403 | 13,465 | 13,945 | 13,955 | 12,918 |
| City University | 1,771 | 1,946 | 1,946 | 1,946 | 1,946 |
| Police | 15,063 | 15,021 | 15,021 | 15,021 | 15,021 |
| Fire | 6,320 | 6,349 | 6,349 | 6,340 | 6,340 |
| Correction | 1,962 | 1,958 | 1,958 | 1,958 | 1958 |
| Sanitation | 1,992 | 1,968 | 1,968 | 1,968 | 1968 |
| Admin. for Children’s Services | 7,073 | 7,073 | 7,073 | 7,073 | 7073 |
| Social Services | 13,043 | 12,931 | 12,931 | 12,931 | 12,918 |
| Homeless Services | 2,064 | 1,992 | 1,992 | 1,992 | 1,974 |
| Health and Mental Hygiene | 6,188 | 5,919 | 5,914 | 5,856 | 5,856 |
| Finance | 1,992 | 1,992 | 1,992 | 1,992 | 1992 |
| Transportation | 5,506 | 5,546 | 5,566 | 5,572 | 5,572 |
| Parks and Recreation | 4,227 | 4,094 | 4,094 | 4,094 | 4,094 |
| All Other Civilians | 32,642 | 30,708 | 30,654 | 30,641 | 30,105 |
| Subtotal | 113,246 | 110,962 | 111,403 | 111,339 | 109,735 |
| Total | 306,291 | 302,600 | 303,168 | 302,233 | 297,845 |
Overtime
The City’s overtime expenditures averaged 6.6 percent as a share of wages and salaries between FY 2015 and FY 2020 and increased from $1.63 billion to a high of $1.84 billion. Due to the pandemic, overtime costs declined to $1.61 billion or 5.5 percent as a share of wages and salaries in FY 2021 as the City experienced the scale-back on everyday operations and non-essential City employees worked largely from home. The City is optimistic that this trend will continue and projects overtime costs of $1.49 billion for FY 2022 and $1.17 billion for FY 2023. The Comptroller’s Office, on the other hand, expects overtime costs to return to the pre-pandemic level with the returning of non-essential City workers at offices and the reinstatement of everyday operations. Additionally, year-to-date FY 2022 overtime cost is higher than usual due to the recent spike of COVID cases, which affected many City employees and exerted upward pressure on overtime usage. (See Table 23 below). The Comptroller’s Office projects spending of $1.92 billion for FY 2022 and $1.52 billion for FY 2023, exceeding the Plan projections by $431 million and $348 million, respectively.
Table 23. July – January Overtime Spending
Fiscal Year 2020 – Fiscal Year 2022
| ($ in millions) | FY 2020 | FY 2021 | FY 2022 |
| Uniformed | |||
| Police | $353 | $212 | $397 |
| Fire | 137 | 150 | 214 |
| Corrections | 77 | 54 | 132 |
| Sanitation | 70 | 124 | 176 |
| Total Uniformed | 637 | 540 | 919 |
| Civilian | 336 | 259 | 353 |
| Total City | $973 | $799 | $1,272 |
Pre-pandemic, civilian overtime costs increased annually, averaging $566 million per year between FY 2015 and FY 2020, and grew at an annual average rate of 5 percent over that period. After declining in FY 2021 to $510 million, the Comptroller’s Office is projecting civilian overtime spending of $546 million for FY 2022, $59 million higher than projected in the February Plan. For FY 2023, the Comptroller’s Office estimates that civilian overtime spending will be lower at $466 million, but still exceeding the City’s budget projection by $103 million.
The risks to the overtime budget in FYs 2022 and FY 2023 stem mainly from projected spending for uniformed overtime at the Police department (NYPD) and the Department of Corrections (DOC) as shown in Table 24. The Comptroller’s Office projects police uniformed overtime costs of $600 million for FY 2022, $168 million higher than projected in the February Plan. The increase in crime throughout the City and the recent Omicron surge have exerted upward pressure on overtime usage at the NYPD. The City’s plan to increase enforcement efforts and to have more officers on patrol will continue to result in higher overtime usage. As a result, the Comptroller’s Office expects FY 2023 uniformed police overtime cost to remain at a broadly similar level of $550 million, posing a risk to the budget of $196 million.
For several fiscal years DOC was able to implement initiatives that resulted in lower overtime costs from a high of $254 million in FY 2016 to $155 million in FY 2019. These initiatives together with lower population counts at the DOC centers and increased uniformed headcount levels resulted in even lower overtime cost of $129 million in FY 2020, before increasing slightly to $134 million in FY 2021. However, the department is now experiencing several challenges – (1) the uniformed headcount level declined to 7,501 officers as of December 31, 2021, from 8,388 officers as of June 30, 2021, (2) the department has been plagued with excessive absenteeism among uniformed officers in recent months, and (3) there has been an increase in unrest and disorder at the centers. Overtime expenses were $132 million through January FY 2022, and they are on track to reach about $200 million by the end of the fiscal year. The City is currently taking actions to address uniformed officers’ absenteeism, increase uniformed officers, and curb unrest at the centers. If actions implemented are successful, DOC overtime cost will decline to about $175 million in FY 2023, posing a risk to the budget of $49 million for that year.
Table 24. Projected Overtime Spending, FY 2022 and FY 2023
| ($ in millions) | Plan Overtime | FY 2022 Comptroller’s Projection | Risk | Plan Overtime | FY 2023 Comptroller’s Projection | Risk |
| Uniformed | ||||||
| Police | $432 | $600 | ($168) | $354 | $550 | ($196) |
| Fire | 268 | 300 | (32) | 221 | 221 | 0 |
| Correction | 133 | 200 | (67) | 126 | 175 | (49) |
| Sanitation | 170 | 275 | (105) | 103 | 103 | 0 |
| Total Uniformed | $1,003 | $1,375 | ($372) | $804 | $1,049 | ($245) |
| Civilian | ||||||
| Police-Civilian | $81 | $100 | $(19) | $80 | $80 | $0 |
| Admin for Child Svcs | 39 | 39 | 0 | 39 | 39 | 0 |
| Transportation | 60 | 60 | 0 | 52 | 52 | 0 |
| All Other Agencies | 307 | 347 | (40) | 192 | 295 | (103) |
| Total Civilians | $487 | $546 | ($59) | $363 | $466 | ($103) |
| Total City | $1,490 | $1,921 | ($431) | $1,167 | $1,515 | ($348) |
The New York City Fire Department (FDNY) and Department of Sanitation (DOS) have also experienced higher overtime usage in recent months. Both departments have experienced higher sick-leave usage in recent months due to the Omicron spike. Additionally, protests against the NYC vaccine mandate resulted in higher year-to-date overtime costs for DOS. Projected overtime costs for both departments pose a risk to the FY 2022 budget of $137 million.
Health Insurance
The FY 2023 Preliminary Budget includes $8.042 billion for employees’ and retirees’ pay-as-you-go health insurance, $475 million or 6.3 percent higher than the adjusted health insurance cost for FY 2022. In FY 2021, the City prepaid $425 million of retiree health insurance cost for FY 2022. After adjusting for this action, the FY 2022 health insurance cost is expected to be $7.568 billion. Health insurance expenditures have increased at an annual average rate of 5.08 percent between FY 2011 and FY 2021 from $4.277 billion to $7.021 billion. The annual increase of health insurance rates and increase headcount levels account for the continued increase in costs. The increase for active employees health insurance rates averaged above 9 percent annually between FYs 2011 and 2013 before declining to average rate increases of 4.4 percent annually between FYs 2013 and 2021. Senior care rates, on the other hand, experienced a decline in annual rates between FYs 2011 and 2013 before experiencing average rate increases of 2.5 percent annually between FY 2013 and FY 2021.[10]
The increase in health insurance costs from FY 2022 reflects projected premium rate increases of 6.25 percent for active employees and pre-Medicare retirees and 4.8 percent for the senior care rate. As shown in Table 25, health insurance costs are then projected to increase to $9.01 billion in FY 2024, to $9.84 billion in FY 2025 and to $10.43 billion by FY 2026.[11] The out-year projections assume annual increases in health insurance premium rates of 6 percent in FY 2024, 5.75 percent in FY 2025 and 5.5 percent in FY 2026. Premium rate increase for retiree health insurance is projected to be 4.8 percent for FY 2024 and 4.7 percent in FY 2025 and in FY 2026.
Table 25. Pay-As-You-Go Health Expenditures
| ($ in millions) | FY 2022 | FY 2023 | FY 2024 | FY 2025 | FY 2026 |
| Department of Education | $2,658 | $2,794 | $3,376 | $3,893 | $4,181 |
| CUNY | 132 | 140 | 144 | 156 | 156 |
| All Other | 4,352 | 5,108 | 5,487 | 5,788 | 6,092 |
| Sub-total | 7,143 | 8,042 | 9,007 | 9,838 | 10,429 |
| Retiree Health Prepayment | 425 | ||||
| PAYGO Health Insurance Cost | $7,568 | $8,042 | $9,007 | $9,838 | $10,429 |
At the FY 2021 budget adoption, the City included potential savings of $1 billion annually to address the fiscal challenges that resulted from the pandemic. At that time, the annual projections for health insurance cost were lowered by $1 billion annually as a place-holder for the projected savings which were to be negotiated with the Municipal Labor Committee (MLC). Subsequently, the City rescinded the projected savings of $1 billion in FY 2022 and $500 million annually thereafter. The remaining $500 million of projected savings in each of FYs 2023 to 2026 were rescinded in the February Plan. Offsetting these funds were savings of $38 million in FY 2022, $218 million in FY 2023, $221 million in FY 2024, $225 million in FY 2025, and $228 million in FY 2026, mainly attributable to projected headcount reductions. When compared to the November Plan, health insurance projections decreased by $38 million in FY 2022 and increased by an average of $278 million annually in each of FY 2023 to FY 2026.
In July 2021, the City and the Municipal Labor Committee reached an agreement to implement the NYC Medicare Advantage Plus Program, replacing the current Senior Care program. This action is estimated to produce about $600 million of health care cost savings annually, earmarked for contribution to the Health Insurance Stabilization Fund. The Medicare Advantage Plus Program was scheduled to be implemented on January 1st, 2022. However, in response to a lawsuit filed by a group of City retirees, a State Supreme Court has ordered an extension of the initial opt-out date of October 31, 2021 and has extended the implementation plan date to April 1, 2022. It is now uncertain whether there may be a further delay. At a February 7th hearing, the judge kept the temporary restraining order on plan implementation in place and set February 28th as the date for the City and the retirees to present further legal arguments.
Pensions
The February Financial Plan projects pension expenditures of $9.553 billion in FY 2023, a net decline of $267 million from the FY 2022 estimate of $9.820 billion. Pension contributions are then projected to decline further to $8.936 billion in FY 2024, to $8.064 billion in FY 2025 and to $7.449 billion in FY 2026. The decline in projections mainly reflect the impact of FY 2021 pension investment earnings in excess of the Actuarial Interest Rate Assumption of 7 percent. Pension investments earned a combined return of 25.8 percent on market value for FY 2021 resulting in reductions in pension contributions of approximately $805 million in FY 2023, $1.6 billion in FY 2024, $2.4 billion in FY 2025, and $3.2 billion in FY 2026 from the phase-in of the excess returns.
There were no revisions to pension contribution projections in the February Plan. Pension contributions will be updated in the FY 2023 Executive Budget to reflect final pension costs for FY 2022 and projected costs for FY 2023 through FY 2026. The FY 2022 projection was previously updated in the November Plan to reflect recent changes to the assumptions and methodology used in calculating employers pension contributions. The FY 2023 Executive Budget projections for FY 2023 through FY 2026 will reflect the changes implemented.
Chart 4. Pension Contributions FY 2012 to FY 2026
Source: Office of the NYC Comptroller, Comprehensive Annual Financial Reports and NYC Office of Management and Budget, February 2022 Financial Plan.
The City’s Chief Actuary periodically reviews the actuarial assumptions and methods used in calculating employers contributions and determines the need for any modifications or changes to the underlying actuarial assumptions and methods. Such a review was done recently, and the Chief Actuary made recommendations to modify the underlying assumptions and methods to the systems’ Board of Trustees in 2021. Among the changes adopted by the Board of Trustees were:
- The updating of post-retirement mortality assumptions for both pensioners and non-pensioners to reflect the latest improvement scale released by the Society of Actuaries (SOA).
- A change to the valuation of the pension systems’ assets to reflect the market value as of June 30, 2019.
- A change to the recognition of future asset performance from a six-year period of 15 percent for the first four years and 20 percent for the last two years to a five-year period at 20 percent per year.
The changes in the actuarial assumptions and methods lowered the City’s pension cost by approximately $520 million annually.
Labor
The current balance in the labor reserve is $748 million in FY 2022, $846 million in FY 2023, $1.028 billion in FY 2024, $1.406 billion in FY 2025, and $1.833 billion in FY 2026. Other than in FY 2022, the labor reserve balance remained relatively unchanged for each fiscal year when compared to the November Plan. There was a net reduction to the labor reserve in FY 2022 of $467 million. In light of the fiscal challenges in FY 2021, the City negotiated agreements with several unions to defer approximately $470 million in lump sum and retroactive wage payments due from previous contracts. The February Plan adds back $461 million to agencies’ budgets.[12]
The City has reached contract agreements with unions representing about 93 percent of the workforce for the previous round of collective bargaining. Recently, agreements were announced with the Uniformed Firefighters Association (UFA) and the Detectives’ Endowment Association (DEA). As shown in Table 26, the Patrolmen’s Benevolent Association (PBA) is the only major union that has yet to reach an agreement with the City. The PBA in late 2017 claimed a bargaining impasse with the City and filed for arbitration with the New York State Public Employment Relations Board (PERB). PERB declared an impasse which resulted in a mediation process between the two parties. This also failed paving the way for both the City and the PBA to present arguments before an arbitration panel, the decision of which is binding. The proceedings were delayed by the pandemic. The parties were able to present their arguments recently and are now going through the rebuttal process. The City has allocated approximately $950 million retroactive to August 2017 both through accruals and in the labor reserve for the PBA’s contract based on the pattern established by the Uniformed Officers Coalition of 7.95 percent over three years.
Table 26. Labor Contracts
| Contract Expiration | |
|---|---|
| Uniformed Firefighters Association | 7/31/2020 |
| District Council 37 | 5/25/2021 |
| Uniformed Fire Officers Association | 7/30/2021 |
| Organization of Staff Analysts | 9/05/2021 |
| Sergeants Benevolent Association | 12/09/2021 |
| Communications Workers of America – 1180 | 12/12/2021 |
| Lieutenants Benevolent Association | 2/15/2022 |
| Correction Officers’ Benevolent Association | 2/28/2022 |
| Detectives’ Endowment Association | 5/31/2022 |
| Captains Endowment Association | 7/31/2022 |
| Correction Captains Association | 8/15/2022 |
| United Federation of Teachers | 9/13/2022 |
| Uniformed Sanitationmen’s Association | 12/27/2022 |
| Uniformed Sanitation Chiefs Association | 12/31/2022 |
| Council of School Supervisors and Administrators | 1/28/2023 |
| Sanitation Officers Association | 6/24/2023 |
| Patrolmen’s Benevolent Association | Unsettled |
The balances in the labor reserve reflect the City’s current position on wage increases for all employees for the next round of collective bargaining. There is no funding in the budget for wage increases for the first two years of each contract period. Funds providing annual wage increases of 1 percent are reserved beginning in the third year of the next contract period for all employees. A full year 1 percent wage increase for all employees, including pensions, would cost approximately $450 million.
Public Assistance
Through January, the City’s public assistance caseload has averaged 373,879 recipients per month thus far in FY 2022. While caseload fell during the first quarter of the current fiscal year through September 2021, a reversal has taken place over the past four months that has pushed caseload level past even the peak experienced during the early phase of the pandemic, as shown in Chart 5. Since September 2021, the City’s public assistance caseload has risen sharply by 10.5 percent or about 37,500 recipients. The spike in caseload coincided with the expiration of extended unemployment benefits under the Federal Pandemic Unemployment Compensation program on September 6, 2021. According to the City, since September, there has been a 65 percent surge in the average number of applicants per month compared to the end of FY 2021. More importantly, under the same timeline comparison, average monthly acceptance rate of clients for benefits has jumped from 30 percent to 50 percent, fueling the rapid rise in caseload.
Chart 5. Public Assistance Caseload and Monthly Changes
March 2020-January 2022
Source: NYC Department of Social Services
Though the City has not provided an update of its caseload projections, the February Plan maintains baseline grants expenditure estimates of approximately $1.48 billion in each of FY 2022 – FY 2026. Due to the decline in monthly spending through most of the first half of FY 2022, average monthly grants expenditures in FY 2022 to date remains significantly below the FY 2021 monthly average. Therefore, barring a substantial increase in monthly grants spending in the remainder of FY 2022, the City’s public assistance budget appears to be sufficiently funded in the current year. Given the recent surge in public assistance caseload, it bears close monitoring on the potential impact it would have against the City’s budget assumptions in FY 2023 – FY 2026.
Department of Education
The February Modification reflects a net increase of $399 million in the Department of Education (DOE) budget in the current year. For FY 2022, the DOE budget now totals $31.98 billion, an increase of over 12 percent or $3.50 billion above actual FY 2021 spending of $28.48 billion due to increased spending supported by the boost in Federal COVID stimulus funding. About $3.02 billion in stimulus funding stems from ARPA ($1.76 billion) and CRRSAA ($1.26 billion) education grants, with an additional $488 million provided through ARPA SLFRF ($416 million) and CARES ($72 million) funding.
Compared to the November Plan, the increase in the FY 2022 budget is mainly attributable to a collective bargaining transfer of $405 million and energy adjustment of $12 million. City support for DOE actually declines by a net $140 million due to PEG savings of $256 million and the use of $300 million in ARPA SLFRF funding to partly offset personal services costs. The PEG savings in the current year include $110 million in central reductions, $55 million in State pre-kindergarten revenue offset, $39 million in school safety division savings and $37 million in school budget efficiencies. The reduced City funding is more than offset by a combined increase in Federal and State funding of $539 million consisting mainly of the aforementioned ARPA SLFRF and pre-kindergarten revenues, as well as the recognition of $134 million in charter school grants.
The FY 2023 Preliminary Budget projects DOE spending of $30.73 billion, a decline of nearly 4 percent or $1.25 billion from the FY 2022 budget that is consistent with the decrease in ARPA and CRRSAA education grants. FY 2023 DOE funding level has fallen by a net of $142 million entirely in City funds since the November Plan. The Preliminary Budget has addressed needs in charter school tuition and pupil transportation with funding increases of $282 million and $134 million, respectively. The new funding provided to these two areas is more than offset by PEG savings assigned to the DOE, which is expected to reduce City-funded expenditures by almost $557 million in FY 2023. Foremost among the savings is $375 million assumed for the decline of DOE enrollment during the pandemic. According to preliminary enrollment data from DOE, the number of students in pre-kindergarten through 12th grade, excluding charter schools, has declined by 6.4 percent or the equivalent of about 64,000 pupils over the past two school years. Under the PEG assumptions, the DOE expects to reduce City-funded pedagogical headcount by 3,227 positions to achieve the enrollment-related savings.[13] The extension of actions from the current year would provide additional savings of about $183 million, including $74 million from elimination of vacant positions in school safety (560 positions) and other functions (290 positions), $57 million from central savings and $37 million from continuation of school budget efficiencies.
In the outyears, the City projects the DOE budget to be narrowly range-bound between $30.99 billion to $31.24 billion. Over this span, Federal education stimulus funding will continue to wind down under current assumptions, falling from $1.77 billion in FY 2023 to $1.38 billion in FY 2024 and then ending at $530 million in FY 2025. The reduced Federal support is offset mainly by higher level of City funds, rising by $1.76 billion between FY 2023 and FY 2026, while State support is expected to grow by $462 million across the same period.
Moreover, major risks to the DOE budget projections still remain unaddressed in the February Plan. While the City has fully reflected potential costs from increased charter school tuition rates in FY 2023, it has not provided adequate funding to address spending growth in subsequent years in the Plan. The additional funding allocated in the February Plan for FY 2024 – FY 2026 represents only half of the needs identified by the City in prior estimates. Unless the State provides additional reimbursement in future years, the City could face potential shortfalls of $240 million in FY 2024 and $320 million in FY 2025 and $500 million in FY 2026. Further, the budget for special education Carter Cases remains significantly underfunded in each year of the Plan. Over the past five years, spending for Carter Cases has more than doubled from $312 million in FY 2016 to $807 million recognized in FY 2021. In order to maintain baseline funding similar to spending level in FY 2021, the City will need to provide additional funding of at least $100 million in FY 2022 and $300 million annually in FY 2023 – FY 2026.
In addition, the City could face risks for a number of core instructional and support initiatives due to the expiration of Federal stimulus funds. Chief among these is the underfunding of 3K expansion costs by $376 million in FY 2026. The City would also need to provide additional funding of $111 million in FY 2025 and $235 million in FY 2026 as ongoing support of special education pre-kindergarten expansion, mental health services and community schools programs unless these initiatives can be significantly curtailed or discontinued.
Homeless Services
Spending on adult and family shelter in the Department of Homeless Services (DHS) is the primary driver of the City’s homelessness expenses. However, funding for homeless assistance is also, and increasingly, drawn from the budgets of other agencies, including the Department of Social Services, the Department of Youth and Community Development, the Department of Health and Mental Hygiene and the Department of Veterans Services. Table 27 details total funding for seven major categories of homeless services across these agencies in the Preliminary FY 2023 budget.
Table 27. Citywide Homeless Services Expenditures
| ($ in millions) | FY 2019 | FY 2020 | FY 2021 | FY 2022 | FY 2023 | FY 2024 | FY 2025 |
|---|---|---|---|---|---|---|---|
| Adult Shelter Operations | $767 | $826 | $771 | $921 | $799 | $799 | $799 |
| Family Shelter Operations | 1,147 | 1,123 | 1,029 | 1,021 | 1,066 | 1,066 | 1,066 |
| Rental Assistance | 497 | 557 | 682 | 762 | 507 | 507 | 507 |
| Prevention, Diversion, Anti-Eviction & Aftercare | 482 | 512 | 490 | 523 | 474 | 472 | 472 |
| Domestic Violence, Youth & Emergency Shelters | 105 | 110 | 96 | 112 | 112 | 112 | 112 |
| Homeless Administration & Support Services | 249 | 403 | 1,229 | 814 | 280 | 280 | 280 |
| Total Citywide Homeless Spending | $3,247 | $3,531 | $4,295 | $4,153 | $3,238 | $3,237 | $3,236 |
Note: Numbers may not add due to rounding. FY 2019 through FY 2021 figures are actual expenditures; FY 2022 through FY 2025 are planned.
Planned citywide homeless services expenses tracked by the Comptroller’s Office decreased by more than $915 million in the Preliminary FY 2023 budget, compared to planned expenses in FY 2022. This represents a 22 percent reduction from the previous fiscal year. Outyear spending is slated to remain relatively flat.
Most of the major spending categories in Table 27 above were reduced in the Preliminary FY 2023 budget. Spending in the Homeless Administration and Support and Rental Assistance categories are planned to respectively drop by $534 million and $255 million in the next fiscal year. Both reductions are largely driven by the cessation of approximately $445.9 million and $176.8 million in Federal emergency funding respectively. Decreased spending is also planned for Adult Shelter Operations, which will drop by $122.1 million and Prevention, Diversion, Anti-Eviction and Aftercare which is to be cut by $49.4 million. Family Shelter Operations and DV and Youth Shelter expenses are two notable exceptions to this downward trend. Those two categories are planned to receive respective funding boosts of $45.8 million and $254,000. Additionally, the February Plan includes an additional $350 million from new Federal funding for general administration uses at the Department of Homeless Services in FY 2022.
Homeless services spending within the Department of Social Services in the Preliminary Budget is punctuated by programmatic spending reductions compared to FY 2022 levels. Chief among these are reductions of: $47.9 million for HASA SRO expenses for individuals living with AIDS or HIV illness; $40.8 million for anti-eviction services; $9.8 million for the City’s Homelessness Prevention and Incentive Program; $12.2 million for the Housing for Homeless Veterans program; and $4.4 million for homeless diversions. One notable programmatic spending increase at the Department of Social Services is a rise of $22.4 million for the Subsidized Jobs for Homeless Clients program in FY 2023. Spending for runaway youth programs at the Department of Youth and Community Development will remain mostly flat in FY 2023 as will spending for Supportive Housing programs at the Department of Health and Mental Hygiene.
New York City’s shelter census has continued to trend downward since the onset of the pandemic with every category of shelter dweller that the City publicly tracks exhibiting declines in the one year period from February 16, 2021 to February 16, 2022. Among the most notable recent census drops has been in the Single Adult demographic, a population that has experienced persistent growth since FY 2014. In the last year, a net of 1,793 single adults have vacated the City shelter system. Chart 6 below illustrates changes in the single adult shelter census since FY 2014.
Chart 6. Single Adult Shelter Census, FY 2014 – FY 2022
Source – Single Adult shelter census on February 16th of each year as published by NYC Open Data
Expenses for Adult Shelter Operations have been historically underestimated in past fiscal years. The current reduction in single adult shelter dwellers is an encouraging development, as is the shelter re-estimate in the February Plan which contributes an additional $132 million in City funds for adult shelters since the November Plan, but as the City pushes new policies to transition homeless individuals away from public spaces, new and returning entrants to the shelter system may put pressure on Adult Shelter Operations expenses. Additionally, planned FY 2023 expenses for Adult Shelter Operations are comparable to actual spending for this budget function in FY 2019, despite a substantially lower shelter census of 15,210 when the preliminary budget for that fiscal year was prepared. With these considerations, the Preliminary Budget for FY 2023 appears to be insufficient. If spending on Adult Shelter Operations can be kept flat in FY 2023, the Comptroller’s Office anticipates that an additional $117 million in City Funds will be necessary to meet adult shelter expenses.
Planned Rental Assistance expenses in FY 2023 also create a budget risk for the outyears. In FY 2022, the City expects to dedicate approximately $194.4 million in Federal funding towards rental assistance programming within the Department of Social Services, including the CityFEPS program. Rental assistance vouchers that are issued using this funding will have to be replenished for their duration in the outyears, however, the City only anticipates some $17.6 million in Federal funding for vouchers in FY 2023. In the absence of additional Federal dollars for rental assistance, approximately $176.8 million in city funds could be necessary in the outyears if the entirety of this Federal support is applied towards permanent housing vouchers in FY 2023.
The Department of Homeless Services will participate in the citywide savings initiative by reducing planned spending by $45.8 million in FY 2022 and $62.7 million in FY 2023. These reductions will largely be borne by savings anticipated through hotel shelter closings and by reductions to shelter repair expenses.
IV. Capital Budget and Financing Program
Capital Commitment Plan, FY 2022 – FY 2026
The February 2022 Capital Commitment Plan for the five-year period FY 2022 through FY 2026 totals $100.0 billion in authorized all-funds commitments, as shown in Table 28.[14] City-funds commitments account for $95.4 billion of the total. All-funds commitments increased by $366 million, or 0.5 percent, from the October 2021 Commitment Plan. Estimated authorized commitments average $20 billion per year.
All-Funds Commitments
All-funds commitments, after adjusting for the $10.05 billion reserve for unattained commitments, total $89.95 billion, or an average of $17.99 billion per year.[15] Approximately 16 percent of all-funds commitments, after netting out the reserve for unattained commitments, are scheduled for FY 2022.
Like past capital commitment plans, projected commitments for DOE and the City University of New York (CUNY), the Department of Environmental Protection (DEP), the Department of Transportation (DOT) and Mass Transit, and Housing and Economic Development account for most of the estimated commitments, with 64.2 percent of the total.[16]
Table 28. FY 2022 – FY 2026 Capital Commitments, All-Funds
| Project Category – $ millions | February FY 2022 – FY 2026 Commitment Plan | Percent of Total | Change from October 2021 Plan |
|---|---|---|---|
| Education and CUNY | $17,817 | 17.8% | ($1) |
| Environmental Protection | 14,813 | 14.8% | (617) |
| Dept. of Transportation and Mass Transit | 16,736 | 16.7% | 767 |
| Housing and Economic Development | 14,871 | 14.9% | (145) |
| Administration of Justice | 10,712 | 10.7% | 347 |
| Resiliency, Technology and Equipment | 5,936 | 5.9% | 533 |
| Parks Department | 5,878 | 5.9% | (234) |
| Hospitals | 3,498 | 3.5% | 56 |
| Other City Operations and Facilities | 9,738 | 9.7% | (339) |
| Total Authorized Commitments | $99,998 | 100.0% | $366 |
| Reserve for Unattained Commitments | (10,054) | N/A | ($758) |
| Total Net of Reserve for Unattained Commitments | $89,944 | N/A | ($392) |
Source: NYC Office of Management and Budget, FY 2022 – FY 2025 February Capital Commitment Plan, February 2022.
Note: Changes from October 2021 Plan are based on FY 2022 – FY 2025 only. Numbers may not add due to rounding.
As shown on Table 28, there is little change to Education and CUNY over the period FY 2022-2025. DEP commitments decreased by $617 million, but according to OMB, they are largely rolled out to FY 2026-2031. The $767 million increase to DOT and Mass Transit are driven by an increase of $899 million for highway bridges projects, offset by a net decrease of $132 million, driven primarily from a decrease in highways and street reconstruction related projects.
Housing and economic development projects decreased by $145 million over the period. However, HPD’s total did not change from October 2021, economic development related projects decreased by $151 million and NYCHA increased by a modest $6 million.
The Administration of Justice program area increased by $347 million over FY 2022 – FY 2025. The increase is comprised of a $199 million increase for a new training facility for DOC, an increase of $96 million for various Courts related projects, and $52 million for the Police Department.
Resiliency, Technology, and Equipment saw a substantial increase of $533 million over the FY 2022 – FY 2025 period. This increase was driven by $576 million related to equipment, energy efficiency, sustainability and resiliency projects offset by a $43 million decrease to DOITT related projects.
The Parks Dept. decreased by $234 million over FY 2022-2025. This is comprised of a multitude of increases and decreases in over 1,600 capital project ID’s. However, according to NYC OMB, the observed net decrease is rolled into future fiscal years and does not constitute a programmatic reduction.
H + H increased by $56 million, a change of less than two percent from the October 2021 Plan. Other City Operations and Facilities decreased by $339 million. The major drivers of the decrease in city operations and facilities are DCAS managed public facilities projects with a $195 million decrease, various projects related to cultural affairs in the amount of $61 million, and a $55 million decrease to the three library systems.
As indicated above, the Plan over FY 2022-2025 increased by $366.2 million. This change in authorized commitments from the October 2021 Plan is comprised of commitment decreases of $2.27 billion in FY 2022 and $1.38 billion in FY 2023, offset by increases of $2.20 billion in FY 2024 and $1.83 billion in FY 2025.
The decrease of $2.27 billion in estimated commitments in FY 2022 stems primarily from a redistribution of $950 million in the Department of Education commitments to FY 2023 and 2024, along with a $452 million delay in citywide equipment, sustainability, and energy efficiency projects, and an estimated delay of $216 million in economic development related projects to FY 2025. Another 37 project types result in a net decrease of $654 million.
In FY 2023, the decrease of $1.38 billion is driven by a decrease of $770 million of highways and street reconstruction projects and highway bridges related projects within DOT, along with decreases of $414 million and $247 million in water pollution control plant and Parks Department related projects, respectively.
The increase of $2.20 billion in FY 2024 is largely driven by deferrals from prior years into FY 2024. These include the deferrals of $475 million in DOE related projects, $488 million of highways and street reconstruction and highway bridges projects, and $354 million of H +H projects. In addition, $371 million of Citywide resiliency measures and $62 million of energy efficiency and sustainability projects were added in FY 2024. The balance of $448 million represents a net increase across 35 other project types.
The increase of $1.83 billion in FY 2025 is comprised of an increase of $822 million in highways and street reconstruction projects and highway bridges projects, along with $182 million in energy efficiency and sustainability projects and Citywide resiliency measures in the amount of $135 million. In addition, FY 2025 experienced an increase of $334 million to water pollution control plant projects deferred largely from FY 2023. About 36 other project types combined for a net increase of about $350 million.
Financing Program
The February 2002 Financial Plan projects borrowing needs of $60.07 billion over the period FY 2022 — FY 2026. This is comprised of the Transitional Finance Authority’s (TFA) Future Tax Secured (FTS) bonds at $26.07 billion, GO bonds at a projected $24.87 billion, and New York Water Finance authority (NYW) at $9.13 billion over the same period. This is a $1.11 billion decrease from the November 2021 Plan.[17]
Table 29. February 2022 Plan Financing Program
| ($ in millions) | Estimated Borrowing and Funding Sources FY 2022 – FY 2026 | Percent of Total |
|---|---|---|
| General Obligation Bonds | $24,870 | 41.4% |
| TFA FTS Bonds | 26,070 | 43.4% |
| NYC Water Finance Authority | 9,125 | 15.2% |
| TFA BARBs | 0 | 0.0% |
| Total | $60,065 | 100.0% |
Source: NYC Office of Management and Budget, February 2022 Financial Plan.
GO borrowing is forecast to decrease by $930 million over the period, of which $850 million of the decrease is occurring in FY 2022. TFA borrowing is projected to increase by $220 million over the period. Borrowing associated with NYW is estimated to decline by $401 million over the same period, FY 2022 – FY 2025.
Overall, GO and TFA borrowing, the primary financing sources of City capital expenditures, averages $10.19 billion of combined annual issuances over FY 2022 – 2026, or about $140 million less per year than projected in the November 2021 Plan. If fully achieved, this level of borrowing would potentially put pressure on the general debt limit beyond the Financial Plan years. Although it is premature to increase TFA borrowing capacity outside of the general debt limit at this time, the continuing disparity between the pace of general debt limit growth and the growth of future estimated indebtedness could result in an increase to the TFA’s borrowing capacity outside of the general debt limit (which would require a change to State law), or a call for prioritized reductions and/or delays to the capital program. As of January 31, 2022, the remaining debt-incurring power was $42.8 billion and is estimated to decrease to $4.5 billion at the end of FY 2026.
Debt Service
As shown in Table 30, debt service, net of prepayments, in the February 2022 Plan totals $6.84 billion in FY 2022, $8.02 billion in FY 2023, $8.34 billion in FY 2024, $8.88 billion in FY 2025, and $9.67 billion in FY2026. Between FY 2022 and FY 2026, total debt service is expected to increase by $2.83 billion, or an annual average growth rate of 9.0 percent. These projections do not include debt service of the NYW, which is backed by water and sewer user fees, nor that of the TFA BARBs, which is supported by New York State building aid.
Table 30. February 2022 Financial Plan Debt Service Estimates
| ($ in millions) | FY 2022 | FY 2023 | FY 2024 | FY 2025 | FY 2026 | Change FY 2022– FY 2026 | Average Annual Growth |
|---|---|---|---|---|---|---|---|
| GO | $3,779 | $4,313 | $4,580 | $4,795 | $5,063 | $1,284 | 7.6% |
| TFA FTSa | 2,861 | 3,482 | 3,568 | 3,891 | 4,418 | 1,557 | 11.5% |
| Lease-Purchase | 124 | 147 | 118 | 117 | 116 | (8) | (1.6%) |
| TSASC, Inc. | 76 | 76 | 76 | 76 | 69 | (7) | (2.4%) |
| Total | $6,840 | $8,018 | $8,341 | $8,879 | $9,666 | $2,826 | 9.0% |
Source: February 2022 Financial Plan.
Note: Debt service is adjusted for prepayments.
a Amounts do not include TFA BARBs
The February Plan projections represent decreases from the November 2021 Financial Plan of $27 million in FY 2022, $52 million in FY 2023, $70 million in FY 2024, $77 million in FY 2025.[18]
Savings in FY 2022 are almost exclusively from GO VRDB debt service re-estimates. In FY 2023 – FY 2025, savings are generated from lower GO borrowing in FY 2022, resulting in outyear savings of $49 million in FY 2023, $68 million in FY 2024, and $73 million in FY 2025. There was little change in TFA debt service estimates averaging a modest $3 million decrease over FY 2022 – FY 2025.
In FY 2022 to date, the City completed one TFA FTS refunding. The TFA refunded $1.30 billion of TFA FTS bonds with the proceeds of $1.05 billion in refunding bonds, lowering debt outstanding by about $244 million and produced savings of just below $250 million over the Financial Plan period.
Debt Affordability
Debt service as a percent of local tax revenues and as a percent of total-funds revenues are commonly used measures of debt affordability. In FY 2021, the City’s debt service was 9.7 percent of local tax revenues. The February 2022 Plan projects that debt service will consume 10.6 percent of local tax revenues in FY 2022, rising to 12.1 percent in FY 2023, 12.2 percent in FY 2024, 12.6 percent in FY 2025, and 13.6 percent in FY 2026, as shown in Chart 7. The upward trend in the debt service to tax revenue ratio reflects the disparity between debt service and tax revenue growth rates over the Plan period. Debt service is projected to grow at an average annual rate of 9.1 percent from FY 2022 to FY 2026, while tax revenues during this period are projected to grow 2.5 percent annually.[19] Based on an assumption of 4 percent annual tax revenue growth in FY 2027 – FY 2031, this ratio would average 14.3 percent over this period. If annual tax revenue growth over this five-year period were to remain at 2.5 percent, however, the ratio would approach the 15 percent threshold that is considered affordable by FY 2029.
Chart 7. NYC Debt Service as a Percent of Tax Revenues
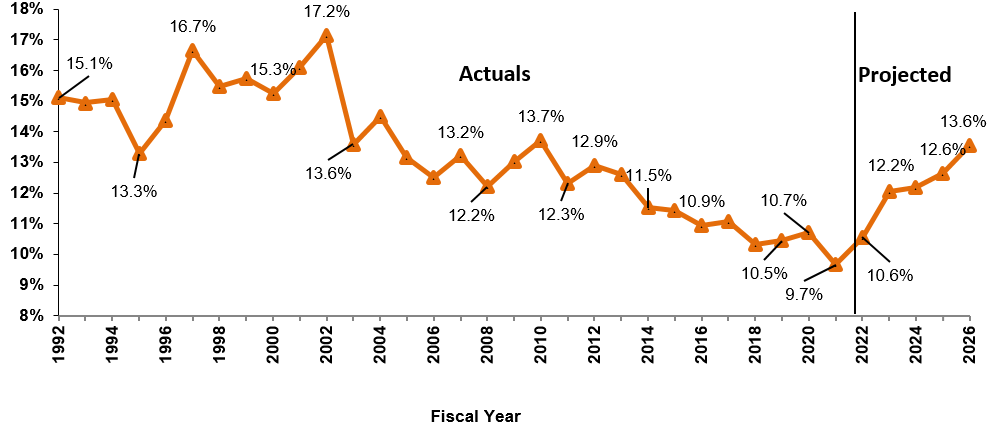
Source: Office of the NYC Comptroller, Comprehensive Annual Financial Reports, FY 1992 – FY 2020, and NYC Office of Management and Budget, February 2022 Financial Plan.
Debt service is also projected to grow at a faster rate than total revenues (including taxes, non-tax revenues, and Federal, State, and other categorical aid) over the Plan period. As such, debt service is projected to consume an increasing share of total revenues as well. As shown in Chart 8, the City’s debt service as a percent of all-funds revenues is estimated to be 6.4 percent in FY 2022, 8.1 percent in FY 2023, 8.3 percent in FY 2024, 8.8 percent in FY 2025, 9.5 percent in FY 2026. The debt service growth of 9.0 percent over the Financial Plan period is significantly higher than the projected total revenue growth of minus 1.0 percent, resulting in the growth of the ratio.[20]
Chart 8. NYC Debt Service as a Percent of Total Revenues
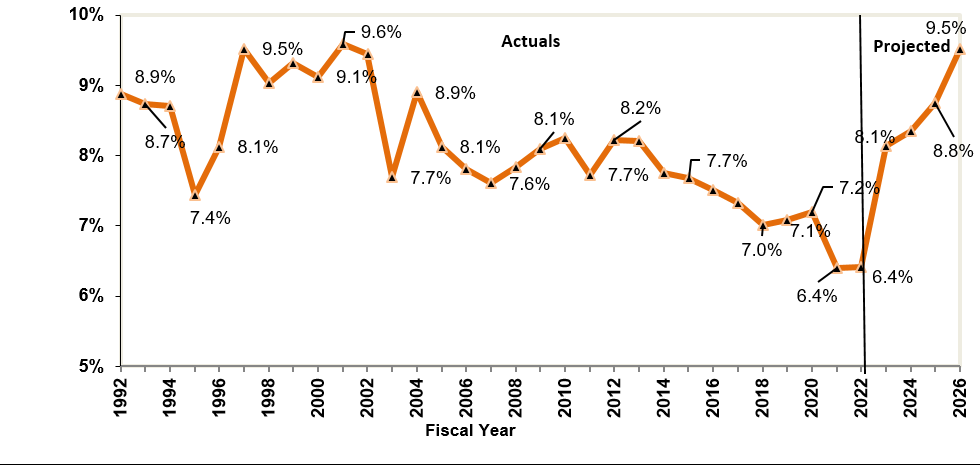
Source: Office of the NYC Comptroller, Comprehensive Annual Financial Reports, FY 1992 – FY 2020, and NYC Office of Management and Budget, February 2022 Financial Plan.
V. Appendix
Table A1. February 2022 Financial Plan Revenue Detail
| ($ in millions) | FY 2022 | FY 2023 | FY 2024 | FY 2025 | FY 2026 | Change FYs 2022– 2026 |
Annual Percent Change |
|
|---|---|---|---|---|---|---|---|---|
| Dollars | Percent | |||||||
| Taxes: | ||||||||
| Real Property | $29,554 | $31,034 | $31,291 | $31,466 | $31,526 | $1,972 | 6.7% | 1.6% |
| Personal Income Tax | $14,182 | $14,741 | $15,329 | $15,958 | $16,265 | $2,083 | 14.7% | 3.5% |
| General Corporation Tax | $4,609 | $4,552 | $4,526 | $4,642 | $4,898 | $289 | 6.3% | 1.5% |
| Unincorporated Business Tax | $2,174 | $2,220 | $2,289 | $2,367 | $2,440 | $266 | 12.2% | 2.9% |
| Sale and Use Tax | $7,715 | $8,143 | $8,827 | $9,426 | $9,700 | $1,985 | 25.7% | 5.9% |
| Real Property Transfer Tax | $1,488 | $1,335 | $1,409 | $1,484 | $1,520 | $32 | 2.2% | 0.5% |
| Mortgage Recording Tax | $1,000 | $919 | $971 | $1,024 | $1,061 | $61 | 6.1% | 1.5% |
| Commercial Rent | $894 | $927 | $953 | $981 | $1,003 | $109 | 12.2% | 2.9% |
| Utility | $376 | $379 | $388 | $394 | $402 | $26 | 6.9% | 1.7% |
| Hotel | $255 | $350 | $520 | $630 | $650 | $395 | 154.9% | 26.4% |
| Cigarette | $20 | $18 | $17 | $16 | $16 | ($4) | (20.0%) | (5.4%) |
| All Other | $842 | $833 | $833 | $833 | $833 | ($9) | (1.1%) | (0.3%) |
| Tax Audit Revenue | $921 | $721 | $721 | $721 | $721 | ($200) | (21.7%) | (5.9%) |
| City Tax Programs | $0 | ($300) | ($300) | ($300) | ($300) | ($300) | NA | NA |
| Total Taxes | $64,030 | $65,872 | $67,774 | $69,642 | $70,735 | $6,705 | 10.5% | 2.5% |
| Miscellaneous Revenue: | ||||||||
| Licenses, Franchises, Etc. | $672 | $690 | $692 | $690 | $695 | $23 | 3.4% | 0.8% |
| Interest Income | $9 | $75 | $130 | $174 | $196 | $187 | 2077.8% | 116.0% |
| Charges for Services | $1,002 | $1,029 | $1,033 | $1,033 | $1,033 | $31 | 3.1% | 0.8% |
| Water and Sewer Charges | $1,682 | $1,674 | $1,657 | $1,656 | $1,656 | ($26) | (1.5%) | (0.4%) |
| Rental Income | $246 | $246 | $247 | $246 | $246 | $0 | 0.0% | 0.0% |
| Fines and Forfeitures | $1,093 | $1,076 | $1,090 | $1,090 | $1,090 | ($3) | (0.3%) | (0.1%) |
| Miscellaneous | $393 | $340 | $339 | $338 | $338 | ($55) | (14.0%) | (3.7%) |
| Intra-City Revenue | $2,153 | $1,850 | $1,848 | $1,838 | $1,838 | ($315) | (14.6%) | (3.9%) |
| Total Miscellaneous Revenue | $7,250 | $6,980 | $7,036 | $7,065 | $7,092 | ($158) | (2.2%) | (0.5%) |
| Unrestricted Intergovernmental Aid: | ||||||||
| Other Federal and State Aid | $1,044 | $0 | $0 | $0 | $0 | ($1,044) | (100.0%) | (100.0%) |
| Total Unrestricted Intergovernmental Aid | $1,044 | $0 | $0 | $0 | $0 | ($1,044) | (100.0%) | (100.0%) |
| Reserve for Disallowance of Categorical Grants | ($15) | ($15) | ($15) | ($15) | ($15) | $0 | 0.0% | 0.0% |
| Less: Intra-City Revenue | ($2,153) | ($1,850) | ($1,848) | ($1,838) | ($1,838) | $315 | (14.6%) | (3.9%) |
| TOTAL CITY-FUNDS | $70,156 | $70,987 | $72,947 | $74,854 | $75,974 | $5,818 | 8.3% | 2.0% |
| Other Categorical Grants | $1,149 | $1,013 | $1,006 | $1,005 | $1,001 | ($148) | (12.9%) | (3.4%) |
| Inter-Fund Agreements | $730 | $734 | $732 | $731 | $731 | $1 | 0.1% | 0.0% |
| Federal Categorical Grants: | ||||||||
| Community Development | $583 | $264 | $254 | $241 | $241 | ($342) | (58.7%) | (19.8%) |
| Social Services | $3,567 | $3,449 | $3,448 | $3,447 | $3,444 | ($123) | (3.4%) | (0.9%) |
| Education | $5,165 | $3,771 | $3,384 | $2,492 | $1,962 | ($3,203) | (62.0%) | (21.5%) |
| Other | $8,699 | $1,901 | $1,558 | $1,748 | $1,255 | ($7,444) | (85.6%) | (38.4%) |
| Total Federal Grants | $18,014 | $9,385 | $8,644 | $7,928 | $6,902 | ($11,112) | (61.7%) | (21.3%) |
| State Categorical Grants | ||||||||
| Social Services | $1,913 | $1,849 | $1,846 | $1,842 | $1,836 | ($77) | (4.0%) | (1.0%) |
| Education | $12,213 | $12,250 | $12,520 | $12,713 | $12,713 | $500 | 4.1% | 1.0% |
| Higher Education | $278 | $277 | $277 | $277 | $277 | ($1) | (0.4%) | (0.1%) |
| Department of Health and Mental Hygiene | $537 | $551 | $552 | $552 | $552 | $15 | 2.8% | 0.7% |
| Other | $1,549 | $1,490 | $1,447 | $1,504 | $1,565 | $16 | 1.0% | 0.3% |
| Total State Grants | $16,490 | $16,417 | $16,642 | $16,888 | $16,943 | $453 | 2.7% | 0.7% |
| TOTAL REVENUES | $106,539 | $98,536 | $99,971 | $101,406 | $101,551 | ($4,988) | (4.7%) | (1.2%) |
Note: Numbers may not add due to rounding.
Table A2. February 2022 Financial Plan Expenditure Detail
| ($ in millions) | FY 2022 | FY 2023 | FY 2024 | FY 2025 | FY 2026 | Change FYs 2022 – 2026 |
Annual Percent Change |
||
|---|---|---|---|---|---|---|---|---|---|
| Dollars | Percent | ||||||||
| Mayoralty | $171 | $167 | $157 | $157 | $157 | ($15) | (8.5%) | (2.2%) | |
| Board of Elections | $232 | $133 | $133 | $133 | $133 | ($99) | (42.8%) | (13.0%) | |
| Campaign Finance Board | $51 | $15 | $15 | $15 | $15 | ($36) | (70.6%) | (26.4%) | |
| Office of the Actuary | $7 | $7 | $7 | $7 | $7 | $1 | 8.4% | 2.0% | |
| President, Borough of Manhattan | $6 | $5 | $5 | $5 | $5 | ($1) | (18.3%) | (4.9%) | |
| President, Borough of Bronx | $7 | $6 | $6 | $6 | $6 | ($1) | (19.9%) | (5.4%) | |
| President, Borough of Brooklyn | $9 | $6 | $6 | $6 | $6 | ($2) | (26.6%) | (7.4%) | |
| President, Borough of Queens | $7 | $5 | $5 | $5 | $5 | ($2) | (28.8%) | (8.1%) | |
| President, Borough of Staten Island | $5 | $4 | $4 | $4 | $4 | ($1) | (15.5%) | (4.1%) | |
| Office of the Comptroller | $108 | $110 | $110 | $110 | $110 | $3 | 2.6% | 0.6% | |
| Dept. of Emergency Management | $780 | $59 | $33 | $32 | $32 | ($748) | (95.9%) | (54.9%) | |
| Office of Administrative Tax Appeals | $6 | $6 | $6 | $6 | $6 | ($0) | (0.0%) | (0.0%) | |
| Law Dept. | $274 | $235 | $235 | $235 | $235 | ($39) | (14.1%) | (3.7%) | |
| Dept. of City Planning | $46 | $45 | $42 | $42 | $42 | ($4) | (8.3%) | (2.1%) | |
| Dept. of Investigation | $51 | $44 | $44 | $44 | $44 | ($7) | (14.0%) | (3.7%) | |
| NY Public Library — Research | $31 | $30 | $30 | $30 | $30 | ($0) | (0.2%) | (0.1%) | |
| New York Public Library | $154 | $153 | $153 | $153 | $153 | ($1) | (0.5%) | (0.1%) | |
| Brooklyn Public Library | $116 | $115 | $115 | $115 | $115 | ($1) | (0.7%) | (0.2%) | |
| Queens Borough Public Library | $121 | $120 | $120 | $120 | $120 | ($1) | (0.8%) | (0.2%) | |
| Dept. of Education | $31,980 | $30,729 | $30,989 | $31,242 | $31,140 | ($840) | (2.6%) | (0.7%) | |
| City University | $1,385 | $1,340 | $1,280 | $1,295 | $1,296 | ($88) | (6.4%) | (1.6%) | |
| Civilian Complaint Review Board | $24 | $24 | $24 | $24 | $24 | ($1) | (2.3%) | (0.6%) | |
| Police Dept. | $5,341 | $5,125 | $5,146 | $5,144 | $5,147 | ($194) | (3.6%) | (0.9%) | |
| Fire Dept. | $2,313 | $2,151 | $2,122 | $2,115 | $2,115 | ($198) | (8.5%) | (2.2%) | |
| Dept. of Veterans’ Services | $6 | $6 | $6 | $6 | $6 | $0 | 0.5% | 0.1% | |
| Admin. for Children Services | $2,736 | $2,718 | $2,718 | $2,713 | $2,692 | ($44) | (1.6%) | (0.4%) | |
| Dept. of Social Services | $11,328 | $10,746 | $10,744 | $10,743 | $10,718 | ($610) | (5.4%) | (1.4%) | |
| Dept. of Homeless Services | $2,759 | $2,144 | $2,144 | $2,144 | $2,125 | ($634) | (23.0%) | (6.3%) | |
| Dept. of Correction | $1,336 | $1,229 | $1,216 | $1,216 | $1,216 | ($120) | (9.0%) | (2.3%) | |
| Board of Correction | $3 | $3 | $3 | $3 | $3 | ($0) | (9.9%) | (2.6%) | |
| Citywide Pension Contribution | $9,820 | $9,553 | $8,936 | $8,064 | $7,449 | ($2,371) | (24.1%) | (6.7%) | |
| Miscellaneous | $13,474 | $13,065 | $13,734 | $14,624 | $15,574 | $2,101 | 15.6% | 3.7% | |
| Debt Service | $3,903 | $4,460 | $4,698 | $4,912 | $5,179 | $1,276 | 32.7% | 7.3% | |
| T.F.A. Debt Service | $2,861 | $3,482 | $3,568 | $3,891 | $4,418 | $1,557 | 54.4% | 11.5% | |
| FY 2021 BSA and Discretionary Transfers | ($6,107) | $0 | $0 | $0 | $0 | $6,107 | (100.0%) | (100.0%) | |
| FY 2022 BSA | $3,732 | ($3,732) | $0 | $0 | $0 | ($3,732) | (100.0%) | (100.0%) | |
| Public Advocate | $5 | $5 | $5 | $5 | $5 | ($0) | (4.4%) | (1.1%) | |
| City Council | $81 | $56 | $56 | $56 | $56 | ($24) | (30.0%) | (8.5%) | |
| City Clerk | $6 | $6 | $6 | $6 | $6 | ($0) | (2.6%) | (0.6%) | |
| Dept. for the Aging | $563 | $459 | $456 | $459 | $395 | ($168) | (29.8%) | (8.5%) | |
| Dept. of Cultural Affairs | $228 | $145 | $145 | $145 | $145 | ($82) | (36.1%) | (10.6%) | |
| Financial Info. Serv. Agency | $115 | $110 | $110 | $110 | $110 | ($6) | (4.8%) | (1.2%) | |
| Office of Payroll Admin. | $16 | $15 | $15 | $15 | $15 | ($1) | (4.8%) | (1.2%) | |
| Independent Budget Office | $6 | $6 | $6 | $6 | $6 | ($0) | (7.7%) | (2.0%) | |
| Equal Employment Practices | $1 | $1 | $1 | $1 | $1 | $0 | 0.7% | 0.2% | |
| Civil Service Commission | $1 | $1 | $1 | $1 | $1 | $0 | 0.0% | 0.0% | |
| Landmarks Preservation Commission | $7 | $7 | $7 | $7 | $7 | ($0) | (5.6%) | (1.4%) | |
| Districting Commission | $1 | $1 | $0 | $0 | $0 | ($1) | (100.0% | (100.0% | |
| Taxi & Limousine Commission | $168 | $56 | $55 | $54 | $54 | ($114) | (67.6%) | (24.6%) | |
| Commission on Human Rights | $14 | $15 | $15 | $15 | $15 | $1 | 5.2% | 1.3% | |
| Youth & Community Development | $903 | $722 | $722 | $721 | $702 | ($201) | (22.3%) | (6.1%) | |
| Conflicts of Interest Board | $3 | $3 | $3 | $3 | $3 | $0 | 6.2% | 1.5% | |
| Office of Collective Bargaining | $2 | $2 | $2 | $2 | $2 | $0 | 0.3% | 0.1% | |
| Community Boards (All) | $20 | $19 | $19 | $19 | $19 | ($1) | (4.6%) | (1.2%) | |
| Dept. of Probation | $119 | $113 | $113 | $113 | $112 | ($6) | (5.5%) | (1.4%) | |
| Dept. Small Business Services | $556 | $178 | $154 | $193 | $141 | ($415) | (74.7%) | (29.0%) | |
| Housing Preservation & Development | $1,332 | $1,044 | $1,049 | $1,034 | $1,034 | ($298) | (22.4%) | (6.1%) | |
| Dept. of Buildings | $242 | $216 | $203 | $201 | $201 | ($41) | (17.1%) | (4.6%) | |
| Dept. of Health & Mental Hygiene | $3,201 | $2,057 | $1,968 | $1,965 | $1,932 | ($1,269) | (39.6%) | (11.9%) | |
| NYC Health + Hospitals | $1,854 | $630 | $641 | $641 | $641 | ($1,213) | (65.4%) | (23.3%) | |
| Office of Administrative Trials & Hearings | $56 | $68 | $68 | $68 | $68 | $12 | 21.7% | 5.0% | |
| Dept. of Environmental Protection | $1,588 | $1,479 | $1,453 | $1,448 | $1,449 | ($139) | (8.8%) | (2.3%) | |
| Dept. of Sanitation | $1,912 | $1,774 | $1,776 | $1,784 | $1,775 | ($137) | (7.2%) | (1.8%) | |
| Business Integrity Commission | $9 | $9 | $9 | $9 | $9 | $0 | 3.2% | 0.8% | |
| Dept. of Finance | $331 | $344 | $341 | $337 | $337 | $6 | 1.8% | 0.4% | |
| Dept. of Transportation | $1,310 | $1,327 | $1,316 | $1,311 | $1,284 | ($27) | (2.0%) | (0.5%) | |
| Dept. of Parks and Recreation | $591 | $495 | $490 | $487 | $487 | ($105) | (17.7%) | (4.8%) | |
| Dept. of Design & Construction | $303 | $161 | $157 | $158 | $158 | ($145) | (47.8%) | (15.0%) | |
| Dept. of Citywide Admin. Services | $710 | $540 | $532 | $532 | $533 | ($177) | (24.9%) | (6.9%) | |
| D.O.I.T.T. | $760 | $563 | $577 | $582 | $582 | ($178) | (23.4%) | (6.4%) | |
| Dept. of Record & Info. Services | $17 | $16 | $17 | $17 | $17 | ($0) | (1.4%) | (0.3%) | |
| Dept. of Consumer & Worker Protection | $59 | $61 | $60 | $60 | $60 | $1 | 1.2% | 0.3% | |
| District Attorney – N.Y. | $164 | $145 | $145 | $145 | $145 | ($19) | (11.6%) | (3.0%) | |
| District Attorney – Bronx | $98 | $97 | $97 | $97 | $97 | ($2) | (1.6%) | (0.4%) | |
| District Attorney – Kings | $127 | $127 | $127 | $127 | $127 | ($0) | (0.1%) | (0.0%) | |
| District Attorney –Queens | $84 | $85 | $85 | $85 | $85 | $0 | 0.6% | 0.1% | |
| District Attorney – Richmond | $22 | $21 | $21 | $21 | $21 | ($1) | (4.0%) | (1.0%) | |
| Office of Prosec. & Special Narc. | $26 | $26 | $26 | $26 | $26 | $0 | 0.7% | 0.2% | |
| Public Administrator – N.Y. | $1 | $1 | $1 | $1 | $1 | $0 | 3.4% | 0.8% | |
| Public Administrator – Bronx | $1 | $1 | $1 | $1 | $1 | $0 | 3.0% | 0.7% | |
| Public Administrator – Brooklyn | $1 | $1 | $1 | $1 | $1 | $0 | 3.1% | 0.8% | |
| Public Administrator – Queens | $1 | $1 | $1 | $1 | $1 | $0 | 3.1% | 0.8% | |
| Public Administrator – Richmond | $1 | $1 | $1 | $1 | $1 | ($0) | (4.2%) | (1.1%) | |
| Prior Payable Adjustment | ($400) | $0 | $0 | $0 | $0 | $400 | (100.0%) | (100.0%) | |
| General Reserve | $250 | $1,055 | $1,000 | $1,000 | $1,000 | $750 | 300.0% | 41.4% | |
| Citywide Savings Initiatives | $0 | ($102) | ($104) | ($106) | ($150) | ($150) | NA | NA | |
| Energy Adjustment | $0 | $24 | $44 | $67 | $167 | $167 | NA | NA | |
| Lease Adjustment | $0 | $44 | $88 | $135 | $182 | $182 | NA | NA | |
| OTPS Inflation Adjustment | $0 | $0 | $56 | $111 | $167 | $167 | NA | NA | |
| TOTAL EXPENDITURES | $106,539 | $98,536 | $102,693 | $103,640 | $104,560 | ($1,979) | (1.9%) | (0.5%) | |
Note: Numbers may not add due to rounding.
Endnotes
[1] https://www.kastle.com/safety-wellness/getting-america-back-to-work/
[2] A detailed discussion of property tax revenues follows
[3] The upward revision to property tax revenue in FY 2022, about $200 million reflects higher year to date collections due to lower than estimated delinquencies.
[4] A detailed comparison for each property type can be found in the Comptroller’s report: New York by the Numbers: Monthly Economic and Fiscal Outlook No. 61 – January 10th, 2022
[5] We use the term estimated payments to refer to both quarterly installments and extension payments, and settlements.
[6] The City states that the increase in the State’s top marginal tax rate without any change in the offset formula results in higher upfront payments being made to the City.
[7] The State however has included legislation to make the distressed interceptor permanent in its current budget. See “State Executive Budget” beginning on page 31.
[8] The analysis excludes intra-City revenues. Water and sewer revenues are mostly payments from the New York City Water Board for the operation and maintenance of the water delivery and sewer system, and are not available for general operating purposes.
[9] https://legistar.council.nyc.gov/LegislationDetail.aspx?ID=3343761&GUID=AB4AE61B-4A4D-47CB-BEBF-A5D7E6BEE6E0
[10] The senior care rate is the premium the City pays to supplement shortfalls in Medicare benefits so that Medicare-eligible retirees can maintain a similar level of benefits as active employees.
[11]The projections reflect savings resulting from two agreements in the last several years between the City and the Municipal Labor Coalition (MLC). The FY 2014 Health Savings Agreement resulted in savings of $400 million in FY 2015, $700 million in FY 2016, $1 billion in FY 2017, and $1.3 billion in FY 2018 and beyond. The FY 2018 Health Savings Agreement provides for savings of $200 million in FY 2019, $300 million in FY 2020, and $600 million in FY 2021 and beyond.
[12] The City had credited $730 million of deferral of lump sum, retroactive wage and welfare fund payments to the FY 2021 labor savings.
[13] The DOE has separately reflected an adjustment that reassigns the use of Federal stimulus funds in support of an increase of 1,778 positions in FY 2023 to partly offset the impact on City-funded headcount from enrollment changes, resulting in a net reduction of 1,449 positions.
[14] The Commitment Plan is a schedule of anticipated capital contract registrations. Changes from the FY 2022 Adopted Capital Plan published in October 2021 are from FY 2022 – FY 2025 only. Estimates for FY 2026 were not included at that time.
[15] The annual average commitment, before the reserve for unattained commitments, is $20.0 billion.
[16] This percentage assumes all DOT project types, not just bridges and highways.
[17] Changes described are from FY 2022-2025, as estimates for FY 2026 were not in the November 2021 Plan.
[18] Savings figures are from FY 2022—2025 as FY 2026 was not contained in the November Plan.
[19] Excludes TSASC debt service.
[20] Includes TSASC debt service.