
Introduction
The NYC Personal Income Tax (PIT) and Pass-Through Entity Tax (PTET) brought in $18.5b in FY 2025, or 23.0% of City tax revenues.[1] In FY 2019, before the COVID-19 pandemic, PIT collections amounted to $13.3b or 21.7% of total tax revenues (PTET had not yet been created in FY 2019). In between these years, PIT showed an unusual amount of volatility due to population declines, shifts in filing deadlines, and PTET payments. This fiscal note summarizes the data from tax returns and collections in 7 points. Collectively, the evidence shows a reduction in the number of low-income tax filers and the resilience of high-income NYC residents between 2019 and 2023, the last tax year for which data on tax returns are available. The data also shows that the pandemic and policy-driven volatility have largely dissipated and that collections rose significantly between 2019 and 2025 in nominal and real terms.
The tax returns from 2019 to 2023 show:
- A decline in full-year resident filers in low-income brackets.
- An increase in full-year resident filers in middle- and high-income income brackets, fueled by an increase of single filers.
- An increase in total income and a slightly more progressive distribution of tax liability.
- A spike in capital gains realizations in 2021 followed by a significant drop, partially offset by higher dividends, interest, and business income.
- A temporary increase in part-year filers and net outmigration that abated by 2023.
The tax collections from December 2019 to September 2025 show:
- 2025 tax collections are above 2019 levels in both nominal (39.7%) and real terms (13.1%).
- NY State collections outpaced the City’s after the increase of State tax rates on high-income filers, but they are now following a common trend.
The fiscal note provides an overview of PIT and PTET, followed by the discussion of the 7 points.
Overview
The City has imposed a tax on individual income of residents since 1966.[2] Full- and part-year New York City residents are subject to the tax as well as “statutory” full-year residents, those that maintain a “permanent place of abode” in New York City (owned or rented, directly or indirectly) for more than 10 months[3] and spend more than 183 days in New York City for any part of the day.[4]
The New York City personal income tax is based on the calculation of New York taxable income: adjusted gross income (NYAGI) less the greater of the standard deduction ($8,000 for single filers, $16,050 for married filing jointly, and $11,200 for head of household) or itemized deductions plus a $1,000 per dependent exemption (dependent taxpayers are allowed a $3,100 standard deduction). Between tax years 2013 and 2017, the standard deduction was indexed to inflation. Table 1 shows taxable income brackets and tax rates for tax year 2024, unchanged since tax year 2017.
Table 1. NYC PIT taxable income brackets and tax rates
| Single / Married filing separately | Married filing jointly / Qualifying Surviving Spouse | Head of household | Tax Rate |
| $0-$12k | $0-$21.6k | $0-$14.4k | 3.078% |
| $12k-$25k | $21.6k-$45k | $14.4k-$30k | 3.762% |
| $25k-$50k | $45k-$90k | $30k-$60k | 3.819% |
| $50k+ | $90k+ | $60k+ | 3.876% |
Source: NYS Department of Taxation and Finance
Before tax year 2018, the rate structure was slightly more progressive due to the rate reduction under the NYC School Tax Relief (STAR) program, which was reimbursed by the State to the City. In 2015, the rate cut was eliminated for filers with income above $500,000. The following year, the NYC PIT STAR credit, which was also reimbursed by the State, was replaced by an equivalent State credit. Beginning in tax year 2017 the equivalent of the rate cut is claimed directly on NY State personal income tax returns.
A summary of modifications to federal AGI and City tax credits is available in the NYC Department of Finance’s annual report on tax expenditures. Historical data are available from the NYC’s Office of Management and Budget’s tax revenue forecasting methodology book. The NYC Independent Budget Office publishes data from tax returns going back to tax year 2006. PIT and PTET are administered by the NY State Department of Taxation and Finance (DTF).
Relationship with the federal tax code[5]
The NY State and NYC PIT provisions generally conform with the Internal Revenue Code (so-called “rolling conformity”). In 2020, the State temporarily decoupled from changes to the federal code and fixed conformity to March 1, 2020 for tax years beginning before January 1, 2022. This prevented the flow-through of tax provisions included in COVID-19 aid legislation, including the temporary expansion of Earned Income Tax Credit (EITC) and the exclusion of a portion of unemployment insurance benefits from federal taxation.[6]
In March 2018, State legislation decoupled NYS and NYC PIT from certain provisions of the 2017 Tax Cuts and Jobs Act (TCJA) to avoid unintended increases in State and City taxes.[7] For this reason, the provisions of Public Law 119-21 (the so-called One Big Beautiful Bill Act) that extended TCJA do not flow through to State and City PIT. In general, the 2018 decoupling allows “above-the-line” deductions (those that are subtracted from gross income to derive AGI) to flow through to NYAGI but not the new deductions on tips, overtime, and car loan interest introduced by Public Law 119-21.[8]
Data description
The NYC data used in this fiscal note is provided by the NY State Department of Taxation and Finance (DTF). Tax returns are derived from the “final” Personal Income Tax Population Study file, which contains detailed information on individual tax returns of NYC and NYS PIT filers (the data excludes estates and trusts). More comprehensive information is included in updates to the “final” file that, however, are not available to our Office.[9]
Full-year NYC filers are identified by their tax form self-reporting of 12 months of NYC residence for the primary filer.[10] Part-year NYC filers are identified by those returns reporting 1 to 11 months residence for the primary filer. The self-reported location of residence on the last day of the tax year for part-year state residents (from IT-203) is also used to identify the direction of movement for those coming into or going out of NY State.
Tax collection data are included in monthly summaries provided to the City by DTF. Collections data are reported on a cash basis and are inclusive of administration costs paid by the City to the State and of audit activity conducted by the City and the State. NYS collection data are derived from monthly reports by the Office of the NYS Comptroller.
New tax programs
Two new tax programs went into effect during the period covered by the analysis, both starting in tax year 2022. The first is the NYC PTET, an optional tax on the income of S-corporations and partnerships created to circumvent the cap on the State and Local Tax (SALT) paid that could be deducted from federal adjusted gross income. PTET payments generate a corresponding amount of PIT credits that leave the total PIT and PTET liability unchanged but lowers the federal liability (a succinct explanation is available from the Tax Policy Center). NY State introduced its own PTET starting in tax year 2021.
Due to the timing of enactment and the deadline for businesses to opt into the tax, the availability of PTET generated a temporary spike in City tax payments starting in December 2022, as shown in the analysis of tax collections. The spike was absorbed over the following year, causing a temporary drop in collections that compounded the decline in tax liability between 2021 and 2022. PIT credits for City PTET paid totaled $1.6 billion in tax year 2022 and $1.7 billion in tax year 2023. In the analysis, PIT credits for PTET paid are added back to estimate total NYC individual income liability.
The second tax program is the expansion of the NYC Earned Income Tax Credit (EITC). Up to tax year 2021, the NYC EITC equaled 5% of the federal amount (excluding the changes driven by COVID-19 stimulus measures). After the expansion, the EITC varies between 10% and 30% of the federal amount depending on the tax filer’s income. Total EITC was $345 million in tax year 2022 (+$257 million relative to the pre-2022 amount) and $360 million in tax year 2023 (+$264 million relative to the pre-2022 amount). The NY State EITC credit remains equal to 30% of the federal amount minus the amount of the NYS household credit. As noted above, the temporary increase of the Federal EITC in tax year 2021 did not flow through to the City and the State.
Table 2 shows total EITC and PTET credits from 2019 to 2023.
Table 2. PTET and EITC Amounts by Tax Year ($m)
| Tax Year | EITC | PTET | ||
| Pre-expansion | 2022 Expansion | EITC Total | ||
|---|---|---|---|---|
| 2019 | $91 | n.a. | $91 | n.a. |
| 2020 | $69 | n.a. | $69 | n.a. |
| 2021 | $65 | n.a. | $65 | n.a. |
| 2022 | $89 | $257 | $345 | $1,622 |
| 2023 | $96 | $264 | $360 | $1,662 |
Source: NYS Department of Taxation and Finance, Office of the NYC Comptroller analysis
In terms of their distribution, the two tax programs are almost exact opposites. As shown in Table 3, the vast majority of EITC accrues to filers with AGI up to $50,000 while the vast majority of PTET paid credit goes to filers with incomes of $1 million or more.
Table 3. Share of EITC and PTET paid credit by income in 2023 tax returns
| NYAGI | EITC | PTET paid credit |
| Up to $49,999 | 99.5% | 0.4% |
| $50,000 – $999,999 | 0.5% | 4.9% |
| $1m+ | 0.0% | 94.8% |
Source: NYS Department of Taxation and Finance, Office of the NYC Comptroller analysis
A third tax program called “Axe the Tax” was approved in State legislation in May 2025 (see Part W of the Revenue Article VII Bill for the FY 2026 State budget). The program starts in tax year 2025 and provides a full non-refundable credit against the City’s PIT liability (net of other credits) to filers with dependents and federal AGI up to 150% of the 2023 poverty thresholds. A partial credit is available to filers with income exceeding 150% of the poverty threshold by up to $5,000. Starting in tax year 2026, the income thresholds will be indexed to the Consumer Price Index. The Mayor’s Office of Management and Budget estimates the tax program will reduce the City’s PIT liability by approximately $60 million annually. Estimates by the NYC Independent Budget Office and by this Office indicate that the program could be meaningfully smaller.
The choice of base tax year
The analysis of tax returns in this fiscal note is based on the comparison of returns for tax year 2019 (filed in 2020) and 2023 (filed in 2024). The number of returns of low-income filers in 2019 may have been elevated by the eligibility requirement for the first round of economic impact payments (also known as “stimulus checks”) included in the Coronavirus Aid, Relief, and Economic Security (CARES) act of 2020. Section 6428 “2020 recovery rebates for individuals” specified that the full credit amount was available to filers with AGI up to $75,000, $112,500, or $150,000 for singles, heads of household, or married filing jointly, respectively. The rebates could be advanced based on tax year 2019 income (filed in 2020), tax year 2018 income (filed in 2019), or alternative Social Security benefit statements. Our data shows a decline in the number of full-year low-income filers between tax year 2018 and 2019, alleviating concerns that the analysis overstates their drop between 2019 and 2023.[11]
Previous research from the Office of the NYC Comptroller
The Office of the Comptroller has written copiously on PIT and PTET. Data on tax returns were published in April 2023, September 2023, April 2024, September 2024, and May 2025. The trend analysis based on the 12-month rolling sum of NYC and NYS collections was published in June 2023, November 2023, May 2024, December 2024, and the 2024 State of the City’s Economy and Finances. Starting in 2024, the Office added tracking estimates of the December-March bonus season to the monthly Economic and Fiscal Outlook newsletter (the estimates are published monthly from January through April). The Office published analyses of the annual Census population estimates in May 2023, April 2024, and April 2025. Migration trends were analyzed in the 2023 and 2024 editions of the State of the City’s Economy and Finances. In 2023, the Office published an analysis of options to raise tax revenues, which included additional PIT and migration data. The impact of federal pandemic aid to residents and businesses was discussed in the January 2023 Spotlight. Data on aggregate personal income were published in December 2023 and December 2024.
Five Takeaways from PIT Tax Returns
Between 2019 and 2023, PIT tax returns were affected by population losses, federal support programs during the pandemic, and wide fluctuations in non-wage income. These factors can make the interpretation of yearly data challenging. For instance, the number of returns filed by full-year NYC residents increased by 3.1% between 2019 and 2020 but the total number of people associated with those returns dropped by 1.4% all the while total income grew by 2.8%. In 2021, the number of returns dropped by 4.2%, population losses deepened to 3.3%, but total income grew by 16.8%. In 2022, lower capital gains realizations and the end of pandemic income support programs drove a drop in filers and income.
To avoid some of the short-term volatility, the analysis in this section first focuses on changes in the population of full-year NYC resident filers in 2019 and 2023. The analysis is complemented by a discussion of yearly changes in aggregate income and part-year filers.
1. A decline of full-year residents in low-income brackets
Our tax return data provides a summary of aggregate population changes, even though it does not allow us to follow filers over time and geography. As is well known, net outmigration from NY State and NYC spiked during the pandemic across income categories. This was shown by analyses published by the Office of the NYS Comptroller, NYS DTF, the Citizens Budget Commission, the Fiscal Policy Institute (in two parts, and most recently using 2023 NY State tax returns), and the Empire Center for Public Policy.
The population loss experienced during the pandemic is evident in Table 4, which compares individual returns from 2019 and 2023 for full-year NYC residents. The table also shows the number of people associated with the returns: the sum of the number of filers and their dependents (the income of dependent tax filers is, however, excluded).[12] Statutory filers are not separately identifiable in our data, and they may be reported as full-year residents in the data. Incomes are not adjusted for inflation.
The table shows two main takeaways:
- The total number of full-year resident filers dropped by around 83,000 while the sum of filers and their dependents dropped by nearly 347,000. This means that the reduction in filers was concentrated among married couples and families with children. The drop in the number of children is also shown in the annual Census estimates.
- Virtually all the net decline in filers and population is concentrated among returns with incomes between $0 and $50,000. In this income category, returns and population dropped by approximately 277,500 and 524,200, respectively. The change is attributable, among other factors, to job losses, outmigration, and income (particularly wage) growth pushing filers into higher income categories. The role of these factors is, however, difficult to disentangle. For instance, while overall employment and population dropped, real hourly wages for the bottom quintile of the wage distribution grew by 6% between 2019 and 2023.[13]
Table 4. Full-year resident filers and population
| NYAGI | Filers | Population | ||||
| 2019 | 2023 | Difference | 2019 | 2023 | Difference | |
|---|---|---|---|---|---|---|
| Under $0 | 50,523 | 52,236 | 1,713 | 74,681 | 78,956 | 4,275 |
| $0-$49,999 | 2,354,340 | 2,076,871 | -277,469 | 4,014,292 | 3,490,116 | -524,176 |
| $50,000 – $99,999 | 883,528 | 915,547 | 32,019 | 1,538,885 | 1,518,799 | -20,086 |
| $100,000 – $199,999 | 448,952 | 533,228 | 84,276 | 897,084 | 963,180 | 66,096 |
| $200,000 – $499,999 | 184,756 | 245,457 | 60,701 | 419,757 | 512,773 | 93,016 |
| $500,000 – $999,999 | 42,571 | 54,386 | 11,815 | 109,029 | 132,467 | 23,438 |
| $1m+ | 30,440 | 34,306 | 3,866 | 85,813 | 96,381 | 10,568 |
| $1m – $5m | 26,020 | 29,557 | 3,537 | 72,620 | 82,006 | 9,386 |
| $5m – $10m | 2,656 | 2,813 | 157 | 7,929 | 8,498 | 569 |
| $10m+ | 1,764 | 1,936 | 172 | 5,264 | 5,877 | 613 |
| Total | 3,995,110 | 3,912,031 | -83,079 | 7,139,541 | 6,792,672 | -346,869 |
Source: NYS Department of Taxation and Finance, Office of the NYC Comptroller analysis. Data includes full-year residents. Data excludes part-year residents and dependent filers
2. An increase in full-year resident filers in middle- and high-income income brackets, fueled by an increase of single filers
Table 5 shows the 2019-2023 change in the number of singles, married filing jointly, and head of household filers. The three categories represent around 97% of all individual returns and, therefore, drive most of the trends. As noted in the previous subsection, the changes are the result of population and income changes that cannot be easily separated. There are two main takeaways:
- Returns in all income categories starting at $100,000 grew robustly, with the exception of married filing jointly. While not shown in the table, the drop in married filing jointly with NYAGI between $0 and $199,999 was partially offset by a roughly 11,000 increase of married filing separately.[14] The number of filers with NYAGI of $1 million or more grew across all categories showing that income growth outweighed the impact of higher outmigration.
- Single filers grew between 2019 and 2023, confirming data from Census Bureau surveys that indicate a growth in the number of singles in NYC. The fastest growth took place among filers with NYAGI between $100,000 and $1 million.
Table 5. Change in full-year filers by category 2019-2023
| NYAGI | Single | Married Filing Jointly | Head of Household | |||
| Change | % Change | Change | % Change | Change | % Change | |
|---|---|---|---|---|---|---|
| Under $0 | 184 | 1% | 665 | 5% | 696 | 20% |
| $0-$49,999 | -142,594 | -10% | -64,936 | -15% | -71,938 | -14% |
| $50,000 – $99,999 | 40,495 | 9% | -31,026 | -16% | 19,288 | 10% |
| $100,000 – $199,999 | 72,619 | 37% | -15,118 | -8% | 20,514 | 41% |
| $200,000 – $499,999 | 38,536 | 64% | 14,472 | 13% | 4,123 | 58% |
| $500,000 – $999,999 | 4,395 | 47% | 6,495 | 21% | 382 | 28% |
| $1m+ | 882 | 17% | 2,737 | 12% | 139 | 17% |
| $1m – $5m | 874 | 19% | 2,431 | 12% | 119 | 16% |
| $5m – $10m | n.a. | 1% | 170 | 8% | n.a. | 5% |
| $10m+ | n.a | 2% | 136 | 10% | 17 | 47% |
| Total | 14,517 | 1% | -86,711 | -9% | -26,796 | -4% |
Source: NYS Department of Taxation and Finance, Office of the NYC Comptroller analysis. Data includes full-year residents. Data excludes part-year residents and dependent filers. Cells with less than 11 records are reported as “n.a.” due to disclosure restrictions
3. An increase in total income and a slightly more progressive distribution of tax liability
Table 6 shows total NYAGI and liability (inclusive of PTET paid credit) in the 2023 returns and their percentage change between 2019 and 2023. The table also shows effective tax rates in 2023. There are two takeaways:
- Total NYAGI grew in the aggregate and in all income categories except for filers between $0 and $50,000, due to the drop in the number of tax returns in that income category. Total AGI of full-year NYC residents grew 13.5% whereas the Consumer Price Index in the NYC metro area rose 15.8% CPI over the same period.
- Total tax liability grew 14.1%, roughly in line with the growth in AGI due to the relatively flat rate structure of the City’s PIT. However, the tax liability among filers with income between $0 and $50,000 dropped far more steeply than their total AGI: 45.3% versus 14.0%. This was due to the expansion of EITC discussed in the overview section. The effective tax rate for this income category dropped from 1.7% in 2019 to 1.1% in 2023. The effective tax rate in for the rest of the full-year residents remained essentially unchanged.
Table 6. Full-year residents’ NYAGI, tax liability and effective tax rate
| NYAGI | Total AGI ($b) | Liability (incl. PTET) ($b) | Effective Tax Rate | ||
|---|---|---|---|---|---|
| 2023 | % Change from 2019 | 2023 | % Change from 2019 | 2023 | |
| Under $0 | -$3.9 | 0.9% | $0.0 | n.a. | n.a. |
| $0-$49,999 | $43.8 | -14.0% | $0.5 | -45.4% | 1.1% |
| $50,000 – $99,999 | $65.1 | 4.9% | $2.0 | 6.3% | 3.0% |
| $100,000 – $199,999 | $73.4 | 20.0% | $2.4 | 21.9% | 3.3% |
| $200,000 – $499,999 | $72.5 | 32.4% | $2.6 | 33.6% | 3.5% |
| $500,000 – $999,999 | $37.0 | 27.1% | $1.4 | 27.9% | 3.7% |
| $1m+ | $143.4 | 13.9% | $5.3 | 13.7% | 3.7% |
| $1m – $5m | $56.6 | 12.1% | $2.1 | 12.7% | 3.7% |
| $5m – $10m | $19.4 | 6.0% | $0.7 | 5.8% | 3.7% |
| $10m+ | $67.4 | 18.0% | $2.5 | 17.1% | 3.7% |
| Total | $431.3 | 13.5% | $14.1 | 14.1% | 3.3% |
Source: NYS Department of Taxation and Finance, Office of the NYC Comptroller analysis. Data includes full-year residents. Data excludes part-year residents and dependent filers
Table A1 in the appendix shows that between 2019 and 2023 gains in the share of NYAGI and tax liability were more pronounced among filers with income between $100,000 and $1 million. Those with income between $0 and $100,000 saw their share of total NYAGI and tax liability decline (the latter in part driven by the expansion of EITC). The share of NYAGI and tax liability for those with incomes of $1 million or more (0.9% of all full-year resident filers) changed little and was 33.3% and 37.6%, respectively, in 2023. For those with incomes of $10 million or more (0.04% of all full-year resident filers), the 2023 share of NYAGI and tax liability was 15.6% and 17.7%, respectively.
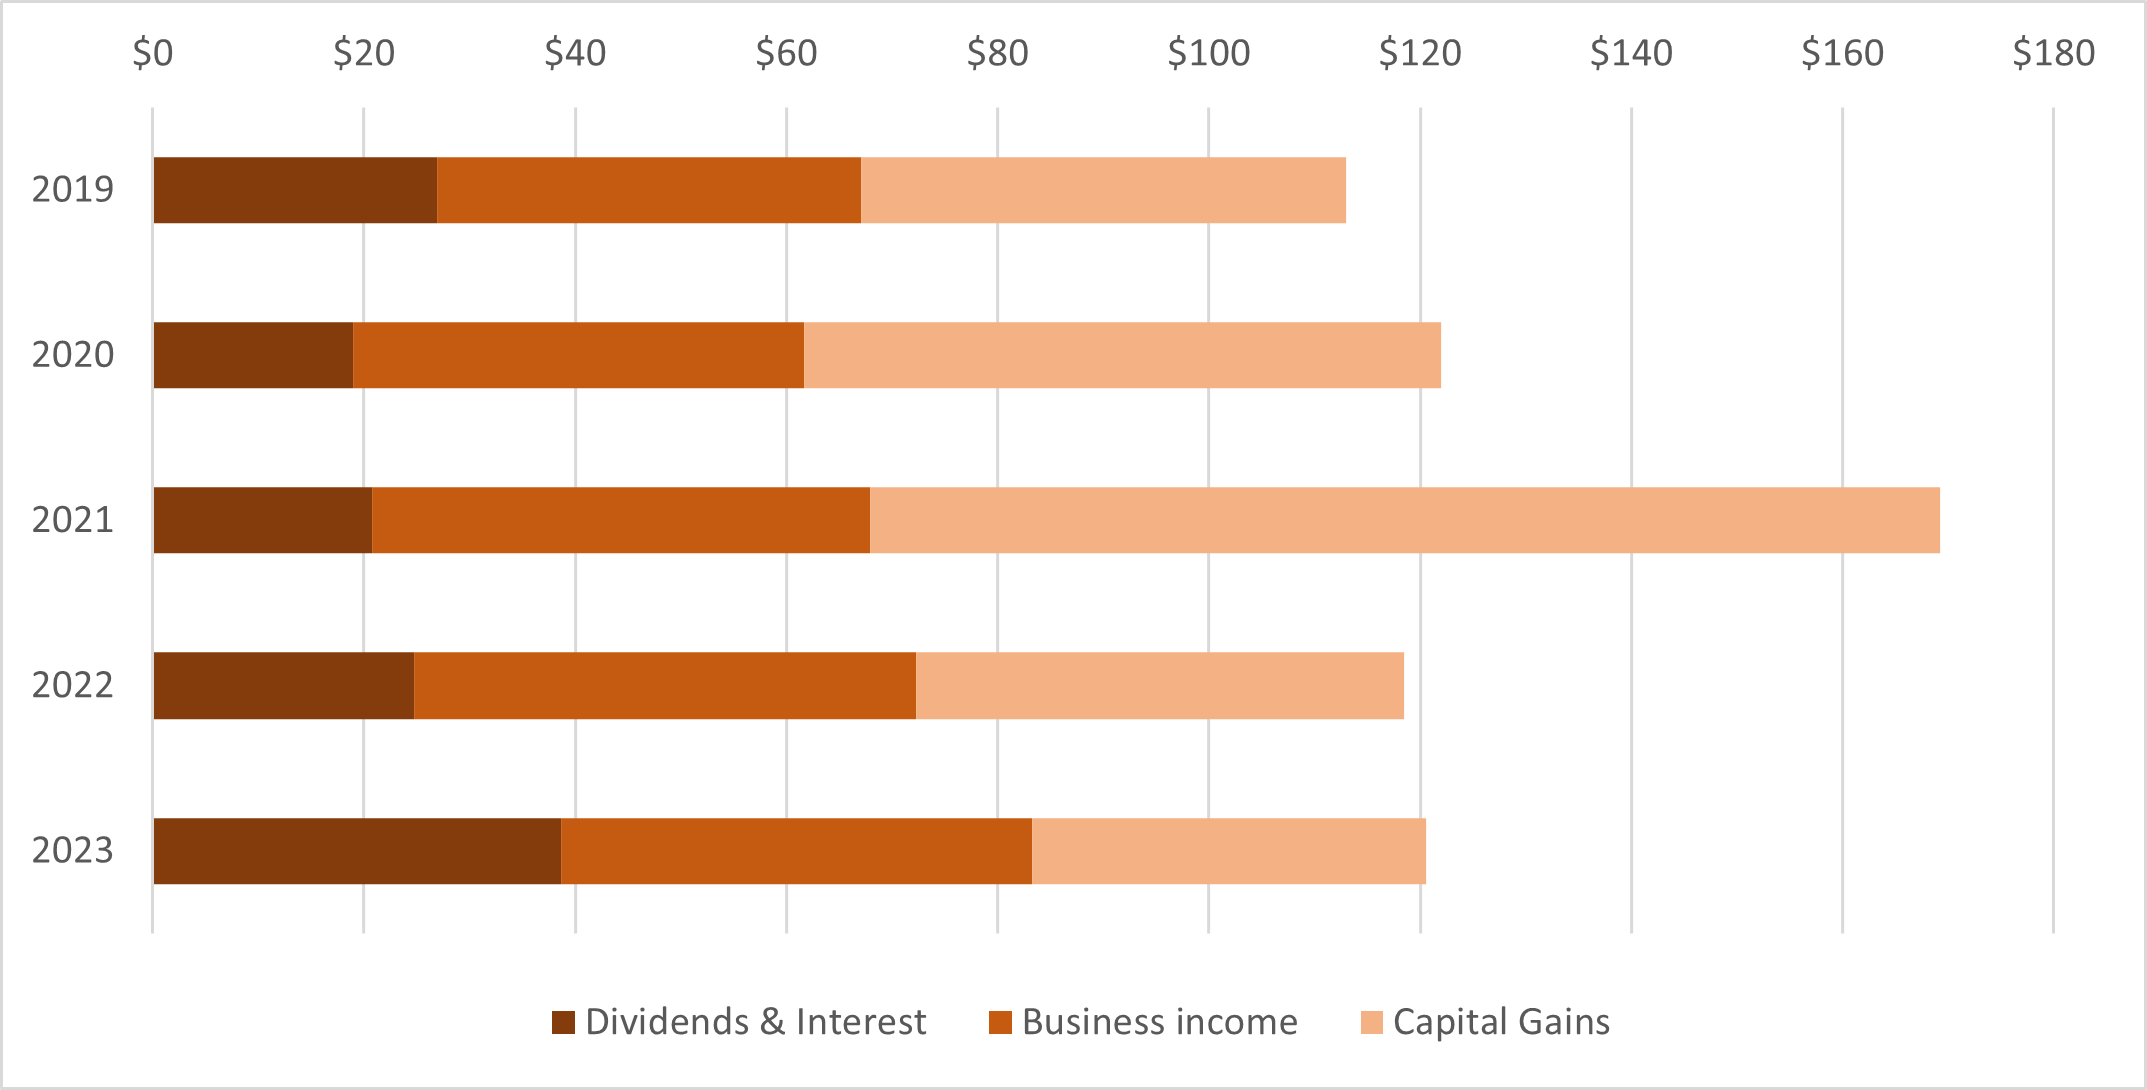
4. A spike in capital gains in 2021, followed by higher dividends, interest, and business income
Full-year NYC filers derive the bulk of their income from wages, which in 2023 represented 69% of total AGI. However, in relative terms, high-income filers derive less of their income from wages: in 2023, full-year resident filers with $1 million or more in AGI represented one third of total AGI and “only” 16% of total wages. On the other hand, these filers represented more than two thirds of all dividends, interest, and business income and nearly 83% of all capital gain realizations.
Because these income sources are less stable than wages and because they are so heavily concentrated, income at the top of the distribution is both large and volatile. This implies that net outmigration is typically a secondary factor in explaining changes at the top of the income distribution.
To illustrate the volatility, chart 1 reports income from dividend and interest, businesses, and capital gain realizations from 2019 to 2023. There are two takeaways:
- Income in these categories started at $113 billion in 2019, peaked at $169 billion in 2021, and settled at $121 billion in 2023. The 2021 peak was driven by capital gains realizations, which went from $46 billion in 2019 to $101 billion in 2021, only to drop to $37 billion by 2023. This is pattern is broadly consistent with capital gains realizations in the US.
- The other components of non-wage income provided a buffer against the decline in capital gains realizations. Dividends and interest income dropped 29.5% between 2019 and 2020 as corporations and monetary policy reacted to the COVID-19 pandemic but soared afterward as profitability recovered and the Federal Reserve raised interest rates. In 2023, dividends and interest income stood 43.9% above 2019 levels. Business income (sole-proprietorships, pass-through entities, and other gains and losses) grew 10.9% between 2019 and 2023.
Principally due to the spike in capital gains realizations, the number of returns with NYAGI of $1 million or more also peaked in 2021 despite large outmigration flows (see NY State statistics and the data in takeaway 5 below) in 2020 and 2021. In 2022 and 2023 the NYAGI of this group of filers declined by 25.6% and 2.0%, respectively. Nonetheless, their number in 2023 was 12.7% higher than in 2019 and their NYAGI was 13.9% higher. Total City taxable income among this category of filers was $123.4 billion in 2019 (36.7% of the total), $192.7 billion in 2021 (46.6% of the total), and $140.5 billion in 2023 (36.2% of the total).
Chart 1. Full-year residents’ major non-wage income components ($b)
Source: NYS Department of Taxation and Finance, Office of the NYC Comptroller analysis. Data includes full-year residents. Data excludes part-year residents and dependent filers
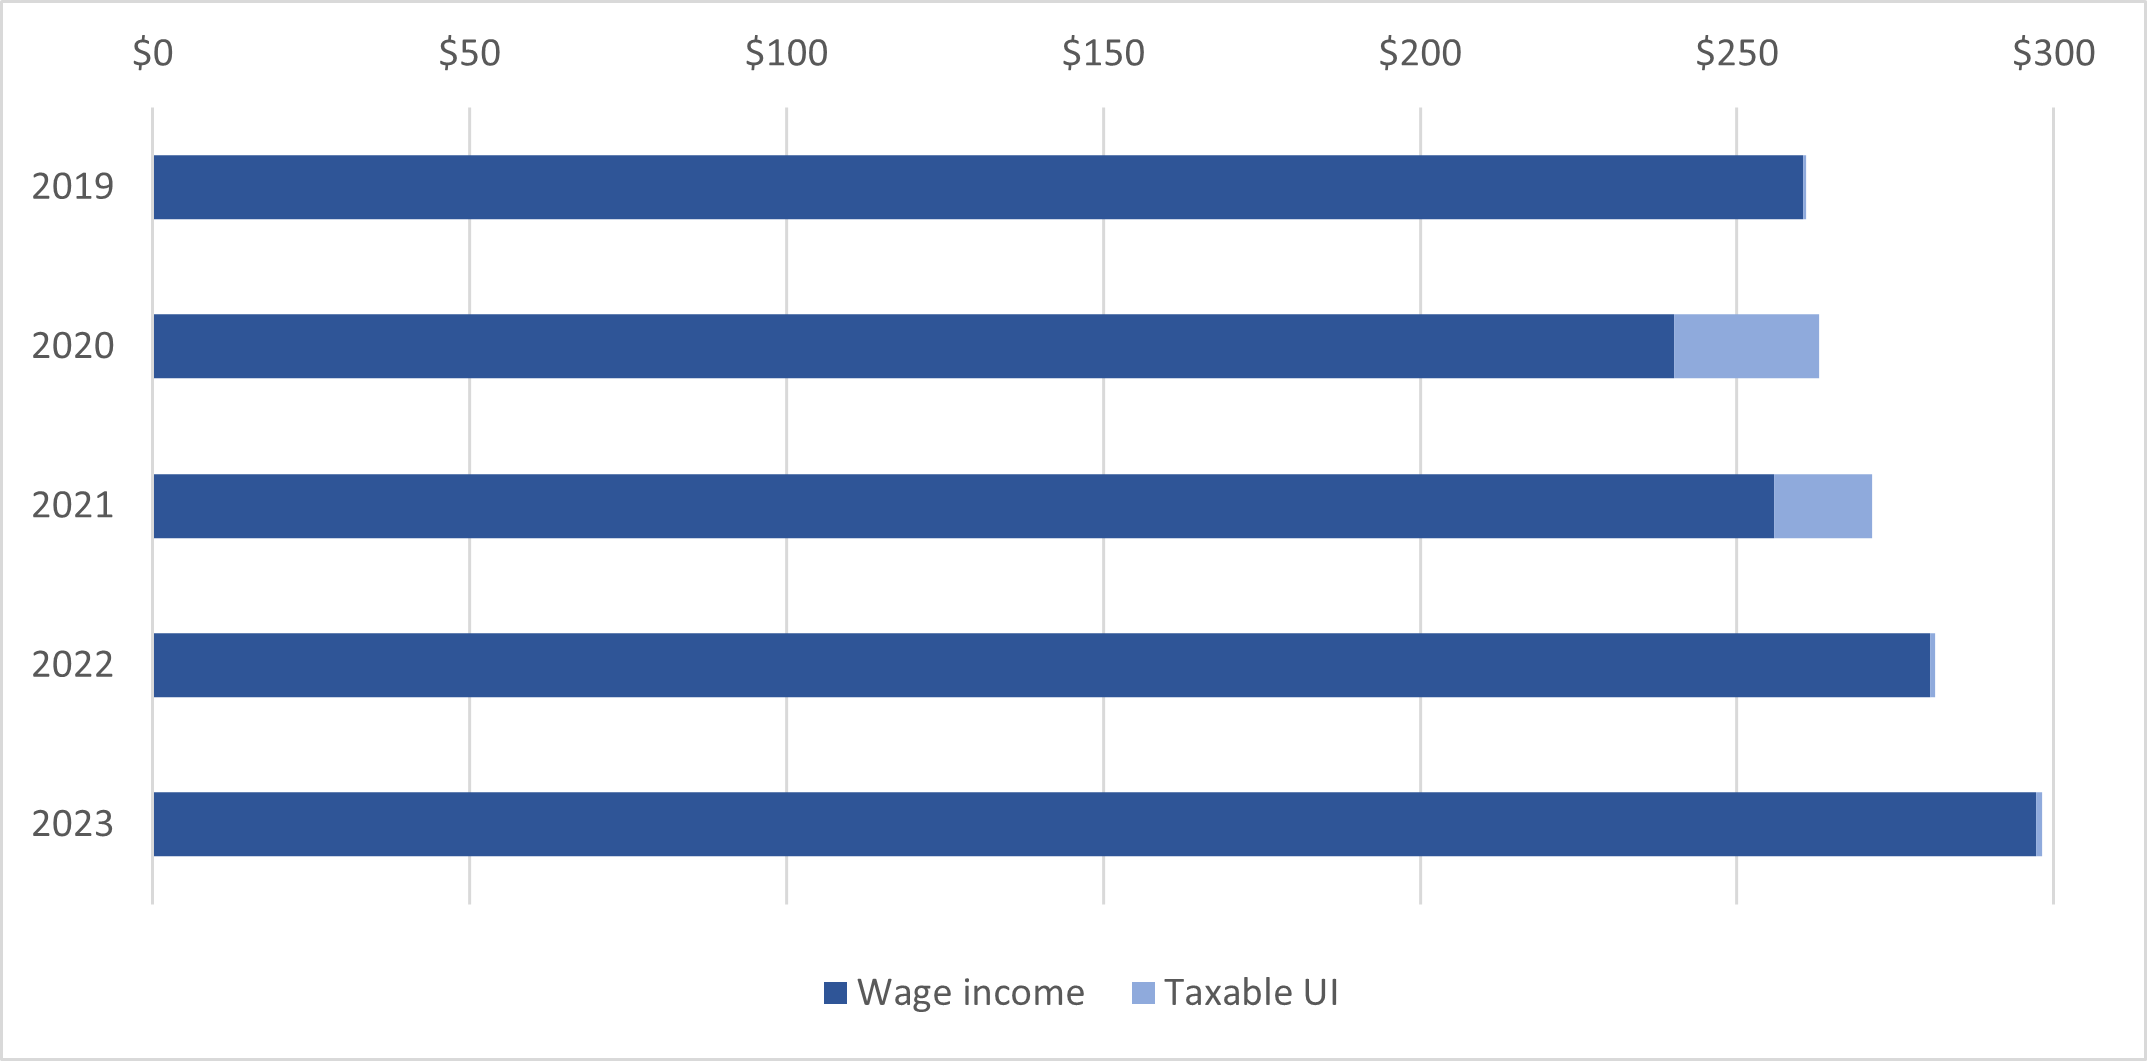
As previously remarked, wage income is larger and more stable. Chart 2 reports wage and unemployment insurance income for full-year residents to account for federal income support programs in 2020 and 2021. The chart shows that unemployment insurance replaced lost wage income in 2020 and 2021 and that wage income grew steadily, reaching nearly $300 billion in 2023. This was a 14.1% increase over 2019 levels, in the midst of a still-incomplete labor market recovery.
Chart 2. Full-year residents’ aggregate wage and unemployment benefits ($b)
Source: NYS Department of Taxation and Finance, Office of the NYC Comptroller analysis. Data includes full-year residents. Data excludes part-year residents and dependent filers
5. A temporary increase in part-year filers that abated by 2023.
As explained in the data description, the tax return information contains a variable reporting the “number of months spent in NYC” which we use to identify full- and part-year NYC filers.[15] Only returns with 1 to 11 months are included in the part-year calculations.
Table 7 shows the share of part-year NYC filers and their share of NYAGI separately for all part-year residents (including those with zero liability) and for those with federal AGI of $1 million or more. We chose federal AGI (rather than just the NYAGI portion) because it is closer to the income-generating potential of a full-year resident. The data broadly captures the spike in migration in 2020 and 2021 and its gradual return to levels similar to those seen in 2019.
Table 7. Shares of part-year filers
| Tax year | Part-year filers share of returns | Part-year filers Federal AGI as share of all filers NYAGI | ||
| All returns | Federal AGI $1m+ | All returns | Federal AGI $1m+ | |
|---|---|---|---|---|
| 2017 | 4.8% | 5.0% | 5.5% | 3.1% |
| 2018 | 4.8% | 5.2% | 5.9% | 3.9% |
| 2019 | 4.8% | 5.0% | 5.7% | 3.6% |
| 2020 | 5.6% | 14.0% | 11.2% | 13.1% |
| 2021 | 5.8% | 9.3% | 8.9% | 8.3% |
| 2022 | 5.2% | 6.4% | 6.7% | 4.1% |
| 2023 | 4.5% | 5.3% | 5.7% | 3.8% |
Source: NYS Department of Taxation and Finance, Office of the NYC Comptroller analysis. Data includes full- and part-year residents identified based on the “number of months” in NYC. Data excludes dependent filers
In addition, it is possible to identify those that filed part-year NY State returns (Form IT-203) and their residence as of the last day of the year. We use this information to identify those that left NY State (part-year State return, residing outside the State as of the last day of the year) and those that moved to NY State (part-year State return, residing in the State as of the last day of the year). These data are only a partial total of the flow of taxpayers into and out of NYC. Those moving between NYC and elsewhere in NY State are not included because we are not able to identify the direction of movement of filers who remain full-year State residents.
To estimate the balance of income associated with net outmigration among part-year State filers, we again use federal AGI (which includes taxpayer income while residing out-of-state) rather than NYAGI. The balance of income is defined as the difference of federal AGI for incoming filers minus the federal AGI of outgoing filers. The data broadly confirm that the 2020 and 2021 spike in net outmigration had subsided by 2023, both among the overall population of filers and among those with $1 million or more in NYAGI. Table 8 summarizes the data. The results are broadly consistent with the NYS data published by NYS DTF and with the recent analysis of statewide returns from the Fiscal Policy Institute.[16]
Table 8. Net NYC outmigration for part-year State residents
| Tax year | Returns | Federal AGI balance ($b) | Federal AGI balance as % of total NY AGI | |||
| All | Federal AGI $1m+ | All | Federal AGI $1m+ | All | Federal AGI $1m+ | |
|---|---|---|---|---|---|---|
| 2017 | -7,227 | -321 | -$3.4 | -$1.3 | -0.9% | -0.9% |
| 2018 | -6,680 | -369 | -$3.4 | -$1.3 | -0.9% | -1.0% |
| 2019 | -5,120 | -358 | -$3.2 | -$1.1 | -0.8% | -0.9% |
| 2020 | -85,572 | -2,116 | -$22.1 | -$10.2 | -5.6% | -6.7% |
| 2021 | -4,327 | -957 | -$9.4 | -$7.1 | -2.1% | -3.5% |
| 2022 | 662 | -534 | -$3.0 | -$1.5 | -0.7% | -1.0% |
| 2023 | 435 | -328 | -$2.1 | -$0.6 | -0.5% | -0.4% |
Source: NYS Department of Taxation and Finance, Office of the NYC Comptroller analysis. Data includes full- and part-year residents identified based on the “number of months” in NYC. Data excludes dependent filers. Total NY AGI is the aggregate of full-year residents and part-year NYC residents that are also part-year NYS residents
Two Takeaways from Tax Collections
Tax collections provide timelier information on the income of NYC residents. However, the data is less detailed than that available from tax returns: they cannot be broken down by full- and part-year residency, income bands, or detailed income source. Furthermore, collections are affected by filing behavior and tax policy changes, as will be discussed below.
To reduce short-term volatility, all the charts in this section are based on the 12-month rolling sum of tax collections indexed to the 12-month period ending in December 2019 (this methodology was first used by Justin Fox in an opinion piece). NYC collections include audits and are gross of NYS fees for the administration of PIT and PTET.
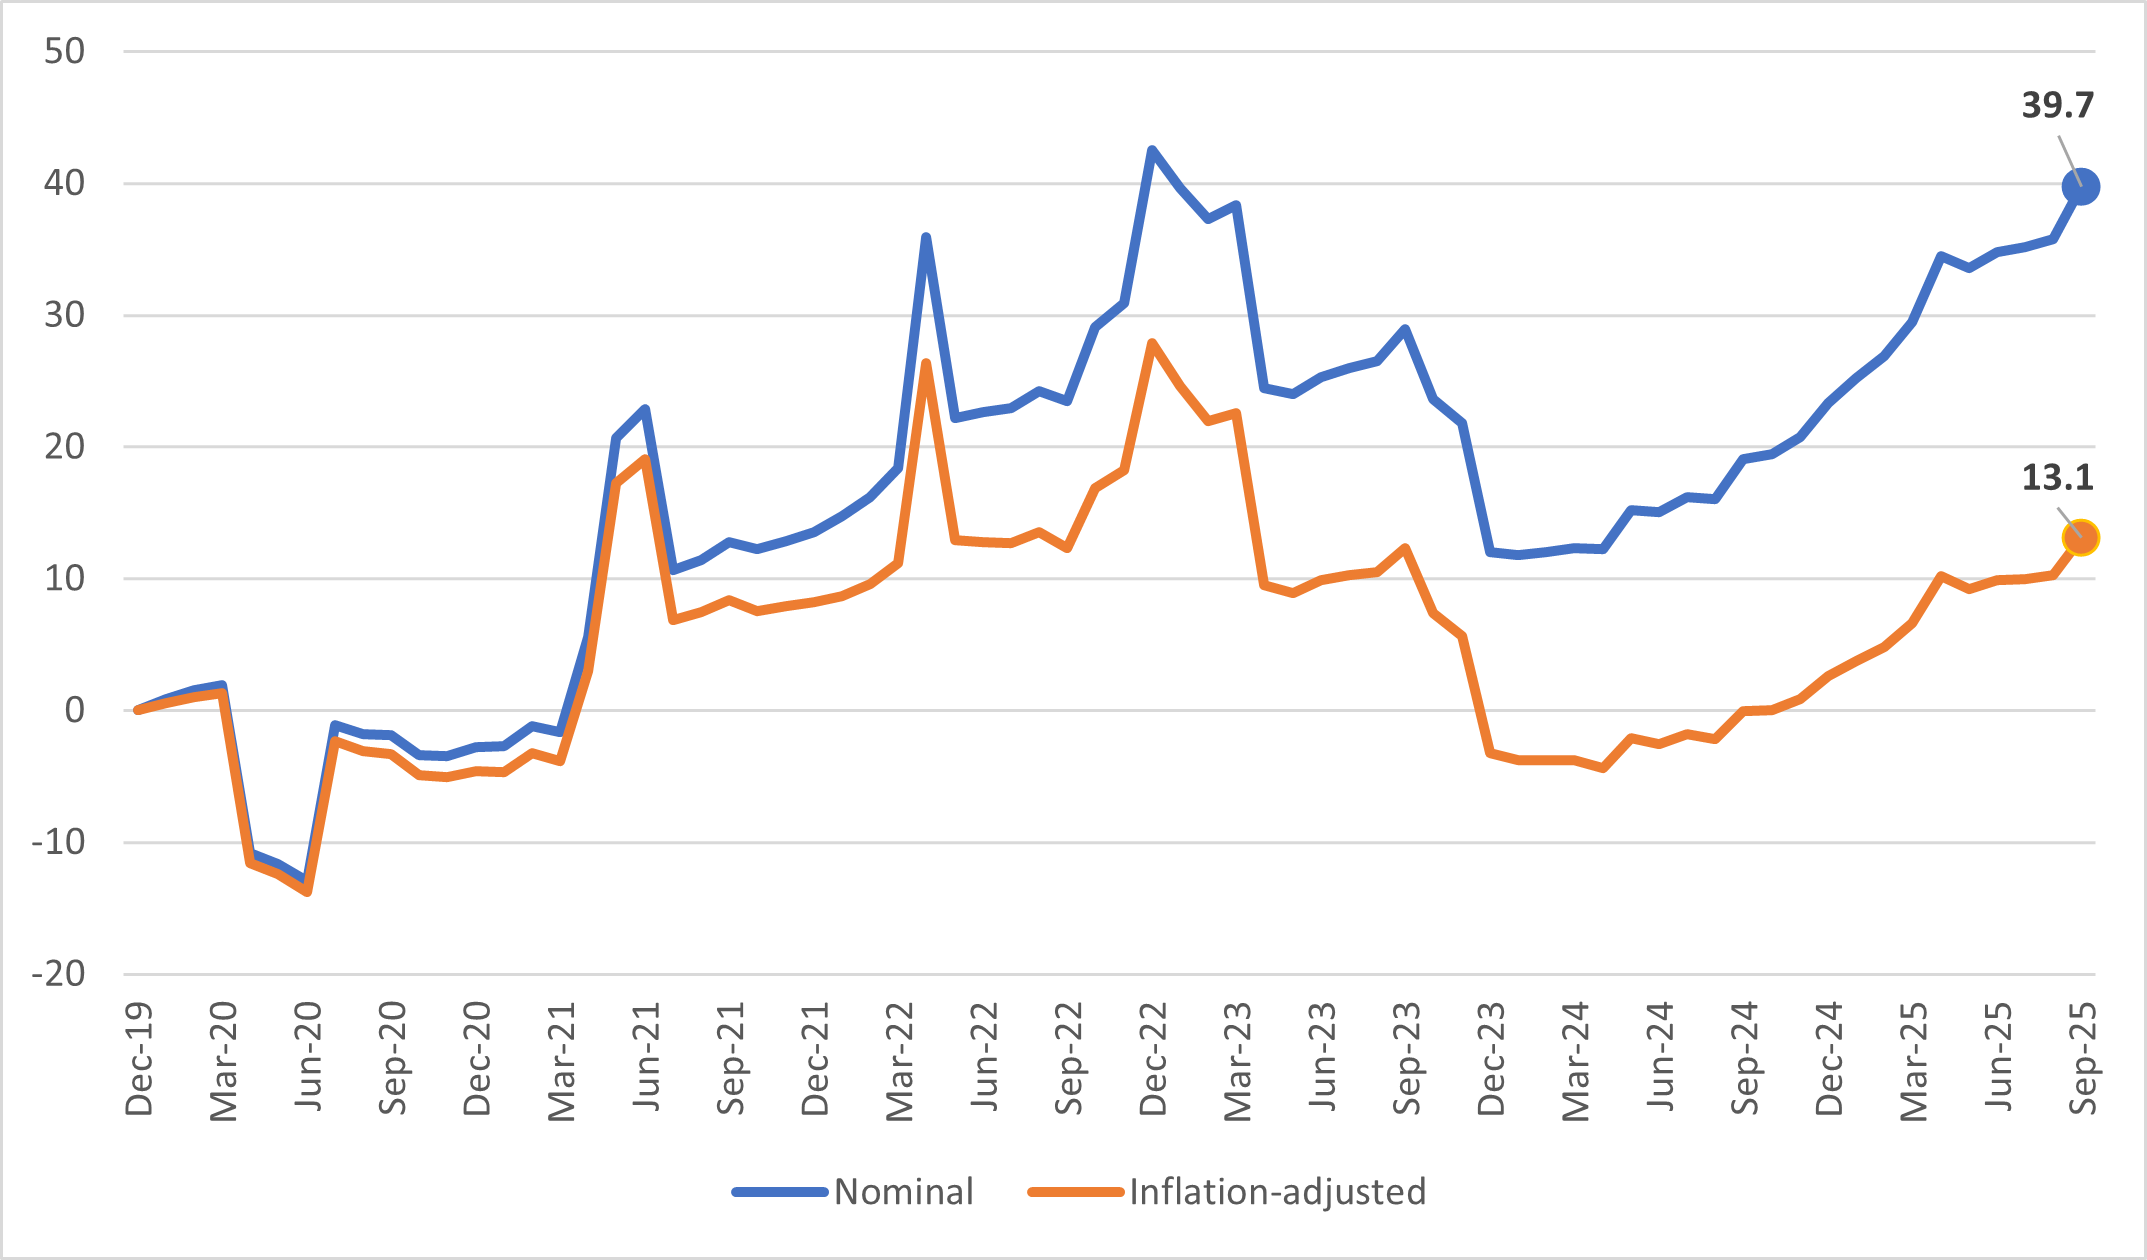
6. 2025 tax collections are above 2019 levels in both nominal and real terms.
The tax returns data showed that total AGI of full-year residents did not keep pace with inflation between 2019 and 2023. Chart 3 shows 12-month PIT and PTET collections relative to the 12-month collections as of December 2019 (the “PIT+PTET Index”). The chart shows drops and spikes in the Spring of 2020, May 2021, and April 2022 which were due to the change in the filing dates during the pandemic.[17] Collections spiked in December 2022 with the first PTET payment, which covered the entire tax year 2022 and was additional to PIT payments on the same income for that year. The double payment was partially absorbed in April of 2023 and in October-December 2023 when NY State also reversed some collections that had been previously incorrectly allocated to the City. The pullback made the index drop below zero in real terms toward the end of 2023.
After these distortions dissipated, PIT and PTET started growing at a steadier pace, ending in September of 2025 39.7% higher than in December 2019 in nominal terms, and 13.1% in real terms. Note that 2024 and 2025 data are inclusive of the EITC expansion, which as previously shown, lowered collections by approximately $260 million. The spike observed in September 2025 was due to a large reallocation of PTET revenues from the State to the City.
Chart 3. NYC PIT+PTET Index: Nominal and Inflation-Adjusted
Source: NYS Department of Taxation and Finance, Bureau of Labor Statistics, Office of the NYC Comptroller analysis
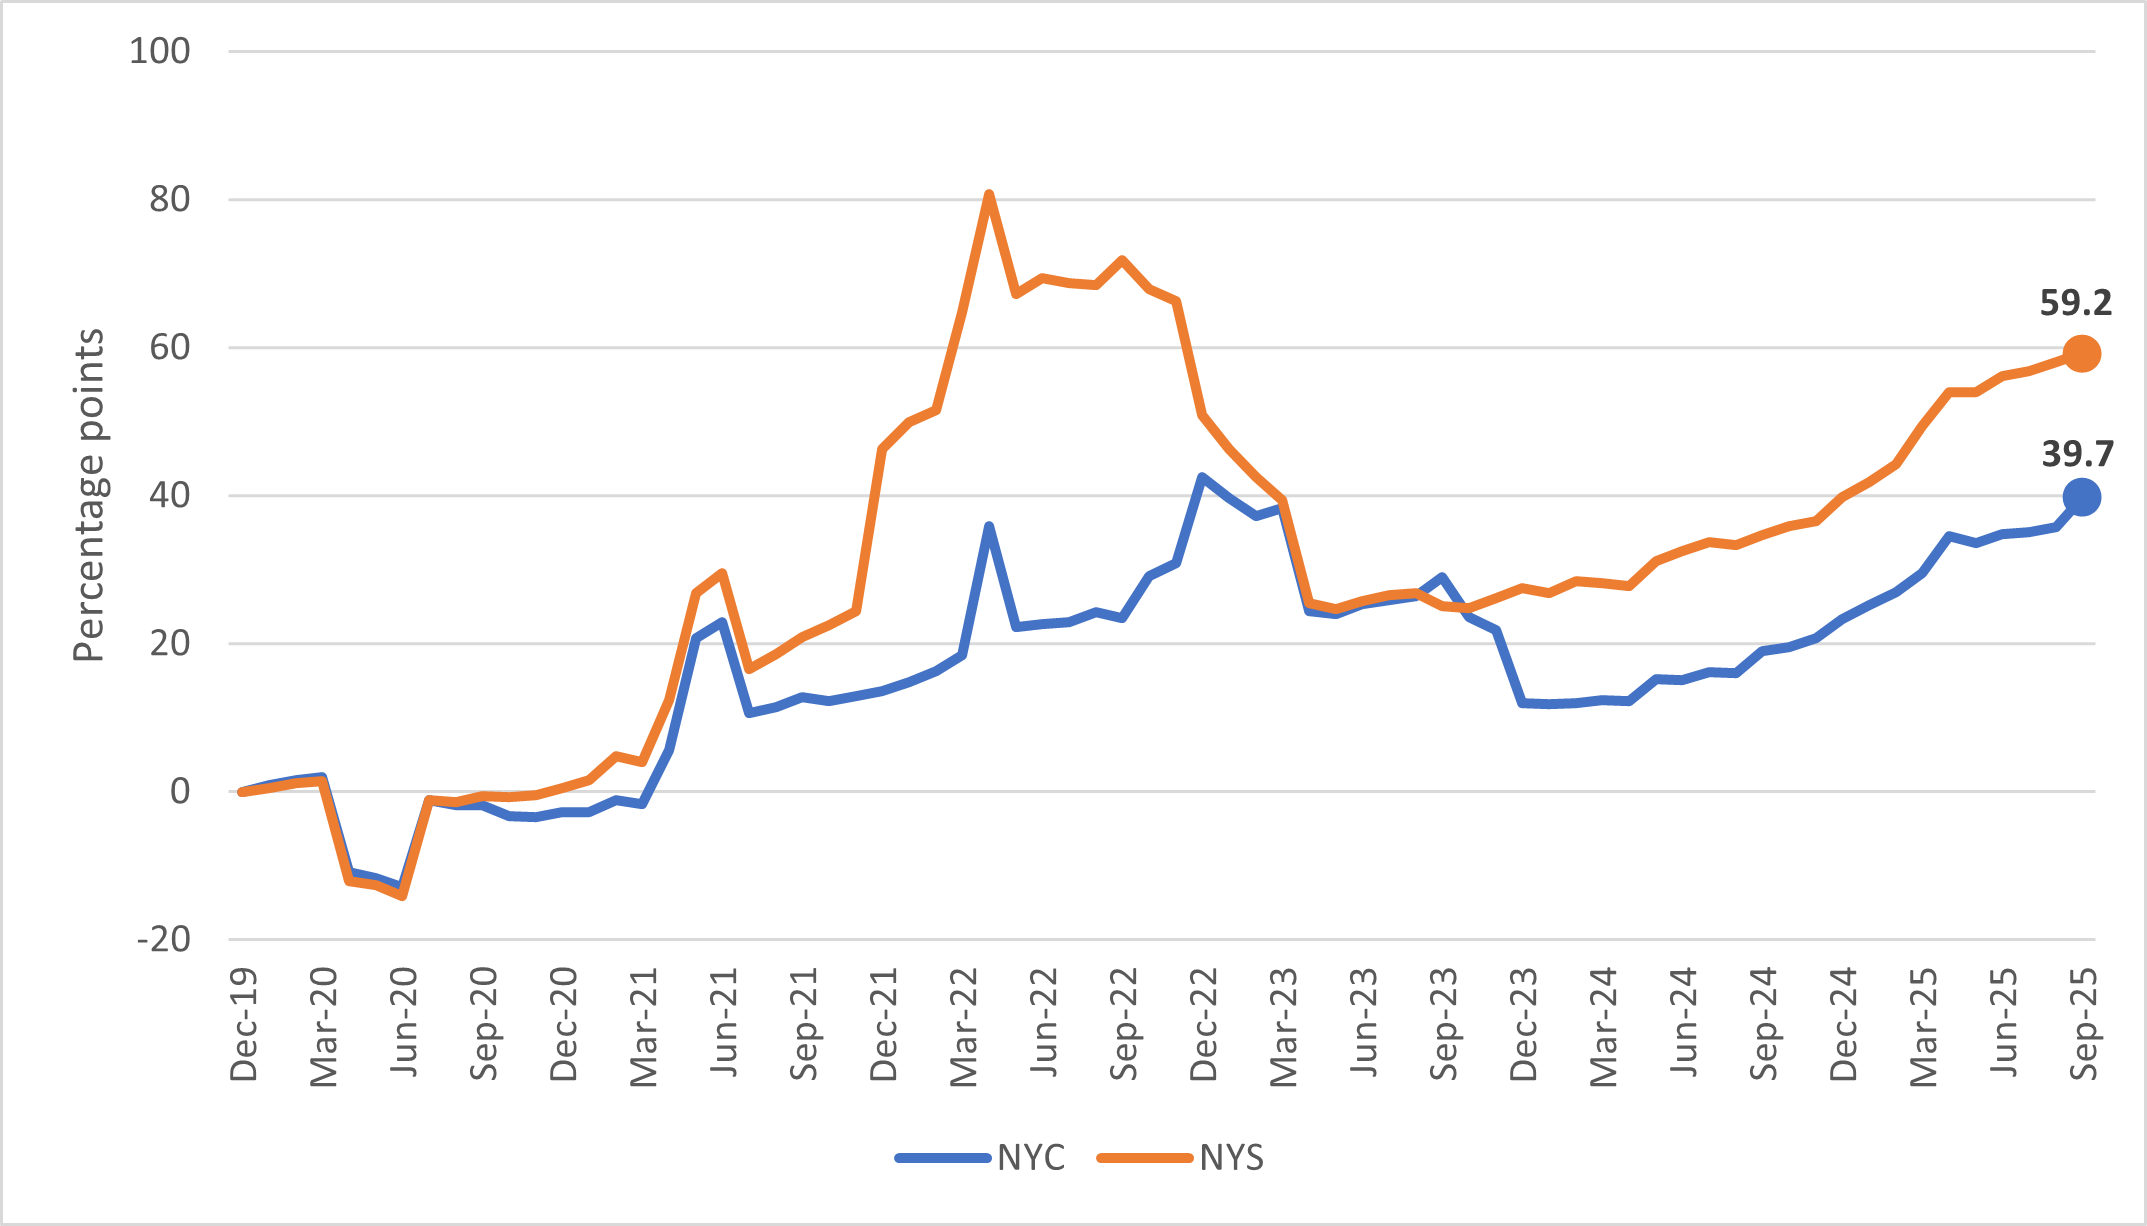
7. NY State collections outpaced the City’s after the increase of State tax rates on high-income filers, but they are now following a common trend.
Chart 4 shows the City’s and NY State’s PIT+PTET index. The two indexes do not stray too far from each other until the second half of 2021, when the higher State tax rates enacted as part of the FY 2022 budget started being implemented in new withholding tables.[18] The FY 2022 budget legislation also created a NY State PTET starting in tax year 2021, leading to a double-payment of PIT and PTET in December 2021, similar to what happened to City revenues one year later. The double-payment was absorbed over the following months. The drop in the NY State index was also in part driven by tax reductions elsewhere in the PIT rate schedule and by the temporary over-payment of PIT revenues to the City in 2022.
Once the PTETs timing distortions dissipated, the City and State indexes started growing in parallel, with State collections ending September 2025 59.2% higher than in December 2019 (+19.5 percentage points relative to the City’s, slightly higher than the average difference of 18.6 percentage points in the previous 12 months).
It seems clear from Chart 4 that the wedge between the NY State and NY City indexes is driven by the higher NY State tax rates. The implication for the elasticity of taxable income to marginal tax rates is however less straightforward because of the contemporaneous creation of the State and City PTETs. In 2021, the deductibility from federal tax of NY State PIT on pass-through income went from zero (at the margin, for high-income filers) to unlimited. This dampened the potential behavioral impact of the higher tax rates. The federal tax benefit increased further for City taxpayers the following year with the enactment of the City’s PTET. For full-year City residents, the federal tax decrease due to PTETs was approximately $2.1 billion in 2021 (NY State PTET only), $2.8 billion in 2022 and $2.6 billion in 2023.[19] In other words, the increase in the effective combined City, State and federal tax rate was lower than the statutory NY State increase, as some of the State increase was effectively paid by the federal government.
It should be noted that, on a current policy basis, Public Law 119-21 (the One Big Beautiful Bill Act), likely increased the effective federal tax rate on high-income filers by introducing a limitation on the tax value of itemized deductions, imposing an AGI-based floor on charitable deductions, and increasing the Alternative Minimum Tax. No benefit from the increase of the SALT deduction cap to $40,000 accrues to filers with AGI above $600,000.
Chart 4. NYC and NYS PIT+PTET Indexes (Nominal)
Source: NYS Department of Taxation and Finance, Office of the NYS Comptroller, Office of the NYC Comptroller analysis
Conclusions
The research for this fiscal note started as an epitaph of sort for the large fluctuations in PIT revenues experienced during the pandemic. We knew from our Office’s work on economic and fiscal issues that revenues had strengthened and normalized along a healthy growth path. However, we did not anticipate finding such clear-cut results by comparing tax returns in 2019 to those in 2023. To wit: 1) a shift of the income distribution away from the lowest income brackets; 2) an increase in total income among full-year residents, particularly in middle- and high-income brackets and; 3) a normalization of migration patterns, as seen through the data on part-year residents.
The analysis confirmed some of the stylized facts about NYC PIT taxpayers: the large concentration of income from non-wage sources at the top of the distribution and its volatility. For the years included in the analysis, however, volatility happened to dampen rather than exacerbate revenue fluctuations. For instance, non-wage income spiked around the time that outmigration peaked, causing total income to increase.
In our view, the tax collections data has two main implications. First, collections have resumed a steady trend growth. Based on collections data, we expect tax returns for 2024 and 2025 to reflect continued income growth due to job market gains, the growth in business income, and stock market gains.
The second implication is that the City’s revenues have normalized on a growth path consistent with the State’s, showing no persistent loss in (relative) revenue-generating capacity. The higher revenue level for NY State is due to the higher top tax rates implemented since 2021, which was partially offset by the creation of State and City PTETs.
Acknowledgements
This fiscal note was prepared by Francesco Brindisi, Executive Deputy Comptroller for Budget and Finance and Jonathan Siegel, Chief Economist. Archer Hutchinson, Creative Director, and Addison Magrath, Graphic Designer, led the report design and layout. The authors are indebted to many colleagues and experts who generously reviewed earlier drafts.
Appendix
Table A1 shows the distribution of filers, NYAGI, and tax liability for full-year residents. The concentration of tax liability among filers with AGI of $1 million or more is well known. In 2023, this group of filers represented 0.9% of all full-year filers, 33.3% of NYAGI, and 37.6% of total NYC liability. These shares were little changed relative to 2023. Bigger changes took place at the bottom of the distribution due to population losses and the expanded EITC. Filers with incomes between $100,000 and $1 million recorded gains in all shares.
Table A1. Distribution of filers, NYAGI, and NYC tax liability among full-year residents
| AGI | Share of filers | Share of NYAGI | Share of NYC liability | |||
| 2023 | Ch. ’19-’23 (ppts) | 2023 | Ch. ’19-’23 (ppts) | 2023 | Ch. ’19-’23 (ppts) | |
|---|---|---|---|---|---|---|
| Under $0 | 1.3% | 0.1 | -0.9% | 0.1 | 0.0% | 0.0 |
| $0-$49,999 | 53.1% | -5.8 | 10.2% | -3.3 | 3.4% | -3.7 |
| $50,000 – $99,999 | 23.4% | 1.3 | 15.1% | -1.2 | 13.9% | -1.0 |
| $100,000 – $199,999 | 13.6% | 2.4 | 17.0% | 0.9 | 17.3% | 1.1 |
| $200,000 – $499,999 | 6.3% | 1.6 | 16.8% | 2.4 | 18.2% | 2.7 |
| $500,000 – $999,999 | 1.4% | 0.3 | 8.6% | 0.9 | 9.6% | 1.0 |
| $1m+ | 0.9% | 0.1 | 33.3% | 0.1 | 37.6% | -0.1 |
| $1m-$5m | 0.8% | 0.1 | 13.1% | -0.2 | 14.9% | -0.2 |
| $5m-$10m | 0.1% | 0.0 | 4.5% | -0.3 | 5.1% | -0.4 |
| $10m+ | 0.0% | 0.0 | 15.6% | 0.6 | 17.7% | 0.5 |
Source: NYS Department of Taxation and Finance, Office of the NYC Comptroller analysis. Data includes full-year residents. Data excludes part-year residents and dependent filers
Reflecting the overall stability of wage income, withholding is the larger and steadier component of tax collections. The normalization of tax collections in NYC is further confirmed by the gradual convergence of revenues from withholding and non-withholding (including PTET), shown in Chart A2. The data imply that, as of August 2025, over the previous 12 months withholdings represented the same share of tax collections as they did before the pandemic. This makes intuitive sense as the City does not have a markedly progressive rate structure and taxes all income sources at similar rates, before credits. Over the same period, the share of non-withholding collections increased for the State due to the higher tax rates on high-income filers. These filers rely much more heavily on non-wage income and, furthermore, the State’s “tax benefit recapture” rules generally apply the top marginal tax rate to the entire taxable income of high-income filers.
The balance tilted toward non-withholding in September 2025 due to the amount of PTET reallocated from the State to the City, which increased the non-withholding index noticeably.
Chart A2. PIT+PTET Index: Withholding and Non-Withholding (incl. PTET, Nominal)
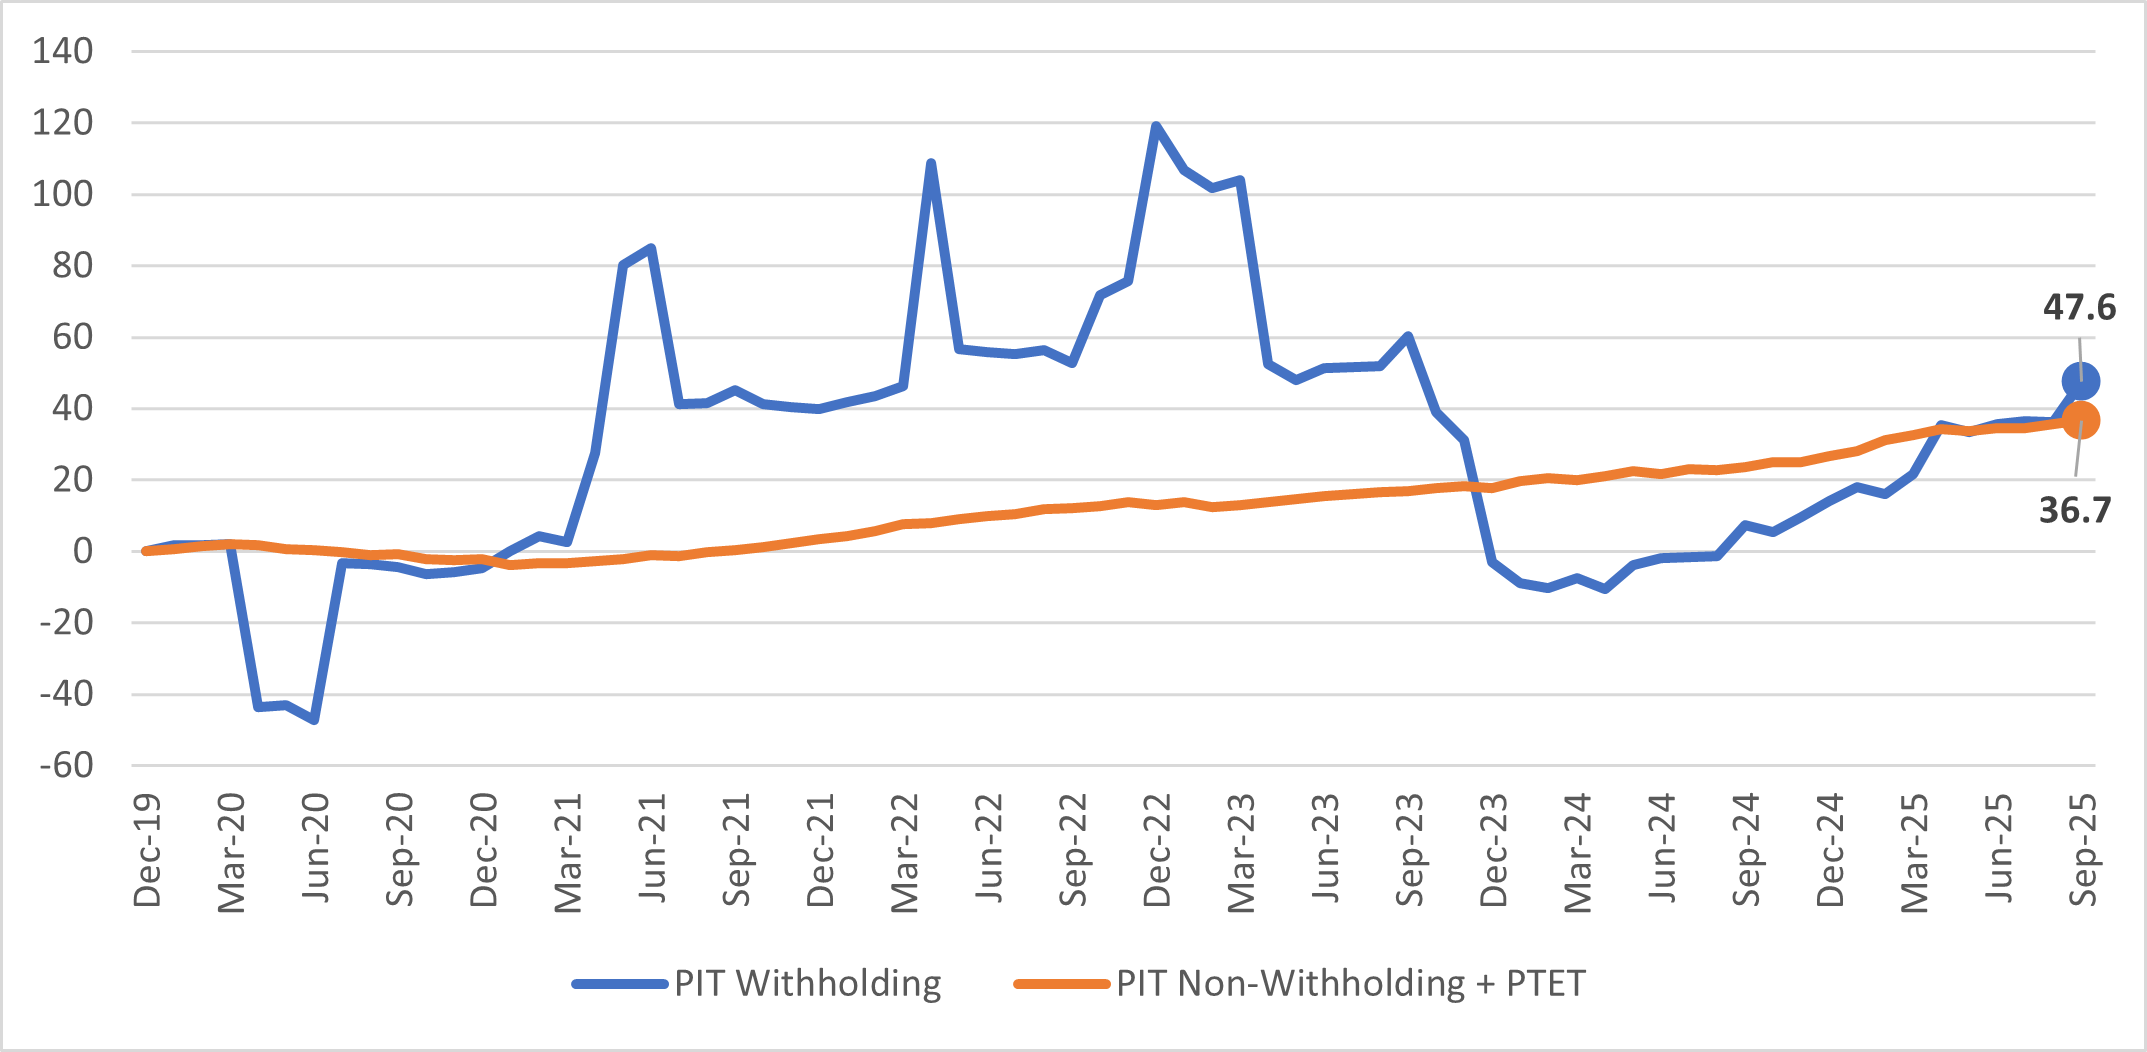
Source: NYS Department of Taxation and Finance, Office of the NYC Comptroller analysis. PIT non-withholding include installments, final and extension returns, refunds, “offset” distribution from NY State (mostly consisting of payments made by taxpayers to the State and subsequently allocated to the City), assessments, and audits
The withholding data also remove PTET-induced volatility and show that State revenues started to accelerate relative to the City’s in July 2021 when new tax tables incorporating the higher State tax rates were first implemented, as can be seen in Chart A3 below. The difference between indexes peaked in April 2022 at 18 percentage points and narrowed since then, as the City started regaining population and middle- and high-income filers. As of September 2025, the difference in the indexes stood at 8.8 percentage points.[20]
Chart A3. NYC and NYS PIT Withholdings Indexes (Nominal)
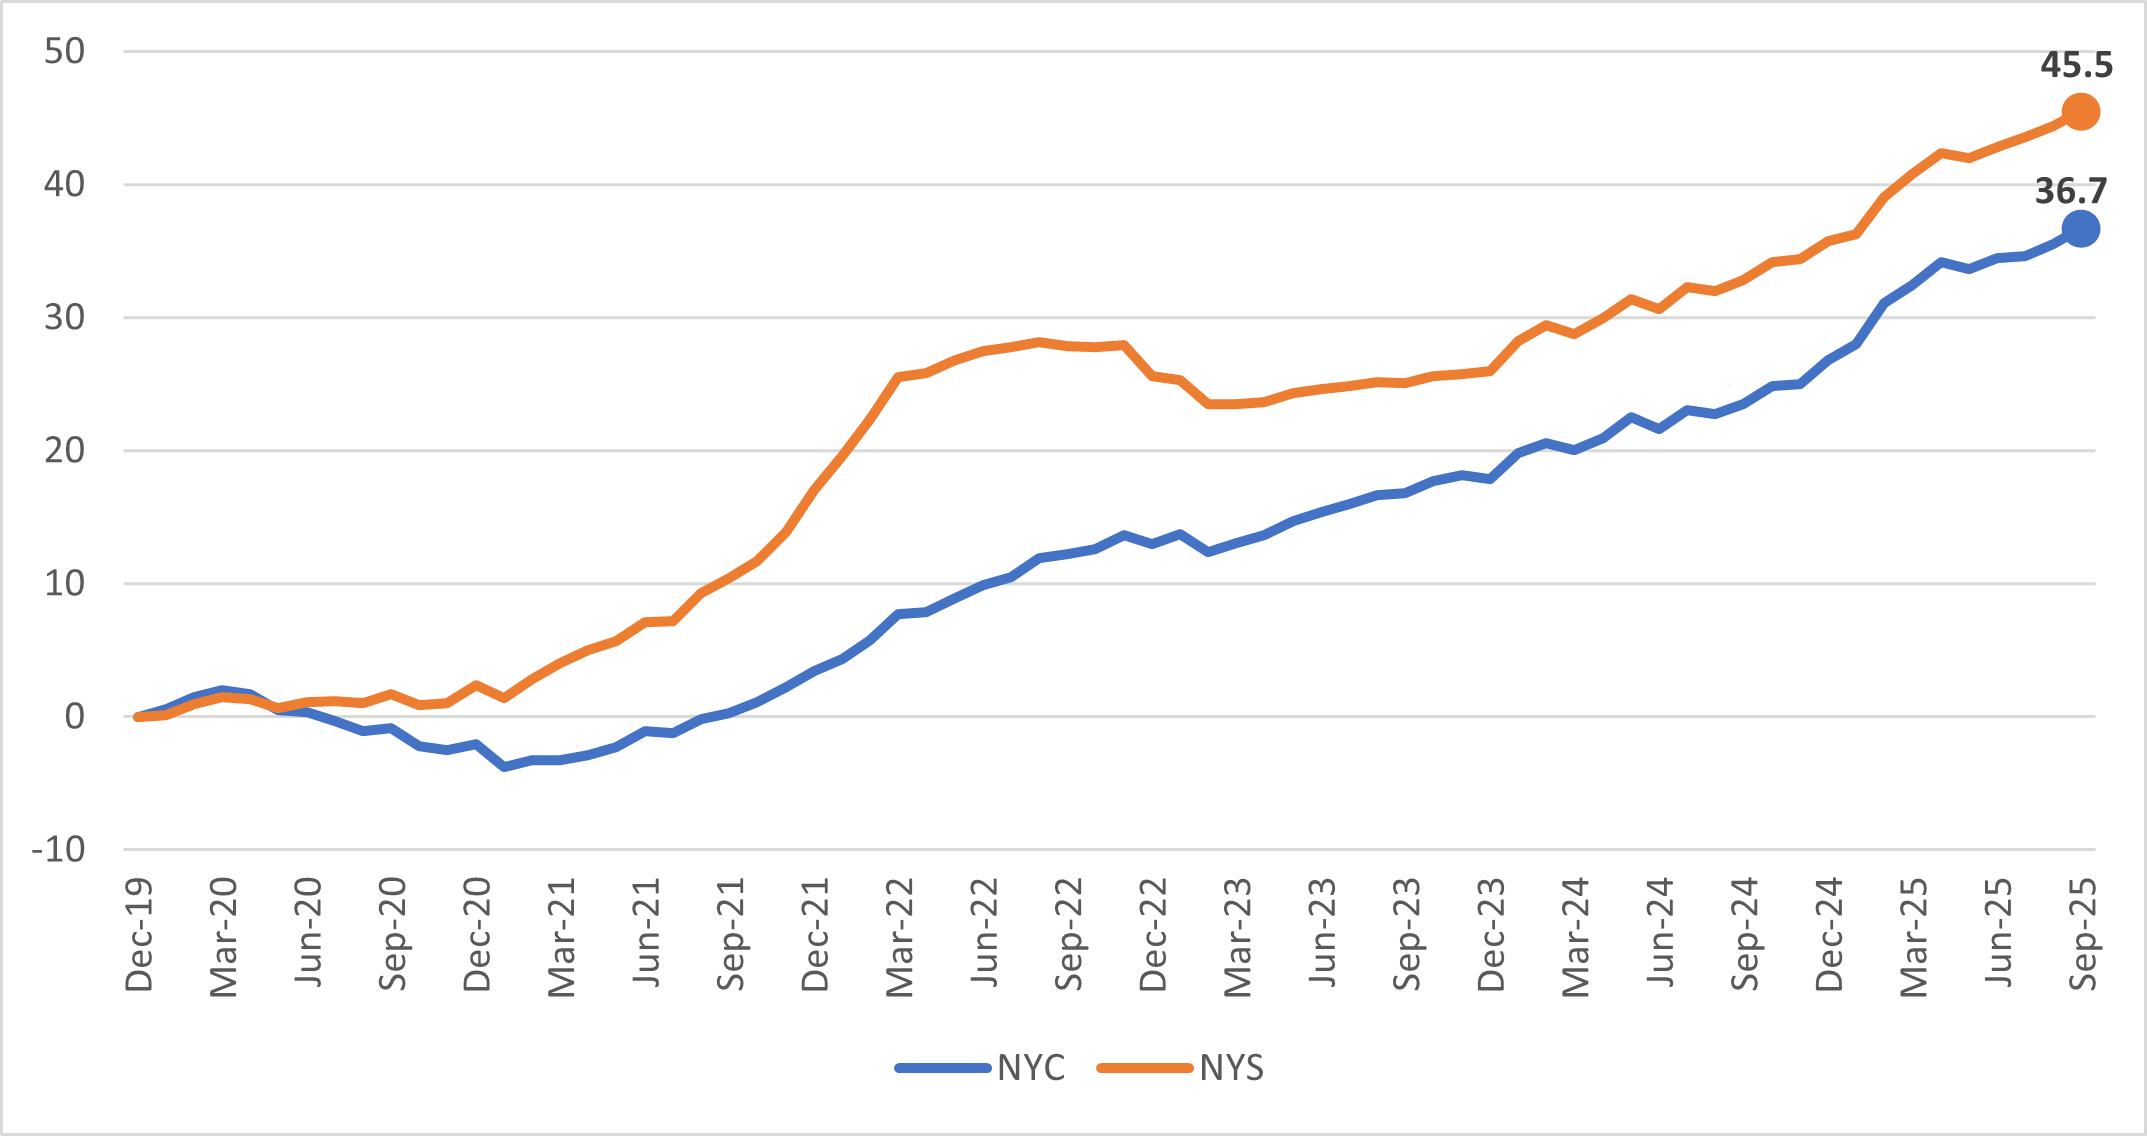
Source: NYS Department of Taxation and Finance, Office of the NYS Comptroller, Office of the NYC Comptroller analysis
Endnotes
[1] Tax revenues as reported in Schedule G2 of the Annual Comprehensive Financial Report for FY 2025.
[2] Local or municipal personal income taxes are relatively rare. Among the largest U.S. cities, Philadelphia levies a wage tax on residents and non-residents. Washington D.C. and Detroit impose a city income tax, as do other cities in Michigan. In Ohio, around 600 municipalities, including Cleveland, Columbus, and Cincinnati, levy municipal income taxes. In New York State, Yonkers also imposes a personal income tax. See Walczak J., Fritts J., James M. (2023) “Local Income Taxes: A Primer,” Tax Foundation for an overview.
[3] The permanent place of abode needs to be maintained for “substantially all of the taxable year.” Before tax year 2022, this was term was defined as a period exceeding 11 months. Beginning in tax year 2022, the period was shortened to 10 months in the tax years where a taxpayer either acquires or disposes of their residence.
[4] Between 1966 and 1999, the City also imposed a tax on wage and self-employment income of non-residents.
[5] The authors are indebted to the NYC Department of Finance for assistance in drafting this subsection.
[6] See the summary from NYS DTF on the CARES act.
[7] Most notably, the 2018 legislation allowed to itemize deductions for State and City tax purposes for those filers choosing the standard deduction in federal returns, and decoupled from the State and Local Tax (SALT) deduction cap for State and City tax purposes. In addition, the legislation decoupled from the TCJA treatment of alimony payments and moving expenses. A short summary is available from NY State DTF.
[8] An overview of the provisions of Public Law 119-21 and their potential impact on New York State is available in NY State Comptroller (2025) Tax Provisions Under the Federal Reconciliation Bill. A summary of the differences between NY State and federal itemized deductions due to the 2018 decoupling is available from NY State DTF.
[9] For tax year 2021, the most comprehensive data file available to NYC Department of Finance contained approximately 124,000 additional full-year NYC residents (+3% relative to the “final” file).
[10] Data on reported NYC months are verified by DTF’s Office of Tax Policy Analysis and edited when found to be inconsistent with other reported tax data.
[11] Tax years 2017 and 2018 would have their own distortions at the top of the income distribution. The passage of TCJA and the cap on the SALT deduction in 2017 led high-income filers to shift income (e.g., capital gains realizations and business income) forward. This inflated the number of high-income filers in 2017 and reduced it in 2018.
[12] Dependent tax returns are those filed separately from the tax unit that claims them as a dependent. These are most often children, young adults, elderly or disabled adults that have investment income and/or wages above a minimum threshold amount, but do not pay for the majority of their own living expenses. The PIT data available do not allow linking this dependent income to the tax unit that claims them as a dependent. Thus, we have excluded these filers to avoid any distortions to the income distribution by tax unit.
[13] See Obaidy M., Parrott J., Mehrotra A. (2024) Wage Compression of Wage Divergence? Center for New York City Affairs, October.
[14] This trend has been attributed to savings deriving from income-driven student loan repayment programs and the deduction on qualified business income. See Saunders L. (2023) “The Tax Play That Saves Some Couples Big Bucks,” Wall Street Journal, March 3.
[15] Only filers reported to have spent between 1 and 11 months in NYC are included in the calculations. We disregarded the (low) number of returns where the number of months is zero but there is a positive NYC tax liability.
[16] See Eisner E. (2025) “New Data Confirms Tax Flight Is a Myth,” Fiscal Policy Institute, October.
[17] The filing deadline for 2019 tax returns was moved to July 2020, whereas the deadline for 2020 tax returns was moved to May 2021.
[18] The legislation increased the top NY State PIT tax rate from 8.82% to 9.65% for taxable incomes over $1,077,550 for single filers, $1,616,450 for head of household filers, or $2,155,350 for joint filers. Taxable incomes above $5 million faces a new tax rate of 10.3%, while taxable incomes above $25 million faces a new tax rate of 10.9%. The rates were to be in effect between 2021 and 2027 but were extended to 2032 as part of the State FY 2026 budget legislation. It should be noted that since 1990 the State has implemented “tax benefit recapture” provisions that apply the top tax rate to the entire taxable income of high-income filers (see for instance Montorio N., Cohen A., Ifraimov D. (2025) “New York’s ‘Hidden’ Flat Rate Personal Income Tax,” Tax Notes State, Vol.115, March.)
[19] Estimates derived from the total of State and City PTET paid credits for full-year City residents, multiplied by a marginal federal tax rate of 37%.
[20] Total payroll wages paid by employers in NYC and NYS (reported by place of work) grew at essentially the same rate over this period. This means that the withholding differential is not driven by changes in the (re)location of wage income.