Annual Summary Contracts Report for the City of New York
Fiscal Year 2023
A Message from the New York City Comptroller
Dear New Yorkers,
I’m pleased to share the Annual Summary Contracts Report, covering Fiscal Year (FY23).
Contracting is how the City meets many of our goals and provides services to New Yorkers. City agencies contract with vendors to provide meals to home-bound seniors, childcare and afterschool programs for kids, construction projects to build new schools, upgrade our parks, repair our roads. And much more.
In FY 23, the City entered into 12,820 new procurement and revenue contracts, valued at $38.22 billion – more than budgets of 30 states. This report provides a transparent and detailed snapshot of that contracting activity. We provide information here on the contracts entered into by the City in FY23, including what agencies have been purchasing, what procurement methods they are utilizing, the 10 largest contracts, real property transactions, contact modifications, purchase orders, and more.
The report also includes a look at several key trends in City procurement. For years, the City’s onerous procurement process has created considerable registration delays that hinder the ability of its vendors, especially human service providers, nonprofits, and M/WBEs, to get paid on time. Unfortunately, this year’s data shows that problem continues to grow.
To respond to the growing need for shelter and services for people seeking asylum, the total value of the City’s emergency procurement contracts has grown. For a deeper dive into emergency procurement, please refer to our recent report “Rethinking Emergency Procurements; A Roadmap to Efficiency and Accountability.”
Next month, we will release our annual report on M/WBE procurement, highlighting trends in the City’s efforts to make sure we are contracting fairly and inclusively.
Finally, if you’re interested in learning more about City procurement, we’ve got a great resource for you: last fall, we released a new Contract Primer on NYC Contracting. The Primer contains useful descriptions of many of the contract categories, solicitation methods, and contracting processes that are discussed in this Report.
In the meantime, I hope you will find the information in this Annual Report to be both interesting and useful!
Brad
I. Executive Summary
The City’s procurement system encompasses tens of thousands of transactions each year. The supplies, services, and construction purchased by the City and the revenue agreements it enters into enable agencies and elected officials to serve the public, address critical challenges, and encourage growth.
In accordance with section 6-116.2 of the New York City Administrative Code (Administrative Code), the Comptroller’s Office is required to publish an annual summary report of contracts and agreements assumed by New York City during the previous FY.[1] This “Annual Summary Contracts Report” (or Report) aims to provide better transparency into the City’s contracts that were registered in FY23, and how these agreements are entered into.
The content in this Report that is specifically mandated by the Administrative Code includes detail for:[2]
- All franchises, concessions, or goods and services contracts valued at more than $10K (or more than $15K for construction contracts);
- The types and dollar amounts of each contract from the previous FY;
- The agency, affiliated agency, elected official, or City Council that entered into each contract, franchise, or concession;
- The vendors associated with each contract, franchise, or concession entered into with the City; and
- How the City selected the contractor, franchisee, or concessionaire.
While not related to City contracting actions, this Report also contains data required by Sections 6-109 and 6-130 of the Administrative Code, relating to the Comptroller’s enforcement of certain living and prevailing wage requirements.[3]
Role of the Comptroller’s Office
Under the New York City Charter (“Charter”), the Comptroller’s Office is responsible for reviewing and approving city contracts and agreements before they are legally effective, unless this authority has been delegated to City agencies or is otherwise not legally required.[4] During a review period lasting no more than 30 calendar days by law, the Comptroller’s Office ensures that appropriate funds exist for the City to make payments to vendors, confirms that the contracting agency followed proper procurement rules, and that there was no corruption in the decision‐making process. The Comptroller’s Office also ensures that contracting agencies have vetted vendors looking to do business with the City and verified that they are operating in good standing, and therefore eligible to be awarded City contracts.
Operating within guidelines set forth by the Charter and Administrative Code, the Comptroller’s Office achieves the functions outlined above by:[5]
- Encumbering funds to contracts for use in payments for goods and services;
- Maintaining a registry of City contracts and agreements;
- Presenting objections if the Comptroller’s review process yields sufficient concern that there was corruption in the awarding of a new contract, or that an agency failed to sufficiently review an awarded vendor; and
- Tracking expenditures and revenues associated with registered contracts and agreements.
The Comptroller’s registration authority is separate and distinct from decisions relating to the necessity of new procurements or revenue opportunities, which vendors are selected for City contracts, how contracted goods or services will be provided, and (besides checking for cases of corruption or debarment) whether specific vendors are fit to contract with the City.[6] Each of these processes may be managed by different partners across the City, and can take a considerable amount of time to advance. Accordingly, the Comptroller remains committed to working with the Mayor’s Administration to streamline outdated and lengthy processes in City contracting so that:
- Needed goods, services, and construction can be brought to bear more quickly;
- Vendors doing business with the City, including non-profits and M/WBEs, can get paid more quickly for the goods, services, and construction that they are providing; and
- The City can save time and money by realizing greater efficiencies in the contracting process.
Additional Reporting Sections
This Report expands on procurement data mandated by the Administrative Code in order to provide more context around City contracting activities. Additional sections of this Report present information on the following topics:
- Real property transactions
- Contract modifications (including construction change orders)
- Task Orders registered under agency master agreements
- Purchase Orders
- An explanation of emergency procurements
- Contract registrations with applied industry classifications
- Contract registrations by agency type
- Retroactive registration data (i.e. contracts registered after their start dates)
Source Data
In order to accomplish these aims, this Report draws extensively from data stored in the City’s Financial Management System (FMS), a computerized database jointly administered by the Mayor and the Comptroller and maintained by Financial Information Services Agency (FISA). [7] Each agency, affiliated agency, elected official, and the City Council, is required to enter information in FMS for every franchise and concession, as well as for every contract for goods or services worth more than $10K (or $15K if the contract is related to construction, repair, rehabilitation, or alteration).
Information in Section IX of this Report relating to the Comptroller’s enforcement of certain living and prevailing wage requirements was provided by the Comptroller’s Bureau of Labor Law, rather than FMS.
The City tracks data in FMS using a variety of identifiers that reflect vital contract information. Two of the most prominent identifiers for the purposes of this Report are “Contract Type” and “Award Method.” [8] To better track expenses and revenues, agencies are required to specifically identify the type of contract submitted for registration by selecting from a list of predetermined contract type codes in FMS. Award Method categories indicate how the City selects vendors for a particular contract. This Report also references “Industry classifications” which are not entered by agencies into FMS but are instead derived from various FMS data points to reveal procurement trends by sector. Data used for this Report is available to readers in Section XI – Appendices.
Topline Citywide Numbers for FY23
$38.2B
In Registered Contract Value
12,600+
Procurement Actions
A total of 12,820 new procurement and revenue contracts were registered in FY23 for a total value of $38.22 billion.[9] The contracts in this Report reflect binding agreements between the City and another entity, or sometimes between two City agencies, which contain the terms and conditions to be performed by both parties as well as the terms of payment (as applicable). This Report broadly organizes contracts into procurements (where the City is contracting for goods, services, or construction) and revenues (where the City is a recipient of funds from another entity).[10] The 12,820 figure does not include registered Real Property Transactions, which are captured in Section III of this Report. Though they are constituted as newly registered agreements in FY23, Real Property Transactions are not covered by the reporting requirements outlined for this report under the Administrative Code.
Table 1 below illustrates that the vast majority of registered contract volume, by both the number of actions and total value, is driven by procurement actions. Registrations for procurement contracts in FY23 reflect City investments in economic development projects, new construction, and further expansion of the City’s homeless shelter capacity.
Table 1: FY23 New Contract Registrations
| Category | # of Actions | Value of Actions |
| Total Registered Contract Actions | 12,820 | $38,218,189,832 |
| Total Procurement Actions | 12,637 | $38,003,141,457 |
| Total Revenue Actions[11] | 183 | $215,048,375 |
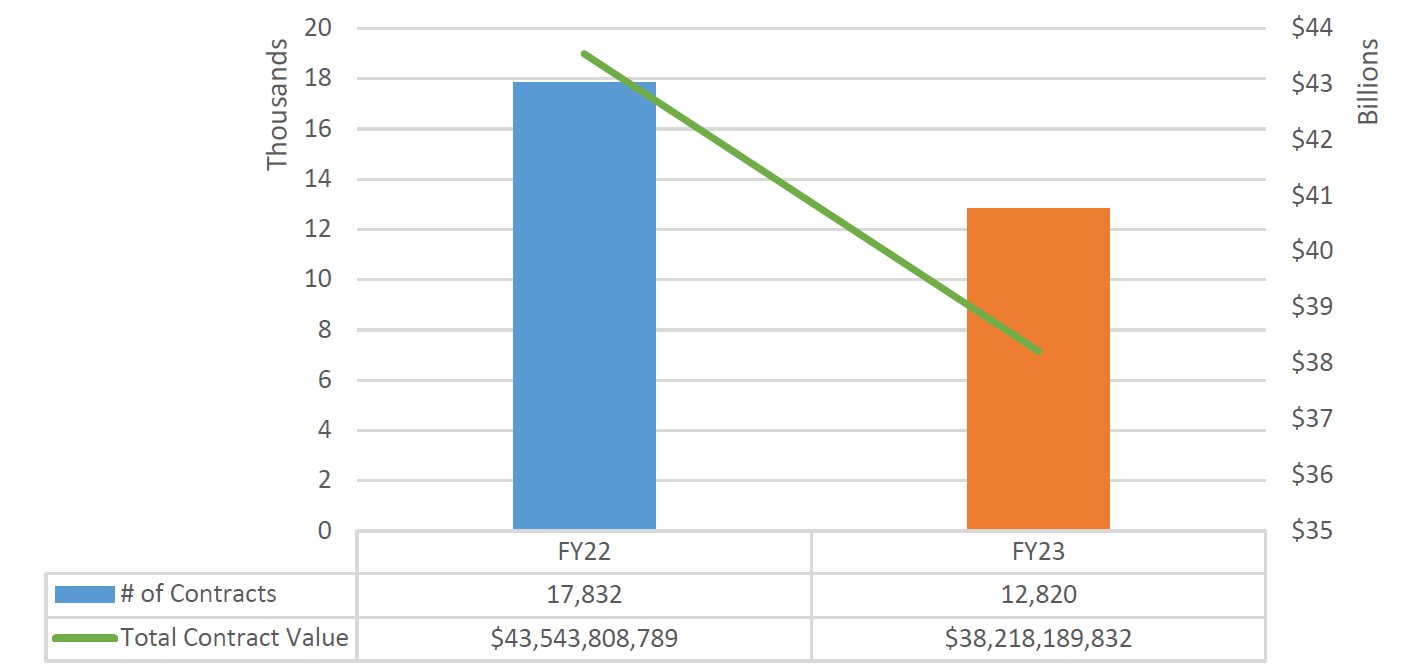
As Chart 1 below shows, the total volume and value of new registered contracts was lower in FY23 than the prior fiscal year. However, this does not necessarily indicate a decline in the City’s procurement activity. Our analysis in Section IV of this Report shows that the number of registered modifications to existing contracts and the number of purchase orders processed both increased in FY23.
Chart 1: New Registered Contract Volume and Value, FY22-FY23
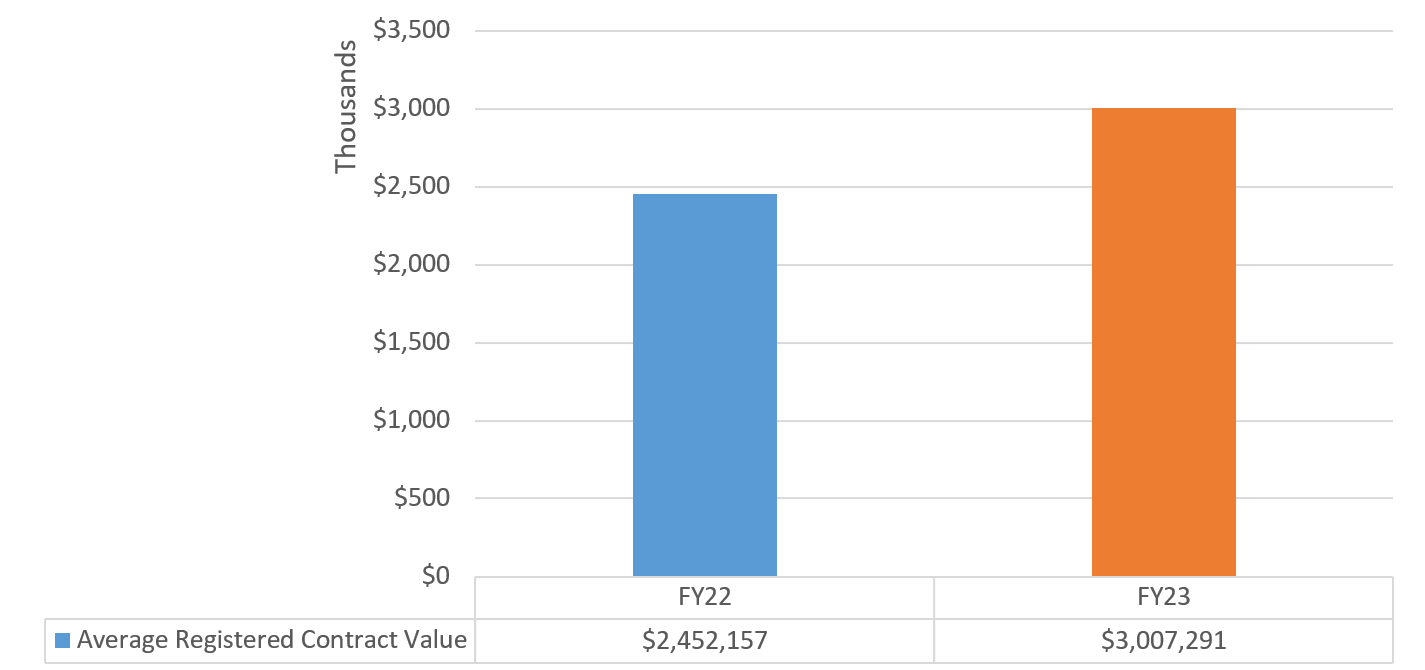
Our analysis also found that the average contract value was more than $500 thousand higher in FY23 than in FY22. Chart 2 shows the average value of a contract in FY22 vs FY23.
Chart 2: Average Procurement Contract Value FY22-FY23
FY23 Procurement Contracts at a Glance
Table 2 illustrates that just ten agencies account for almost 80% of the City’s FY23 procurement value. The Department of Homeless Services (DHS) makes up the largest share (18.66%) of the City’s procurement value. This is because DHS, whose agency mission is to provide temporary shelter for those in need, is leading the City’s contracting for emergency shelter services for newly arrived asylum seekers.
Table 2: Top Ten Agencies Based on FY23 Procurement Value from New Contracts
| Agency | # of contracts | % Share of Contracts | Total Registered Contract Value | % Share of Registered Contract Value |
| DSS/DHS | 232 | 1.81% | $7,131,954,726 | 18.66% |
| DDC | 216 | 1.68% | $5,278,552,895 | 13.81% |
| ACS | 439 | 3.43% | $3,655,741,724 | 9.57% |
| DOE | 3,238 | 25.26% | $2,930,954,971 | 7.67% |
| DCAS | 621 | 4.85% | $2,483,908,056 | 6.50% |
| EDC | 3 | 0.02% | $2,280,321,234 | 5.97% |
| DEP | 285 | 2.22% | $1,868,415,606 | 4.89% |
| MAYOR | 259 | 2.02% | $1,624,177,541 | 4.25% |
| OTI | 233 | 1.82% | $1,375,363,275 | 3.60% |
| DOHMH | 1,311 | 10.23% | $1,354,291,758 | 3.54% |
| Grand Total | 6,840 | 53.35% | $29,983,681,783 | 78.45% |
The ten contracts with the largest registered procurement values account for $8.76 billion, which is almost a quarter (23%) of the City’s overall procurement value in FY23. These contacts are displayed below in Table 3. Note that this table includes information on contract end-dates to draw attention to the fact that several of these top-ten procurements are for goods, services, or construction that will be provided over the course of many years.
Table 3: Top Ten FY23 Registered Procurement Contracts by Value
| Contract # | Agency | Vendor Legal Name | Contract Purpose | Contract Registered Amount | Contract Start Date | Contract End Date |
| 20238807786 | DDC | Tutor Perini Corporation | Design Build Program – NYC Borough Based Jail System, Brooklyn. | $2,958,933,292 | 6/30/2023 | 9/3/2029 |
| 20238804191 | EDC | New York City Economic Development Corporation[12] | Provision of Citywide Economic Development Services. | $1,836,434,092 | 7/1/2022 | 6/30/2023 |
| 20228808498 | MAYOR | Dormitory Authority State Of NY | Development of phase 2 of the Staten Island Master Plan and the renovation of
the New York County State Supreme Court Building. |
$606,911,727 | 7/1/2022 | 6/30/2032 |
| 20238806917 | SBS | Brooklyn Navy Yard Development Corporation | Provision of industrial, commercial, waterfront, maritime, and other economic Development services at the Brooklyn Navy Yard. | $529,981,983 | 7/1/2022 | 6/30/2025 |
| 20231408687 | TRANSIT | Metropolitan Transportation Authority | Bus purchases and track, switch, third rail, and substation replacements. | $498,114,315 | 9/28/2022 | 6/30/2026 |
| 20238802667 | DSS/DHS | Help Social Service Corporation | Shelter facility for homeless families with children. | $489,190,529 | 6/1/2022 | 6/30/2055 |
| 20238808538 | DSS/DHS | Help Social Service Corporation | Shelter facility for homeless single adults. | $467,858,423 | 6/1/2023 | 6/30/2056 |
| 20238804237 | DSS/DHS | Project Renewal Inc | Shelter facility for homeless single adults. | $467,334,567 | 7/1/2022 | 6/30/2056 |
| 20238800486 | DCAS | JP Morgan Chase Bank Na | Procurement card services for agency purchases. | $464,000,000 | 4/1/2023 | 10/12/2027 |
| 20238804188 | EDC | New York City Economic Development Corporation | Provision of City-Wide economic development services related to maritime, rail, aviation, and market transportation. | $443,342,250 | 7/1/2022 | 6/30/2023 |
Retroactive Contract Registration Trends
For years, the City’s onerous and slow procurement process has created considerable registration delays that hinder the ability of its vendors, especially human service providers, nonprofits, and M/WBEs, to get paid on time. These vendors often wait six months, a year, or even more to get paid for services they have provided on behalf of the City. This causes a tremendous strain on many of these organizations, as they are forced to borrow to cover cash flow or triage their own expenses, and makes it extremely difficult to pay, sustain, and grown their businesses.
The current Mayoral and Comptroller Administrations created the Joint Task Force to Get Non-Profits Paid and the Capital Reform Task Force in 2022 to develop critical reforms needed to address components of contracting systems. Some progress was made initially, including the “Clear the Backlog” initiative in the summer of 2022, an Allowance Amendment Initiative to enable the City to make certain changes to existing contracts without requiring lengthy contract amendments, and an initiative with the City Council to make discretionary award contracts multi-year instead of one year at a time.
Unfortunately, progress has stalled on those efforts. A key reform, “ContractStat,” a performance management and transparent reporting system to hold agencies accountable and collectively engage in a process of continuous improvement, was supposed to have been launched by June 2023 but still has not been delivered. Timeframes and key performance indicators for the procurement and contract process have not been established as promised. The only existing timeline, set by the City Charter, is for the Comptroller’s office, which is obligated to register or return each and every contract within 30 days of receiving it – an obligation the office has met consistently.
Citywide retroactivity rates (the percentage of contracts that are registered after the start date) are getting worse. The percentage of late-registered contracts by volume has grown each year since FY22 (Chart 3). The problem is especially severe for human service providers and non-profit vendors where over 72% of their total contract value was registered late in FY23. These trends only got worse as we entered FY24, where more than 95% of total contract value for human service and non-profit vendors were registered late in the first half of FY24 (Chart 4). The analysis in Section VIII of this Report reveals that some of these contracts are registered extremely late. For FY23, more than 27% of contracts with non-profit vendors (1,218 contracts) were registered six months to one year late, and more than 31% (1,388 contracts) were registered more than a year late.
Chart 3: Percent of Late-Registered Contracts by Volume – FY21-24
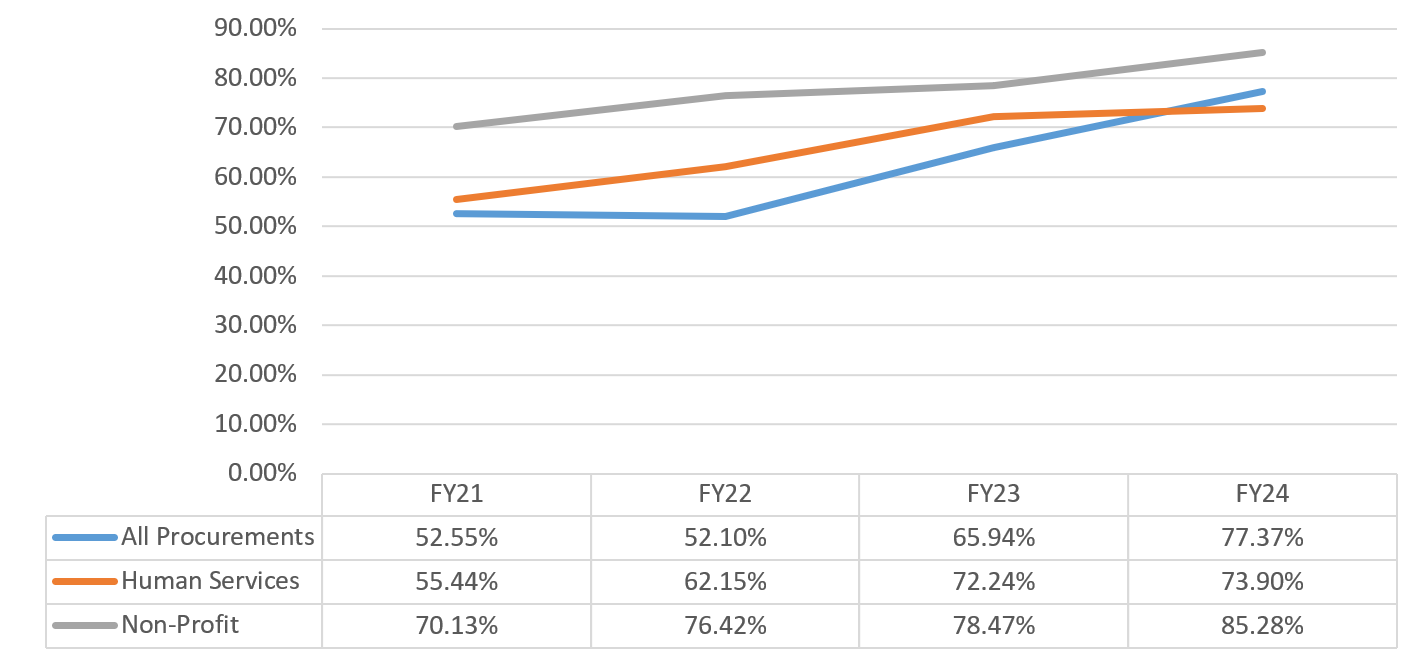
Chart 4: Percent of Late-Registered Contracts by Value – FY21-24

Late registration is a problem for M/WBEs as well. The largest share of M/WBE procurement contracts were registered via the M/WBE Noncompetitive Small Purchase (NCSP) method, which was designed to reduce delays in the contracting process by allowing agencies to contract with City-certified M/WBE vendors for up to $1.5 million without competition. However, the large majority of contracts registered via the M/WBE NCSP method were registered late.
Retroactive contract registration trends are covered in Section VIII of this report.
FY23 Revenue Contracts at a Glance
In addition to procurement agreements, City agencies also contract with private entities for the right to use NYC-owned property in exchange for payment, services, or both. The City derives millions of dollars in revenue from such contracts each year. Over 180 revenue actions were registered in FY23 for a total value of $215.05 million, but the majority of this value can be attributed to Corpus Funded contracts. Corpus Funded contracts are related to the City’s pension management expenses, and while they are currently recorded as revenue transactions, they do not actually generate revenue for the City’s general fund.
Excluding Corpus Funded contracts, the City registered 164 new revenue contracts in FY23 for a total value of $51.60 million. Table 4 contains the top ten revenue contracts that were registered in FY23, by value (excluding Corpus Funded actions).
Table 4: Top Ten FY23 Registered Revenue Contracts by Value (Excluding Corpus Funded)
| Contract # | Agency | Vendor Legal Name | Contract Purpose | Contract Registered Amount | Contract Start Date | Contract End Date |
| 20238200421 | DPR | Samuel Field YM & YWHA INC | Operation and maintenance of indoor tennis – alley pond park. | $8,414,234 | 10/10/2042 | 10/10/2042 |
| 20238201216 | DPR | Legends Boathouse LLC | Operation and maintenance of a restaurant – Central Park. | $7,500,000 | 4/16/2033 | 4/16/2033 |
| 20238200226 | DPR | The Bonnefont LLC | Restaurant operations at Fort Tryon park. | $5,326,423 | 8/31/2042 | 8/31/2042 |
| 20238200107 | DOT | CHPE LLC | Use and operation of spaces in Astoria under the jurisdiction of DOT and DPR. | $4,809,318 | 6/30/2033 | 6/30/2033 |
| 20238802204 | DSNY | Simsmetal East LLC | Acceptance, processing, and marketing of recovered metal. | $3,000,000 | 8/31/2027 | 8/31/2027 |
| 20238201533 | DPR | Busters Marine Bronx Marina | Full-service marina operations at locust point. | $2,884,029 | 6/4/2043 | 6/4/2043 |
| 20238200091 | DPR | F Ottomanelli LIC LLC | Café operations -hunter’s point south park. | $1,971,062 | 7/5/2031 | 7/5/2031 |
| 20238806592 | NYPD | Propertyroom. Com INC | Internet-based auctioning of unclaimed/forfeited property. | $1,875,000 | 3/7/2028 | 3/7/2028 |
| 20238200106 | DOT | CHPE LLC | Use and operations of spaces in Randall’s Island Park. | $1,759,677 | 6/30/2033 | 6/30/2033 |
| 20238200346 | DPR | The Getaway 151 LLC | Snack bar operations at riverside park. | $1,686,362 | 10/9/2042 | 10/9/2042 |
How to Navigate This Report
Section II – New Contract Action Trends: Section II will present data trends for the following contract categories:
- Competitive Contracts
- Limited or Non-Competitive Contracts
- Transactions Not Subject to PPB Rules
- Supplemental Contracts
- Revenue Contracts
Section III – Real Property Transactions: While not covered under the Administrative Code’s scope for this Report, the City also enters into contracts relating to Real Property Transactions each year. Section III will review data trends for these contracts, which mostly consist of lease agreements.
Section IV – Contract Modifications and Administration: While not explicitly called for inclusion in this Report by the Administrative Code, Section IV delves into trends relating to actions undertaken against existing contracts in FY23. Broadly speaking, these actions fall into one of the following categories:
- Actions taken by the City to encumber funds, or to otherwise modify some aspect of an active contract;
- Processing Task Orders (TOs) against existing Master Award contracts; or
- Executing purchase orders for goods, services, or construction (generally under small purchase limits).
Section V – Emergency Procurements: Section V provides additional data regarding the sourcing of required goods or services to meet emergency needs, as authorized by Section 315 of the NYC Charter, and Section 3-06 of the Procurement Policy Board (PPB) Rules.
Section VI – Procurement Actions by Industry: Section VI presents FY23 contract data through the lens of industry classifications, which are used by the City to support analysis of procurement trends.
Section VII – Procurements by Agency Type: Section VII provides information regarding the volume, value, and industry classifications of procurement contracts registered to each agency in FY23.[13]
Section VIII – Retroactive Contract Registrations: Section VIII examines retroactive contract trends, where contracts are legally implemented after the first day of their term.
Section IX – Bureau of Labor Law – Living and Prevailing Wage Cases: Section IX summarizes the Comptroller’s enforcement of certain living and prevailing wage standards, as required under Sections 6-109, 6-130, and 6-145 of the Administrative Code.
Section X – Glossary of Terms: The glossary defines relevant City procurement and contract registration terminology.
Section XI – Appendices: This Section contains complete supporting data sets for the interposed tables as well as other data points required by the Administrative Code that are not specifically referenced in this report.
Resources to Supplement This Report
While not used to generate data for this Report, readers may find the following resources useful for learning more about city contracting and financial trends.
Contract Primer
In the Fall of 2023, this Office released a new Contract Primer to provide the public with a straightforward guide to the basics of the City’s contracting workflows and essential solicitation methods. Readers can reference information on key entities in NYC contracting, learn about the NYC contracting cycle, and access links to helpful public-facing resources. Critically, the Primer also defines contract categories, solicitation methods, and additional contracting processes that are discussed in this Report.
Helpful Links:
Checkbook NYC
In July of 2010 the Comptroller’s Office launched Checkbook NYC, an online transparency tool that for the first time placed the City’s day-to-day spending in the public domain. Using an intuitive dashboard approach that combines a series of graphs and user-friendly tables, Checkbook NYC provides up-to-date information about the City’s financial condition.
Checkbook NYC has been ranked the top transparency tool in the nation for tracking government spending by the United States Public Interest Research Group and was named New York City 2013 “Best External Application” by Government Technology Magazine.
Checkbook NYC also contains a majority of the City’s contract data. This tool enables users to examine data on its “Contracts” tab by fiscal year (or other date ranges), procurement category, contract types, and more.
Helpful Links:
- Click this link to access Checkbook NYC
- Click this link to view videos on how to navigate Checkbook NYC’s search functions
PASSPort Public
Procurement and Sourcing Solutions Portal (PASSPort) is the City of New York’s end-to-end digital procurement platform that manages every stage of the procurement process from vendor enrollment, to the solicitation of goods and services, to contract registration and management. PASSPort Public refreshes data periodically from PASSPort such that the public can derive insight into the City’s procurement system.[14]
Helpful Links:
Agency Procurement Plans (M/WBE, LL63, and Human Services)
Under Local Law 1 of 2013, SBS and the Mayor’s Office of Contract Services (MOCS) are required to publish an annual plan and schedule listing the anticipated contracting opportunities for the coming fiscal year. These plans include the following information for each solicitation: the specific type and scale of the services to be procured, the term of the proposed contract, the method of solicitation the agency intends to utilize, and the anticipated fiscal year quarter of the planned solicitation.
Similarly, under Local Law 63 of 2011, MOCS is required to publish a plan and schedule detailing the anticipated contract actions (for certain categories of procurement) of each City agency for the upcoming fiscal year. This requirement applies to contracts valued at more than $200K providing standard or professional services, including against agency task orders.
Lastly, MOCS also publishes plans reflecting proposed procurements relating to human service programs. This information is collected from, and organized by, city agencies.
Helpful Links:
- Click this link to view M/WBE Procurement plans by agency
- Click this link to view LL63 plans by agency
- Click this link to view Human Service procurement plans by agency
City Record Online
The City Record Online (CROL) is a searchable database of notices published in the City Record newspaper which includes but is not limited to: public hearings and meetings, public auctions and sales, solicitations and awards and official rules proposed and adopted by city agencies.[15]
Helpful Links:
II. New Contract Actions Trends
Overview
Table 5 provides a breakdown of new procurement and revenue agreements by contract group.[16] Subsequent tables provide details about the distribution of subgroups, by volume and value. As with previous years, competitively sourced contracts in Group 1 comprise the largest share of contract value. Limited or Non-Competitive method contracts comprised more than three quarters of the total contract volume in FY23.
Table 5: FY23 New Procurement and Revenue Contracts by Category
| Contract Category | # of Contracts | % Share of Contracts | Total Registered Contract Value | % Share of Contract Value |
| Group 1: Competitive Method Contracts | 1,539 | 12.00% | $16,967,698,060 | 44.40% |
| Group 2: Limited or Non-Competitive Method Contracts | 9,653 | 75.30% | $14,853,044,164 | 38.86% |
| Group 3: Not Subject to PPB Rules | 437 | 3.41% | $496,908,520 | 1.30% |
| Group 4: Supplemental Contracts | 1,008 | 7.86% | $5,685,490,713 | 14.88% |
| Group 5: Revenue Contracts | 183 | 1.43% | $215,048,375 | 0.56% |
| Grand Total | 12,820 | 100.00% | $38,218,189,832 | 100.00% |
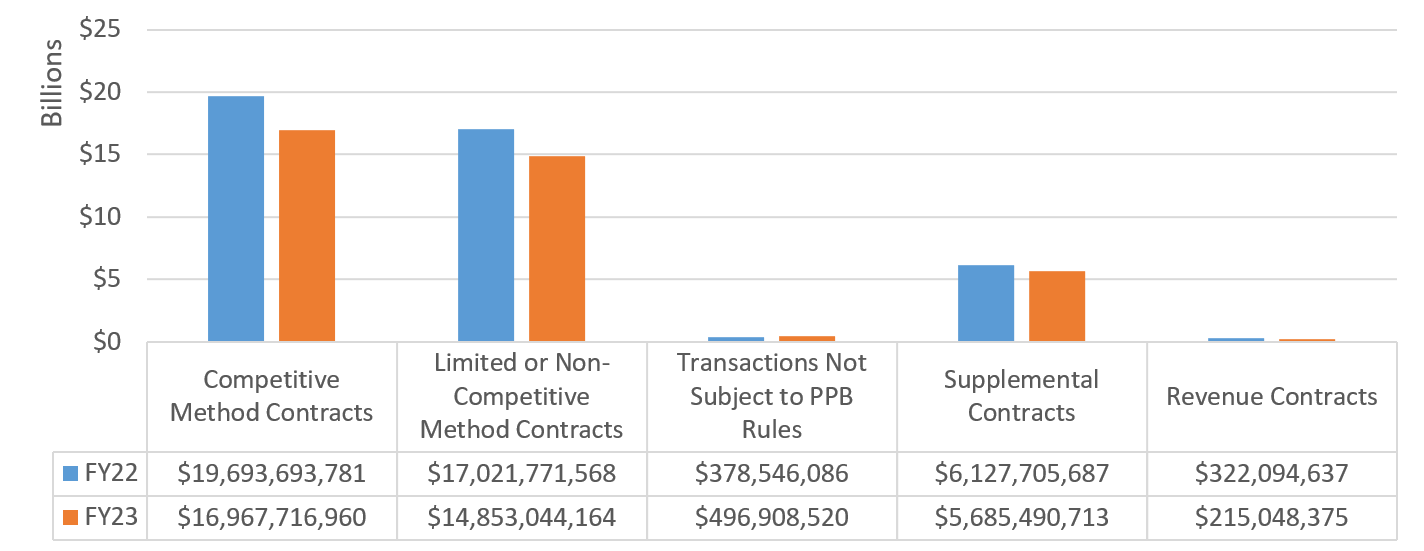
Charts 5 and 6 provide a year-over-year comparison of contract volume and value by the groupings listed in the table above. While both graphics reflect the decline in contract volume and value mentioned in the Executive Summary, they also show consistent year over year trends across the contract groups.
Chart 5: FY22-23 Volume of New Contracts by Contract Group
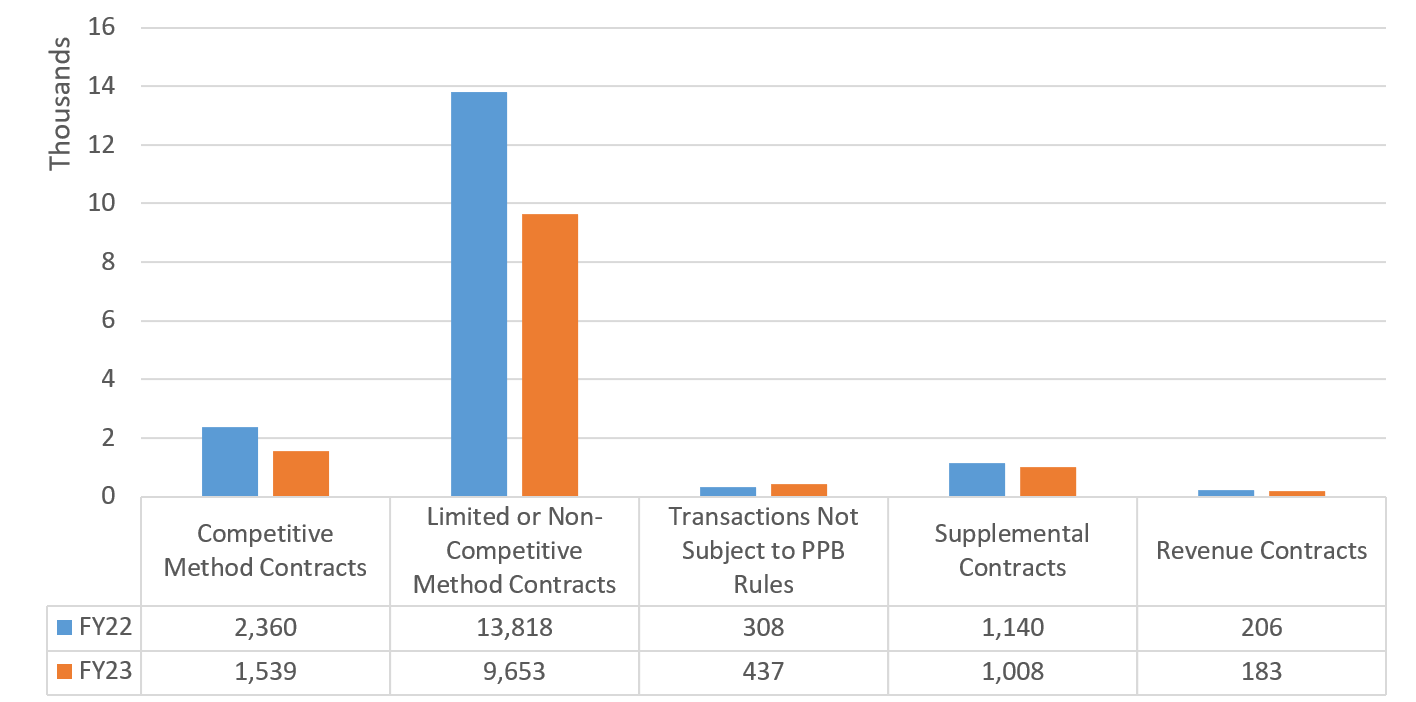
Chart 6: FY22-23 Value of New Contracts by Contract Group
Group 1: Competitive Method Contracts
Competitive Method contracts are designed to help the City obtain the highest value based on price or quality. There were fewer Competitive Sealed Proposal (CSP) procurements in FY23 relative to the previous year. This may be because of an FY22 spike in procurements for DOE early childhood contracts that were procured via the CSP method. Table 6 provides a breakdown of competitive method subgroups by volume and value.[17]
Table 6: Competitive Methods Contracts by Subgroup
| Subgroup | # of Contracts | % Share of Contracts | Total Registered Contract Value | % Share of Contract Value |
| Competitive Sealed Bid Contracts | 650 | 42.24% | $5,264,380,505 | 31.03% |
| Competitive Sealed Proposal Contracts | 825 | 53.61% | $11,536,808,078 | 67.99% |
| Accelerated Procurement Contracts | 64 | 4.16% | $166,528,377 | 0.98% |
| Grand Total | 1,539 | 100.00% | $16,967,716,960 | 100.00% |
Group 2: Limited or Non-Competitive Methods
Limited or Non-Competitive procurement methods were responsible for the largest share of new procurement contracts (9,652 actions or 75.30%). Nonetheless, the volume of Group 2 contracts declined overall in FY23, largely due to lower number of small purchase registrations. Table 7 provides a breakdown of subgroups under Group 2 by volume and value.
Table 7: Limited/Non-Competitive Methods Contracts by Subgroup
| Subgroup | # of Contracts | % Share of Contracts | Total Registered Contract Value | % Share of Contract Value |
| Buy-Against Procurement Contracts | 3 | 0.03% | $9,550,554 | 0.06% |
| Demonstration Project Contracts | 8 | 0.08% | $11,420,493 | 0.08% |
| Determined by Government Mandate Contracts | 125 | 1.29% | $538,597,224 | 3.63% |
| Discretionary (Line Item) Contracts | 2,626 | 27.20% | $345,515,131 | 2.33% |
| Emergency Procurement Contracts | 193 | 2.00% | $1,102,869,886 | 7.43% |
| Government-to-Government Contracts | 35 | 0.36% | $1,918,846,108 | 12.92% |
| Innovative Procurement Contracts | 107 | 1.11% | $3,480,627,013 | 23.43% |
| Intergovernmental Procurement Contracts | 391 | 4.05% | $1,437,356,926 | 9.68% |
| Micropurchase Contracts | 1,129 | 11.70% | $12,178,901 | 0.08% |
| Negotiated Acquisition Contracts | 700 | 7.25% | $2,025,596,205 | 13.64% |
| Small Purchase Contracts – General | 3,134 | 32.47% | $101,100,092 | 0.68% |
| Small Purchase Contracts – M/WBE | 1,064 | 11.02% | $197,138,236 | 1.33% |
| Sole Source Contracts | 138 | 1.43% | $3,672,247,394 | 24.72% |
| Grand Total | 9,653 | 100.00% | $14,853,044,164 | 100.00% |
Buy-Against Contracts
Buy-Against procurements are used by City agencies to preserve the continuity of goods or service provision after a vendor defaults on their contract, or following the termination of a vendor’s contract because of a material breach to the agreement.[18] Table 9 displays information on the three Buy-Against Contracts that were registered in FY23.
Table 8: FY23 Registered Buy-Against Contracts
| Contract Number | Agency | Vendor Legal Name | Contract Purpose | Contract Registered Amount | Contract End Date |
| 20238807603 | DCAS | NORTH SHORE CHEVROLET LLC | Purchase of three Chevrolet Suburbans. | $183,387 | 8/31/2023 |
| 20231408207 | DSS/DHS | GURTEJ DHALL | Assuming the provision of services under the DHS Meal Program (Bronx). | $3,580,038 | 6/30/2023 |
| 20231408206 | DSS/DHS | RC STILLWELL LLC | Assuming the provision of services under the DHS Meal Program (Manhattan). | $5,787,128 | 6/30/2023 |
Group 3: Transactions Not Subject to PPB Rules
The contracts in Group 3 reflect transactions that are either not mentioned in the PPB rules or are otherwise explicitly excluded in Section 1-02(f). Group 3 makes up a relatively small share of the City’s contracting footprint, with just 437 registered parent contracts in FY23 totaling $496.91 million. Table 9 provides a breakdown Group 3’s subgroups by volume and value.
Table 9: Transactions Not Subject to PPB rules by Subgroup
| Subgroup | # of Contracts |
% Share of Contracts |
Total Registered Contract Value |
% Share of Contract Value |
| Force Account Contracts | 13 | 2.97% | $18,668,733 | 3.76% |
| Grant Agreements | 14 | 3.20% | $11,132,240 | 2.24% |
| Miscellaneous Contracts | 193 | 44.16% | $106,228,471 | 21.38% |
| Professional Membership Negotiation Contracts | 21 | 4.81% | $629,853 | 0.13% |
| Regulated by Government Commission | 41 | 9.38% | $332,241,388 | 66.86% |
| Subscription Contracts | 155 | 35.47% | $28,007,836 | 5.64% |
| Grand Total | 437 | 100.00% | $496,908,520 | 100.00% |
Group 4: Supplemental Contracts
The contracts in Group 4 reflect new agreements whose terms were set forth by a preceding contract. They accounted for 1,008 registrations in FY23 totaling $5.68 billion in value. This reflects almost 15% of the total procurement value registered in FY23. Table 10 provides a breakdown of Group 4’s subgroups by volume and value.
Table 10: Supplemental Contracts by Subgroup
| Subgroup | # of Contracts | % Share of Contracts | Total Registered Contract Value | % Share of Contract Value |
| Assignments | 91 | 9.03% | $728,908,357 | 12.82% |
| Renewals | 917 | 90.97% | $4,956,582,356 | 87.18% |
| Grand Total | 1,008 | 100.00% | $5,685,490,713 | 100.00% |
Group 5: Revenue Contracts
There were 183 registered Revenue contracts in FY23 totaling over $215 million in value. Group 5 also includes Corpus Funded agreements, which relate to the City’s asset management activities. Corpus Funded contracts are currently recorded in FMS as revenue transactions, but they do not actually generate revenues for the City’s general fund. Table 11 provides a breakdown Group 5’s subgroups by volume and value.
Table 11: Revenue Contracts by Subgroup
| Subgroup | # of Contracts | % Share of Contracts | Total Registered Contract Value | % Share of Contract Value |
| Concession Agreements | 74 | 40.44% | $34,008,018 | 15.81% |
| Revocable Consents | 84 | 45.90% | $10,519,044 | 4.89% |
| Corpus Funded Agreements | 19 | 10.38% | $163,446,314 | 76.00% |
| Other Revenue | 6 | 3.28% | $7,075,000 | 3.29% |
| Grand Total | 183 | 100.00% | $215,048,375 | 100.00% |
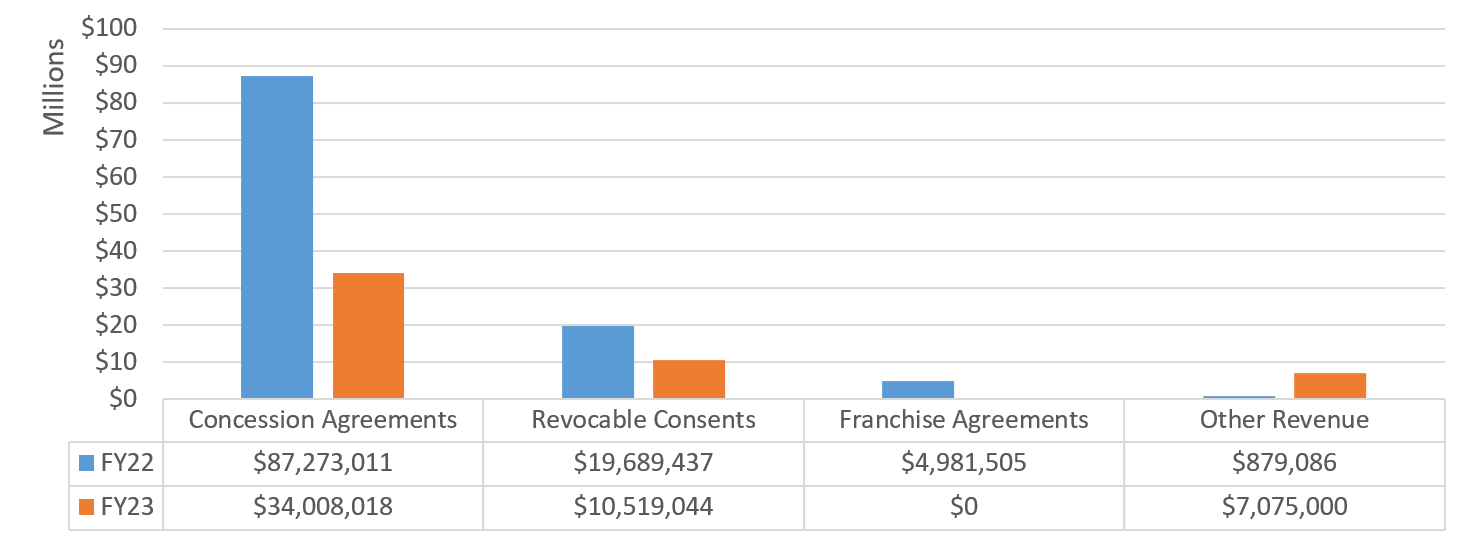
Chart 7 presents a year-over-year comparison of registered revenue contracts by category. There were no new registered Franchise Agreements in FY23.
Chart 7: FY22-FY23 Revenue Totals[19]
III. Real Property Transactions Trends
Section III presents data trends relating to Real Property Transactions, which are non-revenue contracts that are also not defined as procurements in either Chapter 13 of the City Charter or in the PPB rules. There were 98 Real Property contracts registered in FY23 for a total value of $655,732,744. Table 12 provides a breakdown by award method.
Table 12: FY23 Registered Real Property Contracts by Award Method
| Award Method | # of Contracts | % Share of Contracts | Total Contract Value | % Share of Contract Value |
| Lessee Negotiation | 76 | 77.55% | $634,468,819 | 96.76% |
| Watershed Land Negotiation | 22 | 22.45% | $21,263,925 | 3.24% |
| Grand Total | 98 | 100.00% | $655,732,744 | 100.00% |
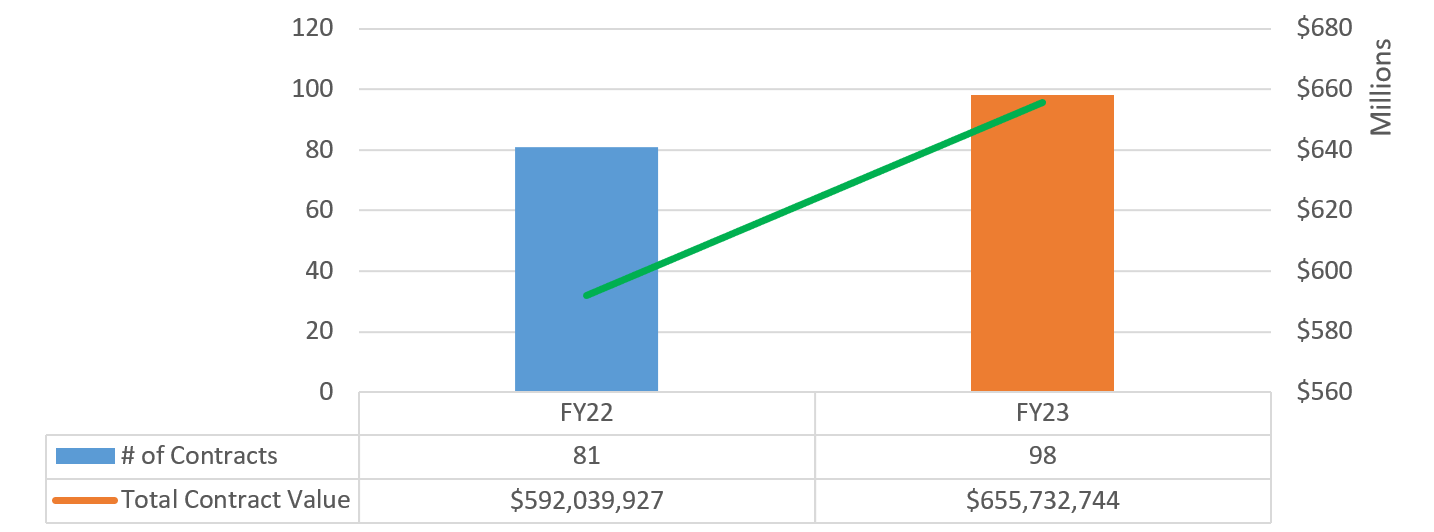
Chart 8 displays Real Property contract volume and value trends across FY22 and FY23. There were modest increases in the number and value of these contracts in FY23.
Chart 8: FY22-23 Registered Real Property Contracts by Volume and Value
Real Property Transactions by Agency
23 City agencies administered real property transactions in FY23. While the City Council made up the largest share of these contracts by volume, DCAS accounted for over a quarter of city’s registered contract value in this category. Table 13 provides a breakdown of transactions by Agency.
Table 13: FY23 New Real Property Transactions by Agency
| Agency | # of Contracts | % Share of Contracts | Total Contract Value | % Share of Contract Value |
| ACS | 1 | 1.02% | $3,305,237 | 0.50% |
| BKCB16 | 1 | 1.02% | $24,005 | 0.00% |
| BKLYN CB #1 | 1 | 1.02% | $33,190 | 0.01% |
| CC | 34 | 34.69% | $2,698,691 | 0.41% |
| CUCF | 3 | 3.06% | $1,327,168 | 0.20% |
| DAKINGS | 1 | 1.02% | $761,639 | 0.12% |
| DCAS | 7 | 7.14% | $167,762,711 | 25.58% |
| DEP | 24 | 24.49% | $57,661,148 | 8.79% |
| DFTA | 1 | 1.02% | $10,975,590 | 1.67% |
| DOF | 2 | 2.04% | $22,453,299 | 3.42% |
| DOHMH | 1 | 1.02% | $659,354 | 0.10% |
| DOP | 4 | 4.08% | $638,751 | 0.10% |
| DOT | 1 | 1.02% | $149,027,404 | 22.73% |
| DSNY | 3 | 3.06% | $143,098,440 | 21.82% |
| FDNY | 2 | 2.04% | $20,259,358 | 3.09% |
| HPD | 1 | 1.02% | $4,316,580 | 0.66% |
| HRA | 2 | 2.04% | $56,611,157 | 8.63% |
| LAW | 2 | 2.04% | $6,596,509 | 1.01% |
| MAN CB #12 | 1 | 1.02% | $1,126,715 | 0.17% |
| MAYOR | 2 | 2.04% | $1,283,371 | 0.20% |
| NCYEM | 1 | 1.02% | $1,187,414 | 0.18% |
| NYPD | 2 | 2.04% | $1,017,625 | 0.16% |
| OTI | 1 | 1.02% | $2,907,388 | 0.44% |
| Grand Total | 98 | 100.00% | $655,732,744 | 100.00% |
IV. Contract Modifications and Administration Trends
Section IV presents data trends relating to modification and contract administration trends.
Modifications
Agencies are authorized to change certain aspects of existing registered agreements, such as:[20]
- Updating contract amounts to reflect additional authorized or omitted work.
- Extending the duration of a contract for good and sufficient cause (generally not for longer than an additional year).
- Administrative reasons, such as encumbering funds to expense contracts or revising commodity and accounting lines.
Any change that requires a material alteration to the scope of work outlined in an initial contract’s terms cannot be resolved by a modification. The agency must instead procure a new contract in such cases.
Table 14 below presents the share of modifications registered by the type of modification.
Table 14: FY23 Analysis of Registered Modifications By Category
| Modification Category | Total # of Registered Modifications | % Share of Registered Modifications |
| Change-in-Amount Only | 8,475 | 10.87% |
| Change in Duration Only | 1,429 | 1.83% |
| Change in Both Duration & Amount | 1,623 | 2.08% |
| Administrative Change Only | 66,458 | 85.22% |
| Grand Total | 77,985 | 100.00% |
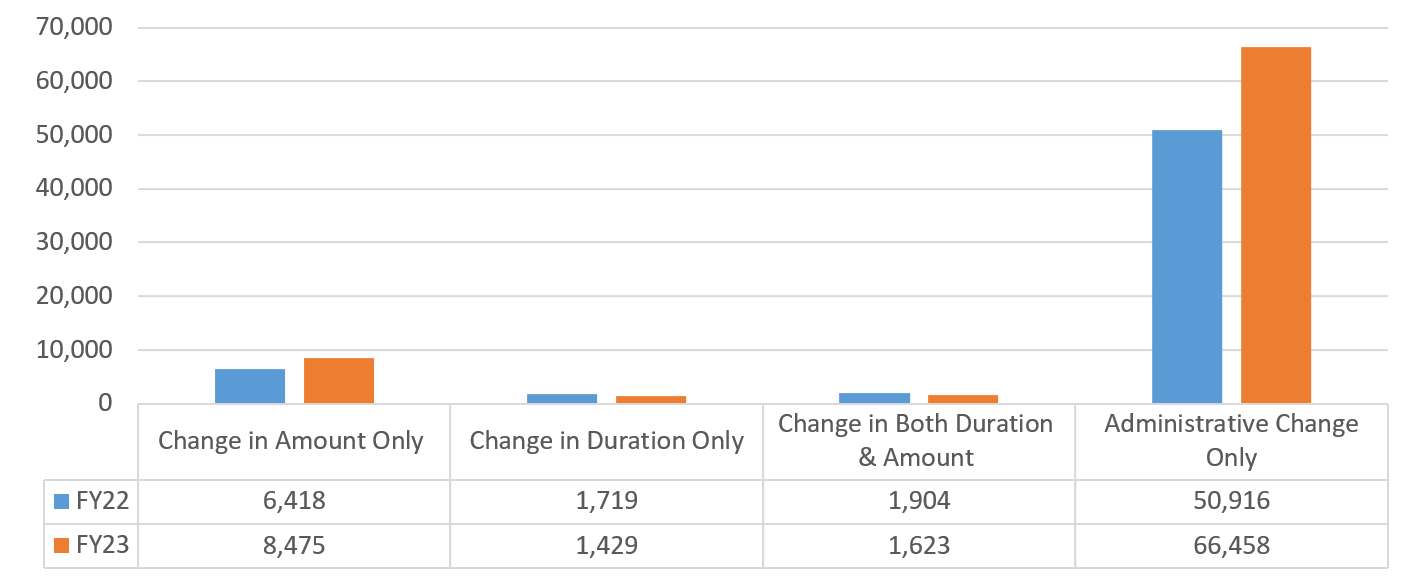
Chart 9 shows year-over-year registered modification trends by category. Notably, the number of Change-in-Amount modifications increased by over two thousand actions in FY23. The total value of FY23 change-in-amount modifications was $9.59 billion, which exceeded last year’s total by $1.17 billion. This increase was largely driven by DCAS, which registered 800 more change-in-amount modifications in FY23 over the prior year, most of which were related to its COMPASS Programs. Similarly, the DOE registered over 700 more change-in-amount modifications in FY23, many of which were related to early childhood programs.
Chart 9: FY22-23 Registered Modifications by Category
FY23 BCA-Registered Contract Modifications by Agency
While agencies have been delegated to self-register some contract modifications, many must be submitted to this Office’s Bureau of Contract Administration (BCA) for review and registration. Over 75% of the modifications that BCA registered in FY23 were administered by just ten agencies. DYCD modified the most BCA-registered contracts with 2,541 actions. Table 15 below displays the top ten agencies by volume of BCA registered actions.
Table 15: Top Ten Agencies with BCA-Registered Modifications in FY23
| Agency | # of BCA-Registered Modifications | % Share of BCA-Registered Modifications |
| DYCD | 2,541 | 23.12% |
| DDC | 1,781 | 16.21% |
| DEP | 735 | 6.69% |
| DPR | 645 | 5.87% |
| DOHMH | 570 | 5.19% |
| DOE | 507 | 4.61% |
| DCAS | 454 | 4.13% |
| DOT | 445 | 4.05% |
| ACS | 395 | 3.59% |
| HRA | 374 | 3.40% |
| Grand Total | 8,447 | 76.86% |
When isolating change-in-amount modifications, DYCD was the source of the most BCA-registered modifications with 2,532. Most of DYCD’s modifications were registered against contracts having to do with the COMPASS program. See Table 16 below for a breakdown by top ten agencies.
Table 16: Top Ten Agencies with BCA-Registered Change-In-Amount Modifications
| Agency | # of Modifications | % Share of Modifications |
| DYCD | 2,532 | 32.41% |
| DDC | 1,033 | 13.22% |
| DOE | 491 | 6.28% |
| DPR | 411 | 5.26% |
| DOHMH | 393 | 5.03% |
| ACS | 371 | 4.75% |
| DEP | 313 | 4.01% |
| DFTA | 284 | 3.63% |
| HRA | 233 | 2.98% |
| NYCHA | 225 | 2.88% |
| Grand Total | 6,286 | 80.46% |
Construction Change Orders
Construction change orders (CCO) reflect a subset of the modification data discussed above, although the data below includes additional CCOs that were not registered by the Comptroller’s Office.[21] CCOs are typically used to authorize non-material additional labor and/or equipment needed to complete a construction project. As shown in Chart 10, CCOs increased in both volume and value in FY23.
Chart 10: FY22-FY23 CCOs by Volume and Value

Table 17 reflects the top-five agencies using CCOs by volume. These five agencies comprised over 79.40% of the CCO volume in FY23.
Table 17: Top Five Agencies with FY23 Registered CCOs, by Volume
| Agency | # of Registered CCOs | % Share of FY23 Registered CCOs |
| DDC | 1,012 | 31.01% |
| HPD | 500 | 15.32% |
| DEP | 439 | 13.45% |
| DPR | 431 | 13.21% |
| DOT | 209 | 6.41% |
| Grant Total | 2,591 | 79.40% |
Similarly, Table 18 shows only change-in-amount CCOs.
Table 18: Change-in-Amount CCOs for the Top Five Agencies With FY23 CCOs, by Volume
| Agency | # of Registered CCOs | Average Original Contract Value | Average Revised Contract Value |
| DDC | 654 | $39,962,352 | $42,712,535 |
| DPR | 319 | $5,156,019 | $6,214,363 |
| DEP | 209 | $113,486,240 | $127,074,447 |
| NYCHA | 119 | $4,276,911 | $6,044,538 |
| EDC | 107 | $6,823,382 | $14,870,321 |
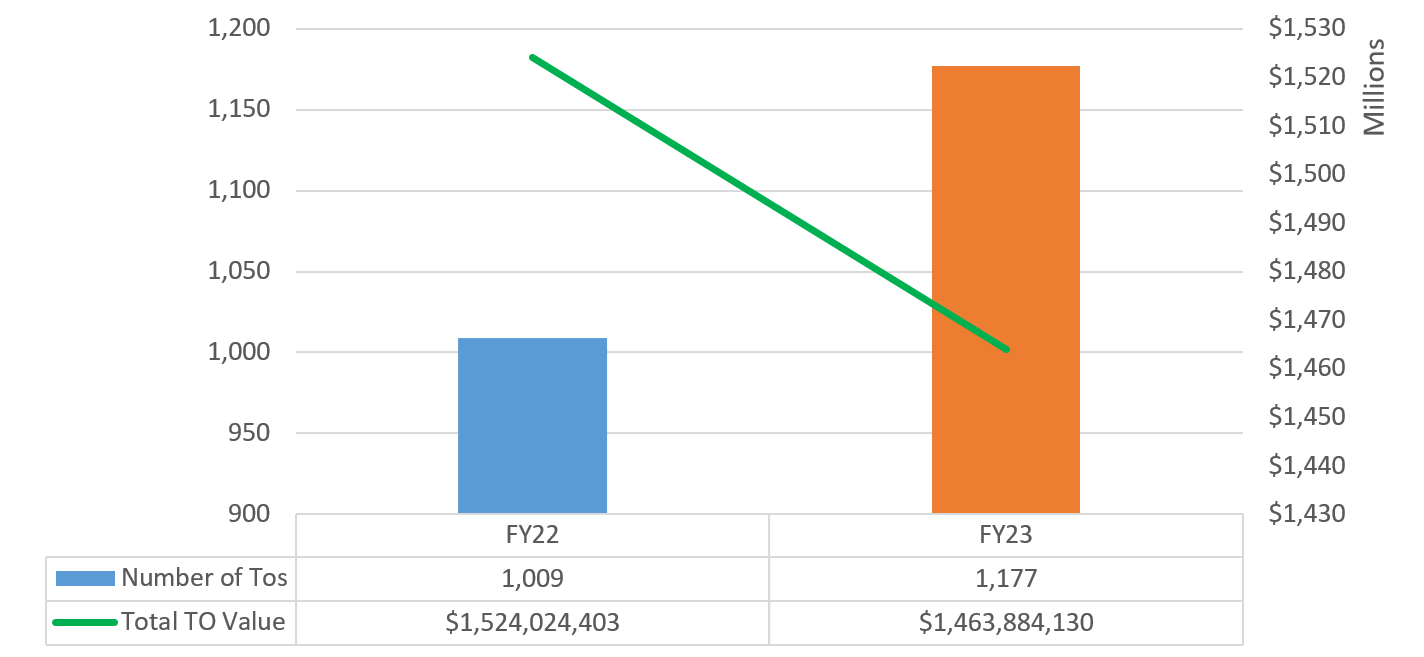
Task Orders
Agencies registered 1,177 TOs in FY23, against 315 Multiple Master Agreements for a total value of $1,463,884,130. 156 of these TOs were registered to EDC under a single SBS agreement.[22] Although the volume of registered TOs increased in FY23, their total value declined relative to FY22. Chart 11 below displays the volume and value of registered TOs in FY22 and FY23.
Chart 11: Registered Task Orders FY22-FY23
The top five agencies based on the volume of registered TOs account for over 77% of all TOs registered in FY23, and 76% of the total registered TO value. Table 19 displays the five agencies that registered the most TOs in FY23.
Table 19: Top Five Agencies by Volume of Registered TOs in FY23
| Row Labels | # of TOs | Total Registered Value |
| EDC | 310 | $570,769,639 |
| NYCHA | 286 | $181,386,580 |
| DDC | 159 | $183,786,815 |
| DPR | 107 | $88,488,216 |
| DCAS | 52 | $95,543,665 |
Purchase Orders
134,129 POs were recorded in FY23 for a total value exceeding $411 million.[23] Both figures represent an increase over FY22 levels. Table 20 reflects the number and value of POs issued in FY23 by category.
Table 20: PO Records by Category FY23
| PO Type | Total # of POs | Actual Amount | Obligation Amount Adjusted for Outyear | Available To Obligate |
| PCC1 | 11,811 | $21,158,952 | $21,158,637 | $315 |
| POD | 16,317 | $88,191,170 | $87,653,396 | $537,774 |
| POC | 106,001 | $302,421,813 | $302,241,353 | $180,434 |
| Grand Total | 134,129 | $411,771,936 | $411,053,386 | $718,523 |
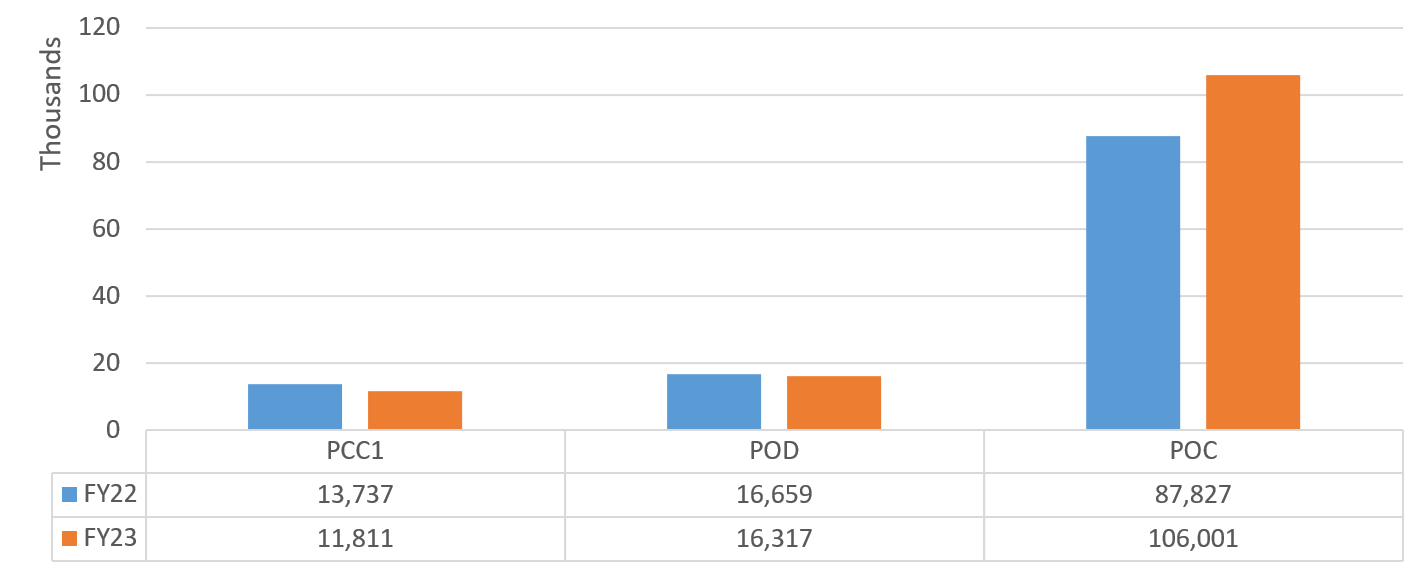
Chart 12 compares the volume of POs issued in FY22 and FY23 by Category. Nearly 20 thousand additional POs were issued in FY23 relative to FY22 levels.
Chart 12: FY22-FY23 Volume of POs by Category
The top-five agencies using POs in FY23, by volume, accounted for over 89% of the total share of POs processed by the City. Table 23 displays the volume and value of POs across each of these agencies. DOE continued to issue the most POs in FY23, issuing nearly 20 thousand more POs than they did in the prior fiscal year.
Table 21: Top Five Agencies by Volume of Recorded POs in FY23
| Agency | # of Recorded POs | Total Value PO Actual Amount | % share of all POs |
| DOE | 102,274 | $269,396,923 | 76.25% |
| HPD | 11,780 | $ 18,263,136 | 8.78% |
| NYPD | 2,627 | $14,707,961 | 1.96% |
| DEP | 1,784 | $18,309,945 | 1.33% |
| DPR | 1,537 | $9,410,949 | 1.15% |
| Grand Total | 120,002 | $330,088,914 | 89.47% |
V. Emergency Procurement Trends
Section V presents data trends relating to procurement methods used by the City to respond quickly in the event of emergencies.[24]
Emergency Procurement Method Actions
The City processed 193 contracts via the Emergency Procurement method in FY23 for a total value of $1,102,869,886. Although there was a decline in the # of emergency contracts in FY23 relative to FY22, the value of emergency procurements in FY23 increased by over $81 million. This is likely related to higher-value contracts associated with the influx of asylum seekers. Chart 13 displays the number and value of Emergency contracts filed in FMS across FY22 and FY23 respectively.
Chart 13: FY22-23 Emergency Contracts by Volume and Value
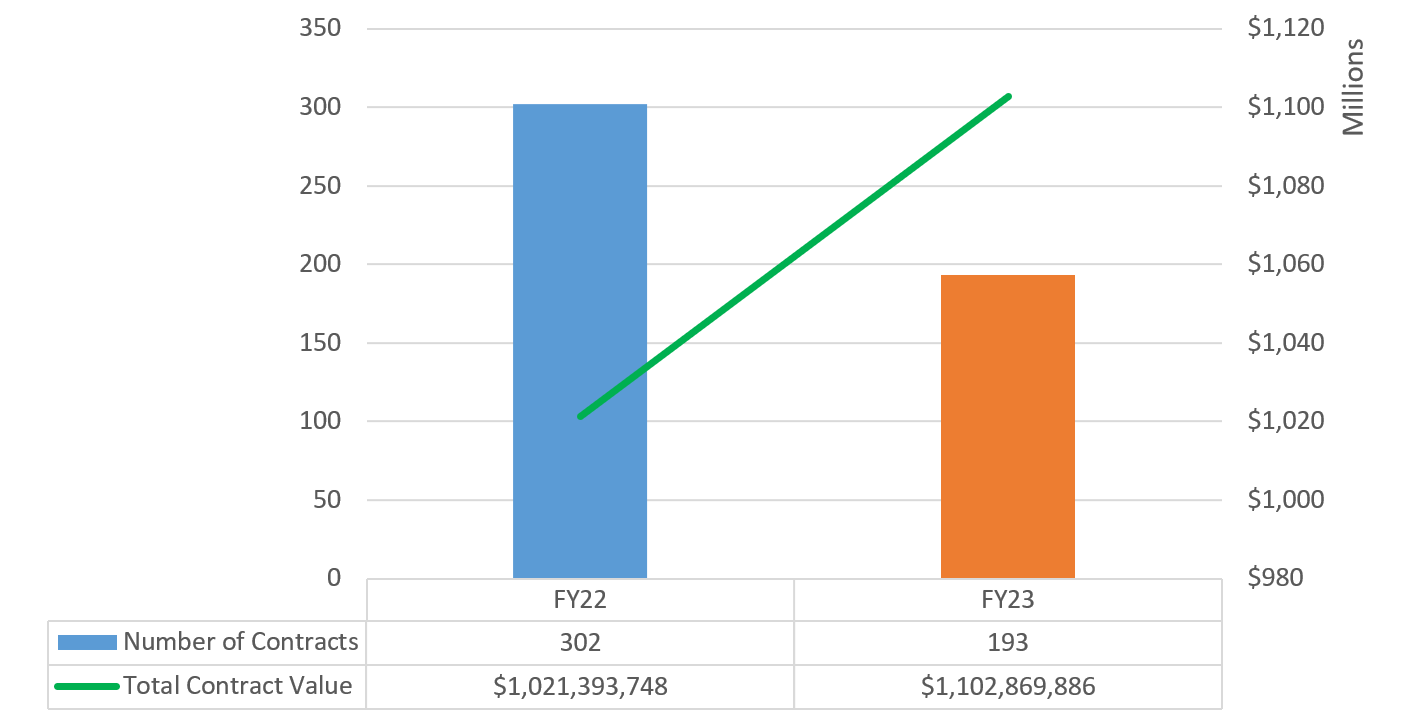
Table 22 displays the top five agencies by volume of new emergency contracts. Together, these agencies account for nearly 90% of all emergency procurements in FY23. HPD continues to be the largest driver of these contracts since it is tasked with hiring contractors to conduct emergency building demolitions.
Table 22: FY23 Emergency Procurements Volume by Top Five Agencies
| Agency | # of Contracts | % Share of Contracts |
| HPD | 77 | 39.90% |
| DHS | 49 | 25.39% |
| DOHMH | 36 | 18.65% |
| DOE | 7 | 3.63% |
| DEP | 4 | 2.07% |
| Grand Total | 173 | 89.64% |
Table 23 similarly lists the top five agencies by value of new emergency contracts. Once again, the top five agencies account for about 90% of the total emergency contract value in FY23. DSS/DHS shelter services contracts made up the highest share of contract value. This is because DSS/DHS, whose agency mission is to provide temporary shelter for those in need, is leading the City’s contracting for emergency shelter services for newly arrived asylum seekers
Table 23: FY23 Emergency Procurements Value by Top Five Agencies
| Agency | Total Contract Value | % Share of Emergency Contract Value |
| DSS/DHS | $601,381,111 | 54.53% |
| DOE | $195,762,781 | 17.75% |
| NYCEM | $135,717,111 | 12.31% |
| HPD | $34,498,186 | 3.13% |
| SBS | $30,000,000 | 2.72% |
| Grand Total | $997,359,189 | 90.43% |
Table 24 provides a breakdown of modifications to emergency contracts that were filed in FY23. As was the case with new emergency contracts, there were fewer emergency modifications in FY23 relative to the prior fiscal year.
Table 24: FY23 Emergency Contract Modifications, by Category
| Type of Modification | Number of Emergency Modifications |
| Change To Amount Only | 30 |
| Change To Duration Only | 24 |
| Change to Both Amount and Duration | 66 |
| Administrative Change Only | 708 |
| Grand Total | 828 |
Asylum-Related Emergency Contracts Processed in FY23
New York City has welcomed tens of thousands of asylum seekers since spring of 2022, entering into contracts across many agencies to provide shelter, meals, medical care, and legal assistance to new arrivals. Five agencies filed emergency contracts related to supports for asylum seekers in FY23, for a total value of $805.88 million. Table 25 below provides a breakdown by agency.
Table 25: FY23 Emergency Asylum-Related Contracts by Agency
| Agency | # of Contracts | Contract Value |
| DSS/DHS | 49 | $601,381,111 |
| DSS | 2 | $14,947,988 |
| OTI | 2 | $54,272,865 |
| NYCEM | 1 | $135,000,000 |
| DDC | 1 | $278,078 |
| Grand Total | 55 | $805,880,042 |
The Comptroller’s office was tracking 194 unique contract actions (including non-emergency contracts) related to these services as of July 31, 2023. A list of these contracts and related information is being periodically refreshed on the Comptroller’s Office website.
VI. Procurement Actions by Industry
PPB Rules and other applicable procurement rules define several industries that are frequently used by the City to support the analysis of procurement trends. Industry classifications provide another perspective to understand where the City is investing its resources. Section VI of this Report examines FY23 procurements across the following industries:
- Construction Services
- Goods
- Human Services
- Professional Services
- Standard Services
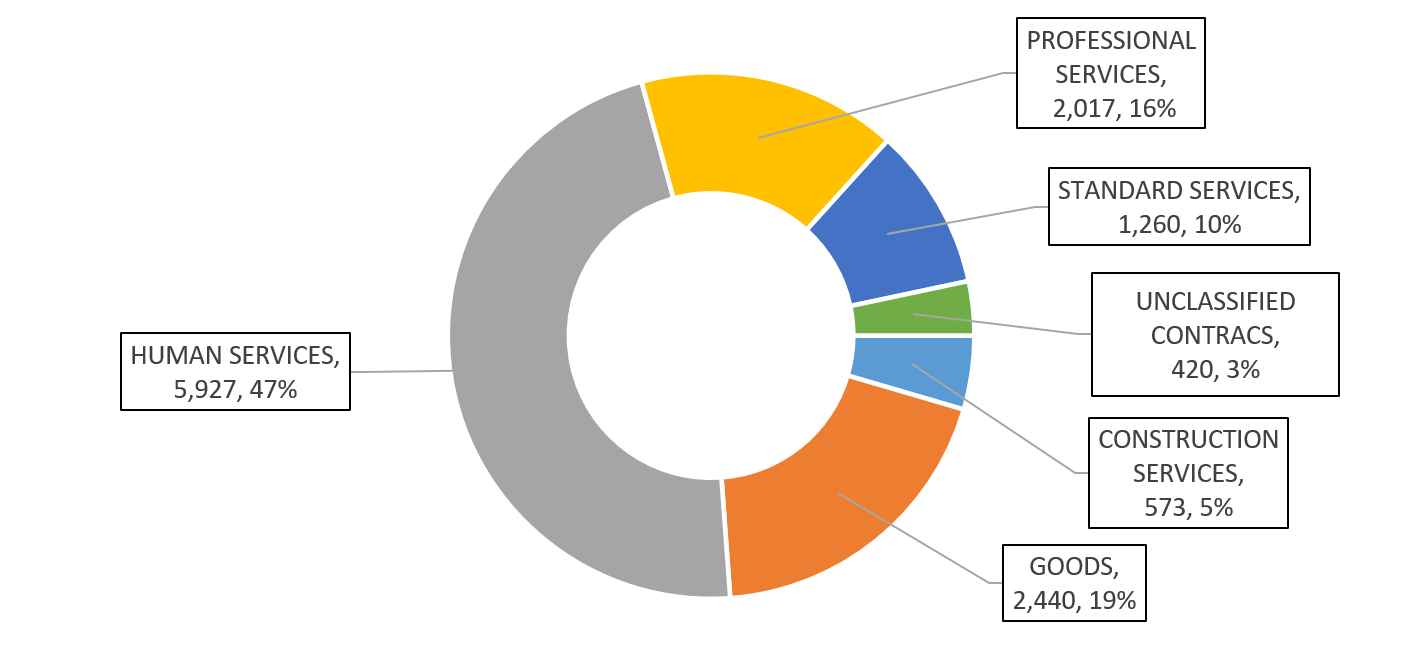
Industry classifications were assigned using rules employed by Checkbook NYC based on contract characteristics such as award category, contract type, and expense category. 12,217 procurement contracts were mapped to one of the above industries classifications using Checkbook NYC’s rules for a total value of $37.65 billion. Additionally, 420 procurement contracts, with a total registered value of $349.82 million, could not be classified into an industry group. Chart 14 below provides a comparison of registered contract value by industry.
Chart 14: Share of Registered New Procurement Contract Value by Industry
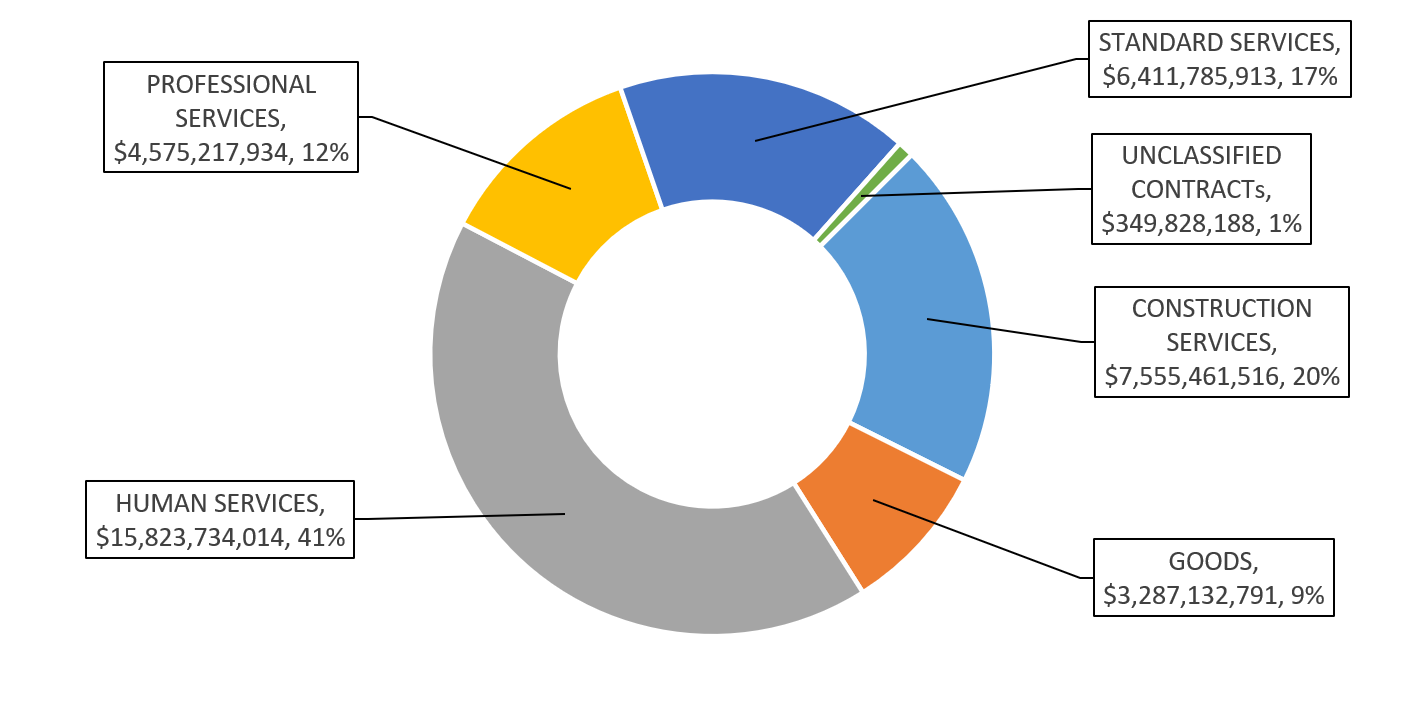
Relatedly, Chart 15 lays out the volume of new procurement contracts by industry. The Construction and Standard Service industries make up a greater share of registered procurement value than they do of the city’s procurement volume, indicating that their contracts tend to be larger in value relative to the contracts in other industries.
Chart 15: Share of Registered New Procurement Contract Volume by Industry
Construction Services
PPB Rules define the Construction Service industry as dealing in the planning, design, or construction of real property or other public improvements.[25] In addition to engineering and construction work, this industry also includes contracts for painting, carpentry, plumbing and electrical installation, asbestos and lead abatement, carpet installation and removal, and demolition.
The Comptroller’s Office has been working alongside City Hall as a part of the Capital Process Task Force to undertake a comprehensive review of the City’s capital process and advocate for recommendations to streamline the city’s procurement of construction (and other capitally funded) services. The recommendations of this Task Force aim to reduce timelines for capital project completion, achieve taxpayer savings, enhance vendor participation and inclusion in the construction industry, and increase the City’s capacity to address emerging needs. Additionally, the Comptroller’s Office is working with several City construction agencies to allow for broader usage of the expanded work allowance (EWA), which is a funded, pre-registered allowance in a construction contract that leads to shorter CCO processing times and the ability to make faster payments to contractors.
The 573 new procurement contracts registered in FY23 under the Construction Services industry account for only 5% of procurement contracts by volume, but the $7.55 billion associated with these contracts makes up nearly 20% of FY23’s registered procurement value in FY23. Table 26 lists the top ten construction service industry contracts registered in FY23.
Table 26: FY23 Top Ten Construction Service Industry Procurement Contracts, by Value
| Contract # | Agency | Vendor Legal Name | Award Method Description | Contract Purpose | Contract Registered Amount | Contract End Date |
| 20238807786 | DDC | Tutor Perini Corporation | Innovative Procurement | Design Build Program – NYC Borough Based Jail System, Brooklyn. | $2,958,933,292 | 9/3/2029 |
| 20228808498 | MAYOR | Dormitory Authority State Of NY | Government To Government | Development of phase 2 of the Staten Island Master Plan and the renovation of the New York County State Supreme Court Building. | $606,911,727 | 6/30/2032 |
| 20238803094 | DDC | John P Picone Inc. | Competitive Sealed Bidding | Installation of Brooklyn Bridge costal resiliency structures. | $349,000,000 | 9/29/2026 |
| 20238805276 | DEP | Gowanus Canal Constructors | Competitive Sealed Bidding | Construction of combined sewage overflow facilities for the Gowanus Canal. | $329,311,000 | 2/15/2027 |
| 20238803080 | DOT | Skanska Koch Inc | Competitive Sealed Bidding | Reconstruction of Williamsburg Bridge and miscellaneous rehabilitation. | $167,590,554 | 6/21/2025 |
| 20238803058 | DDC | Lendlease Us Construction LMB Inc. | Innovative Procurement | Design-Build project for the development of the Shirley Chisholm Recreation Center in Brooklyn | $130,986,000 | 12/21/2025 |
| 20238802753 | DEP | Jett Industries Inc. | Competitive Sealed Bidding | Reconstruction of Primary Tanks at the Wards Island waste water treatment plant. | $123,296,000 | 1/4/2027 |
| 20238806570 | DDC | Scalamandre-Tully JV | Innovative Procurement | Design-Build project for the Harper St. administrative building in Queens. | $120,648,807 | 9/23/2026 |
| 20238805489 | DDC | Gilbane Building Company | Innovative Procurement | Design-Build project for the Boyland Community Multi-Service Center in Brooklyn. | $119,000,000 | 8/13/2026 |
| 20238806874 | DDC | Inter Laperuta JV | Competitive Sealed Bidding | For the construction of storm sewers and appurtenances in Idlewild Park. | $78,566,121 | 4/16/2026 |
Goods
The Goods industry is made up of contracts for physical items and personal property, including but not limited to equipment, materials, printing, and insurance.[26] Procurements related to consumables such as food and fuel may also fall into the goods industry. Under the Charter, DCAS is responsible for procuring all goods, supplies, materials, equipment, and other personal property on behalf of city agencies, unless such authority has been otherwise delegated.[27] On occasion, DCAS delegates the procurement of a specific good to a particular agency when it’s in the City’s best interests, subject to the approval of the DCAS Commissioner and the Comptroller.[28] For example, DCAS authorized agencies to make goods purchases using the M/WBE Noncompetitive Small Purchase method up to $1.5 million to allow agencies to encourage greater M/WBE participation on contracts.
In FY23, 2,440 contracts were registered within the Goods industry for a total value of $3.28 billion. This accounts for 8.65% of the total registered procurement value in FY23. Table 27 provides a list of the top ten goods contacts, by value.
Table 27: FY23 Top Ten Goods Industry Procurement Contracts, by Value
| Contract # | Agency | Vendor Legal Name | Award Method Description | Contract Purpose | Contract Registered Amount | Contract End Date |
| 20238800486 | DCAS | JP Morgan Chase Bank NA | Intergovernmental Procurement | Procurement card services for agency purchases. | $464,000,000 | 10/12/2027 |
| 20238806149 | DCAS | Gabrielli Truck Sales Ltd. | Competitive Sealed Bidding | Procurement of a rear-loading collection truck with a snow hitch for DSNY. | $222,533,811 | 3/14/2028 |
| 20238802966 | DCAS | Global Environmental Products Inc. | Competitive Sealed Bidding | Procurement of four wheel street sweepers for New York City. | $156,083,177 | 9/30/2027 |
| 20238806111 | DCAS | Gabrielli Truck Sales Ltd. | Competitive Sealed Bidding | Procurement of a dual compartment rear loading truck. | $148,764,066 | 3/14/2028 |
| 20245000061 | DCAS | Consolidated Edison Company Of New York Inc. | Public Utility | Purchase of natural gas on behalf of various city agencies | $133,593,168 | 6/30/2024 |
| 20239377085 | DOE | Houghton Mifflin Harcourt Publishing Company | Dept Of Ed Listing Application | Purchase of textbooks & ancillary materials. | $123,232,632 | 10/31/2029 |
| 20245000062 | DCAS | The Brooklyn Union Gas Company | Public Utility | Purchase of natural gas on behalf of various city agencies. | $87,334,411 | 6/30/2024 |
| 20239376547 | DOE | B & H Foto & Electronics Corp | Competitive Sealed Bidding | Procurement of audio-visual equipment and computer peripherals. | $74,220,798 | 7/31/2027 |
| 20245000063 | DCAS | Consolidated Edison Company Of New York Inc. | Public Utility | Purchase of steam for use at various agency buildings. | $70,966,939 | 6/30/2024 |
| 20238807668 | DCAS | Kuehne Chemical Company, Inc. | Accelerated Procurement | To procure sodium hypochlorite for various wastewater resources. | $66,168,500 | 4/30/2026 |
Human Services
The Human Services Industry encompasses services that are provided directly to clients in various at-need groups. Examples of Human Services include but are not limited to: day care, foster care, mental health treatment, operation of senior centers, home care, employment training, homeless assistance, preventive services, health maintenance organizations, and youth services.[29] Vendors in this category are primarily nonprofit organizations although services like home and early childcare services are also offered by for-profit businesses.
The Comptroller’s Office is participating in a Joint Task Force to Get Non-Profits Paid on Time, which has developed five recommendations to reform the City’s procurement process and ensure that nonprofits are paid on time, in full, and with certainty so they can keep doing their jobs of meeting the needs of New Yorkers.
Human Service Industry contracts made up the largest share by both volume of contracts and contract value in FY23. The 5,927 Human Service contracts accounted for nearly 47% of registered procurements and amounted to $15.82 billion in total value. Table 28 provides a list of the top Ten Human Service Industry Contacts, by value, all associated with shelter services under DSS/DHS.
Table 28: FY23 Top Ten Human Services Industry Procurement Contracts, by Value
| Contract # | Agency | Vendor Legal Name | Award Method Description | Contract Purpose | Contract Registered Amount | Contract End Date |
| 20238802667 | DSS/DHS | HELP Social Service Corporation | RFP From a PQVL | Shelter facility for homeless families with children. | $489,190,529 | 6/30/2055 |
| 20238808538 | DSS/DHS | HELP Social Service Corporation | RFP From a PQVL | Shelter facility for homeless single adults. | $467,858,423 | 6/30/2056 |
| 2023880437 | DSS/DHS | Project Renewal Inc | RFP From a PQVL | Shelter facility for homeless single adults. | $467,334,567 | 6/30/2056 |
| 20238803025 | DSS/DHS | Urban Resource Institute | RFP From a PQVL | Shelter facility for homeless families with children. | $375,607,033 | 6/30/2053 |
| 20231406241 | DSS/DHS | Bowery Residents’ Committee, Inc. | RFP From a PQVL | Shelter facility for homeless families with children. | $364,416,055 | 6/30/2054 |
| 20238804003 | DSS/DHS | WESTHAB, Inc. | RFP From a PQVL | Shelter facility for homeless families with children. | $328,950,889 | 6/30/2055 |
| 20238804160 | DSS/DHS | Care For The Homeless | RFP From a PQVL | Shelter facility for homeless single adults. | $317,499,022 | 6/30/2054 |
| 20238804456 | DSS/DHS | Women In Need, Inc. | RFP From a PQVL | Shelter facility for homeless families with children. | $316,387,674 | 6/30/2055 |
| 20238808453 | DSS/DHS | WESTHAB, Inc. | RFP From a PQVL | Shelter facility for homeless single adults. | $290,246,446 | 6/30/2055 |
| 20238805437 | DSS/DHS | HANYC Foundation Inc | Emergency | To secure hotel sites for asylum seekers | $237,250,000 | 8/31/2023 |
Professional Services
The Professional Services industry includes contracts for the provision of various kinds of expert advice and consulting, including legal services, medical services and information technology and construction-related consulting.[30]
2,017 contacts associated with the Professional Services industry were registered in FY23, accounting for 15.96% of all registered procurements. Their $4.57 billion makes up 12.05% of the total FY23 procurement value.
Table 29 provides a list of the top ten Professional Service Industry Contacts, by value.
Table 29: FY23 Top Ten Professional Services Industry Procurement Contracts, by Value
| Contract # | Agency | Vendor Legal Name | Award Method Description | Contract Purpose | Contract Registered Amount | Contract End Date |
| 20238803029 | OTI | Motorola Solutions, Inc | Sole Source | Purchase of Motorola radios and maintenance of citywide public safety communication networks. | $323,739,667 | 2/28/2028 |
| 20238804607 | OTI | Verizon Business Network Services LLC | Renewal Of Contract | Provision of citywide telecommunications services. | $284,754,473 | 12/31/2026 |
| 20238800311 | DOHMH | Opad Media Solutions LLC | Intergovernmental Procurement | Strategic media planning, buying, and placement across various media platforms. | $243,545,240 | 9/26/2024 |
| 20238807641 | OTI | AT&T Corp | Renewal Of Contract | Provision of citywide telecommunications services. | $191,387,262 | 5/19/2027 |
| 20238802315 | DOF | First Data Merchant Services LLC | Request For Proposal (RFP) | Provision of automated clearing house, electronic check processing, and e-check account validation services. | $122,573,761 | 3/31/2027 |
| 20238802258 | DEP | McMillen JA Engineering PLLC/Brown and Caldwell Associates | Request For Proposal (RFP) | Preliminary Design Services for the Newtown Creek combined sewage overflow tunnel. | $106,661,931 | 7/30/2034 |
| 20239378810 | DOE | Willis Towers Watson Northeast Inc | Emergency | Insurance carrier and third-party administrative services. | $101,991,311 | 6/30/2021 |
| 20239377235 | DOE | Edgewood Partners Insurance Center | Emergency | Brokerage, insurance coverage and administration. | $87,400,638 | 6/30/2023 |
| 20238803744 | OEM | Citizens Committee For New York City Inc | Negotiated Acquisition | Provision of grant management and financial services for the NYC Strengthening Communities program. | $75,000,000 | 11/30/2027 |
| 20238803252 | OTI | Spruce Technology Inc | Request For Proposal (RFP) | Provision of citywide system integration services including analysis, design, architecture, development, testing, implementation, etc. | $50,000,000 | 12/31/2025 |
Standard Services
The Standard Services industry is composed of services other than Professional Services and Human/Client Services such as custodial services, security guard services, stenography services and office machine repair.[31] There were 1,260 contracts registered in the Standard Service Industry in FY23, comprising 9.97% of all procurement contracts. These contracts were for $6.41 billion in value, accounting for 16.87% of all FY23 registered procurement value. Table 30 provides a list of the top ten Standard Service Industry Contacts, by value.
Table 30: FY23 Top Ten Standard Services Industry Procurement Contracts, by Value
| Contract # | Agency | Vendor Legal Name | Award Method Description | Contract Purpose | Contract Registered Amount | Contract End Date |
| 20238804191 | EDC | New York City Economic Development Corporation | Sole Source | Citywide Economic Development Services. | $1,836,434,092.00 | 6/30/2023 |
| 20238806917 | SBS | Brooklyn Navy Yard Development Corporation | Sole Source | Provision of industrial, commercial, waterfront, maritime, and other economic Development services at the Brooklyn Navy Yard. | $529,981,983.00 | 6/30/2025 |
| 20231408687 | TRANSIT | Metropolitan Transportation Authority | Government To Government | Bus purchases and track, switch, third rail, and substation replacements. | $498,114,315.00 | 6/30/2026 |
| 20238804188 | EDC | New York City Economic Development Corporation | Sole Source | Provision of City-Wide economic development services related to maritime, rail, aviation, and market transportation. | $443,342,250.00 | 6/30/2023 |
| 20231420236 | TRANSIT | Metropolitan Transportation Authority | Government To Government | Elevator and escalator replacement. | $235,569,750.00 | 6/30/2023 |
| 20231409993 | TRANSIT | Metropolitan Transportation Authority | Government To Government | Bridge reconstruction & substation replacement | $205,826,035.00 | 6/30/2023 |
| 20231415707 | TRANSIT | Metropolitan Transportation Authority | Government To Government | Escalator Replacements. | $200,489,900.00 | 6/30/2023 |
| 20238802986 | DEP | Clean & Green Recycling Corp | Negotiated Acquisition and DOE Negotiated Services | Processing of biosolids from various waste water treatment and water resource recovery facilities. | $121,069,669.77 | 6/30/2032 |
| 20238802367 | SBS | NYC & Company, Inc. New York Convention & Visitors | Sole Source | Citywide economic development marketing and tourism. | $94,647,392.00 | 6/30/2026 |
| 20238805244 | FDNY | Digitech Computer LLC | Request For Proposal (RFP) | Provision of invoicing, dunning, and litigation services to support the FDNY ambulance transport invoicing unit. | $66,769,150.00 | 1/31/2030 |
VII. Procurements by Agency Type
City agencies, affiliated agencies, elected officials, and the City Council all take part in the contracting process. Procurements via new contracts and TOs were registered to 65 separate entities in FY23.[32] Section VII of this report examines contracting trends by industry and contract group for each procuring entity. It also compares new procurement contracts registered to agencies operating under the Mayor’s Office (Mayoral Agencies), independent City agencies (Non-Mayoral Agencies), and a collection of state agencies, authorities, boards, libraries, and other corporations that perform public functions in NYC (Other Agencies).[33]
With 63.07% of all new procurement contracts, City – Mayoral Agencies were the biggest driver of new contract registrations by volume in FY23. They also accounted for 79.07% of FY23 procurement contract value. Table 31 displays new procurements, by volume and value, across agency type.
Table 31: FY23 New Procurement Contracts and Task Orders by Agency Type
| Agency Type | # of Contracts | % of Contracts | Total Registered Contract Value | % Share Of Registered Contract Value |
| City – Mayoral Agency | 8,346 | 63.07% | $30,645,371,859 | 79.07% |
| City – Non-Mayoral | 600 | 4.53% | $138,883,923 | 0.36% |
| Other Agency | 4,287 | 32.40% | $7,971,060,793 | 20.57% |
| Grand Total | 13,233 | 100.00% | $38,755,316,576.10 | 100.00% |
City Mayoral Agencies
Every Mayoral Administration directly oversees and appoints department heads for a number of City agencies. Table 32 displays information on new procurement contracts registered to each Mayoral Agency.
Table 32: FY23 New Procurement Contracts by Mayoral Agency
| Agency | # of Contracts | % Share of Contracts | Total Contract Value | % Share of Contract Value |
| ACS | 439 | 5.26% | $3,655,718,153.56 | 11.93% |
| BIC | 2 | 0.02% | $113,129.00 | 0.00% |
| CCHR | 5 | 0.06% | $1,817,740.50 | 0.01% |
| CCRB | 14 | 0.17% | $498,620.03 | 0.00% |
| DCAS | 621 | 7.44% | $2,483,908,055.53 | 8.11% |
| DCLA | 16 | 0.19% | $8,290,877.68 | 0.03% |
| DCP | 16 | 0.19% | $13,066,034.55 | 0.04% |
| DCWP | 17 | 0.20% | $11,604,047.44 | 0.04% |
| DDC | 216 | 2.59% | $5,278,552,894.76 | 17.22% |
| DEP | 285 | 3.41% | $1,868,415,605.70 | 6.10% |
| DFTA | 634 | 7.60% | $266,228,489.87 | 0.87% |
| DOB | 30 | 0.36% | $13,530,588.32 | 0.04% |
| DOC | 110 | 1.32% | $103,279,039.16 | 0.34% |
| DOF | 72 | 0.86% | $269,083,774.27 | 0.88% |
| DOHMH | 1311 | 15.71% | $1,354,291,758.09 | 4.42% |
| DOI | 11 | 0.13% | $878,925.10 | 0.00% |
| DOP | 58 | 0.69% | $27,696,859.40 | 0.09% |
| DORIS | 4 | 0.05% | $396,698.87 | 0.00% |
| DOT | 229 | 2.74% | $1,025,142,731.60 | 3.35% |
| DPR | 409 | 4.90% | $728,027,130.16 | 2.38% |
| DSNY | 115 | 1.38% | $230,660,657.59 | 0.75% |
| DSS/DHS | 232 | 2.78% | $7,131,954,725.58 | 23.27% |
| DSS/HRA | 485 | 5.81% | $1,067,573,413.21 | 3.48% |
| DYCD | 1567 | 18.78% | $437,014,436.87 | 1.43% |
| FDNY | 107 | 1.28% | $154,701,894.40 | 0.50% |
| HPD | 273 | 3.27% | $132,645,284.66 | 0.43% |
| LAW | 72 | 0.86% | $88,126,099.19 | 0.29% |
| LPC | 2 | 0.02% | $67,230.00 | 0.00% |
| MAYOR | 259 | 3.10% | $1,624,177,540.65 | 5.30% |
| NYCEM | 50 | 0.60% | $329,081,409.94 | 1.07% |
| NYPD | 273 | 3.27% | $161,759,741.55 | 0.53% |
| OTI | 233 | 2.79% | $1,375,363,275.01 | 4.49% |
| SBS | 169 | 2.02% | $697,306,155.57 | 2.28% |
| TLC | 10 | 0.12% | $104,398,841.52 | 0.34% |
| Grand Total | 8,346 | 100.00% | $30,645,371,859.33 | 100.00% |
Administration for Children’s Services (ACS)
The Administration for Children’s Services (ACS) protects and promotes the safety and well-being of New York City’s children, young people, families, and communities by providing child welfare, juvenile justice, foster care, early care, and education services.
Table 33 – ACS: FY22-FY23 Registrations by Contract Category
| FY22 | FY23 | |||
|---|---|---|---|---|
| Contract Category | # of Contracts | Total Contract Value | # of Contracts | Total Contract Value |
| Competitive Method Contracts | 12 | $37,907,774 | 62 | $2,400,819,648 |
| Limited or Non-Competitive Method Contracts | 282 | $459,400,680 | 227 | $334,167,308 |
| Transactions Not Subject to PPB Rules | 16 | $941,200 | 3 | $461,000 |
| Supplemental Contracts | 40 | $314,583,237 | 147 | $920,270,198 |
| Grand Total | 350 | $812,832,891 | 439 | $3,655,718,154 |
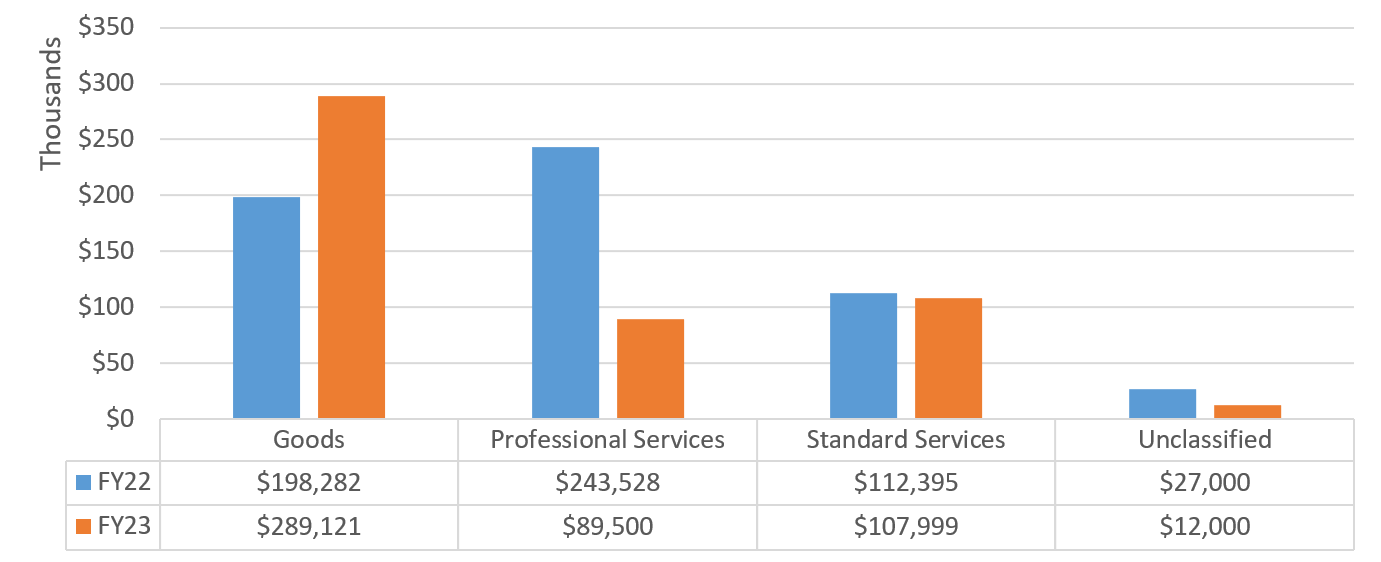
Chart 16 – ACS: FY22-FY23 Volume of Contracts by Industry
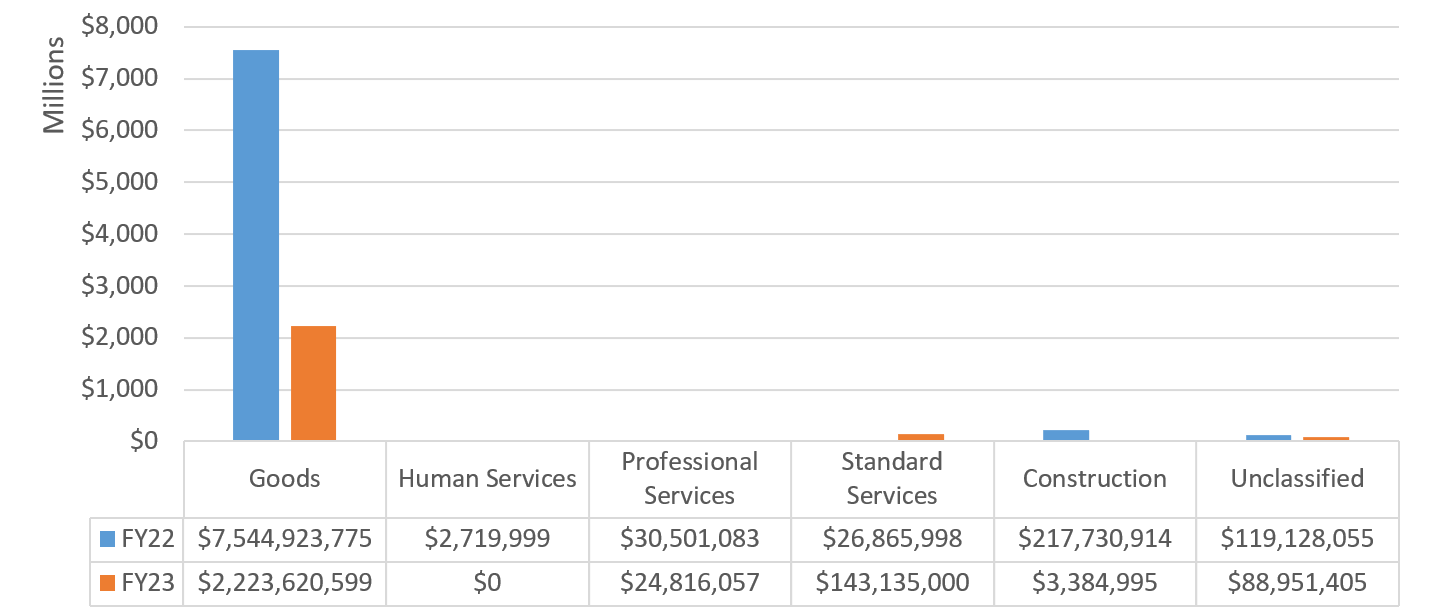
Chart 17 – ACS: FY22-FY23 Value of Contracts by Industry
Business Integrity Commission (BIC)
The Business Integrity Commission (BIC) is a law enforcement and regulatory agency charged with oversight of the private carting industry throughout the five boroughs, the city’s public wholesale markets and the shipboard gaming industry. BIC investigates applicants, issue licenses and registrations, conduct criminal and regulatory investigations, enforce applicable laws, and promulgates rules and regulations that govern the conduct of the businesses it oversees.
Table 34 – BIC: FY22-FY23 Registrations by Contract Category
| FY22 | FY23 | |||
|---|---|---|---|---|
| Contract Category | # of Contracts | Total Contract Value | # of Contracts | Total Contract Value |
| Limited or Non-Competitive Method Contracts | 5 | $123,168 | 2 | $113,129 |
| Grand Total | 5 | $123,168 | 2 | $113,129 |
Chart 18 – BIC: FY22-FY23 Volume of Contracts by Industry
Chart 19 – BIC: FY22-FY23 Value of Contracts by Industry
Commission on Human rights (CCHR)
The City Commission on Human Rights (CCHR) is responsible for enforcing the City’s Human Rights Law, which prohibits discrimination in employment, housing, and public accommodations among other areas. CCHR is also dedicated to educating the public about their rights and promoting positive community relations.
Table 35 – CCHR: FY22-FY23 Registrations by Contract Category
| FY22 | FY23 | |||
|---|---|---|---|---|
| Contract Category | # of Contracts | Total Contract Value | # of Contracts | Total Contract Value |
| Limited or Non-Competitive Method Contracts | 5 | $270,000 | 3 | $223,848 |
| Transactions Not Subject to PPB Rules | 0 | $0 | 1 | $25,755 |
| Supplemental Contracts | 0 | $0 | 1 | $1,568,138 |
| Grand Total | 5 | $270,000 | 5 | $1,817,741 |
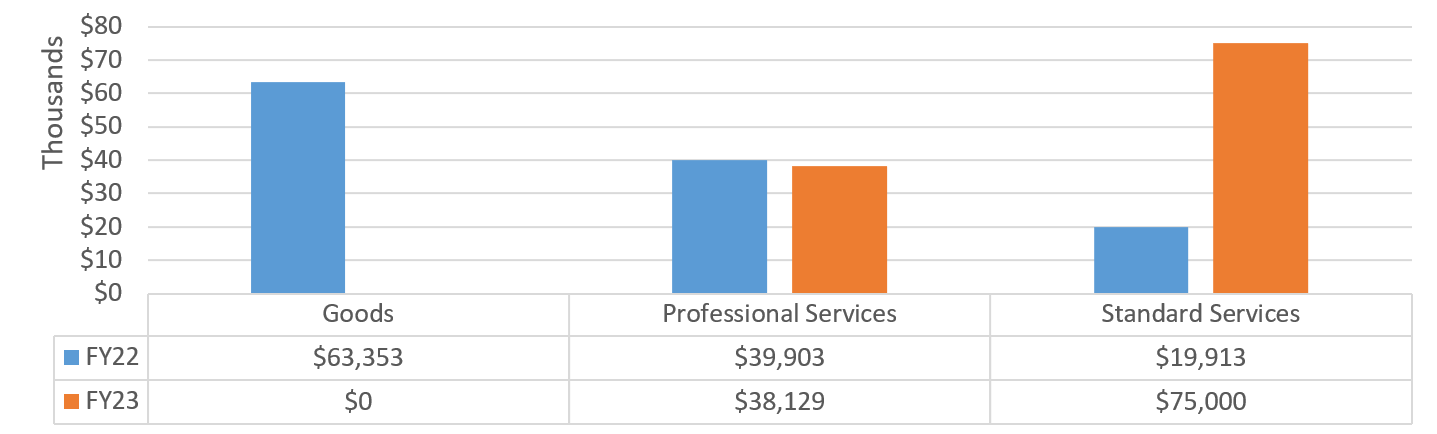
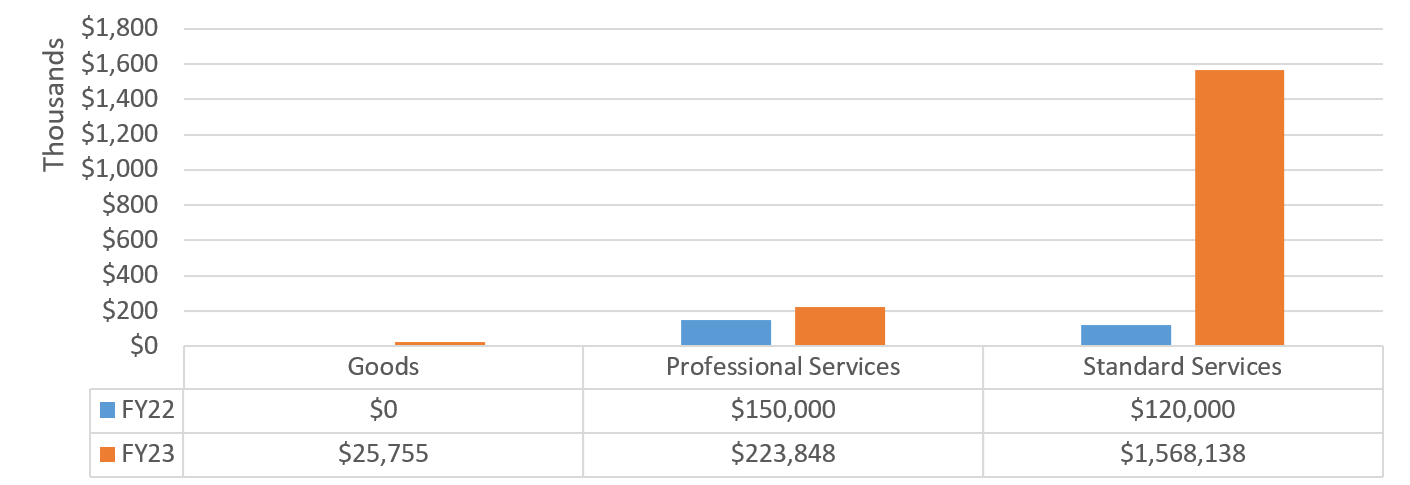
Chart 20 – CCHR: FY22-FY23 Value of Contracts by Industry
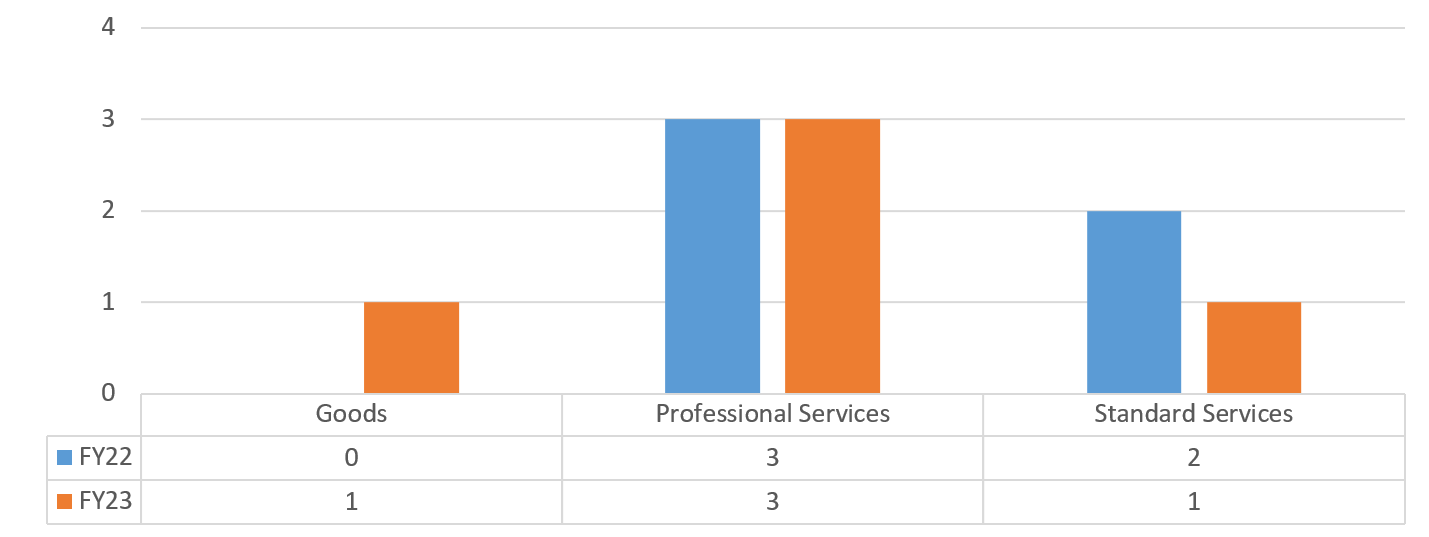
Chart 21 – CCHR: FY22-FY23 Volume of Contracts by Industry
Civilian Complaint Review Board (CCRB)
The Civilian Complaint Review Board (CCRB) is charged with investigating and mediating complaints filed by members of the public against New York City police officers involving the use of force, abuse of authority, discourtesy, or offensive language. CCRB consists of 13 members appointed by the Mayor, the City Council, and the Police Commissioner. It is the largest police oversight agency in the United States.
Table 36 – CCRB: FY22-23 Registrations by Contract Category
| FY22 | FY23 | |||
|---|---|---|---|---|
| Contract Category | # of Contracts | Total Contract Value | # of Contracts | Total Contract Value |
| Limited or Non-Competitive Method Contracts | 21 | $493,705 | 14 | $498,620 |
| Transactions Not Subject to PPB Rules | 1 | $87,500 | 0 | $0 |
| Grand Total | 22 | $581,205 | 14 | $498,620 |
Chart 22 – CCRB: FY22-FY23 Volume of Contracts by Industry
Chart 23 – CCRB: FY22-FY23 Value of Contracts by Industry
Department of Citywide Administrative Services (DCAS)
The Department of Citywide Administrative Services (DCAS) is responsible for supporting City agencies in hiring and training City employees, leasing and managing facilities, workforce recruitment, inspection and distribution of supplies and equipment, and implementation of energy conservation programs throughout City-owned facilities. Additionally, the DCAS Division of Municipal Supply Service operates as a centralized procurement office for New York City’s agencies for goods and services. Its mission is to provide high-quality, cost-effective goods and services that support the long-term strategic and environmental goals of the City.
Table 37 – DCAS: FY22-FY23 Registrations by Contract Category
| FY22 | FY23 | |||
|---|---|---|---|---|
| Contract Category | # of Contracts | Total Contract Value | # of Contracts | Total Contract Value |
| Competitive Method Contracts | 220 | $1,203,843,582 | 179 | $1,188,084,468 |
| Limited or Non-Competitive Method Contracts | 186 | $6,252,381,303 | 183 | $618,503,809 |
| Transactions Not Subject to PPB Rules | 55 | $273,795,150 | 196 | $374,518,687 |
| Supplemental Contracts | 50 | $211,849,789 | 63 | $302,801,091 |
| Grand Total | 511 | $7,941,869,824 | 621 | $2,483,908,056 |
Chart 24 – DCAS: FY22-FY23 Volume of Contracts by Industry
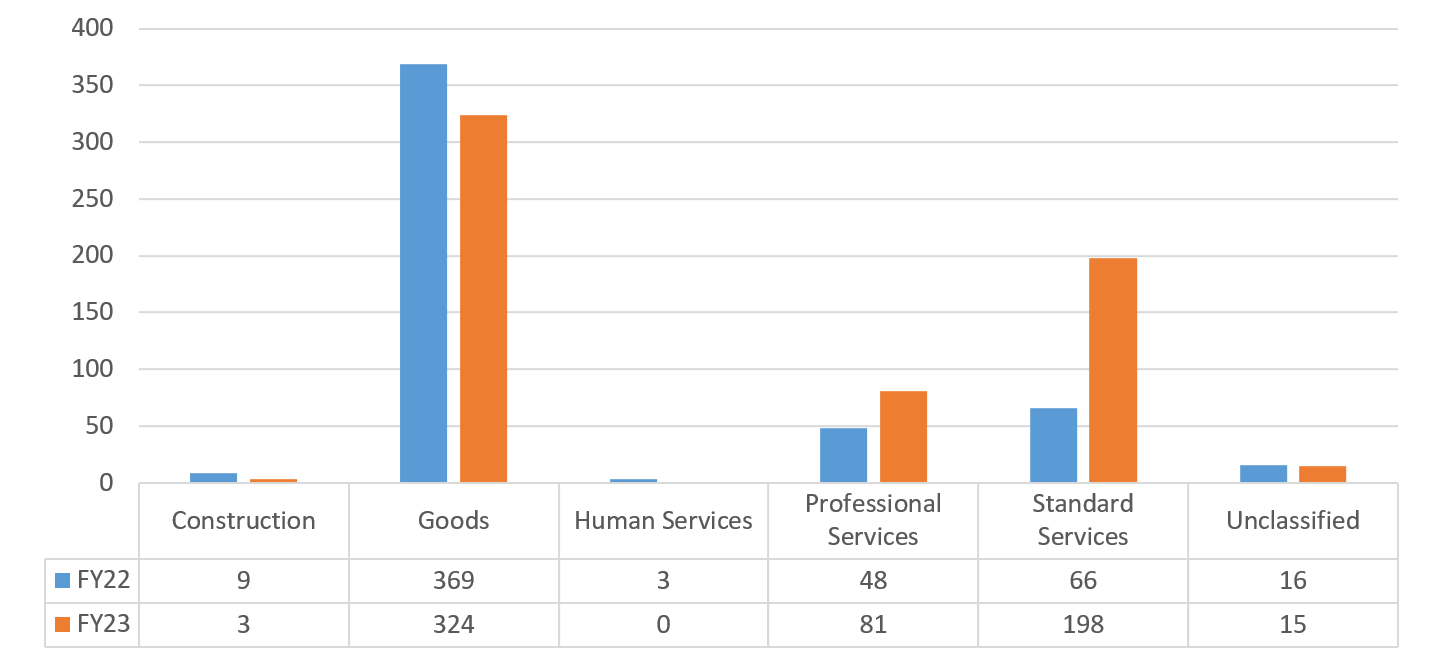
Chart 25 – DCAS: FY22-FY23 Value of Contracts by Industry
Department of Cultural Affairs (DCLA)
The New York City Department of Cultural Affairs is dedicated to supporting and strengthening New York City’s vibrant cultural life. DCLA provides public funding for nonprofit cultural organizations throughout the five boroughs and provides advocacy around matters relating to the City’s cultural institutions. The agency represents and serves nonprofit cultural organizations involved in the visual, literary and performing arts; public-oriented science and humanities institutions including zoos, botanical gardens and historic and preservation societies; and creative artists in all disciplines who live and work within the City’s five boroughs. DCLA also provides donated materials for arts programs offered by the public schools, cultural, social service groups, and commissions works of public art at City funded construction projects throughout the City.
Table 38 – DCLA: FY22-FY23 Registrations by Contract Category
| FY22 | FY23 | |||
|---|---|---|---|---|
| Contract Category | # of Contracts | Total Contract Value | # of Contracts | Total Contract Value |
| Limited or Non-Competitive Method Contracts | 9 | $1,632,274 | 15 | $3,989,068 |
| Transactions Not Subject to PPB Rules | 9 | $1,551,400 | 0 | $0 |
| Supplemental Contracts | 0 | $0 | 1 | $4,301,809 |
| Grand Total | 18 | $3,183,674 | 16 | $8,290,878 |
Chart 26 – DCLA: FY22-FY23 Volume of Contracts by Industry
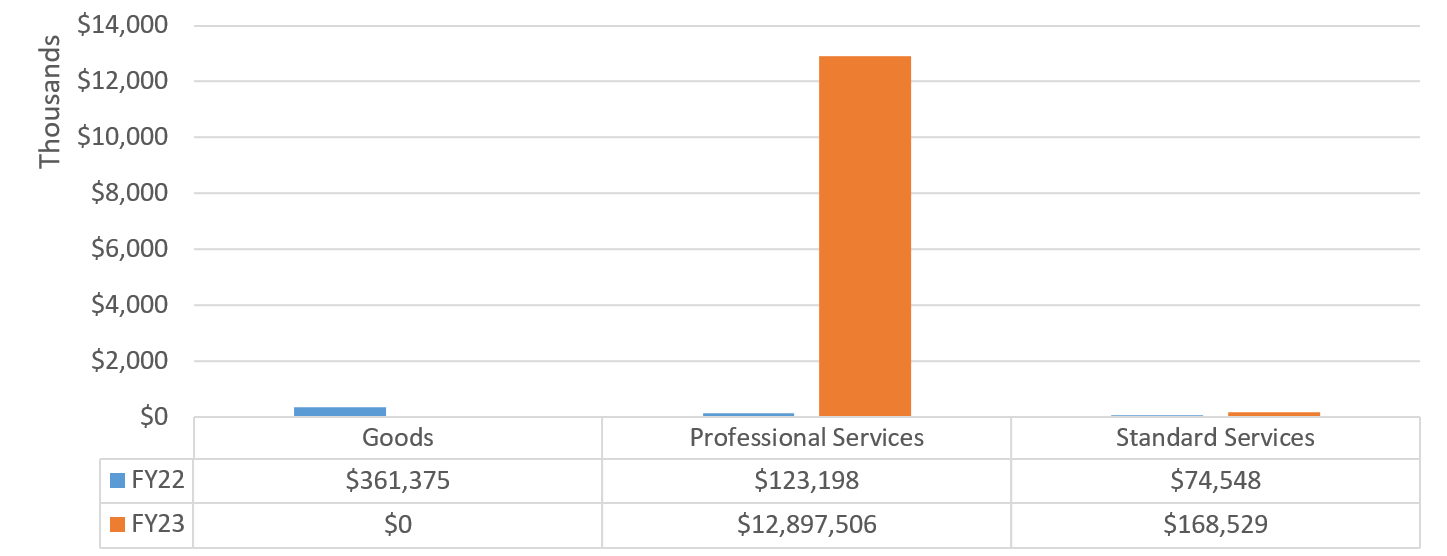
Chart 27 – DCLA: FY22-FY23 Value of Contracts by Industry
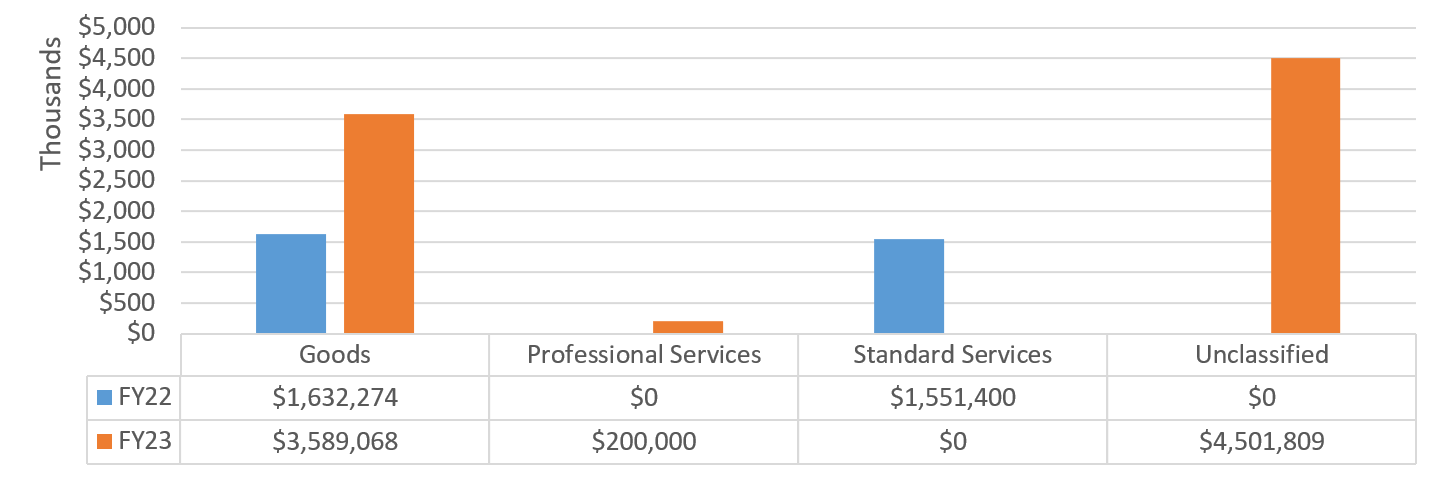
Department of City Planning (DCP)
The Department of City Planning (DCP) promotes housing production and affordability, fosters economic development by coordinating investments in infrastructure and services, and supports resilient and sustainable communities across the five boroughs for a more equitable New York City. In addition, DCP also provides public access to planning resources including land use, housing, and population data through its online Community Portal.
Table 39 – DCP: FY22-FY23 Registrations by Contract Category
| FY22 | FY23 | |||
|---|---|---|---|---|
| Contract Category | # of Contracts | Total Contract Value | # of Contracts | Total Contract Value |
| Competitive Method Contracts | 0 | $0 | 8 | $12,762,501 |
| Limited or Non-Competitive Method Contracts | 11 | $559,122 | 8 | $303,533 |
| Grand Total | 11 | $559,122 | 16 | $13,066,035 |
Chart 28 – DCP: FY22-FY23 Volume of Contracts by Industry
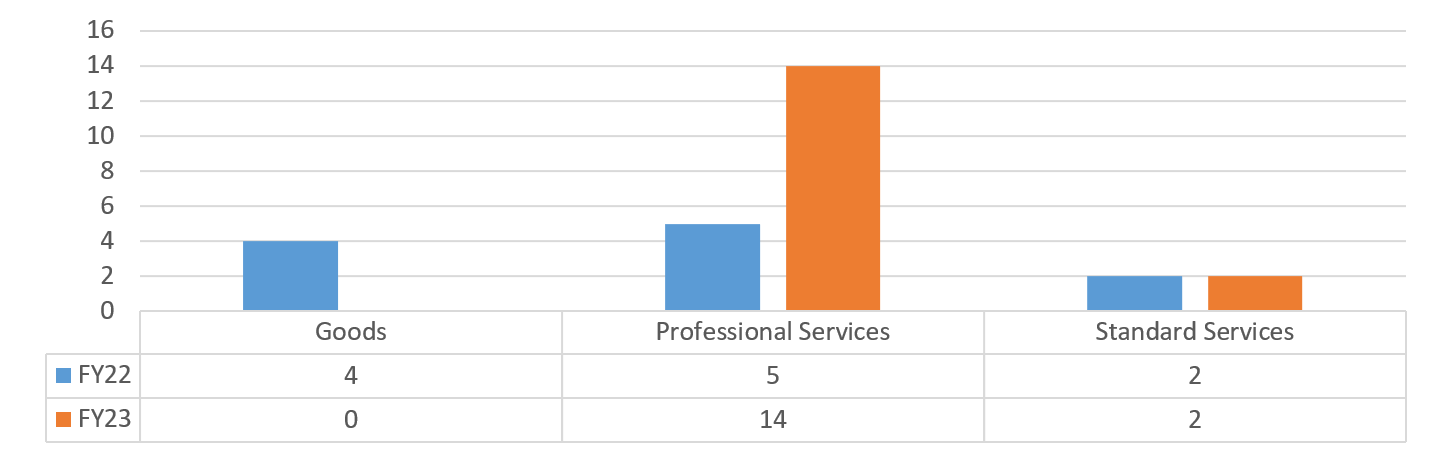
Chart 29 – DCP: FY22-FY23 Value of Contracts by Industry
Department of Consumer and Worker Protection (DCWP)
The Department of Consumer and Worker Protection (DCWP) licenses, inspects, and educates businesses; assists and informs consumers; and offers free financial counseling and safe banking products to New Yorkers. DCWP licenses approximately 80,000 businesses in 55 different industries. The DCWP also enforces New York City’s Consumer Protection, Paid Sick Leave, and Commuter Benefits laws, as well as other related business laws throughout New York City.
Table 40 – DCWP: FY22-FY23 Registrations by Contract Category
| FY22 | FY23 | |||
|---|---|---|---|---|
| Contract Category | # of Contracts | Total Contract Value | # of Contracts | Total Contract Value |
| Limited or Non-Competitive Method Contracts | 12 | $65,954,400 | 5 | $615,008 |
| Transactions Not Subject to PPB Rules | 0 | $0 | 3 | $1,224,039 |
| Supplemental Contracts | 1 | $170,000 | 9 | $9,765,000 |
| Grand Total | 13 | $66,124,400 | 17 | $11,604,047 |
Chart 30 – DCWP: FY22-FY23 Volume of Contracts by Industry
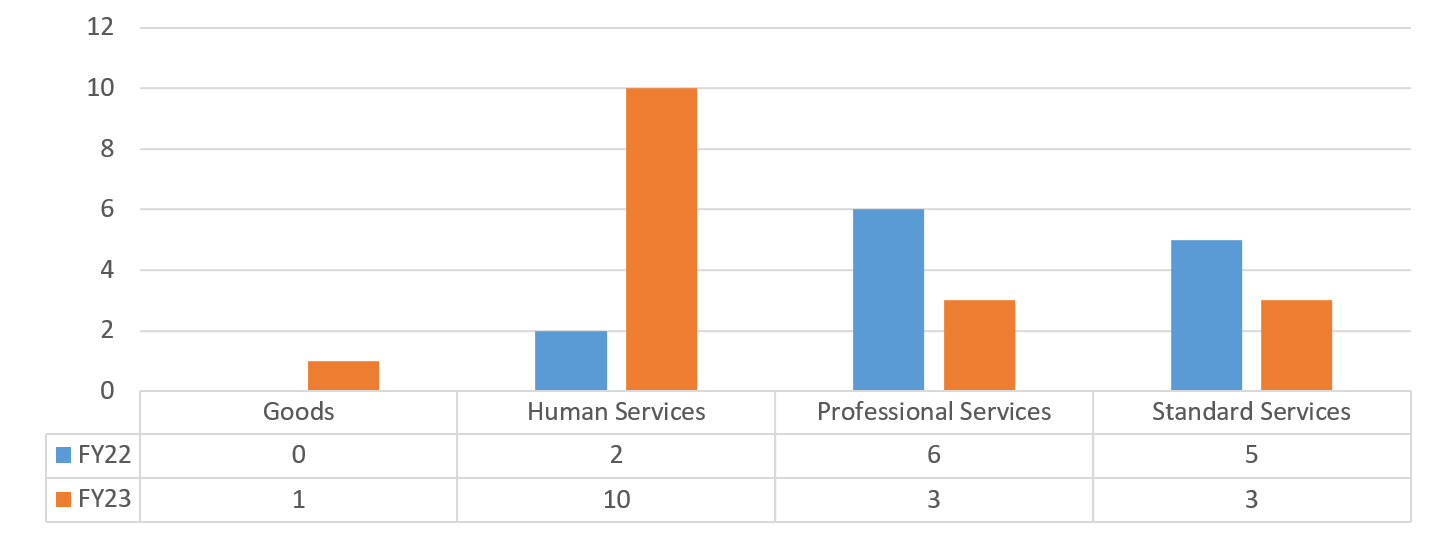
Chart 31 – DCWP: FY22-FY23 Value of Contracts by Industry
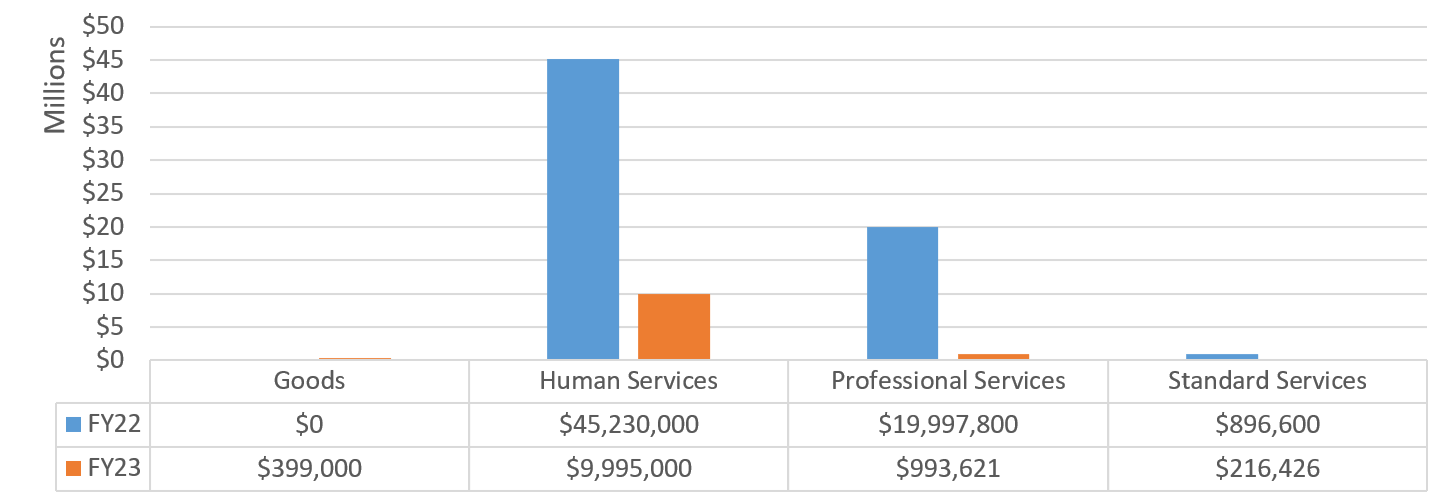
Department of Design and Construction (DDC)
The Department of Design and Construction (DDC) is the City’s primary capital construction project manager. DDC provides communities with new or renovated public buildings such as such as firehouses, libraries, police precincts, and new or upgraded roads, sewers and water mains in all five boroughs.
Table 41 – DDC: FY22-FY23 Registrations by Contract Category
| FY22 | FY23 | |||
|---|---|---|---|---|
| Contract Category | # of Contracts | Total Contract Value | # of Contracts | Total Contract Value |
| Competitive Method Contracts | 133 | $2,732,414,571 | 104 | $1,586,429,400 |
| Limited or Non-Competitive Method Contracts | 92 | $845,520,652 | 64 | $3,373,780,411 |
| Transactions Not Subject to PPB Rules | 21 | $41,795,599 | 15 | $8,735,212 |
| Supplemental Contracts | 44 | $201,022,858 | 33 | $309,607,871 |
| Grand Total | 290 | $3,820,753,679 | 216 | $5,278,552,895 |
Chart 32 – DDC: FY22-FY23 Volume of Contracts by Industry
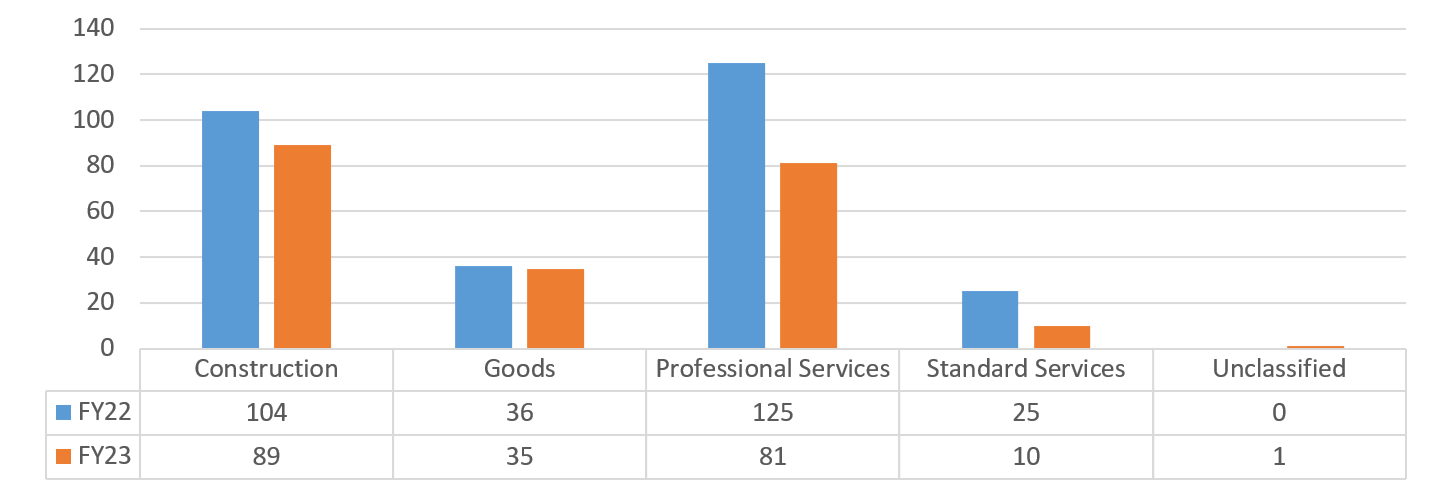
Chart 33 – DDC: FY22-FY23 Value of Contracts by Industry
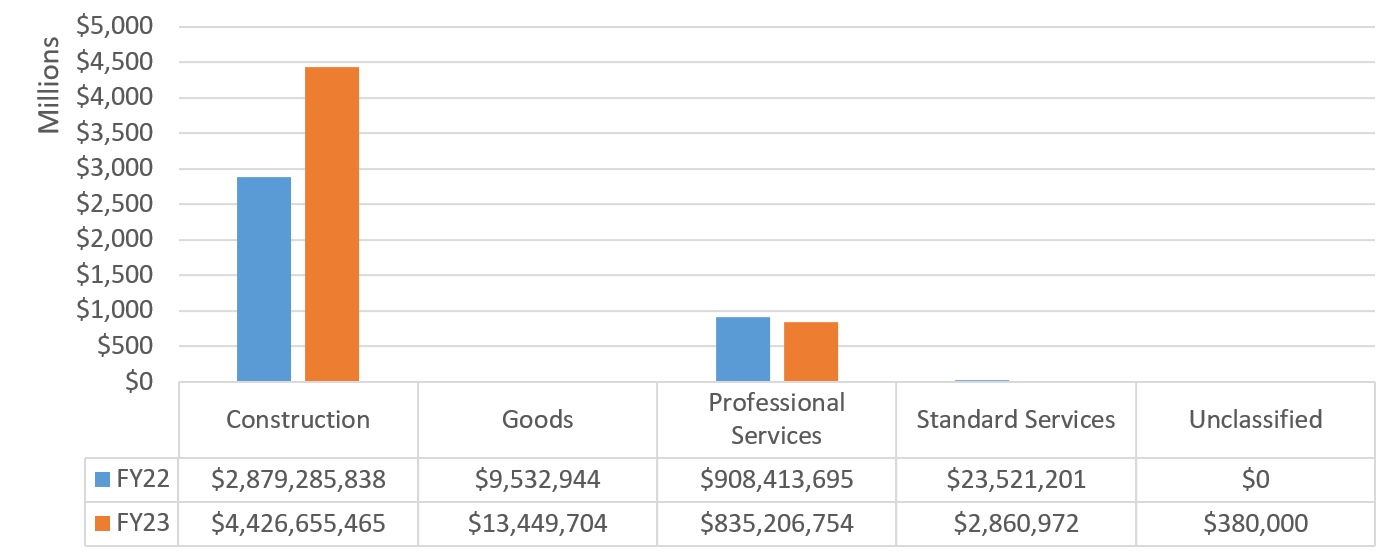
Department of Environmental Protection (DEP)
The Department of Environmental Protection (DEP) is responsible for managing and conserving the water supply for more than nine million people in New York City and one million upstate New Yorkers. DEP distributes more than one billion gallons of clean drinking water and collects 1.3 billion gallons of wastewater on a daily basis through a vast network of pipes, regulators, and pumping stations. DEP’s work is critical to the continued remediation of New York’s waterways and ensures the harbor continues to be a safe place for recreation for New Yorkers. In order to protect water coming in and out of the City, DEP oversees one of the largest capital construction programs in the region, which includes new water tunnels from upstate reservoirs and new treatment plants. DEP is also responsible for reducing air, noise, and hazardous materials pollution.
Table 42 – DEP: FY22-FY23 Registrations by Contract Category
| FY22 | FY23 | |||
|---|---|---|---|---|
| Contract Category | # of Contracts | Total Contract Value | # of Contracts | Total Contract Value |
| Competitive Method Contracts | 63 | $907,988,722 | 114 | $1,408,370,040 |
| Limited or Non-Competitive Method Contracts | 118 | $336,277,640 | 111 | $305,138,992 |
| Transactions Not Subject to PPB Rules | 13 | $2,946,174 | 24 | $1,819,877 |
| Supplemental Contracts | 32 | $127,316,942 | 36 | $153,086,697 |
| Grand Total | 226 | $1,374,529,478 | 285 | $1,868,415,606 |
Chart 34 – DEP: FY22-FY23 Volume of Contracts by Industry
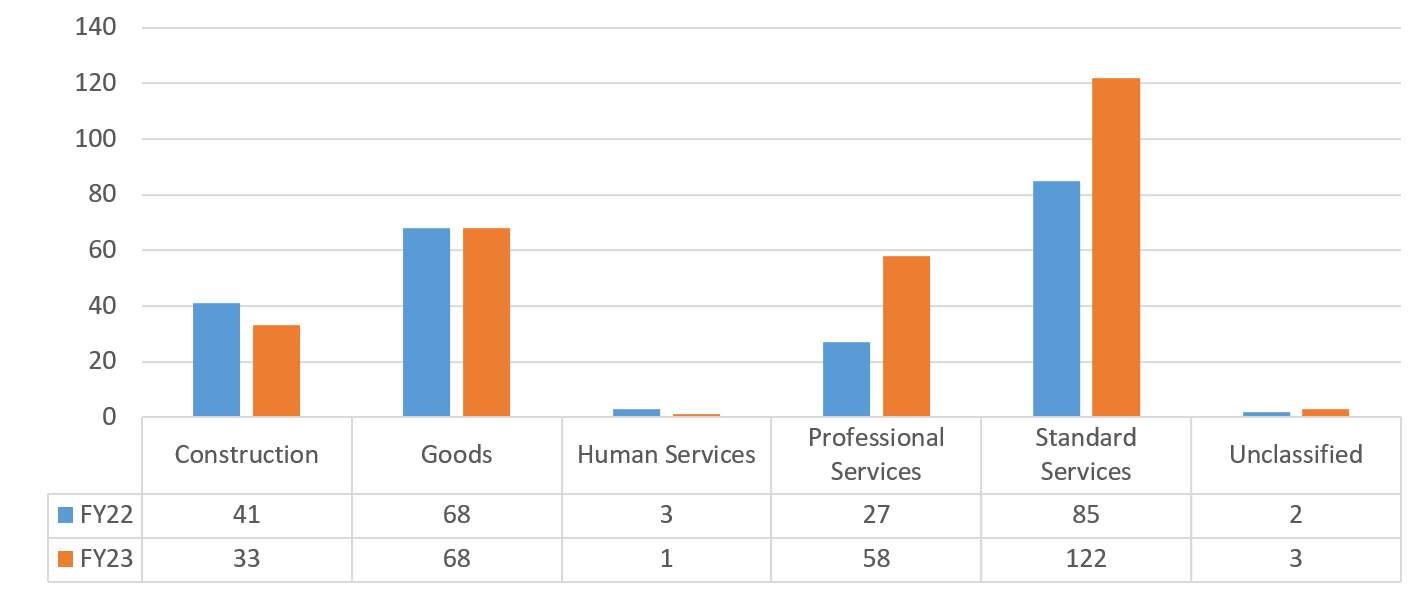
Chart 35 – DEP: FY22-FY23 Value of Contracts by Industry
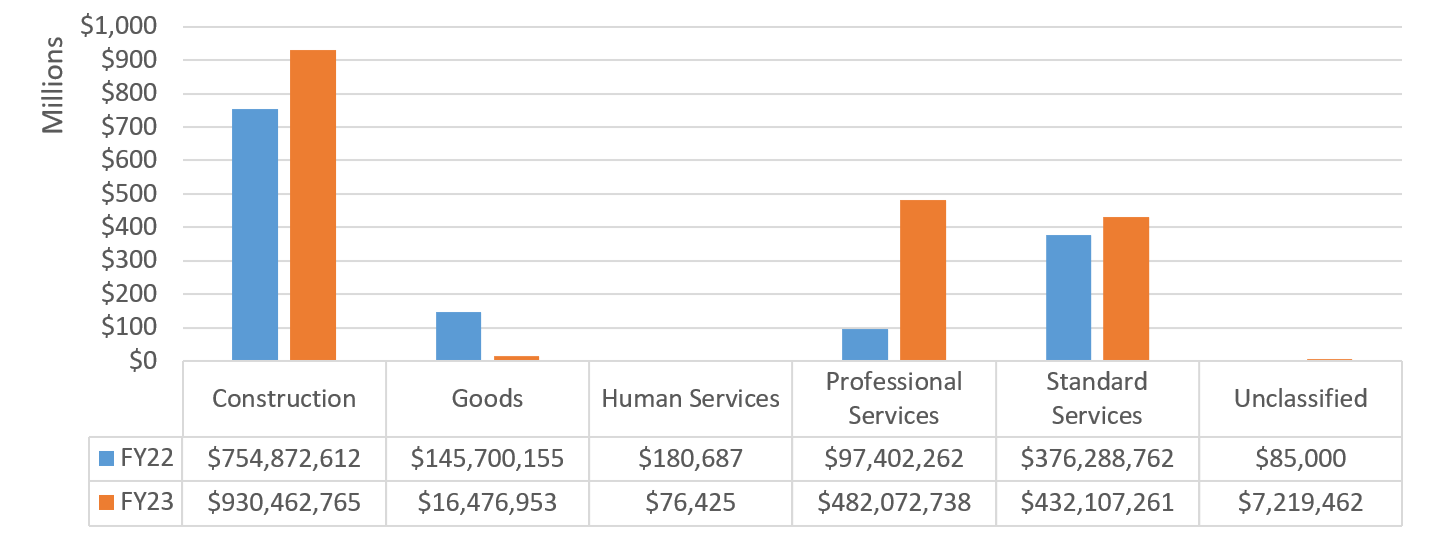
Department For the Aging (DFTA)
The Department for the Aging (DFTA) receives local, state, and federal funds to provide essential services for seniors. These services include case management, transportation, free legal assistance, and home meal delivery. Funds are also awarded to community-based and citywide organizations to operate Senior Centers throughout the five boroughs which provide sites for seniors to socialize and access services.
Table 43 – DFTA: FY22-FY23 Registrations by Contract Category
| FY22 |
FY23 |
|||
|---|---|---|---|---|
| Contract Category | # of Contracts | Total Contract Value | # of Contracts | Total Contract Value |
| Competitive Method Contracts | 135 | $722,225,623 | 28 | $150,754,843 |
| Limited or Non-Competitive Method Contracts | 480 | $83,583,662 | 598 | $103,310,405 |
| Transactions Not Subject to PPB Rules | 2 | $2,044,630 | 3 | $4,069,660 |
| Supplemental Contracts | 33 | $51,130,199 | 5 | $8,093,582 |
| Grand Total | 650 | $858,984,114 | 634 | $266,228,490 |
Chart 36 – DFTA: FY22-FY23 Volume of Contracts by Industry
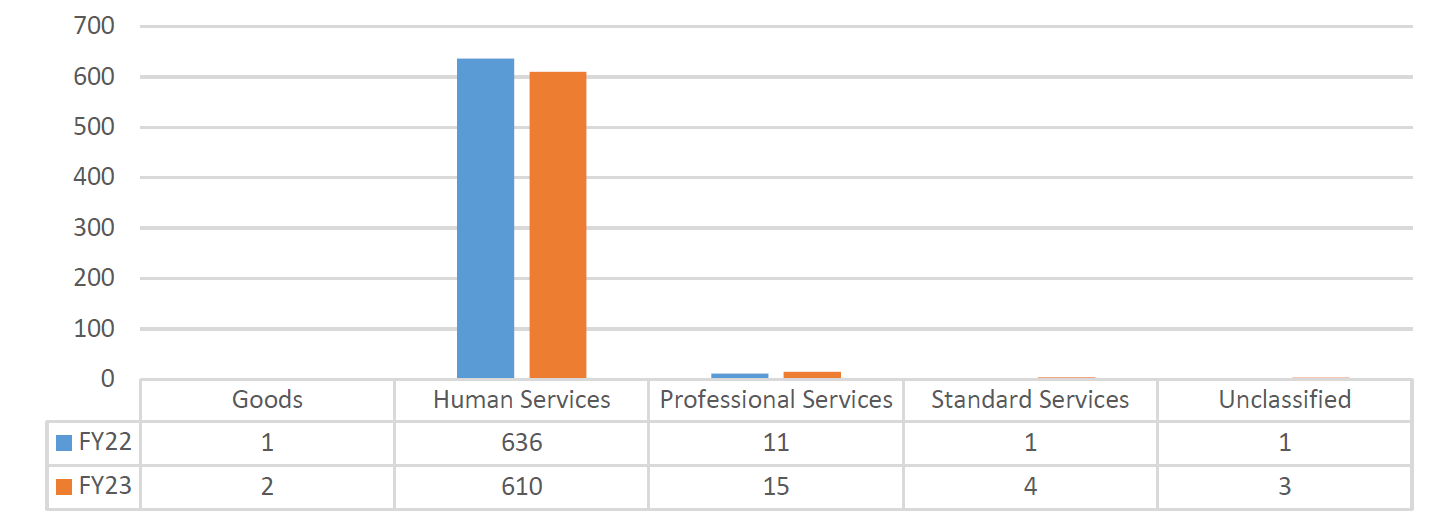
Chart 37 – DFTA: FY22-FY23 Value of Contracts by Industry
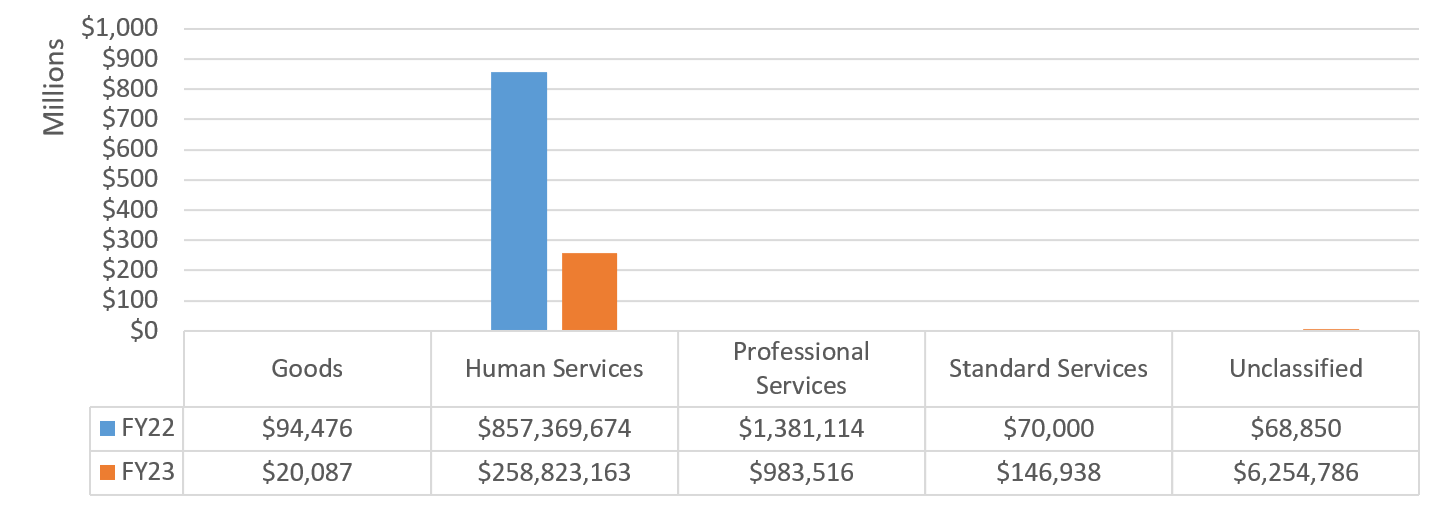
Department of Buildings (DOB)
The Department of Buildings (DOB) ensures the safe and lawful use of more than a million buildings and properties in the City by enforcing the City’s Building Code, Electrical Code, Zoning Resolutions, certain New York State Labor Laws and the New York State Multiple Dwelling Law. DOB’s main activities include performing plan examinations, issuing construction permits, inspecting properties, and licensing tradespeople.
Table 44 – DOB: FY22-FY23 Registrations by Contract Category
| FY22 | FY23 | |||
|---|---|---|---|---|
| Contract Category | # of Contracts | Total Contract Value | # of Contracts | Total Contract Value |
| Competitive Method Contracts | 0 | $0 | 3 | $3,839,756 |
| Limited or Non-Competitive Method Contracts | 18 | $8,632,729 | 17 | $2,314,709 |
| Transactions Not Subject to PPB Rules | 9 | $271,613 | 8 | $873,741 |
| Supplemental Contracts | 0 | $0 | 2 | $6,502,382 |
| Grand Total | 27 | $8,904,342 | 30 | $13,530,588 |
Chart 38 – DOB: FY22-FY23 Volume of Contracts by Industry
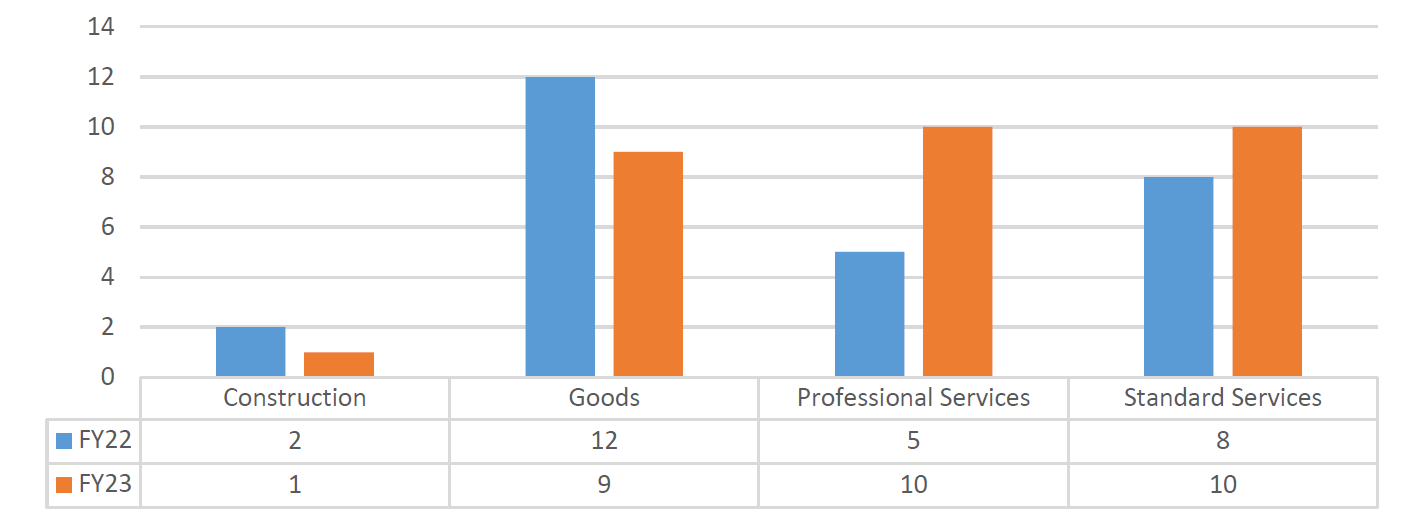
Chart 39 – DOB: FY22-FY23 Value of Contracts by Industry
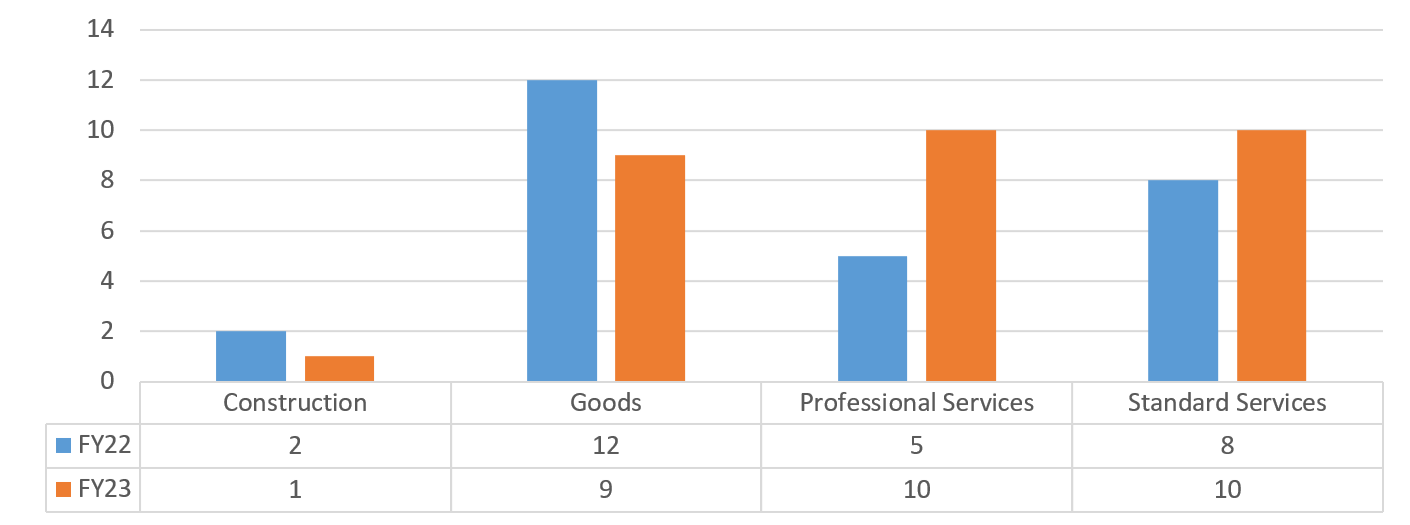
Department of Corrections (DOC)
The Department of Correction (DOC) provides for the care, custody, and control of persons accused of crimes or convicted and sentenced to up to one year of jail time. DOC operates 11 inmate facilities; eight of which are located on Rikers Island. In addition, DOC operates two hospital prison wards and court holding facilities in Criminal, Supreme, and Family Courts in each borough.
Table 45 – DOC: FY22-FY23 Registrations by Contract Category
| FY22 | FY23 | |||
|---|---|---|---|---|
| Contract Category | # of Contracts | Total Contract Value | # of Contracts | Total Contract Value |
| Competitive Method Contracts | 7 | $13,344,125 | 8 | $48,072,037 |
| Limited or Non-Competitive Method Contracts | 80 | $42,784,839 | 88 | $32,624,385 |
| Transactions Not Subject to PPB Rules | 6 | $508,170 | 3 | $493,137 |
| Supplemental Contracts | 11 | $23,660,787 | 11 | $22,089,579 |
| Grand Total | 104 | $8,904,342 | 110 | $103,279,039 |
Chart 40 – DOC: FY22-FY23 Volume of Contracts by Industry
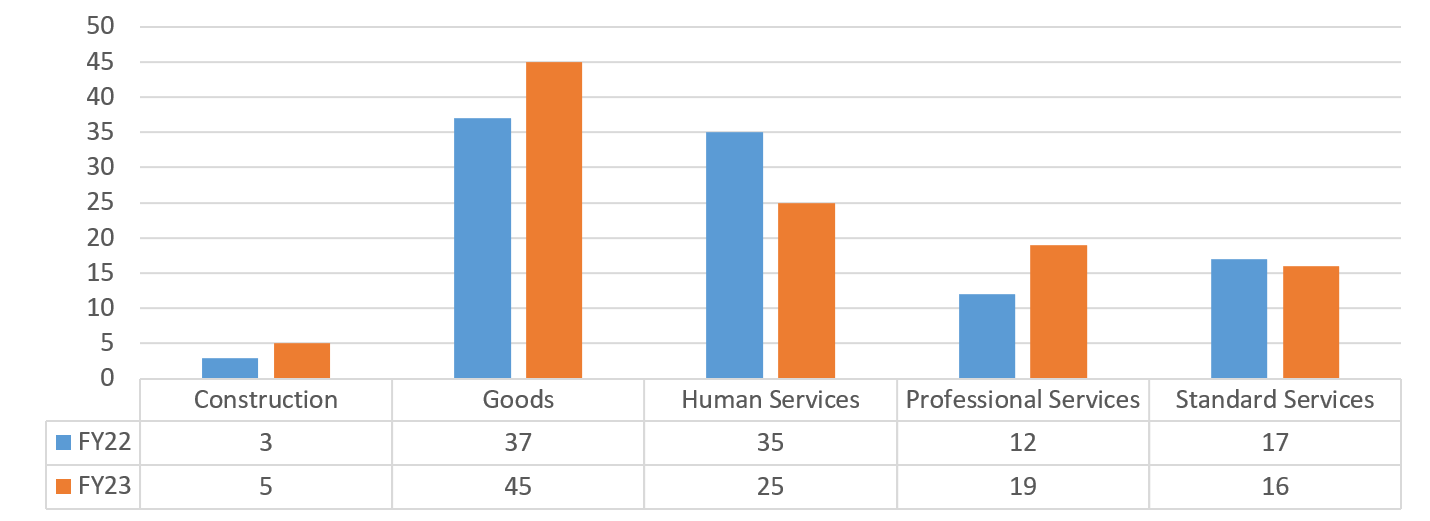
Chart 41 – DOC: FY22-FY23 Value of Contracts by Industry
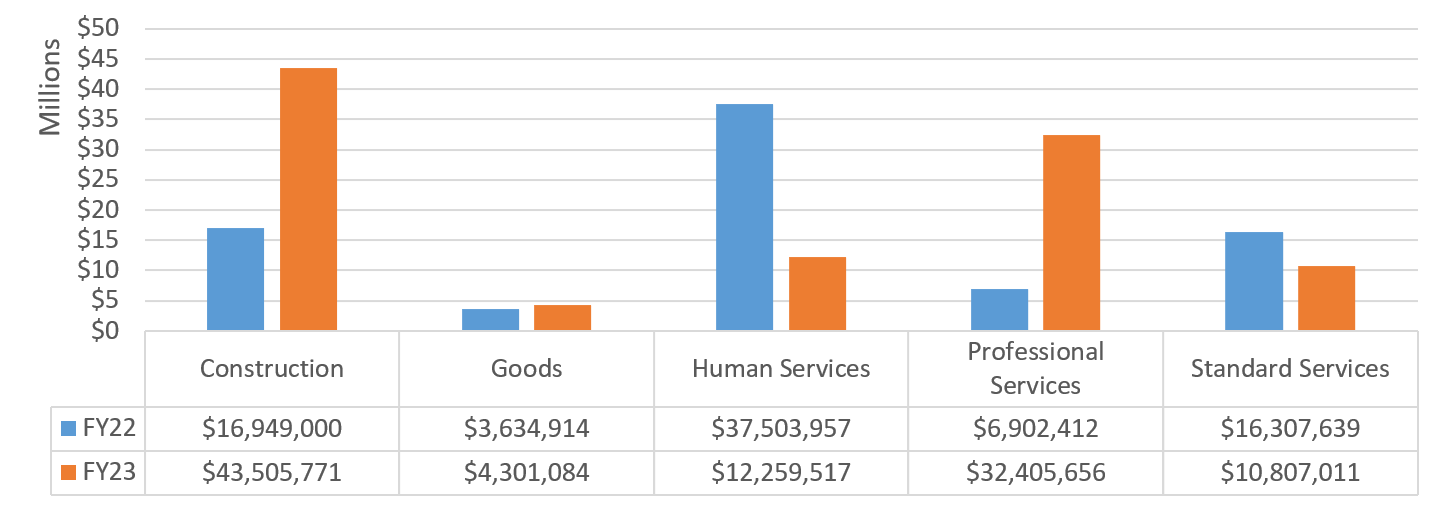
Department of Finance (DOF)
The Department of Finance (DOF) oversees and administers the tax and revenue laws of the City; receives and accounts for City revenues; and provides customer service to taxpayers.
Table 46 – DOF: FY22-FY23 Registrations by Contract Category
| FY22 | FY23 | |||
|---|---|---|---|---|
| Contract Category | # of Contracts | Total Contract Value | # of Contracts | Total Contract Value |
| Competitive Method Contracts | 5 | $9,904,337 | 7 | $148,380,879 |
| Limited or Non-Competitive Method Contracts | 34 | $8,212,262 | 47 | $106,139,329 |
| Transactions Not Subject to PPB Rules | 7 | $260,121 | 7 | $1,026,226 |
| Supplemental Contracts | 7 | $93,681,669 | 11 | $13,537,341 |
| Grand Total | 53 | $112,058,389 | 72 | $269,083,774 |
Chart 42 – DOF: FY22-FY23 Volume of Contracts by Industry
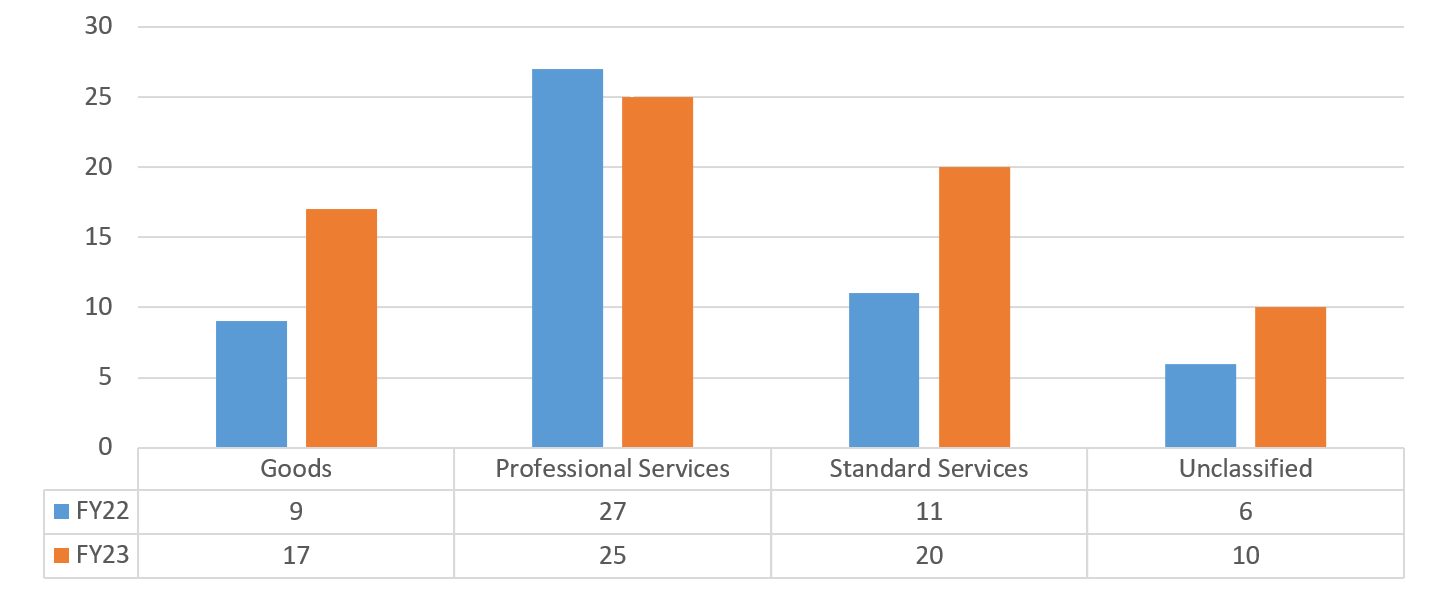
Chart 43 – DOF: FY22-FY23 Value of Contracts by Industry
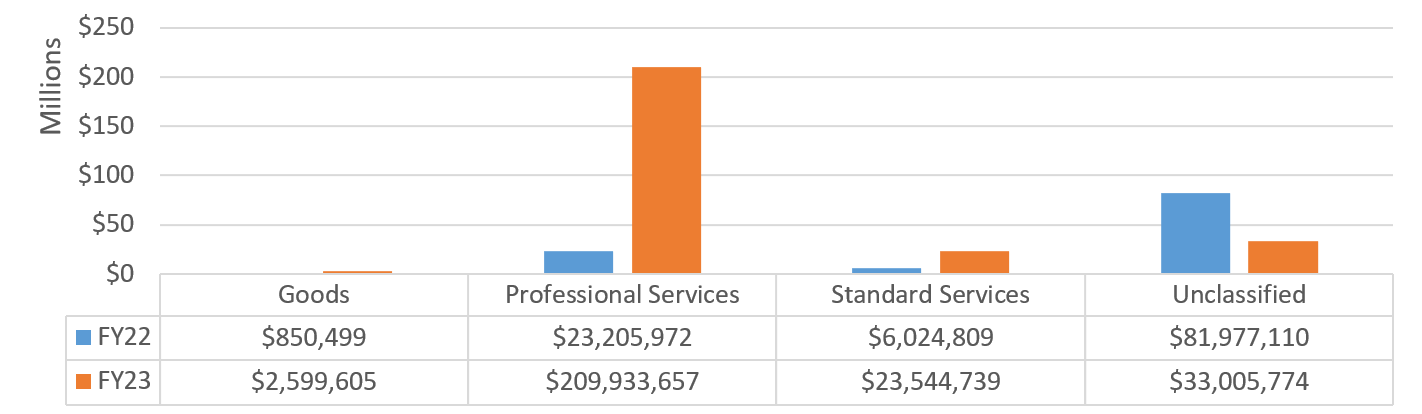
Department Health and Mental Hygiene (DOHMH)
The Department of Health and Mental Hygiene (DOHMH) protects and promotes the health and well-being of all New Yorkers. The Department engages with communities to develop and implement robust public health programming and policy recommendations, enforces health regulations, responds to public health emergencies, and provides limited direct health services.
Table 47 – DOHMH: FY22-FY23 Registrations by Contract Category
| FY22 | FY23 | |||
|---|---|---|---|---|
| Contract Category | # of Contracts | Total Contract Value | # of Contracts | Total Contract Value |
| Competitive Method Contracts | 19 | $163,559,130 | 49 | $303,123,294 |
| Limited or Non-Competitive Method Contracts | 610 | $1,213,340,450 | 1,175 | $838,625,208 |
| Transactions Not Subject to PPB Rules | 23 | $910,515 | 31 | $1,437,638 |
| Supplemental Contracts | 102 | $309,942,212 | 56 | $211,105,618 |
| Grand Total | 754 | $1,687,752,307 | 1,311 | $1,354,291,758 |
Chart 44 – DOHMH: FY22-FY23 Volume of Contracts by Industry
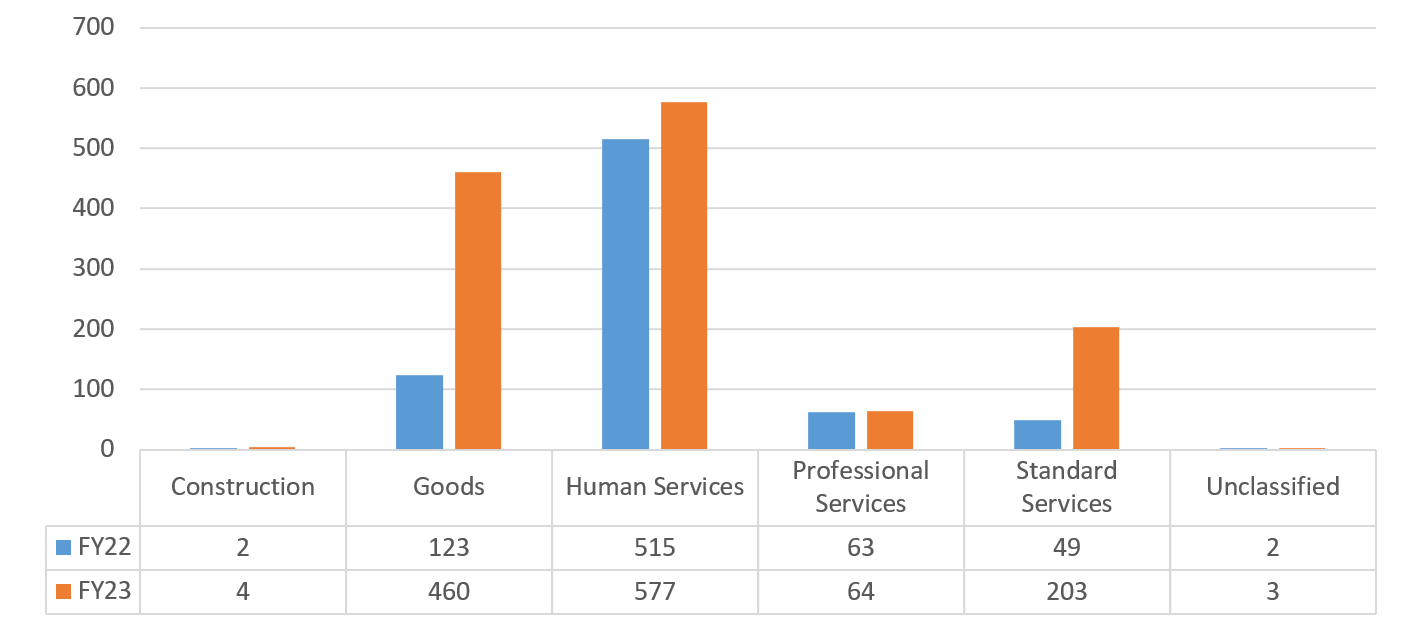
Chart 45 – DOHMH: FY22-FY23 Value of Contracts by Industry
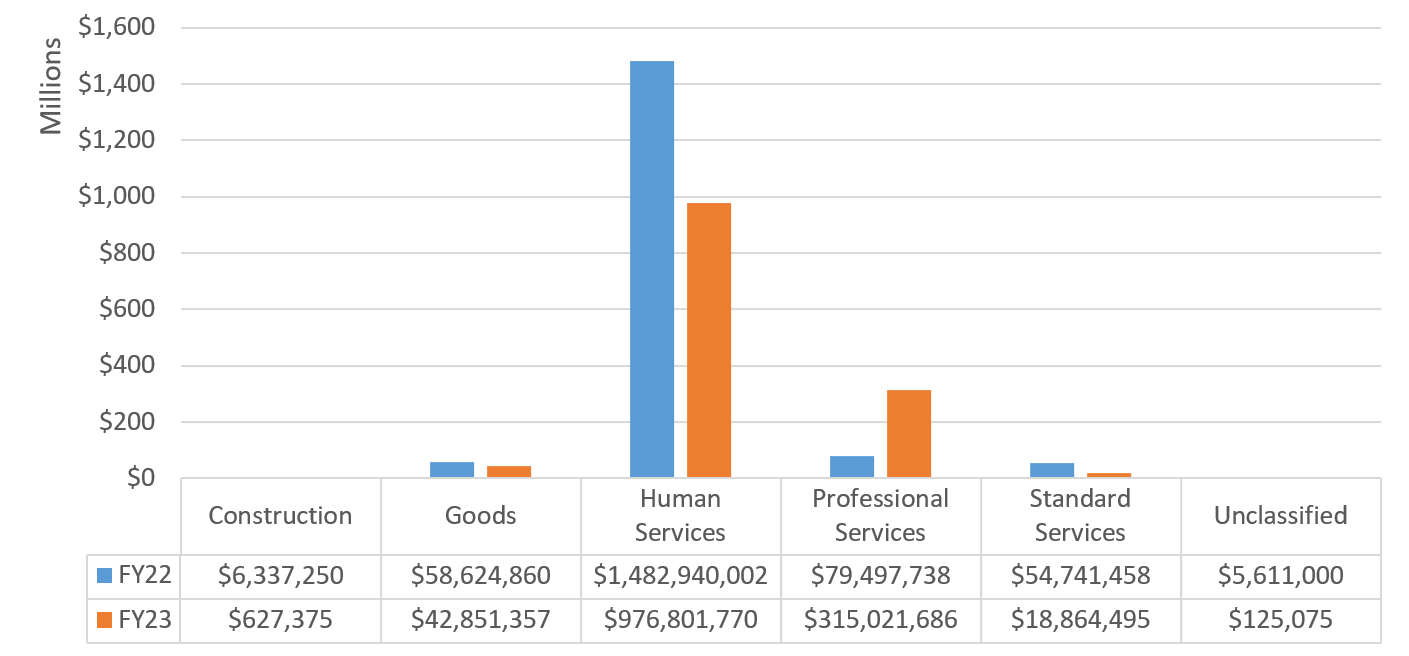
Department of Investigation (DOI)
The Department of Investigation (DOI) is responsible for the investigation and referral of criminal prosecution of cases involving fraud, corruption, and unethical conduct among all persons and entities that receive City funds, including the City’s more than 300,000 employees and contractors. DOI is also charged with studying agency procedures to identify corruption risks and recommending improvements to reduce the City’s vulnerability to fraud, waste, and corruption. In addition, DOI conducts investigations into the backgrounds of persons selected to work in decision-making or sensitive City jobs and checks on those who are awarded contracts with the City to determine if they are suited to serve the public trust.
Table 48 – DOI: FY22-FY23 Registrations by Contract Category
| FY22 | FY23 | |||
|---|---|---|---|---|
| Contract Category | # of Contracts | Total Contract Value | # of Contracts | Total Contract Value |
| Limited or Non-Competitive Method Contracts | 26 | $4,750,491 | 11 | $878,925 |
| Supplemental Contracts | 1 | $1,000,000 | 0 | $0 |
| Grand Total | 27 | $5,750,491 | 11 | $878,925 |
Chart 46 – DOI: FY22-FY23 Volume of Contracts by Industry
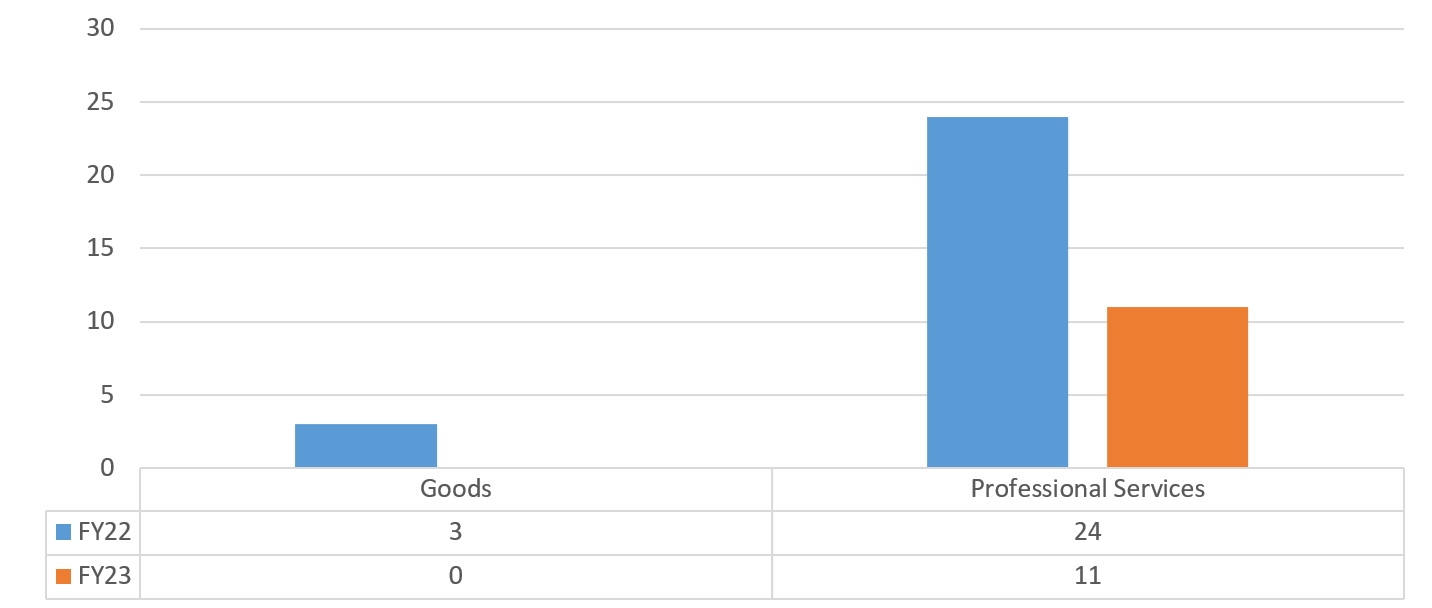
Chart 47 – DOI: FY22-FY23 Value of Contracts by Industry
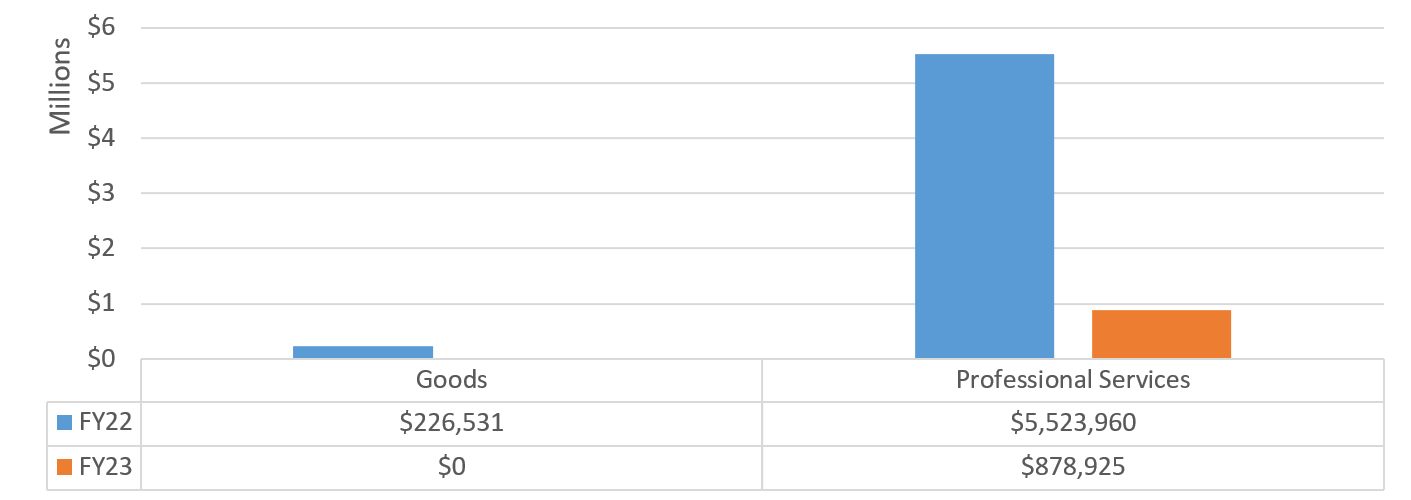
Department of Probation (DOP)
The Department of Probation (DOP) is responsible for the supervising clients on probation throughout the five boroughs. DOP helps build stronger and safer communities by working with and supervising people on probation, fostering positive change in their decision-making and behavior, and expanding opportunities for them to move out of the criminal and juvenile justice systems through meaningful education, employment, health services, family engagement and civic participation.
Table 49 – DOP: FY22-FY23 Registrations by Contract Category
| FY22 | FY23 | |||
|---|---|---|---|---|
| Contract Category | # of Contracts | Total Contract Value | # of Contracts | Total Contract Value |
| Competitive Method Contracts | 1 | $258,800 | 3 | $8,762,500 |
| Limited or Non-Competitive Method Contracts | 64 | $8,718,513 | 30 | $9,438,794 |
| Transactions Not Subject to PPB Rules | 0 | $0 | 1 | $96,750 |
| Supplemental Contracts | 30 | $20,021,183 | 24 | $9,398,816 |
| Grand Total | 95 | $28,998,497 | 58 | $27,696,859 |
Chart 48 – DOP: FY22-FY23 Volume of Contracts by Industry
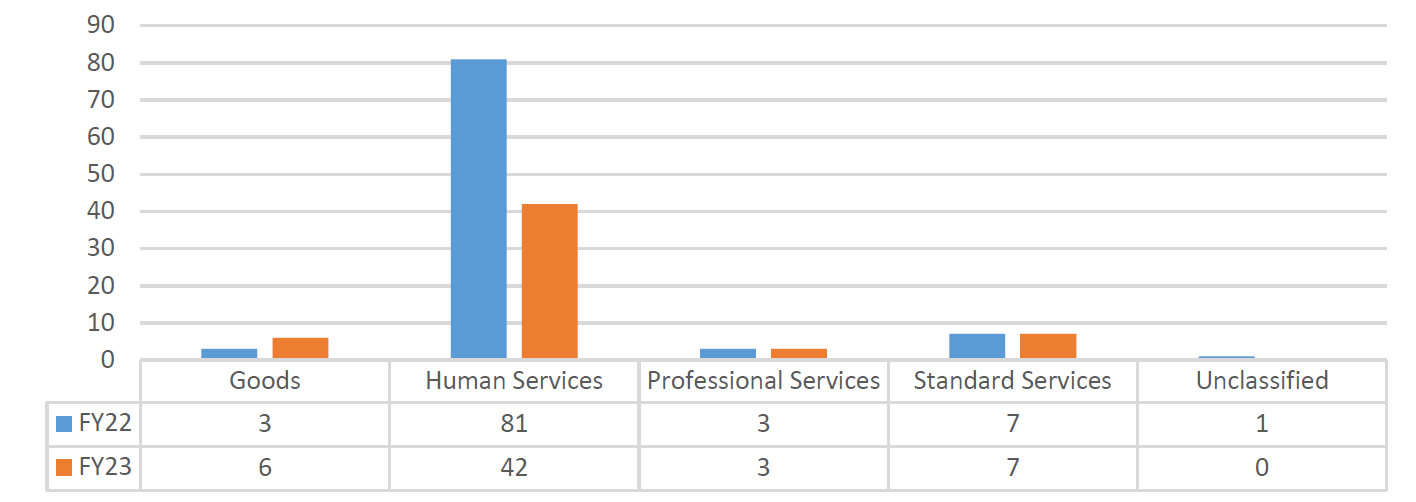
Chart 49 – DOP: FY22-FY23 Value of Contracts by Industry
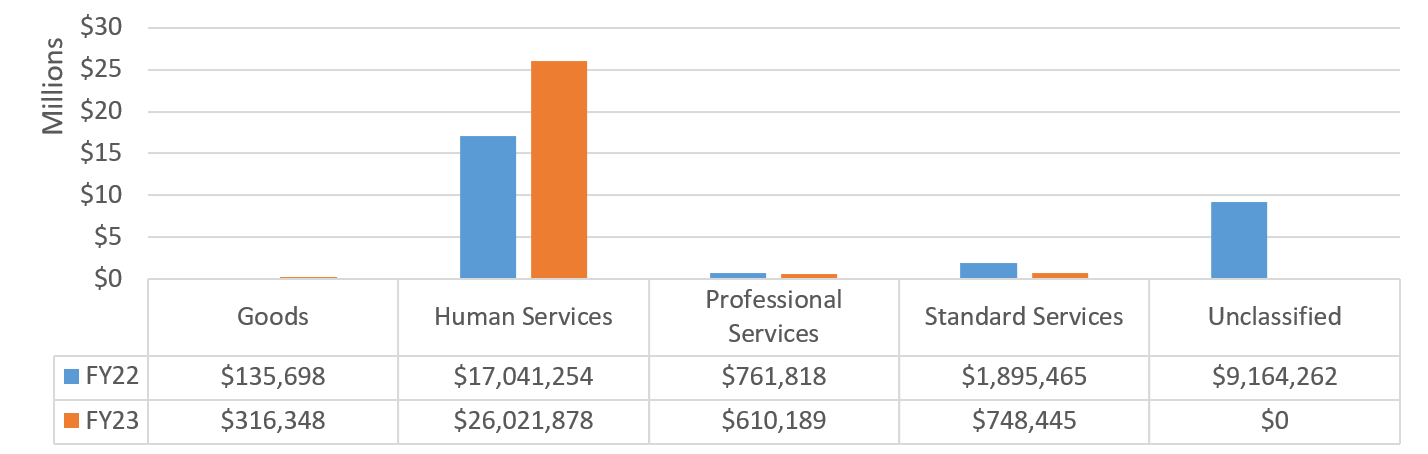
Department of Records and information Services (DORIS)
The Department of Records & Information Services (DORIS) preserves and provides access to the historical and contemporary records of New York City government both online and in-person at the Municipal Library, Archives and Visitor Center. DORIS operates record storage facilities in two locations with a combined capacity of 738,000 cubic feet, and provides records management services to 50 City agencies, ten courts, and the five District Attorneys’ offices.
Table 50 – DORIS: FY22-FY23 Registrations by Contract Category
| FY22 | FY23 | |||
|---|---|---|---|---|
| Contract Category | # of Contracts | Total Contract Value | # of Contracts | Total Contract Value |
| Limited or Non-Competitive Method Contracts | 4 | $195,854 | 3 | $245,639 |
| Supplemental Contracts | 0 | $0 | 1 | $151,060 |
| Grand Total | 4 | $195,854 | 4 | $396,699 |
Chart 50 – DORIS: FY22-FY23 Volume of Contracts by Industry
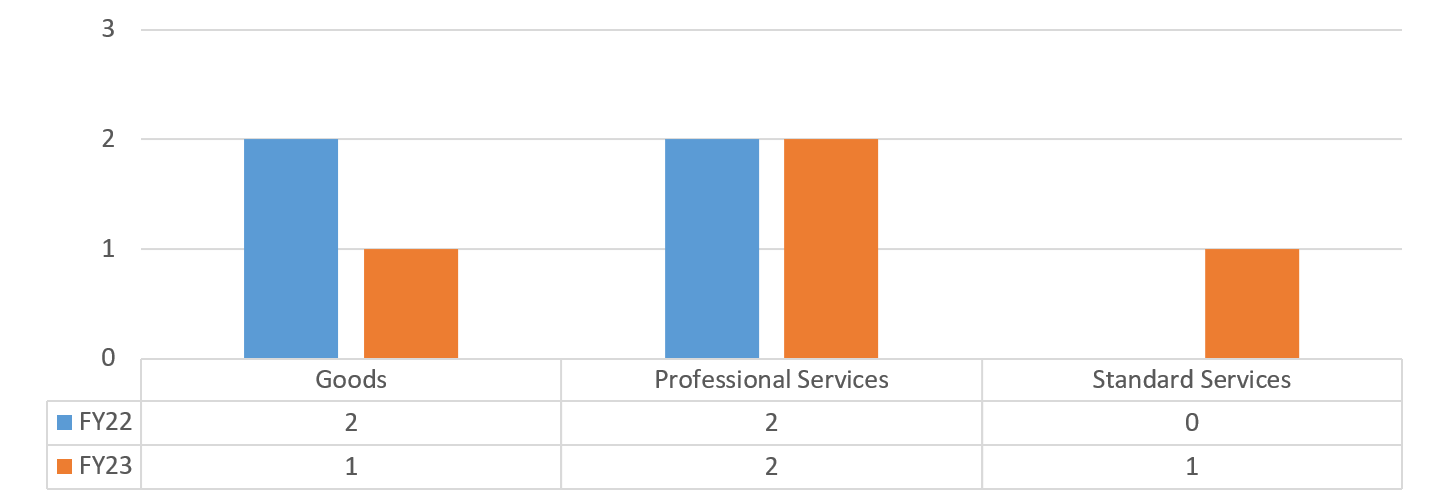
Chart 51 – DORIS: FY22-FY23 Value of Contracts by Industry
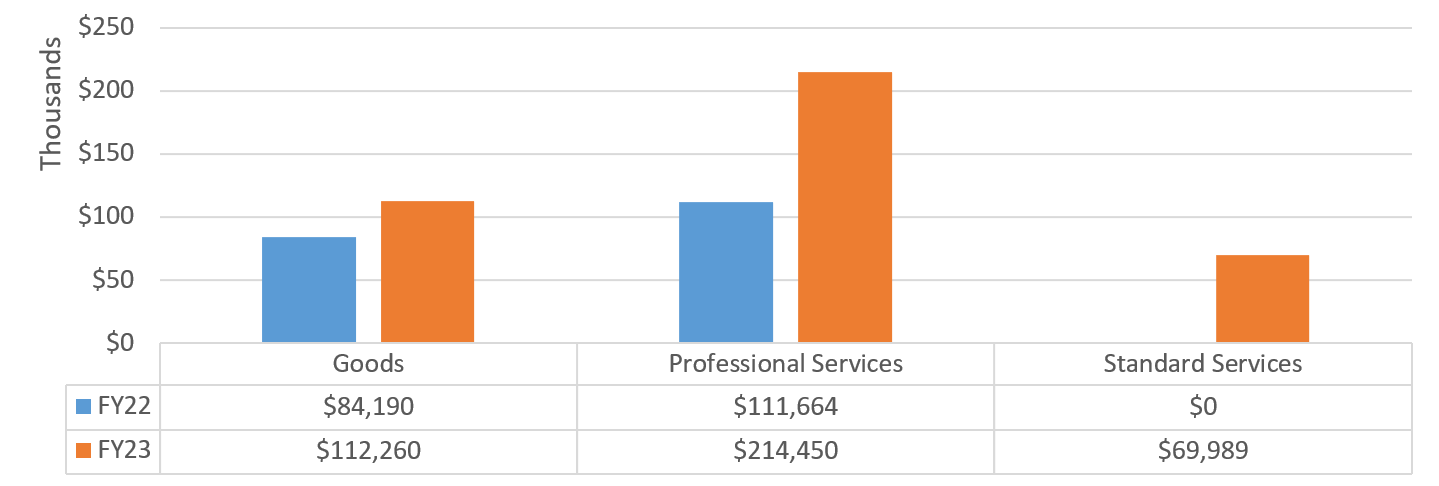
Department of Transportation (DOT)
The Department of Transportation (DOT) rehabilitates and maintains the City’s transportation infrastructure including bridges, tunnels, streets, sidewalks, and highways. DOT also encourages the use of mass transit and sustainable transportation, and conducts traffic safety programs, such as the Vision Zero initiative to reduce fatalities and serious injuries. Overall, DOT’s work maintains and enhances the transportation infrastructure crucial to the City’s economic vitality and quality of life for all City residents.
Table 51 – DOT: FY22-FY23 Registrations by Contract Category
| FY22 | FY23 | |||
|---|---|---|---|---|
| Contract Category | # of Contracts | Total Contract Value | # of Contracts | Total Contract Value |
| Competitive Method Contracts | 26 | $406,556,406 | 55 | $885,533,120 |
| Limited or Non-Competitive Method Contracts | 163 | $59,194,172 | 152 | $57,353,397 |
| Transactions Not Subject to PPB Rules | 13 | $11,265,110 | 3 | $15,774,314 |
| Supplemental Contracts | 27 | $510,093,120 | 19 | $66,481,901 |
| Grand Total | 229 | $987,108,808 | 229 | $1,025,142,732 |
Chart 52 – DOT: FY22-FY23 Volume of Contracts by Industry
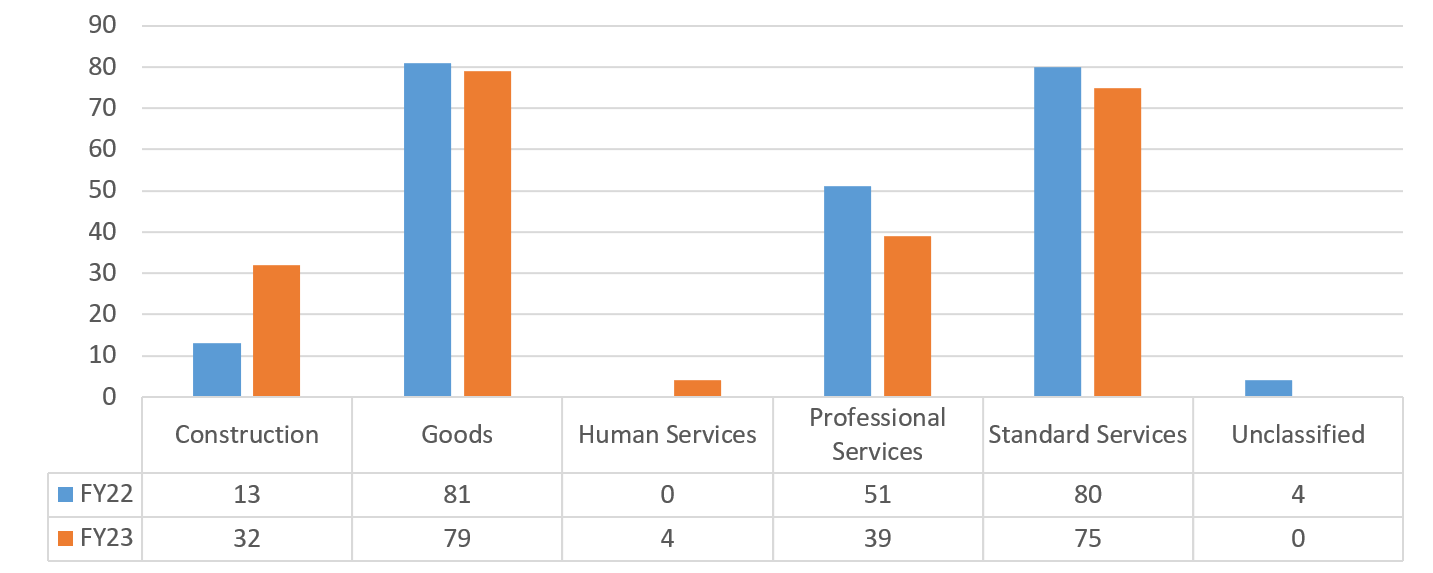
Chart 53 – DOT: FY22-FY23 Value of Contracts by Industry
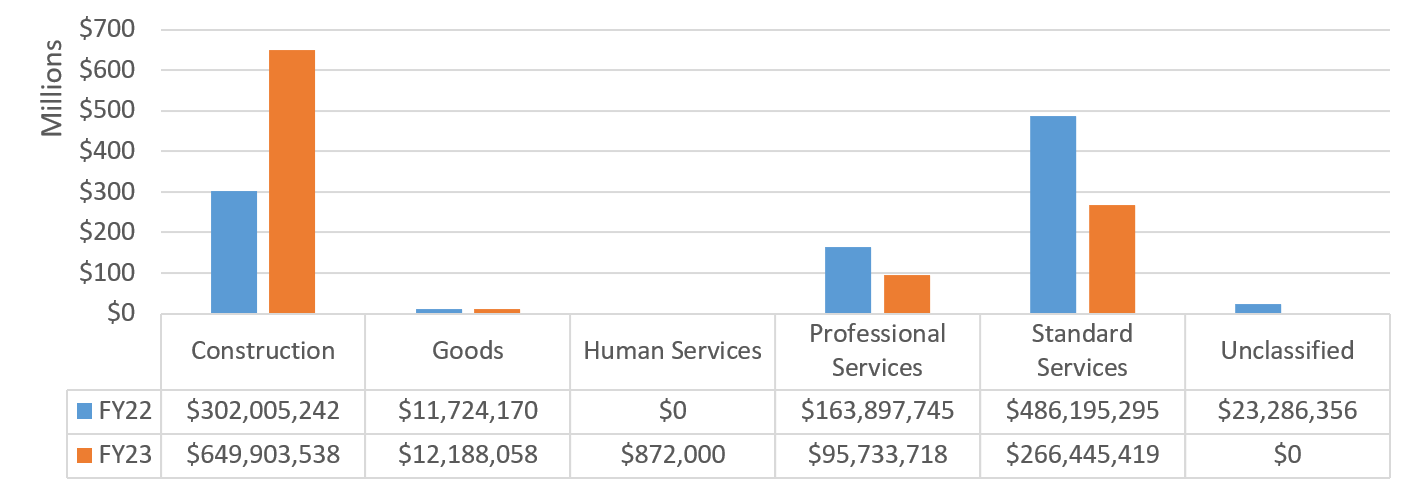
Department of Parks and Recreation (DPR)
The Department of Parks and Recreation is the City agency responsible for the protection and care of more than 5,000 individual properties on over 30,000 acres. These range from large-scale properties like Central Park and Coney Island Beach, to small community gardens and green streets. NYC Parks operates nearly 1,000 playgrounds, more than 800 athletic fields, 65 public pools and 51 recreational facilities, available to all New Yorkers citywide. NYC Parks also looks after 600,000 street trees, and two million more trees in parks.
Table 52 – DPR: FY22-FY23 Registrations by Contract Category
| FY22 | FY23 | |||
|---|---|---|---|---|
| Contract Category | # of Contracts | Total Contract Value | # of Contracts | Total Contract Value |
| Competitive Method Contracts | 136 | $521,390,051 | 132 | $602,653,601 |
| Limited or Non-Competitive Method Contracts | 158 | $25,192,155 | 251 | $26,348,561 |
| Transactions Not Subject to PPB Rules | 14 | $2,478,312 | 9 | $248,101 |
| Supplemental Contracts | 14 | $36,154,391 | 17 | $98,776,867 |
| Grand Total | 322 | $585,214,909 | 409 | $728,027,130 |
Chart 54 – DPR: FY22-FY23 Volume of Contracts by Industry
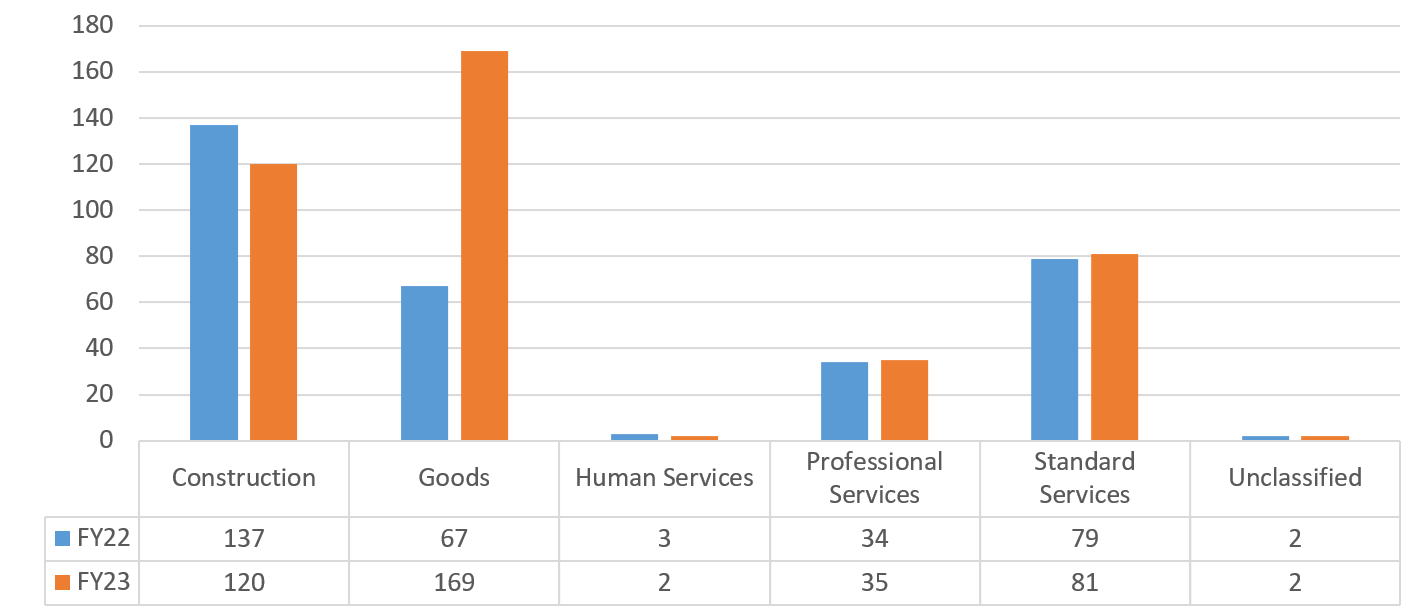
Chart 55 – DPR: FY22-FY23 Value of Contracts by Industry
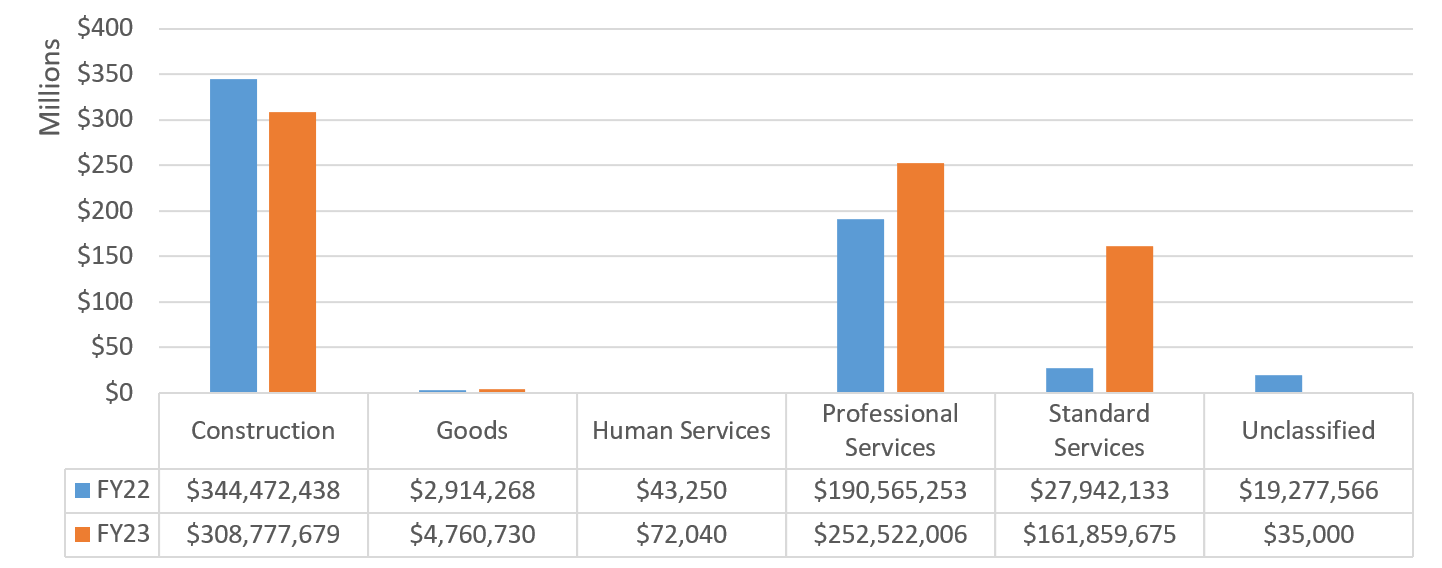
Department of Sanitation (DSNY)
The NYC Department of Sanitation is the world’s largest sanitation department. DSNY collects more than 10,500 tons of residential and institutional garbage and 1,760 tons of the recyclables each day. It also manages solid waste and clears litter or snow from 6,300 miles of streets.
Table 53 – DSNY: FY22-FY23 Registrations by Contract Category
| FY22 | FY23 | |||
|---|---|---|---|---|
| Contract Category | # of Contracts | Total Contract Value | # of Contracts | Total Contract Value |
| Competitive Method Contracts | 4 | $27,905,499 | 15 | $139,525,038 |
| Limited or Non-Competitive Method Contracts | 90 | $14,137,831 | 81 | $36,293,127 |
| Supplemental Contracts | 20 | $117,793,985 | 19 | $54,842,493 |
| Grand Total | 114 | $159,837,315 | 115 | $230,660,658 |
Chart 56 – DSNY: FY22-FY23 Volume of Contracts by Industry
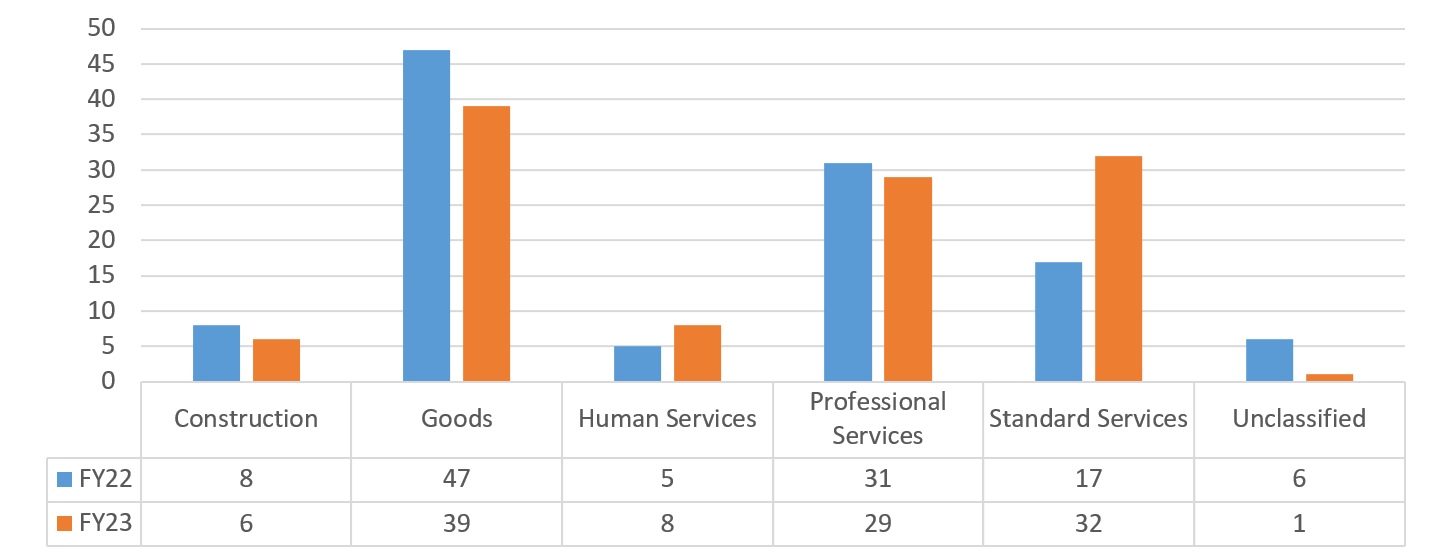
Chart 57 – DSNY: FY22-FY23 Value of Contracts by Industry
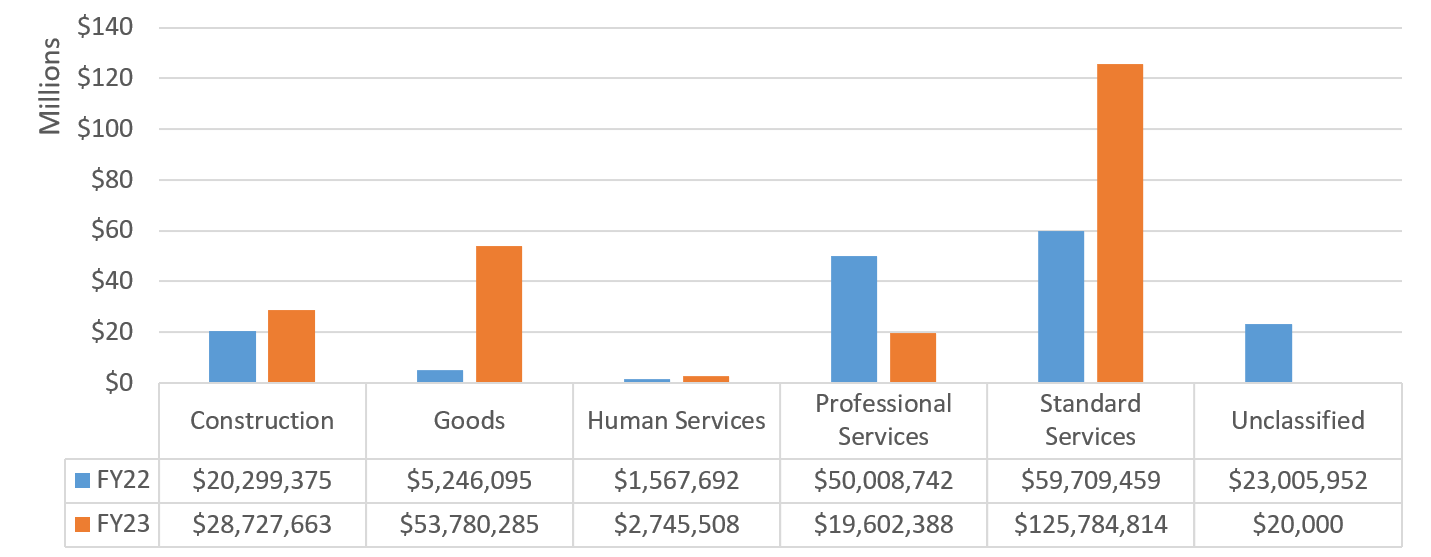
Department of Homeless Services (DSS/DHS)
The Department of Homeless Services collaborates with nonprofit partners to provide temporary shelter and services that homeless New Yorkers need to achieve and maintain housing permanency.
Table 54 – DSS/DHS: FY22-FY23 Registrations by Contract Category
| FY22 | FY23 | |||
|---|---|---|---|---|
| Contract Category | # of Contracts | Total Contract Value | # of Contracts | Total Contract Value |
| Competitive Method Contracts | 61 | $5,222,450,779 | 56 | $4,954,498,674 |
| Limited or Non-Competitive Method Contracts | 61 | $50,441,842 | 116 | $725,888,138 |
| Supplemental Contracts | 49 | $1,077,623,629 | 60 | $1,451,567,913 |
| Grand Total | 171 | $6,350,516,249 | 232 | $7,131,954,726 |
Chart 58 – DSS/DHS: FY22-FY23 Volume of Contracts by Industry
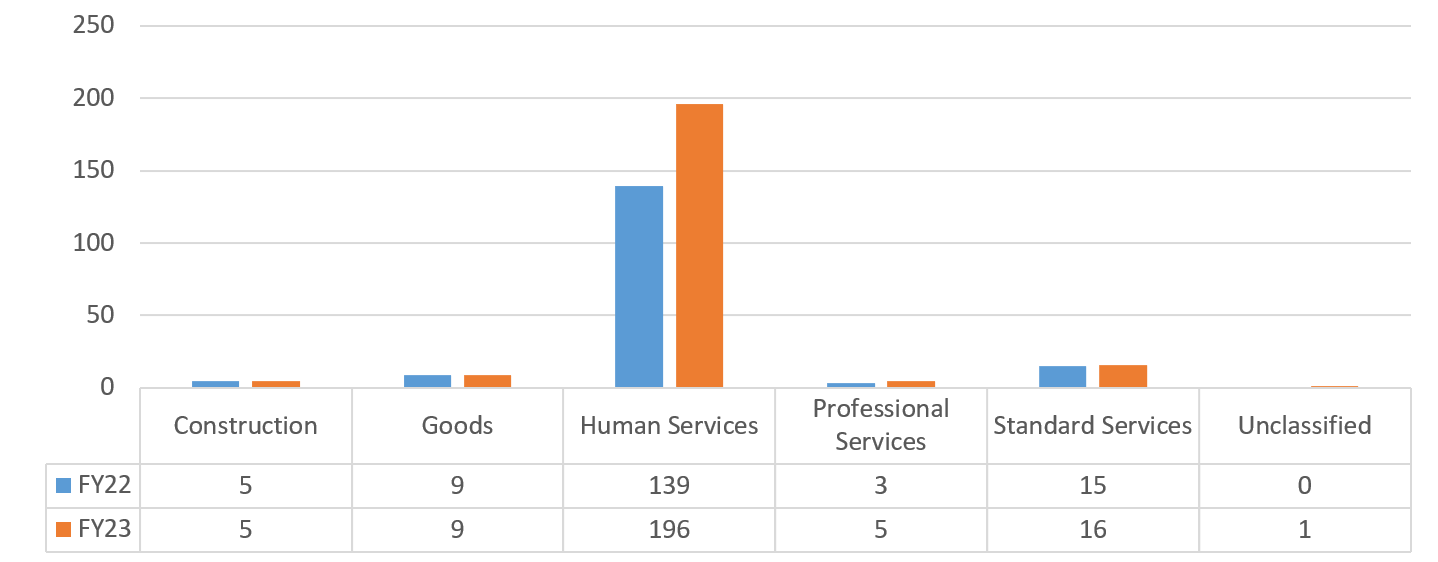
Chart 59 – DSS/DHS: FY22-FY23 Value of Contracts by Industry
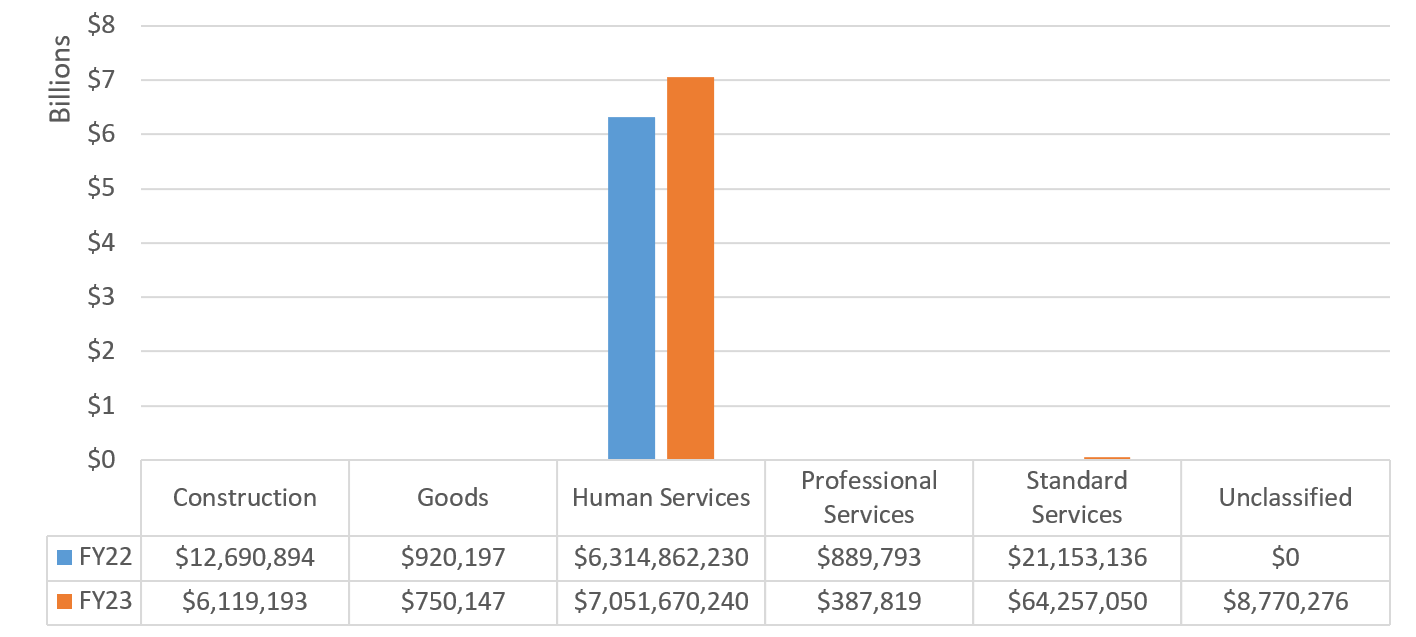
Human Resources Administration (DSS/HRA)
The Department of Social Services/Human Resources Administration (DSS/HRA) provides New Yorkers in need with essential benefits, such as food assistance, employment services, and emergency rental assistance. As the largest municipal social services agency in the country, DSS/HRA helps more than 3 million New Yorkers through the administration of more than 12 major public assistance programs.
Table 55 – DSS/HRA: FY22-23 Registrations by Contract Category
| FY22 | FY23 | |||
|---|---|---|---|---|
| Contract Category | # of Contracts | Total Contract Value | # of Contracts | Total Contract Value |
| Competitive Method Contracts | 34 | $198,690,175 | 44 | $303,868,078 |
| Limited or Non-Competitive Method Contracts | 396 | $402,070,253 | 400 | $589,985,479 |
| Transactions Not Subject to PPB Rules | 5 | $166,365 | 13 | $912,728 |
| Supplemental Contracts | 71 | $559,556,645 | 28 | $172,807,128 |
| Grand Total | 506 | $1,160,483,438 | 485 | $1,067,573,413 |
Chart 60 – DSS/HRA: FY22-FY23 Volume of Contracts by Industry
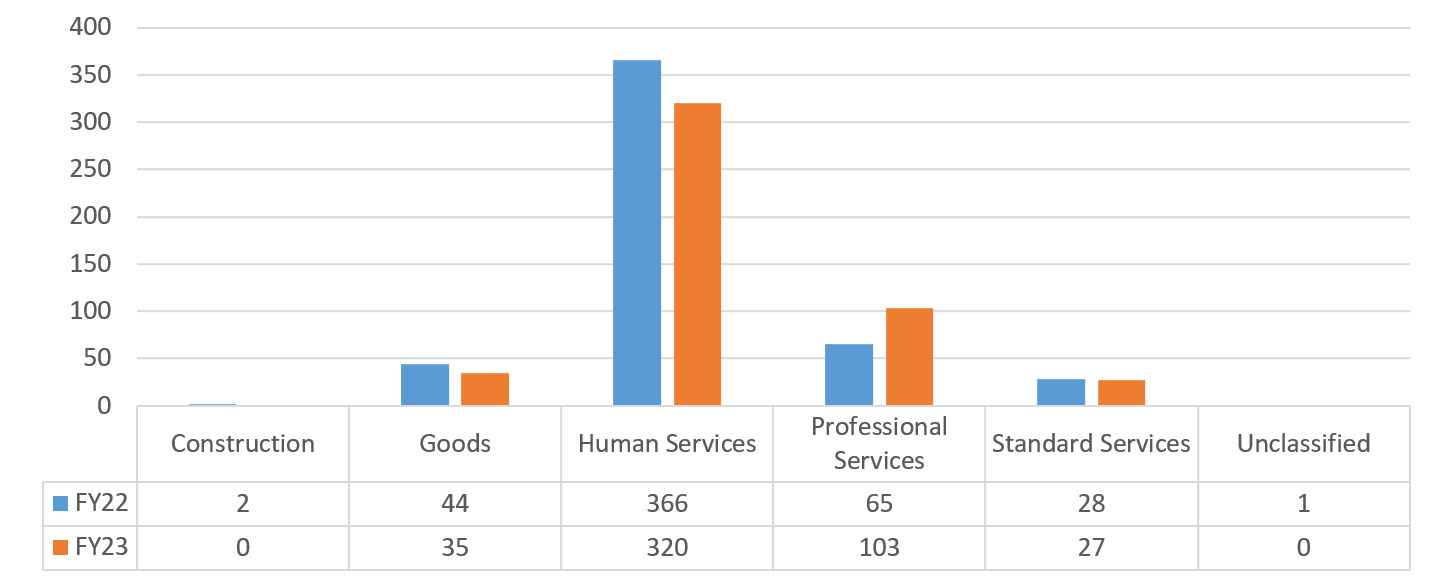
Chart 61 – DSS/HRA: FY22-FY23 Value of Contracts by Industry
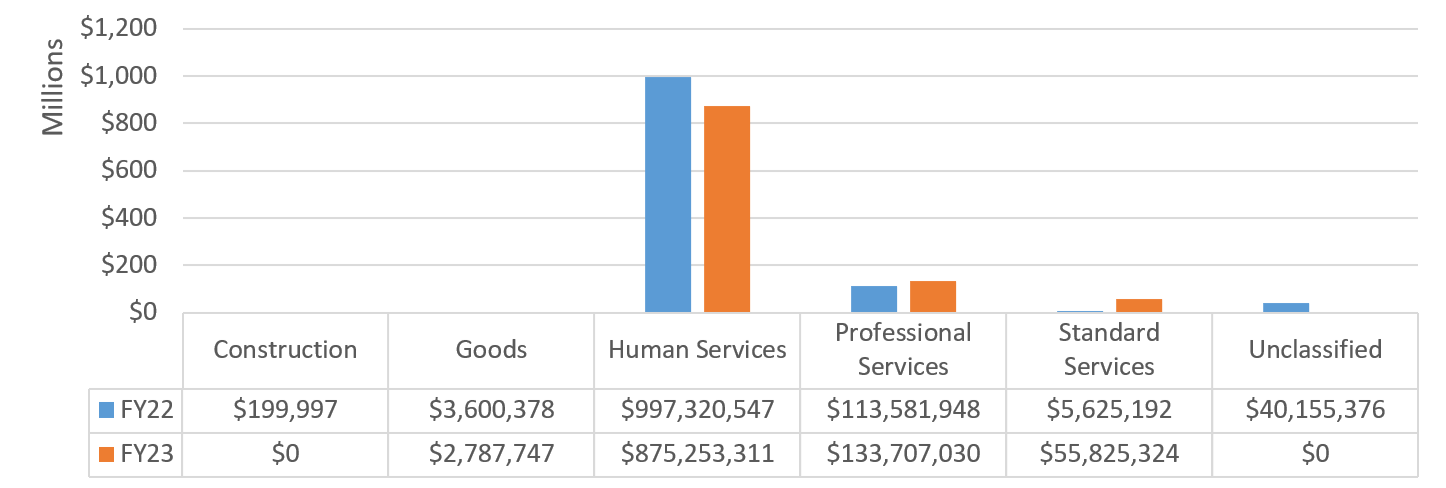
Department of Youth and Community Development (DYCD)
The New York City Department of Youth and Community Development (DYCD) invests in a network of community-based organizations and programs to alleviate the effects of poverty and to provide opportunities for New Yorkers and communities to flourish. DYCD supports New York City youth and their families by funding a wide range of high-quality youth and community development programs, including After School, Community Development, Family Support, Literacy Services, Youth Services, and Youth Workforce Development.
Table 56 – DYCD: FY22-FY23 Registrations by Contract Category
| FY22 | FY23 | |||
|---|---|---|---|---|
| Contract Category | # of Contracts | Total Contract Value | # of Contracts | Total Contract Value |
| Competitive Method Contracts | 1 | $2,899,952 | 79 | $43,294,056 |
| Limited or Non-Competitive Method Contracts | 1,760 | $541,679,002 | 1,424 | $203,554,438 |
| Transactions Not Subject to PPB Rules | 2 | $59,350 | 4 | $515,463 |
| Supplemental Contracts | 183 | $120,910,538 | 60 | $189,650,480 |
| Grand Total | 1,946 | $665,548,842 | 1,567 | $437,014,437 |
Chart 62 – DYCD: FY22-FY23 Volume of Contracts by Industry
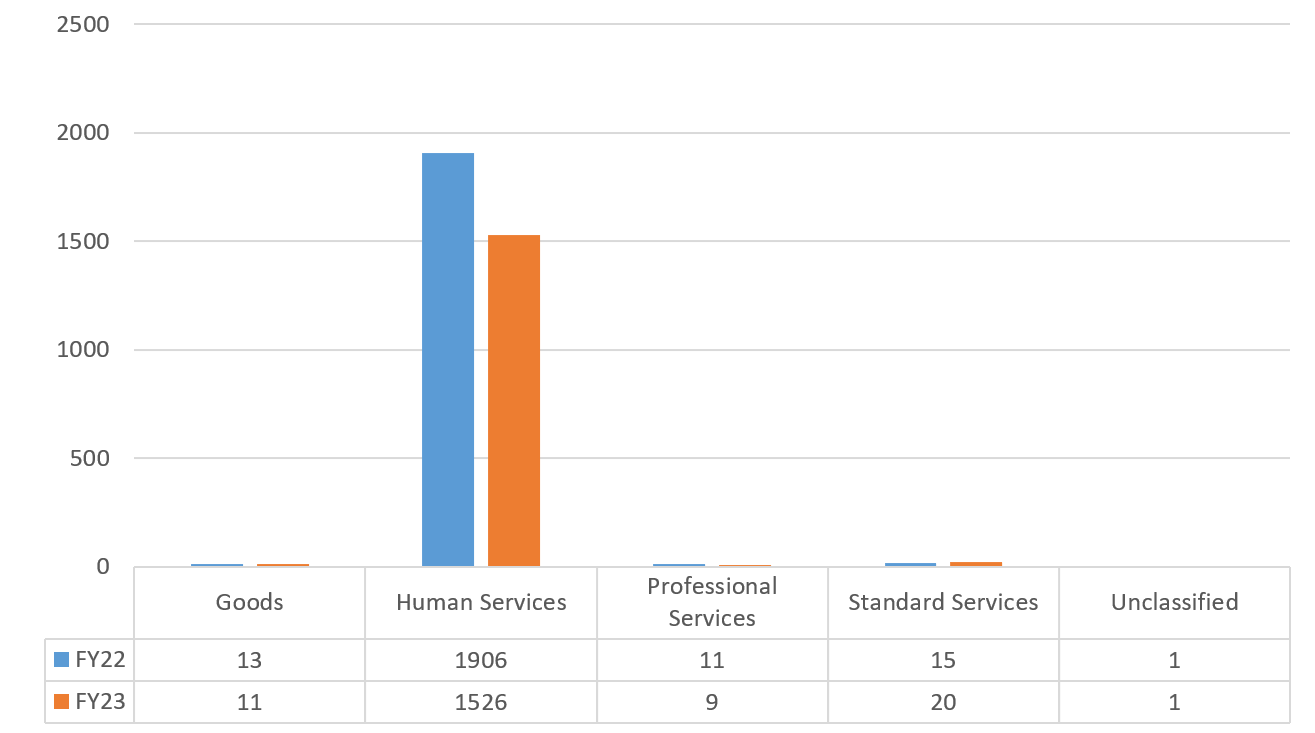
Chart 63 – DYCD: FY22-FY23 Value of Contracts by Industry
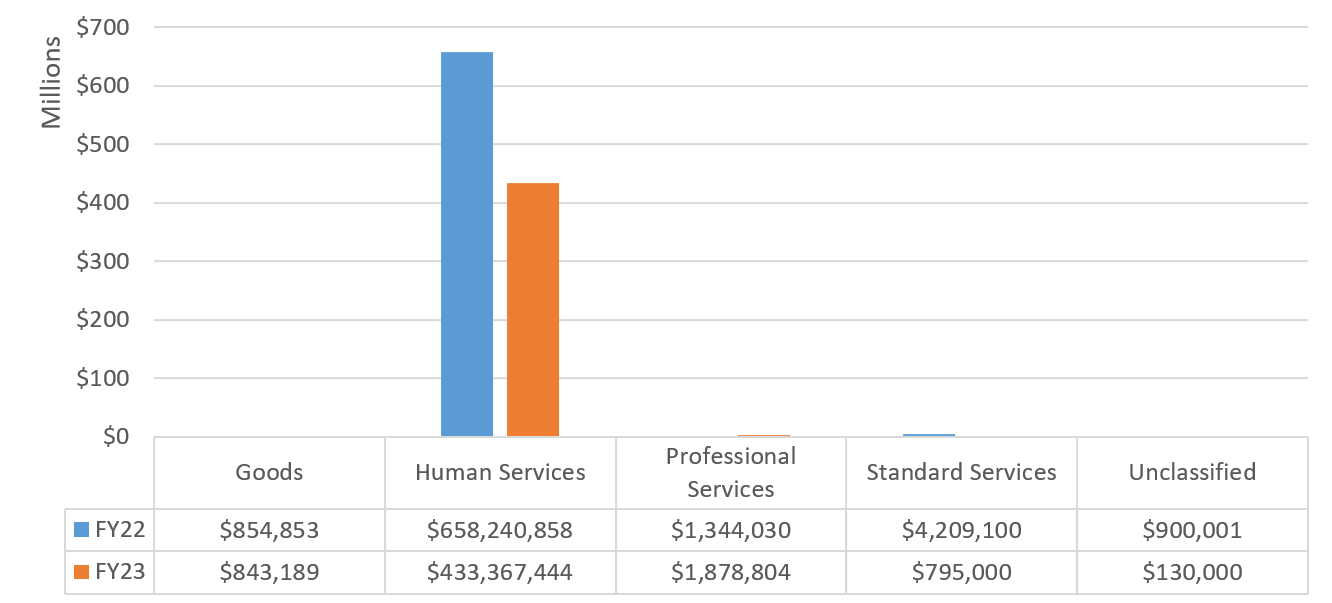
Fire Department (FDNY)
The Fire Department of the City of New York (FDNY) is the largest Fire Department in the United States. The Department’s main goal is to provide fire protection and other critical public safety services to residents and visitors in the five boroughs. The Department also works to continually educate the public in fire, life safety and disaster preparedness, along with enforcing public safety codes.
Table 57 – FDNY: FY22-FY23 Registrations by Contract Category
| FY22 | FY23 | |||
|---|---|---|---|---|
| Contract Category | # of Contracts | Total Contract Value | # of Contracts | Total Contract Value |
| Competitive Method Contracts | 3 | $27,305,463 | 3 | $70,572,311 |
| Limited or Non-Competitive Method Contracts | 114 | $19,464,160 | 89 | $58,095,367 |
| Transactions Not Subject to PPB Rules | 8 | $575,159 | 11 | $14,792,987 |
| Supplemental Contracts | 8 | $232,184,044 | 4 | $11,241,230 |
| Grand Total | 133 | $279,528,826 | 107 | $154,701,894 |
Chart 64 – FDNY: FY22-FY23 Volume of Contracts by Industry
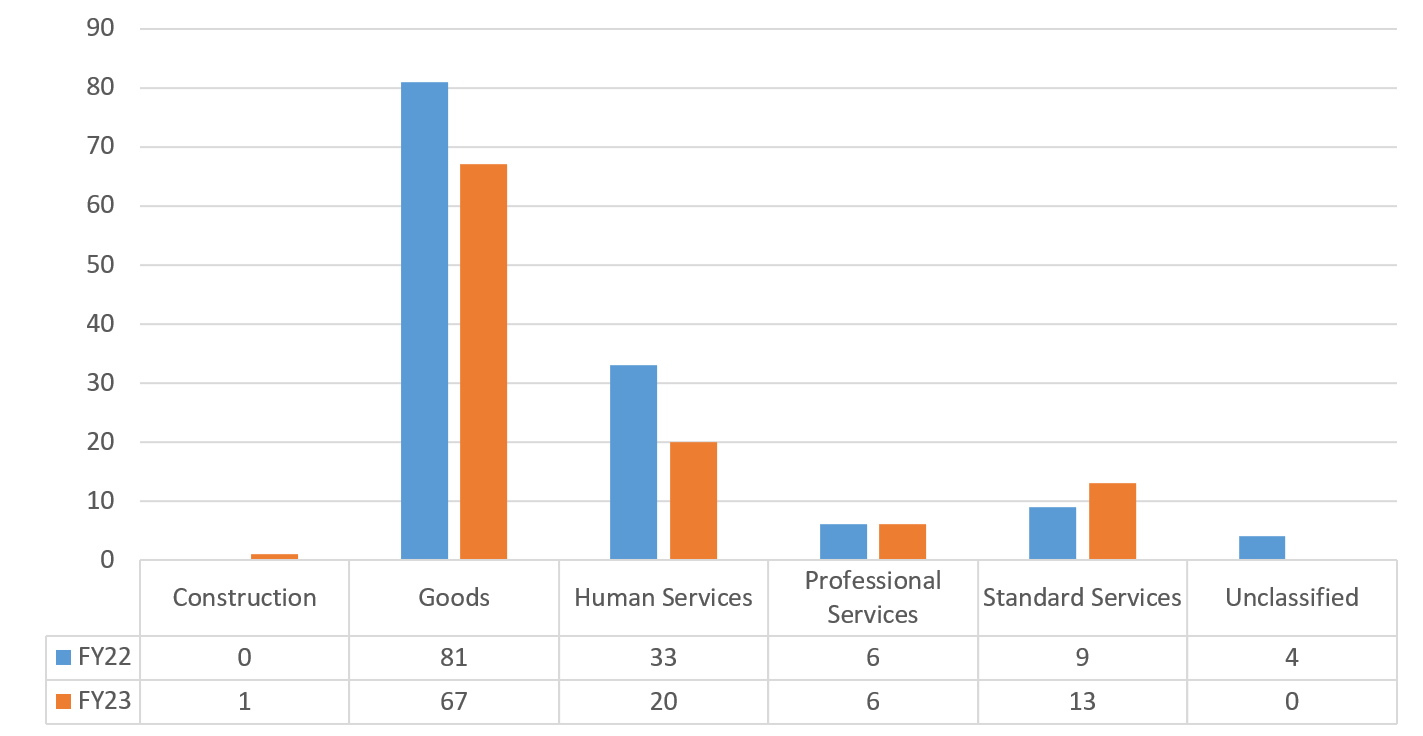
Chart 65 – FDNY: FY22-FY23 Value of Contracts by Industry
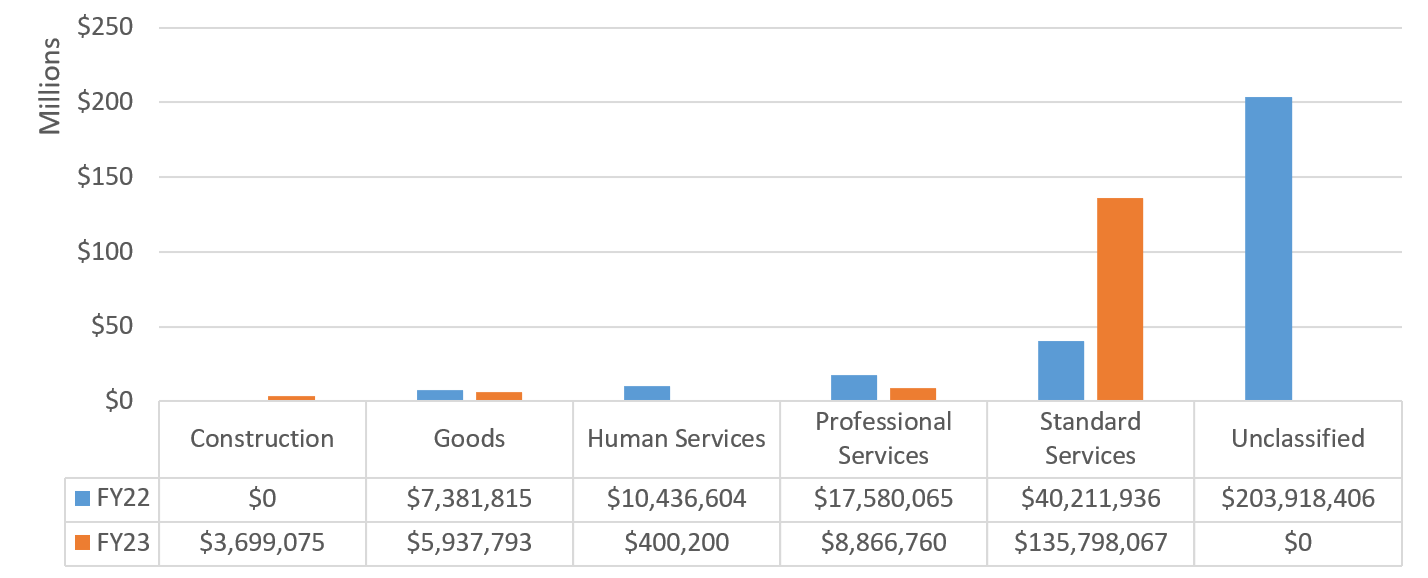
Department of Housing Preservation and Development (HPD)
The Department of Housing Preservation and Development (HPD) is the largest municipal housing improvement agency in the United States, developing and preserving affordable housing in every borough. HPD enforces housing quality standards, finances affordable housing development, and preserves existing affordable housing. HPD also manages the City’s affordable housing stock for the benefit of low- and moderate-income families. Additionally, HPD monitors and tracks incidents that result in mass displacement of residential and commercial tenants.
Table 58 – HPD: FY22-FY23 Registrations by Contract Category
| FY22 | FY23 | |||
|---|---|---|---|---|
| Contract Category | # of Contracts | Total Contract Value | # of Contracts | Total Contract Value |
| Competitive Method Contracts | 35 | $25,464,375 | 32 | $15,778,989 |
| Limited or Non-Competitive Method Contracts | 239 | $58,394,017 | 230 | $67,954,828 |
| Transactions Not Subject to PPB Rules | 1 | $642,024 | 2 | $1,326,145 |
| Supplemental Contracts | 11 | $26,169,249 | 9 | $47,585,324 |
| Grand Total | 286 | $110,669,666 | 273 | $132,645,285 |
Chart 66 – HPD: FY22-FY23 Volume of Contracts by Industry
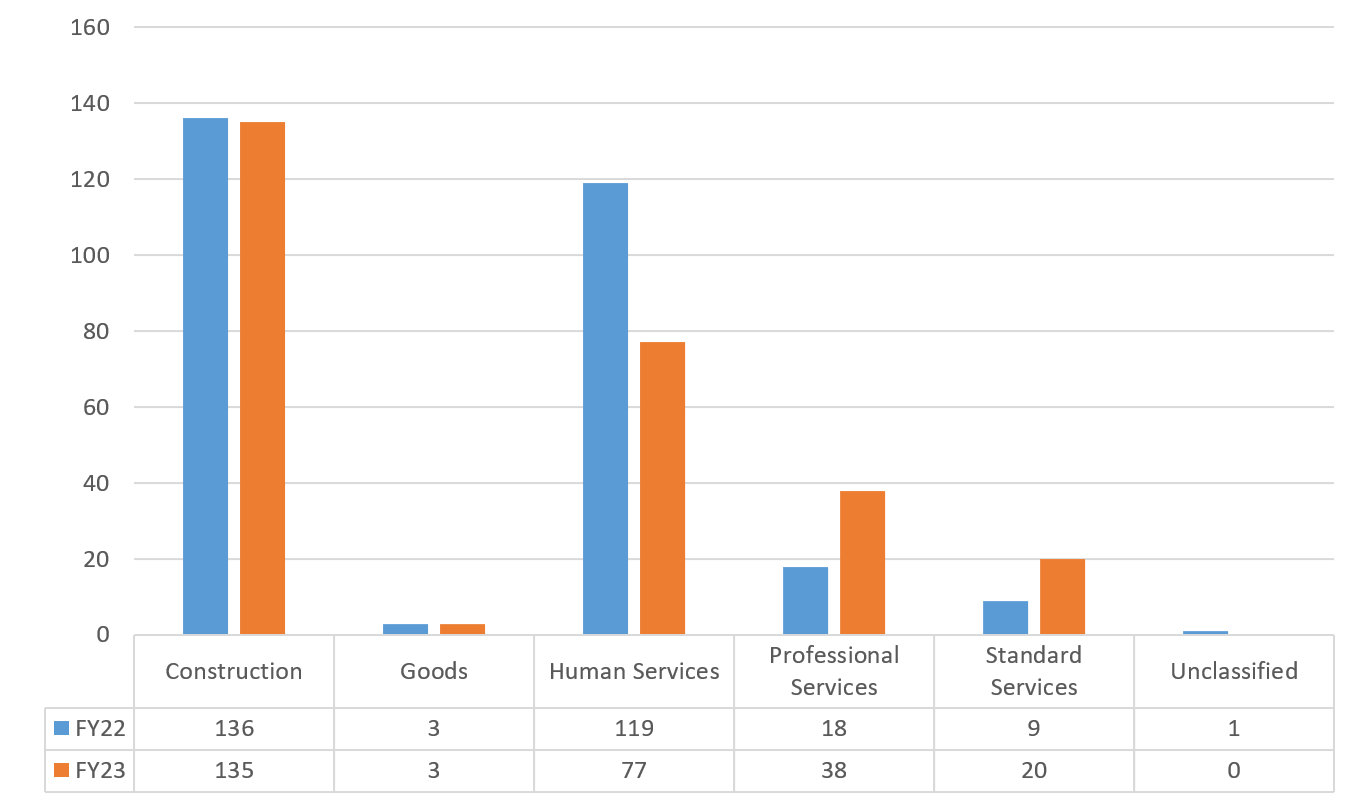
Chart 67 – HPD: FY22-FY23 Value of Contracts by Industry
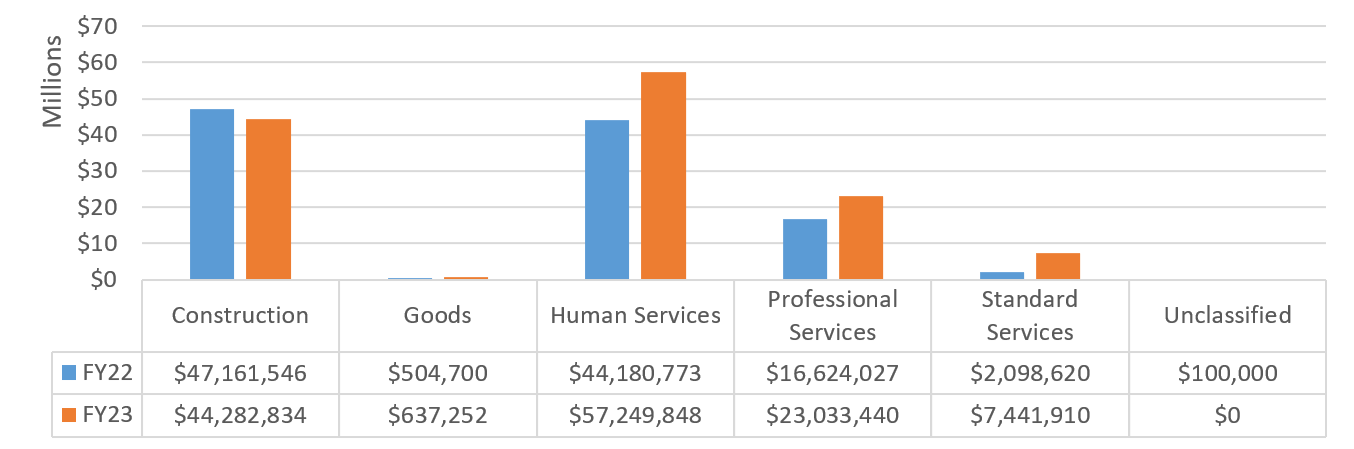
Law Department (LAW)
The Law Department represents the City, the Mayor, other elected officials, and the City’s many agencies in all affirmative and defensive civil litigation, juvenile delinquency proceedings brought in Family Court, and Administrative Code enforcement proceedings brought in Criminal Court. The Law Department attorneys draft and review State and local legislation, real estate leases, contracts, and financial instruments for the sale of municipal bonds. The agency also provides legal counsel to City officials on a wide range of issues such as immigration, education, and environmental policy.
Table 59 – LAW: FY22-FY23 Registrations by Contract Category
| FY22 | FY23 | |||
|---|---|---|---|---|
| Contract Category | # of Contracts | Total Contract Value | # of Contracts | Total Contract Value |
| Competitive Method Contracts | 1 | $2,000,000 | 1 | $40,000,000 |
| Limited or Non-Competitive Method Contracts | 27 | $22,257,804 | 65 | $34,121,302 |
| Transactions Not Subject to PPB Rules | 1 | $238,772 | 3 | $504,798 |
| Supplemental Contracts | 6 | $18,150,000 | 3 | $13,500,000 |
| Grand Total | 35 | $42,646,576 | 72 | $88,126,099 |
Chart 68 – LAW: FY22-FY23 Volume of Contracts by Industry
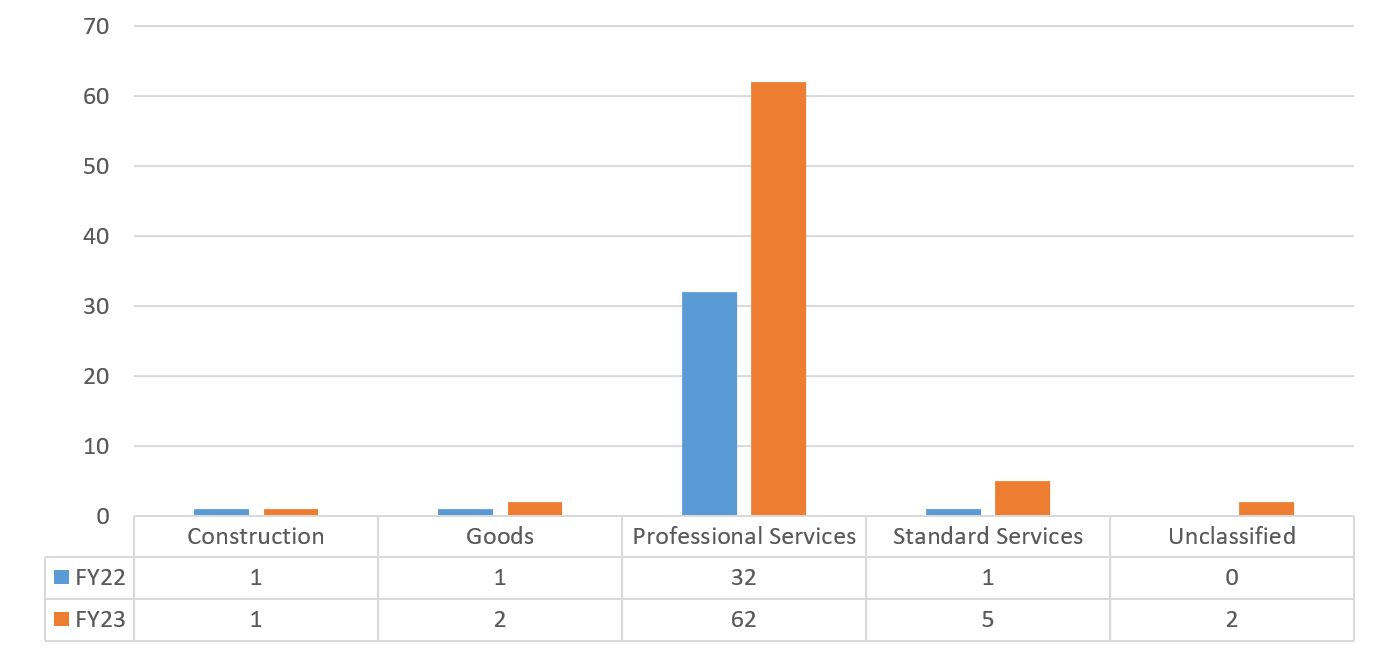
Chart 69 – LAW: FY22-FY23 Value of Contracts by Industry
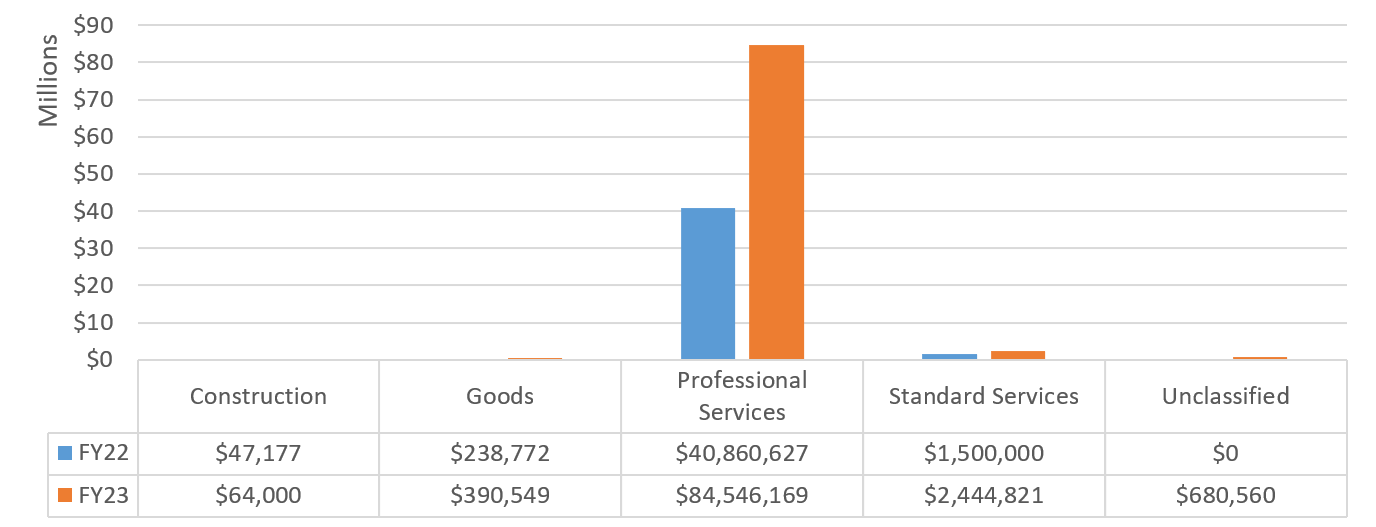
Landmarks Preservation Commission (LPC)
The Landmarks Preservation Commission (LPC) designates, regulates, and protects the City’s architectural, historic, and cultural resources. This includes 1,412 individual landmarks and more than 36,000 properties in 144 historic districts and extensions. The Commission reviews applications to alter landmark structures, investigates complaints of illegal work, and initiates actions to compel compliance with the Landmarks Law.
Table 60 – LPC: FY22-FY23 Registrations by Contract Category
| FY22 | FY23 | |||
| Contract Category | # of Contracts | Total Contract Value | # of Contracts | Total Contract Value |
| Limited or Non-Competitive Method Contracts | 1 | $22,500 | 2 | $67,230 |
| Grand Total | 1 | $22,500 | 2 | $67,230 |
Chart 70 – LPC: FY22-FY23 Volume of Contracts by Industry
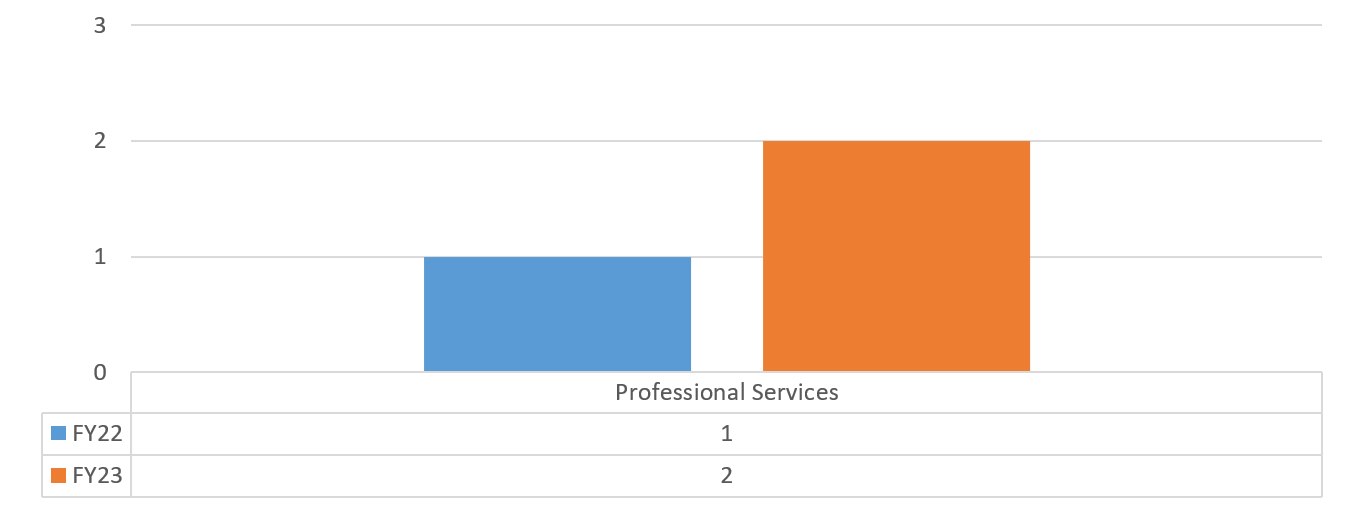
Chart 71 – LPC: FY22-FY23 Value of Contracts by Industry
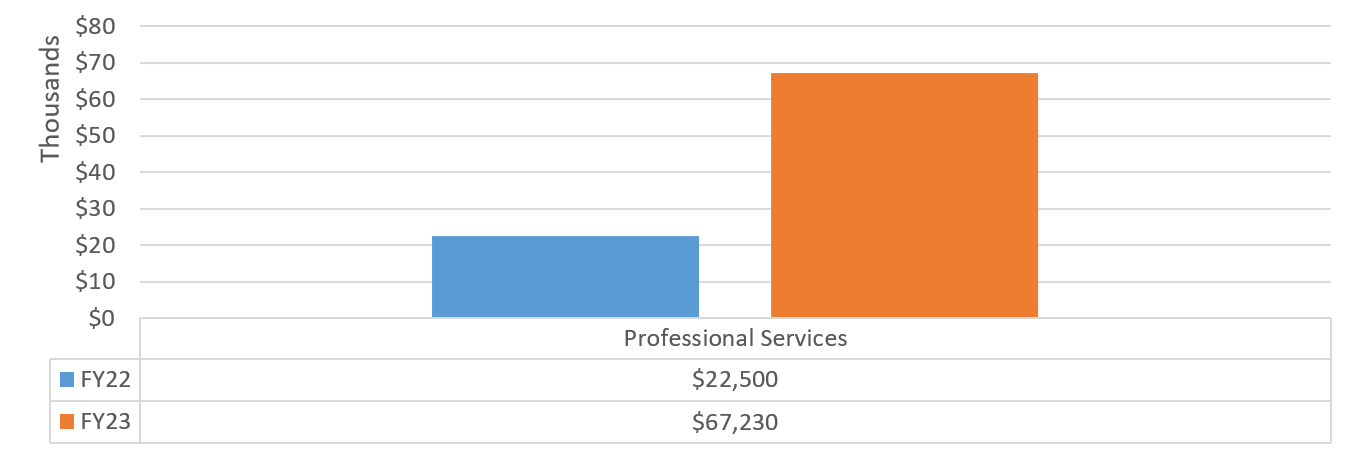
Mayoralty (MAYOR)
The Mayor is the City’s chief executive officer, setting the agenda for the City and its finances and appointing Deputy Mayors and heads of agencies to carry out policies. Various offices operate under the Mayor to support numerous administrative and policy functions.
Table 61 – MAYOR: FY22-FY23 Registrations by Contract Category
| FY22 | FY23 | |||
|---|---|---|---|---|
| Contract Category | # of Contracts | Total Contract Value | # of Contracts | Total Contract Value |
| Competitive Method Contracts | 15 | $87,118,694 | 9 | $387,446,630 |
| Limited or Non-Competitive Method Contracts | 173 | $429,974,197 | 201 | $1,031,048,787 |
| Transactions Not Subject to PPB Rules | 17 | $1,640,629 | 15 | $1,170,670 |
| Supplemental Contracts | 23 | $695,911,628 | 34 | $204,511,454 |
| Grand Total | 228 | $1,214,645,148 | 259 | $1,624,177,541 |
Chart 72 – MAYOR: FY22-FY23 Volume of Contracts by Industry
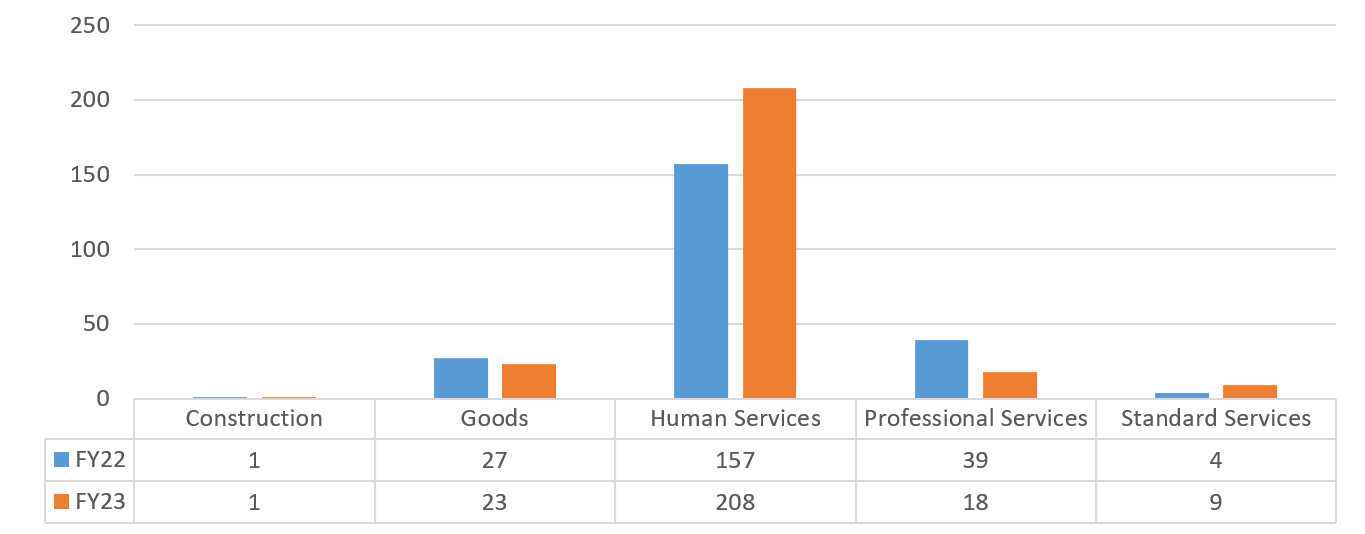
Chart 73 – MAYOR: FY22-FY23 Value of Contracts by Industry
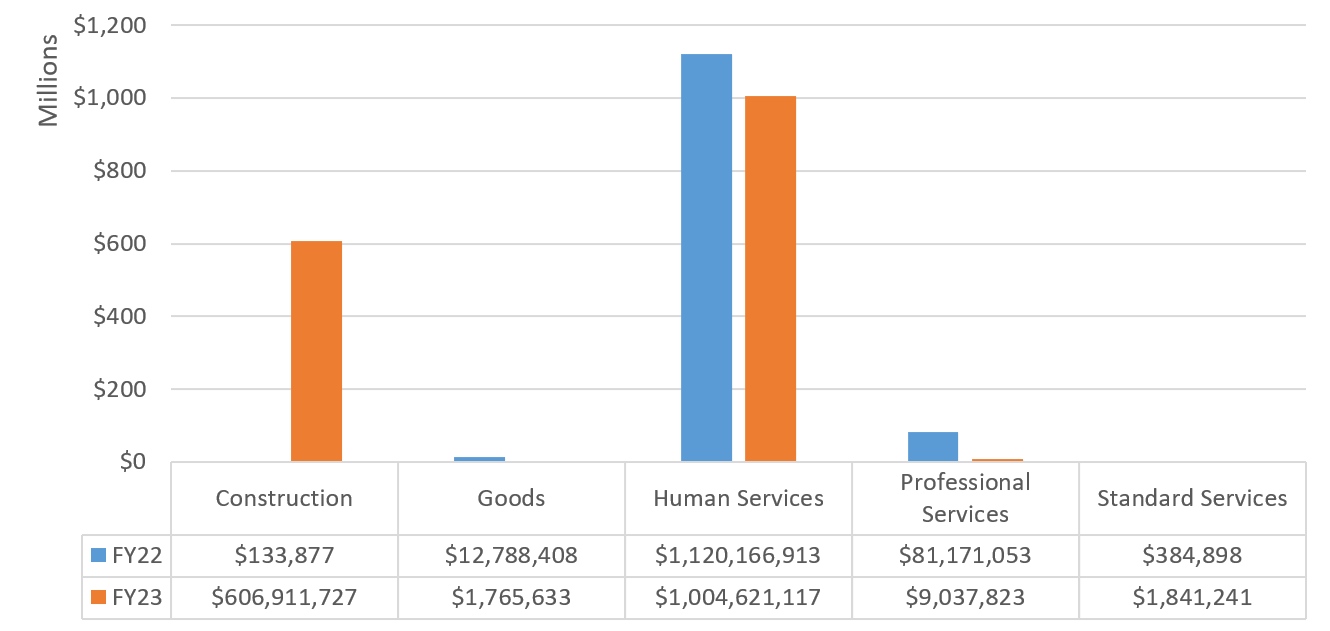
New York City Emergency Management (NYCEM)
New York City Emergency Management (NYCEM) is responsible for coordinating citywide emergency planning and response for all types and scales of emergencies.
Table 62 – NYCEM: FY22-FY23 Registrations by Contract Category
| FY22 | FY23 | |||
|---|---|---|---|---|
| Contract Category | # of Contracts | Total Contract Value | # of Contracts | Total Contract Value |
| Competitive Method Contracts | 32 | $43,268,900 | 3 | $30,730,200 |
| Limited or Non-Competitive Method Contracts | 29 | $166,981,925 | 36 | $214,055,422 |
| Supplemental Contracts | 5 | $2,344,722 | 11 | $84,295,788 |
| Grand Total | 66 | $212,595,546 | 50 | $329,081,410 |
Chart 74 – NYCEM: FY22-FY23 Volume of Contracts by Industry
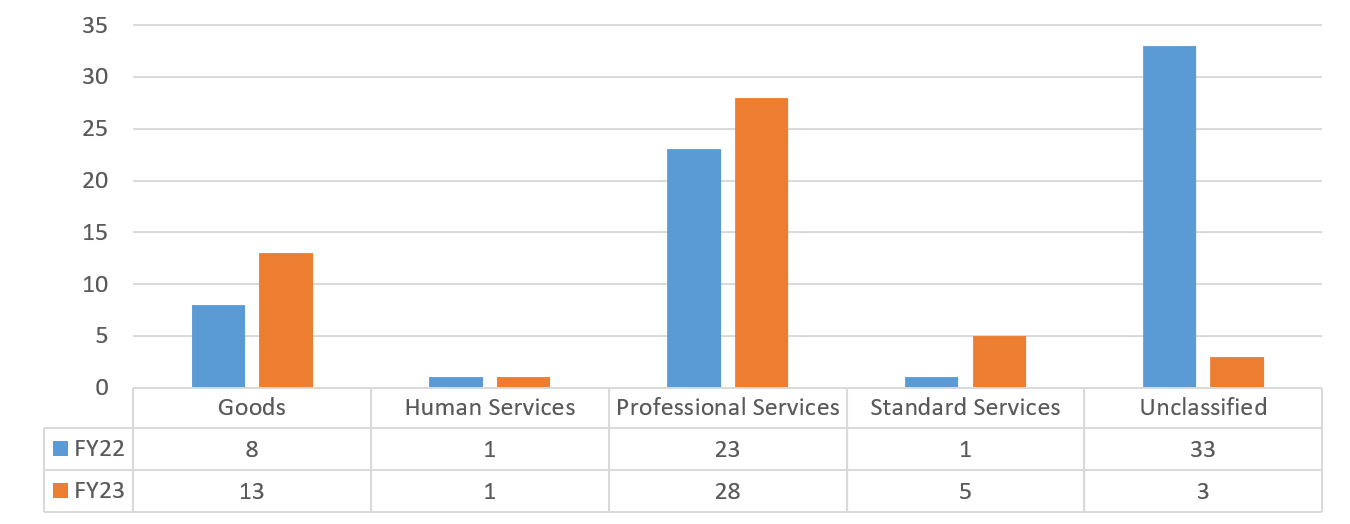
Chart 75 – NYCEM: FY22-FY23 Value of Contracts by Industry
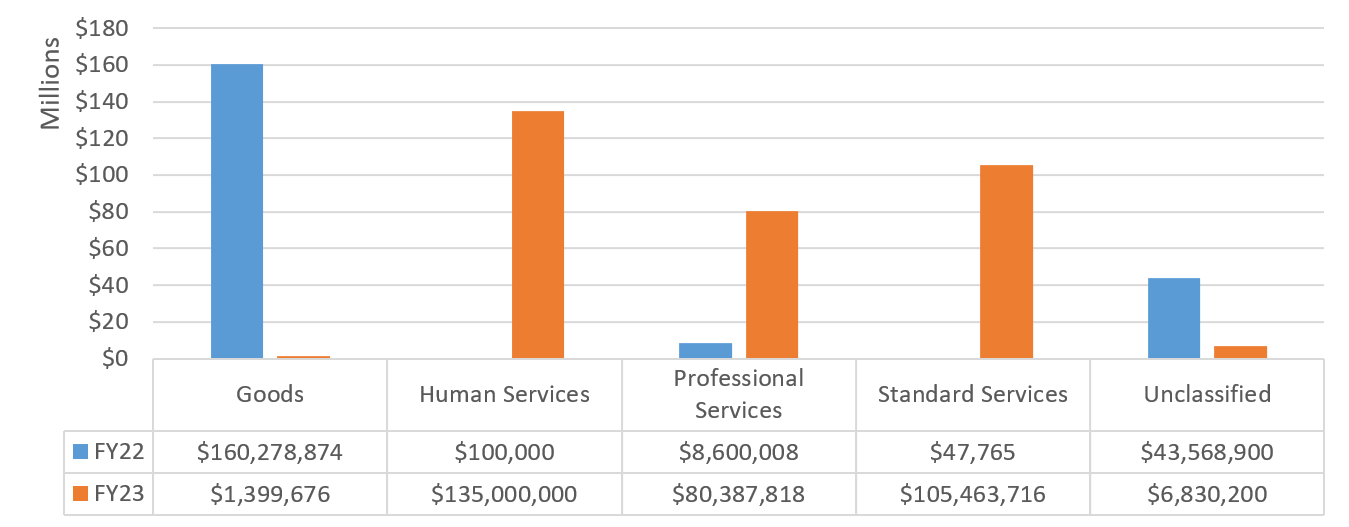
New York City Police Department (NYPD)
The New York City Police Department (NYPD) is tasked with enforcing City and State laws, preserving the peace, and providing a safe environment for all New Yorkers. The NYPD deploys more than 30,000 uniformed officers across 77 precincts, 12 transit bureaus, nine New York City Housing Authority (NYCHA) Police Service Areas, and in specialized units such as the Intelligence, Counterterrorism, Aviation, Marine, and Organized Crime Control.
Table 63 – NYPD: FY22-FY23 Registrations by Contract Category
| FY22 | FY23 | |||
|---|---|---|---|---|
| Contract Category | # of Contracts | Total Contract Value | # of Contracts | Total Contract Value |
| Competitive Method Contracts | 18 | $48,902,294 | 8 | $11,585,630 |
| Limited or Non-Competitive Method Contracts | 254 | $155,880,155 | 243 | $64,752,597 |
| Transactions Not Subject to PPB Rules | 2 | $3,299,518 | 3 | $264,900 |
| Supplemental Contracts | 22 | $55,061,900 | 19 | $85,156,614 |
| Grand Total | 296 | $263,143,866 | 273 | $161,759,742 |
Chart 76 – NYPD: FY22-FY23 Volume of Contracts by Industry
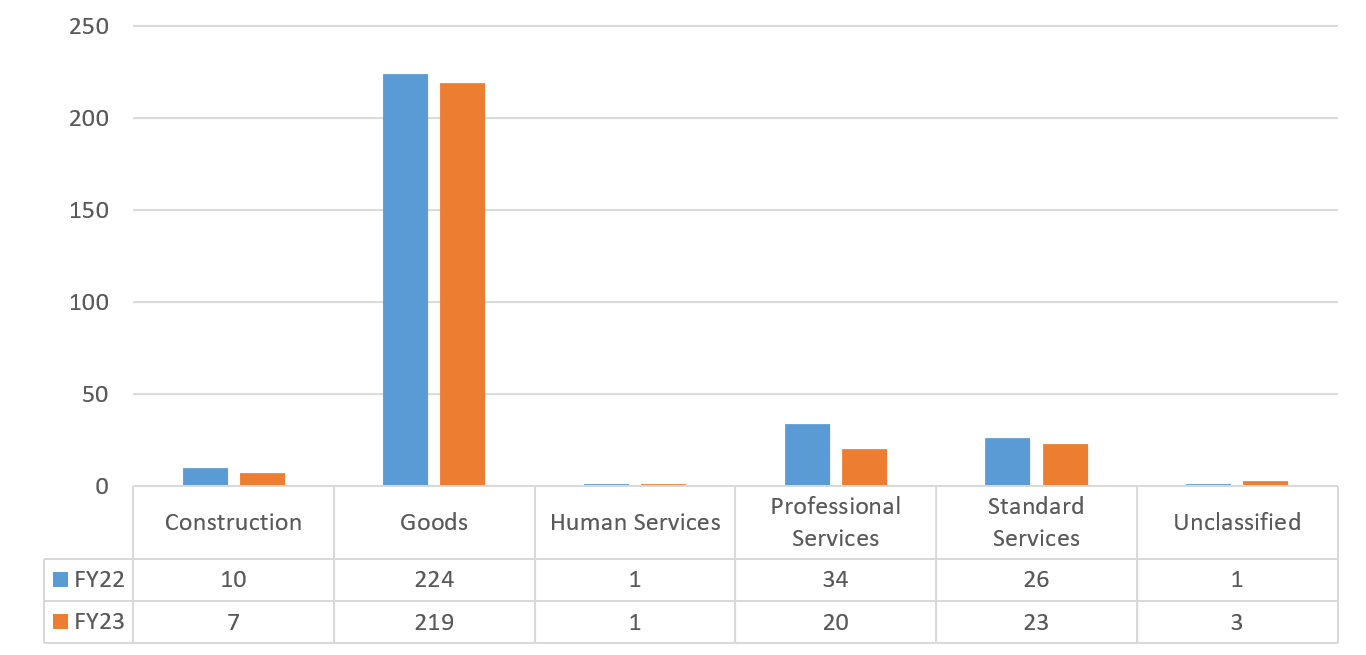
Chart 77 – NYPD: FY22-FY23 Value of Contracts by Industry
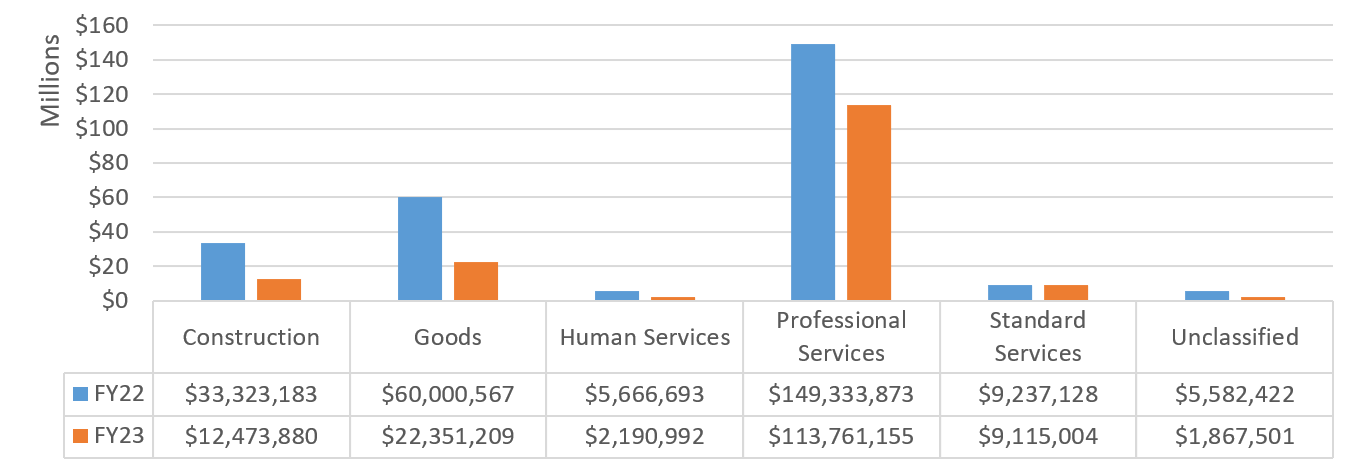
Office of Technology Innovation (OTI)
OTI works with over 100 City offices and agencies to deliver technology solutions support. OTI establishes the strategic direction for citywide IT operations and leverages the City’s buying power to make it easier for City agencies to acquire IT goods and services through requirement contracts with vendors.
Table 64 – OTI: FY22-FY23 Registrations by Contract Category
| FY22 | FY23 | |||
|---|---|---|---|---|
| Contract Category | # of Contracts | Total Contract Value | # of Contracts | Total Contract Value |
| Competitive Method Contracts | 0 | $0 | 26 | $383,000,000 |
| Limited or Non-Competitive Method Contracts | 134 | $511,075,935 | 187 | $447,995,499 |
| Transactions Not Subject to PPB Rules | 10 | $412,088 | 8 | $302,568 |
| Supplemental Contracts | 20 | $346,593,504 | 12 | $544,065,207 |
| Grand Total | 164 | $858,081,527 | 233 | $1,375,363,275 |
Chart 78 – OTI: FY22-FY23 Volume of Contracts by Industry
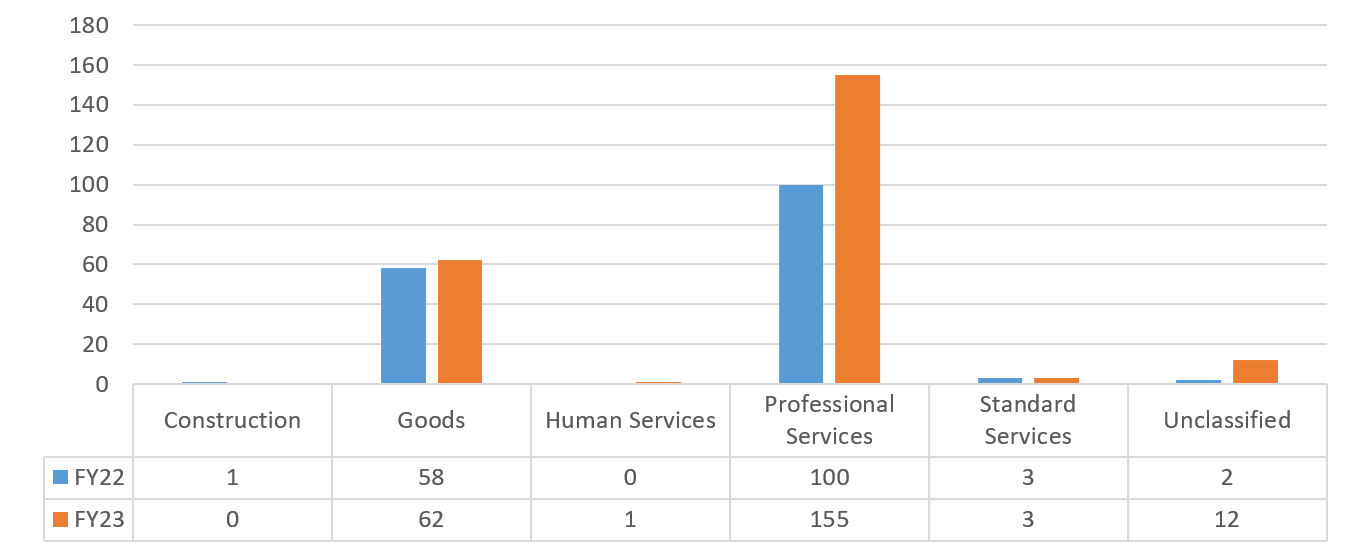
Chart 79 – OTI: FY22-FY23 Value of Contracts by Industry
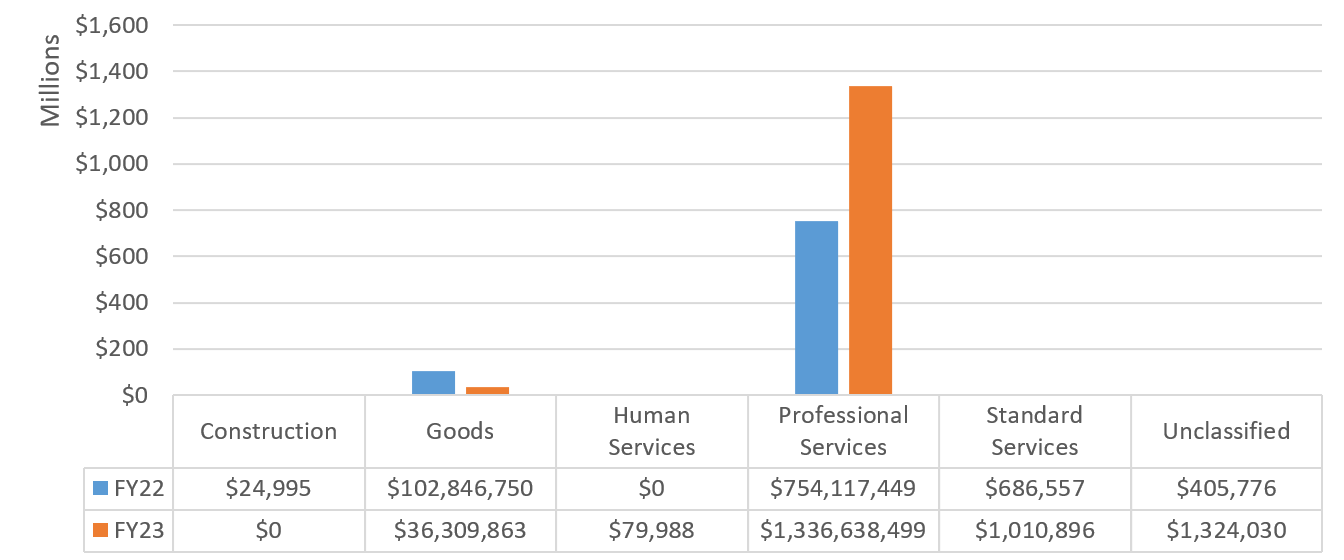
Small Business Services (SBS)
Small Business Services (SBS) is dedicated to providing direct assistance to business owners and fostering neighborhood development in commercial districts. SBS also links employers to a skilled and qualified workforce in New York City. Working in coordination with the Office of M/WBE and MOCS, SBS implements the M/WBE program to continue to promote diversity, fairness, and equity in the City’s procurement processes.
Table 65 – SBS: FY22-FY23 Registrations by Contract Category
| FY22 | FY23 | |||
|---|---|---|---|---|
| Contract Category | # of Contracts | Total Contract Value | # of Contracts | Total Contract Value |
| Competitive Method Contracts | 0 | $0 | 2 | $2,880,000 |
| Limited or Non-Competitive Method Contracts | 185 | $339,992,117 | 152 | $690,249,488 |
| Transactions Not Subject to PPB Rules | 10 | $2,425,000 | 8 | $1,250,000 |
| Supplemental Contracts | 9 | $10,819,963 | 7 | $2,926,668 |
| Grand Total | 204 | $353,237,079 | 169 | $697,306,156 |
Chart 80 – SBS: FY22-FY23 Volume of Contracts by Industry
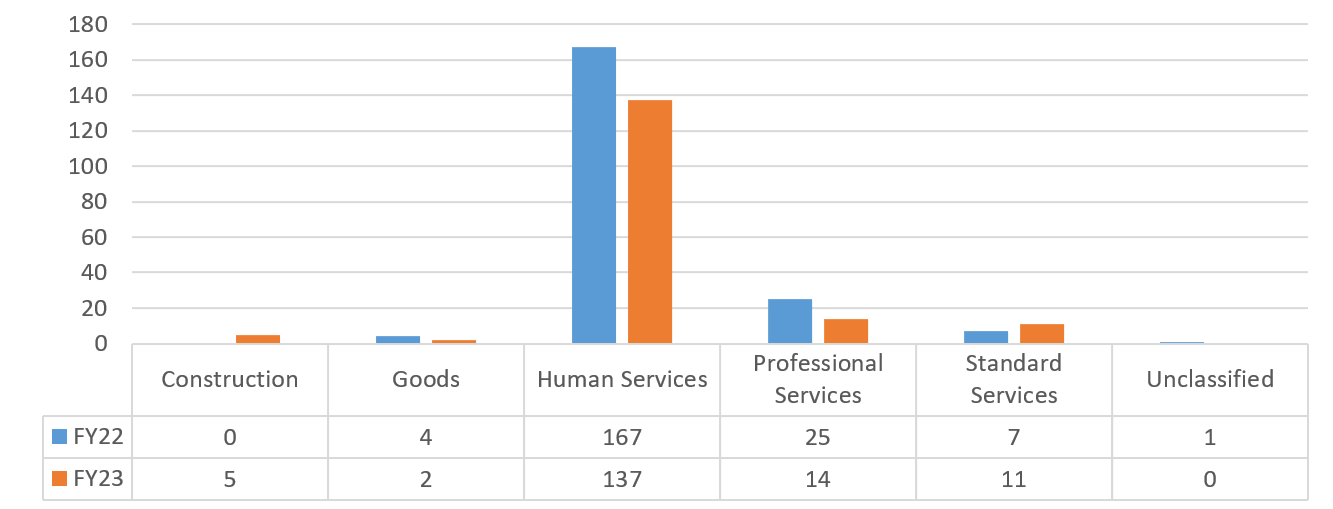
Chart 81 – SBS: FY22-FY23 Value of Contracts by Industry
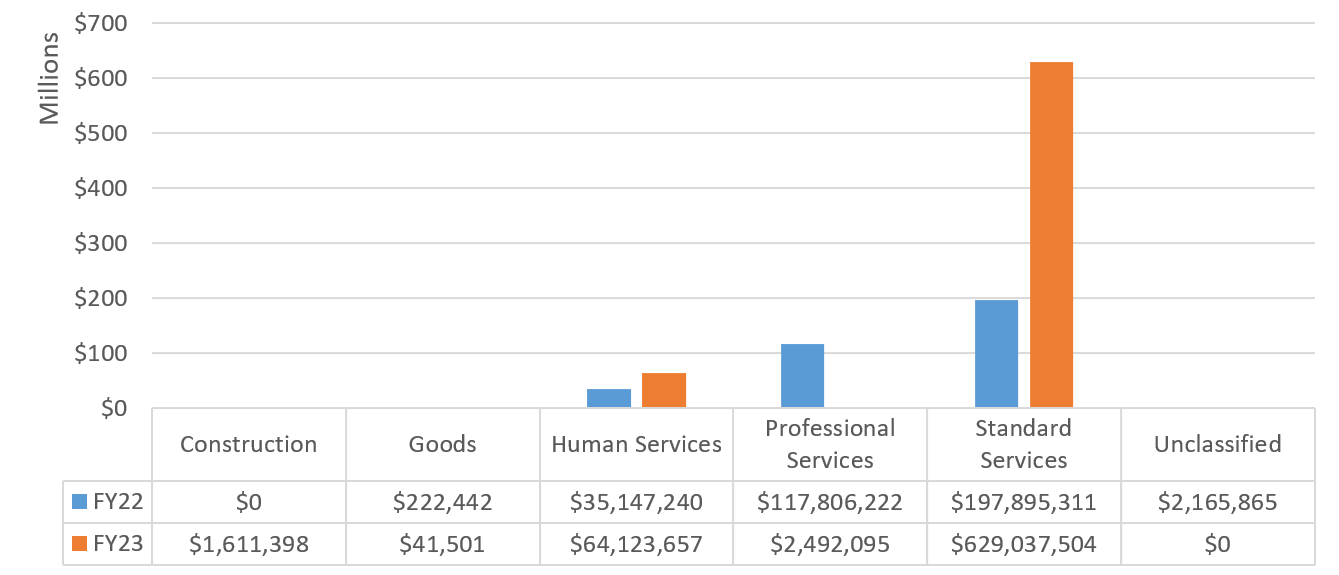
Taxi and Limousine Commission (TLC)
The Taxi and Limousine Commission (TLC) is the agency responsible for licensing and regulating New York City’s medallion taxicabs, for-hire vehicles, commuter vans, paratransit vehicles, and certain luxury limousines. TLC licenses and regulates more than 130,000 vehicles and approximately 180,000 drivers, and performs safety and emissions inspections of the 13,587 medallion taxicabs three times each year, as well as biennial inspections of all TLC-licensed For-Hire vehicles.
Table 66 – TLC: FY22-FY23 Registrations by Contract Category
| FY22 | FY23 | |||
|---|---|---|---|---|
| Contract Category | # of Contracts | Total Contract Value | # of Contracts | Total Contract Value |
| Limited or Non-Competitive Method Contracts | 6 | $68,548,081 | 9 | $2,398,842 |
| Supplemental Contracts | 4 | $404,547 | 1 | $102,000,000 |
| Grand Total | 10 | $68,952,628 | 10 | $104,398,842 |
Chart 82 – TLC: FY22-FY23 Volume of Contracts by Industry
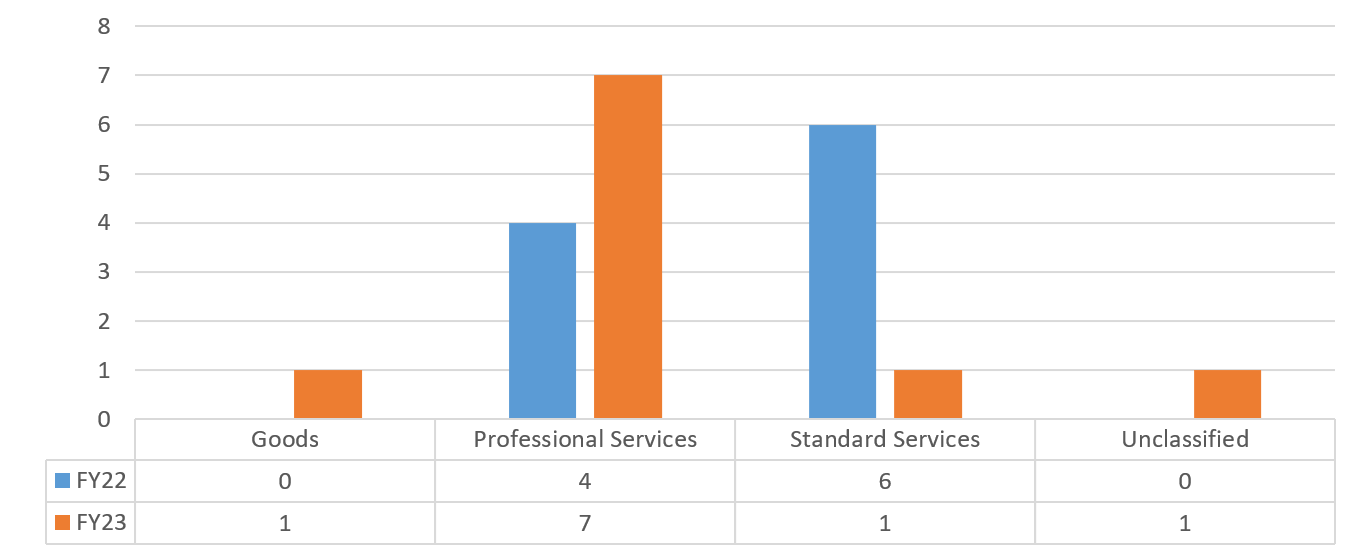
Chart 83 – TLC: FY22-FY23 Value of Contracts by Industry
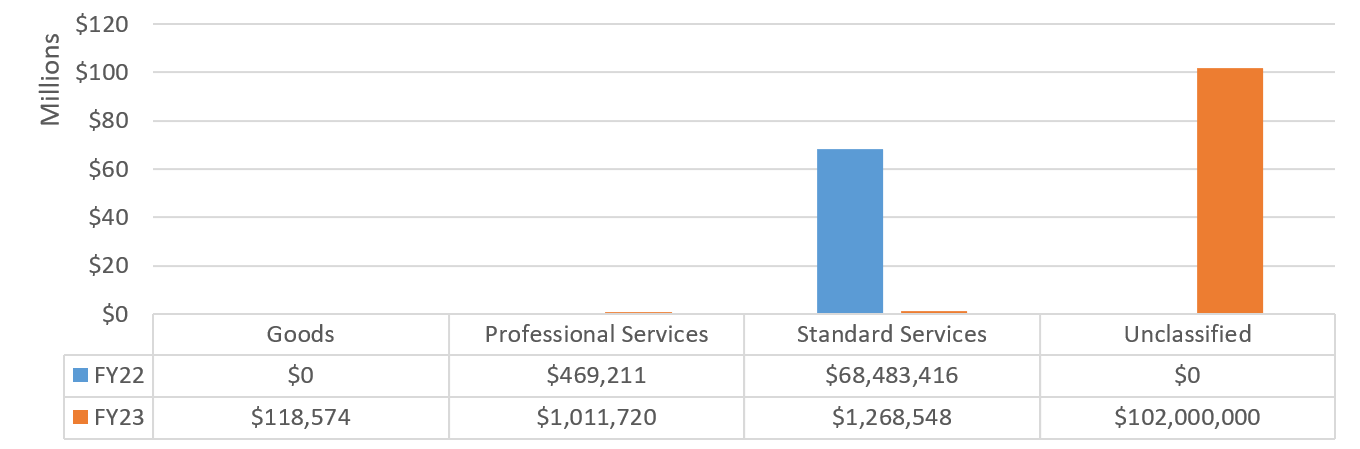
Non-Mayoral Agencies
Non-Mayoral Agencies include agencies headed by boards, commissions, or other multi-member bodies (whether appointed by the mayor or otherwise), elected officials (including the Comptroller, City Council, Borough Presidents, and Community Boards), and agencies for which the heads are appointed by officials other than the mayor or by multi-member bodies.[34]
Twenty Non-Mayoral Agencies, inclusive of the Comptroller, City Council and other elected officials administered procurement contracts registered in FY23 for a total value of $138.88 million. Table 67 displays information on the number of new procurement contracts registered to each non-mayoral entity.
Table 67: FY23 New Procurement Contracts by Non-Mayoral Agency
| Agency | # of Procurement Contracts | % Share of Contracts | Total Contract Value | % Share of Contract Value |
| BKBP | 9 | 1.50% | $831,489 | 0.60% |
| BOE | 35 | 5.83% | $11,483,850 | 8.27% |
| BXBP | 2 | 0.33% | $112,332 | 0.08% |
| CC | 46 | 7.67% | $2,088,660 | 1.50% |
| CFB | 21 | 3.50% | $9,952,627 | 7.17% |
| COIB | 1 | 0.17% | $9,000 | 0.01% |
| COMP | 93 | 15.50% | $55,537,467 | 39.99% |
| DABX | 14 | 2.33% | $3,507,378 | 2.53% |
| DAKINGS | 10 | 1.67% | $2,911,797 | 2.10% |
| DANY | 54 | 9.00% | $9,604,952 | 6.92% |
| DAQ | 16 | 2.67% | $1,033,575 | 0.74% |
| DARICH | 12 | 2.00% | $1,258,167 | 0.91% |
| MBP | 2 | 0.33% | $41,326 | 0.03% |
| OATH | 20 | 3.33% | $4,221,756 | 3.04% |
| OCB | 1 | 0.17% | $30,000 | 0.02% |
| OOP-SN | 2 | 0.33% | $42,600 | 0.03% |
| OTA | 1 | 0.17% | $24,000 | 0.02% |
| QBP | 62 | 10.33% | $267,900 | 0.19% |
| SIBP | 117 | 19.50% | $1,886,134 | 1.36% |
| FISA-OPA | 82 | 13.67% | $34,038,913 | 24.51% |
| Grand Total | 600 | 100.00% | $138,883,923 | 100.00% |
Board of Elections (BOE)
The Board of Elections in the City of New York is an administrative body of ten Commissioners, two from each borough upon recommendation by both political parties and then appointed by the City Council for a term of four years. The Commissioners appoint a bipartisan staff to oversee the daily activities of its main and five borough offices.
Table 68 – BOE: FY22-FY23 Registrations by Contract Category
| FY22 | FY23 | |||
|---|---|---|---|---|
| Contract Category | # of Contracts | Total Contract Value | # of Contracts | Total Contract Value |
| Competitive Method Contracts | 2 | $9,720,309 | 1 | $1,250,000 |
| Limited or Non-Competitive Method Contracts | 44 | $96,890,068 | 32 | $5,972,138 |
| Supplemental Contracts | 5 | $8,478,595 | 2 | $4,261,711 |
| Grand Total | 51 | $115,088,971 | 35 | $11,483,850 |
Chart 84 – BOE: FY22-FY23 Volume of Contracts by Industry
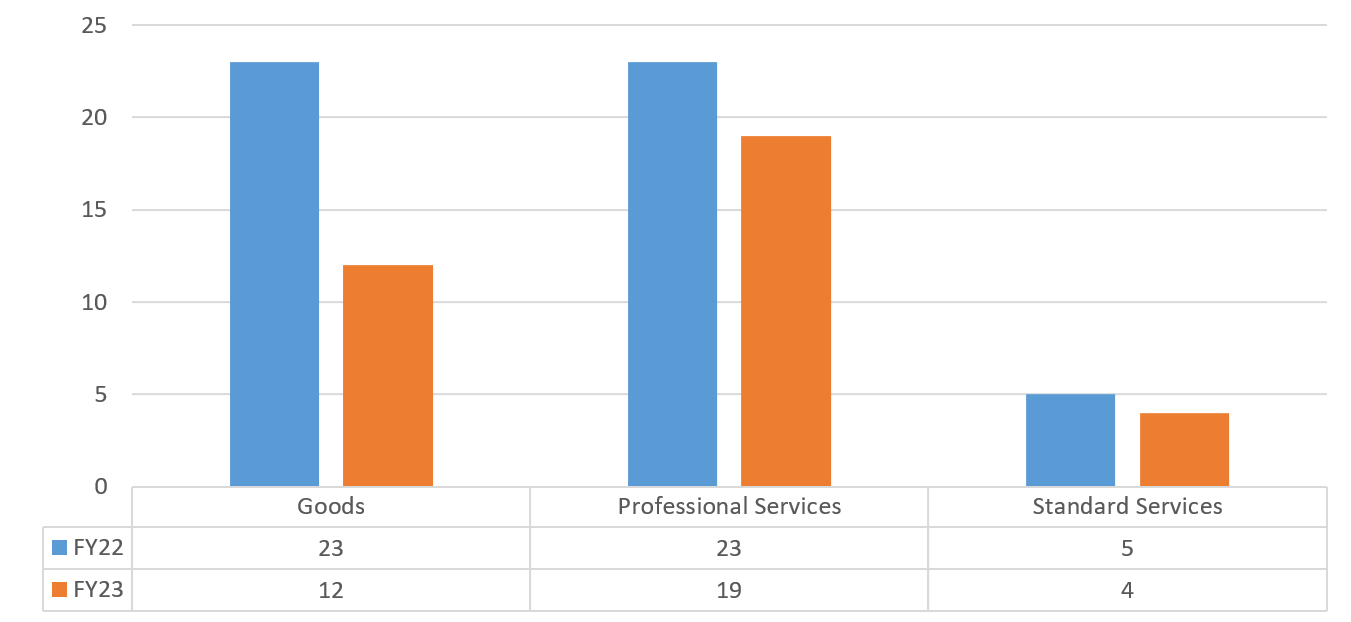
Chart 85 BOE: FY22-FY23 Value of Contracts by Industry
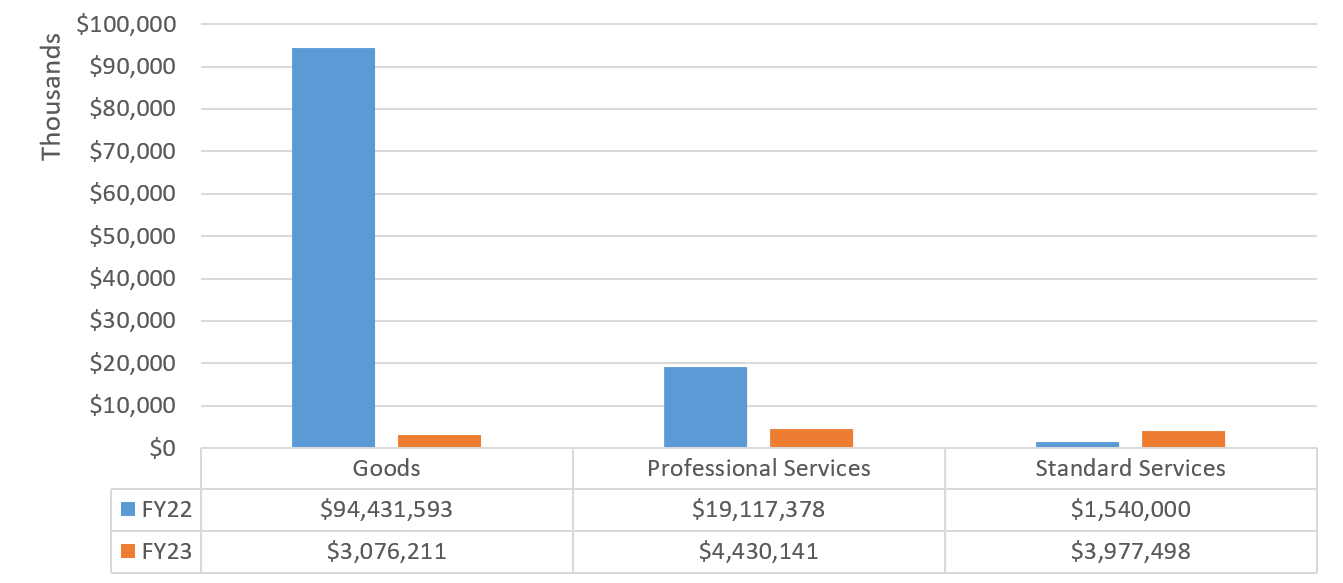
Borough Presidents – Brooklyn (BKBP), Bronx (BXBP), Manhattan (MBP), Queens (QBP), and Staten Island (SIBP)
The Borough Presidents are the executive officials of each borough. The City Charter gives them authority to: work with the Mayor in preparing the annual executive budget submitted to the City Council and to propose borough budget priorities directly to the council; review and comment on major land use decisions and propose sites for city facilities within their respective boroughs; monitor and modify the delivery of city services within their boroughs; and engage in strategic planning for their boroughs.[35]
Table 69 – BKBP: FY22-FY23 Registrations by Contract Category
| FY22 | FY23 | |||
|---|---|---|---|---|
| Contract Category | # of Contracts | Total Contract Value | # of Contracts | Total Contract Value |
| Limited or Non-Competitive Method Contracts | 3 | $648,141 | 9 | $831,489 |
| Grand Total | 3 | $648,141 | 9 | $831,489 |
Chart 86 – BKBP: FY22-FY23 Volume of Contracts by Industry
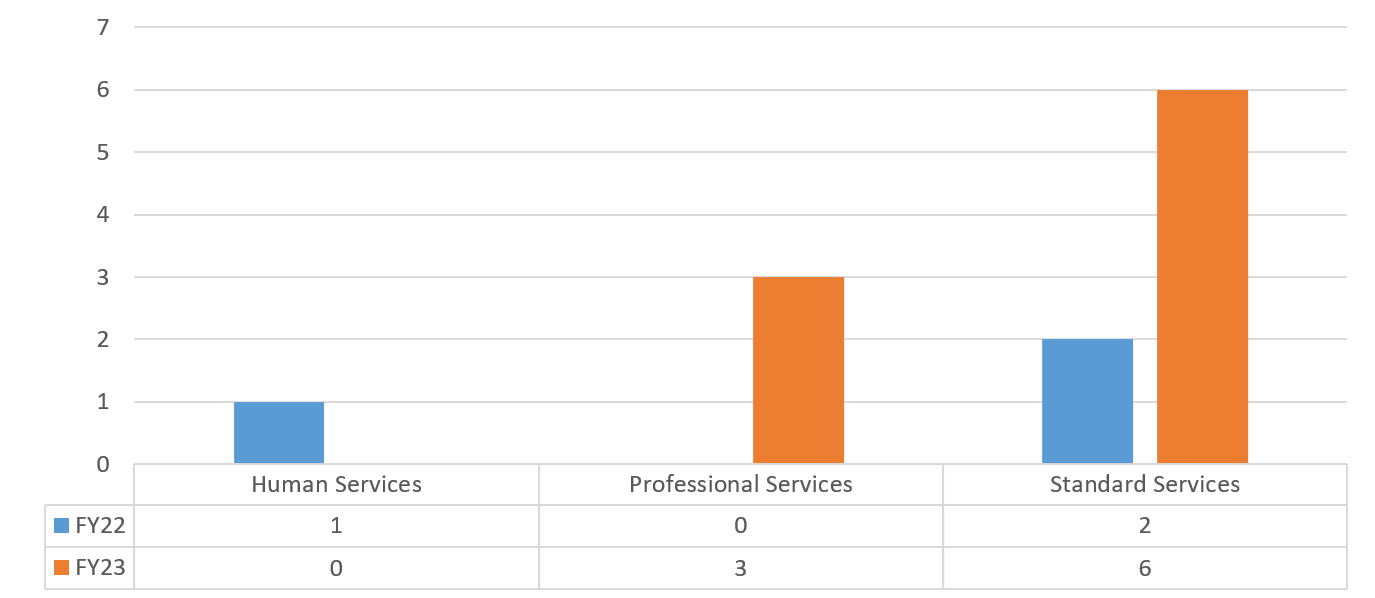
Chart 87 – BKBP: FY22-FY23 Value of Contracts by Industry
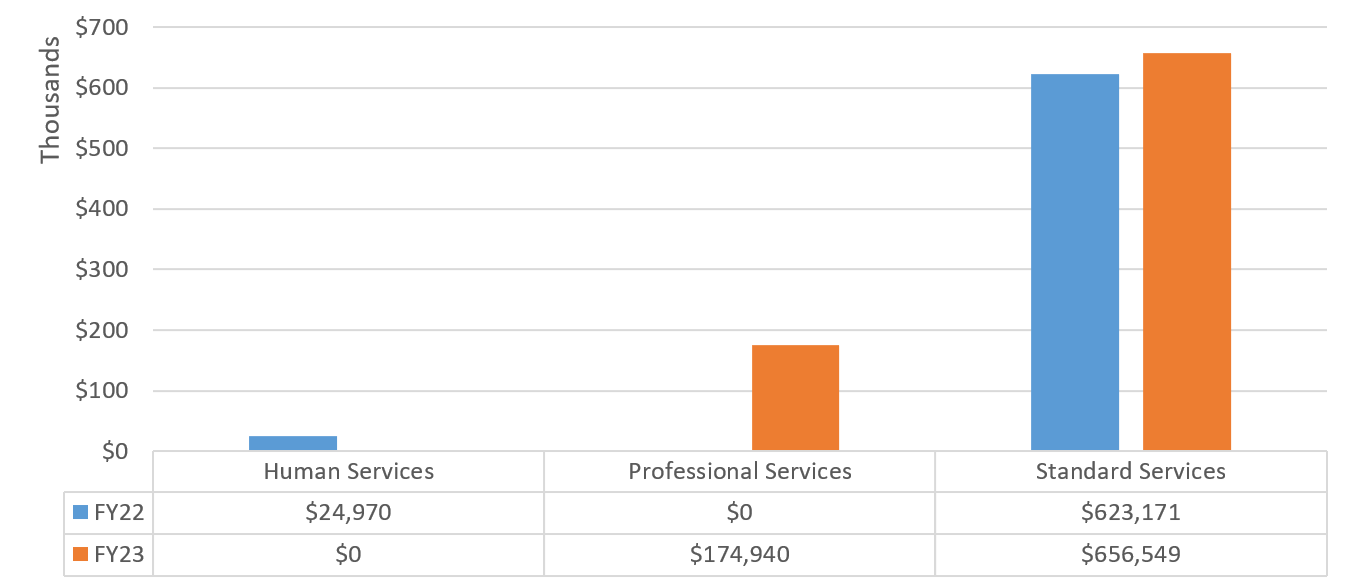
Table 70 – BXBP: FY22-FY23 Registrations by Contract Category
| FY22 | FY23 | |||
|---|---|---|---|---|
| Contract Category | # of Contracts | Total Contract Value | # of Contracts | Total Contract Value |
| Limited or Non-Competitive Method Contracts | 1 | $11,972 | 1 | $74,882 |
| Transactions Not Subject to PPB Rules | 1 | $600,000 | 1 | $37,450 |
| Grand Total | 2 | $611,972 | 2 | $112,332 |
Chart 88 – BXBP: FY22-FY23 Volume of Contracts by Industry
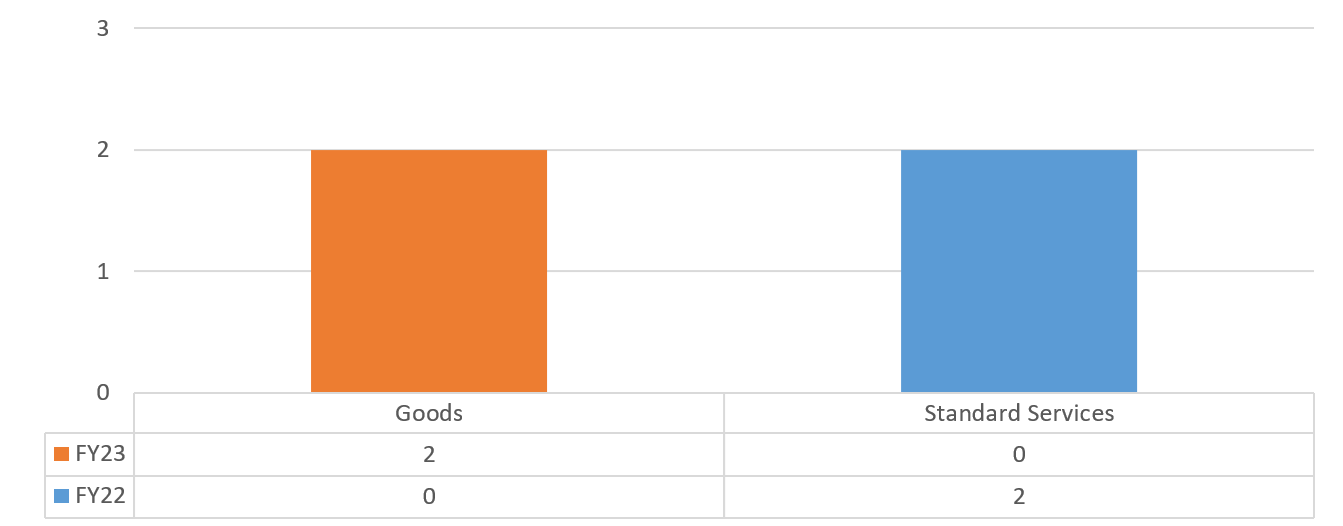
Chart 89 – BXBP: FY22-FY23 Value of Contracts by Industry
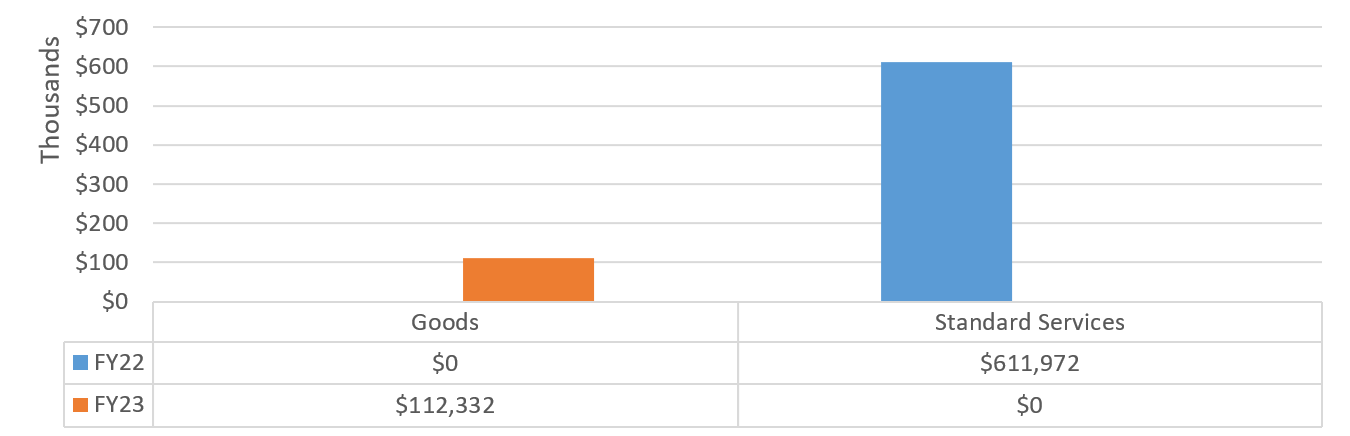
Table 71 – MBP: FY22-FY23 Registrations by Contract Category
| FY22 | FY23 | |||
|---|---|---|---|---|
| Contract Category | # of Contracts | Total Contract Value | # of Contracts | Total Contract Value |
| Limited or Non-Competitive Method Contracts | 3 | $83,378 | 2 | $41,326 |
| Grand Total | 3 | $83,378 | 2 | $41,326 |
Chart 90 – MBP: FY22-FY23 Volume of Contracts by Industry
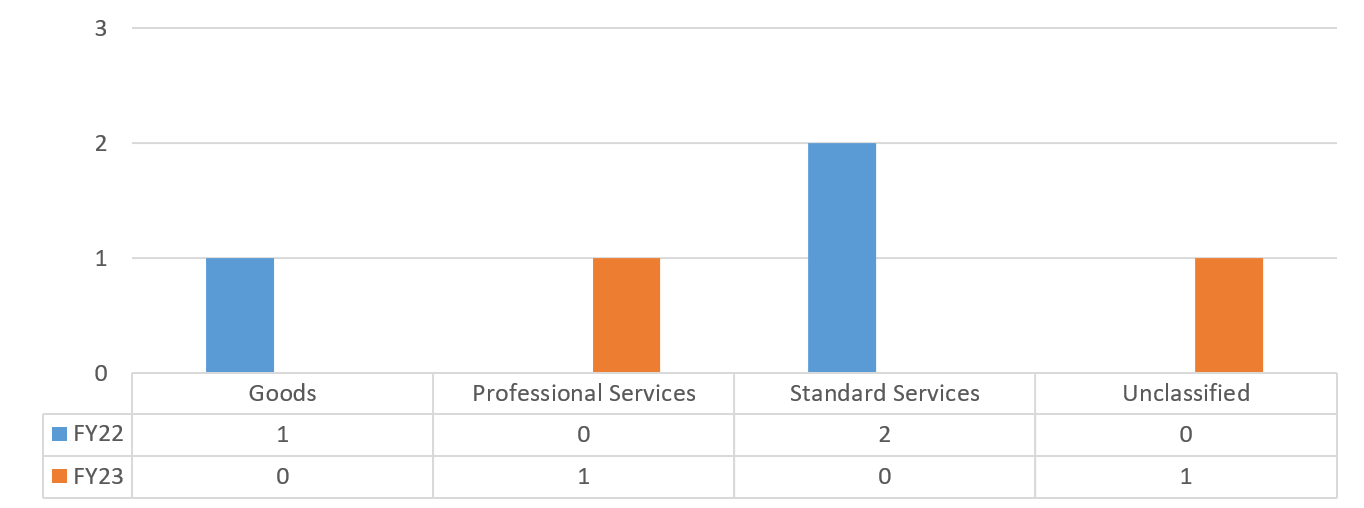
Chart 91 – MBP: FY22-FY23 Value of Contracts by Industry
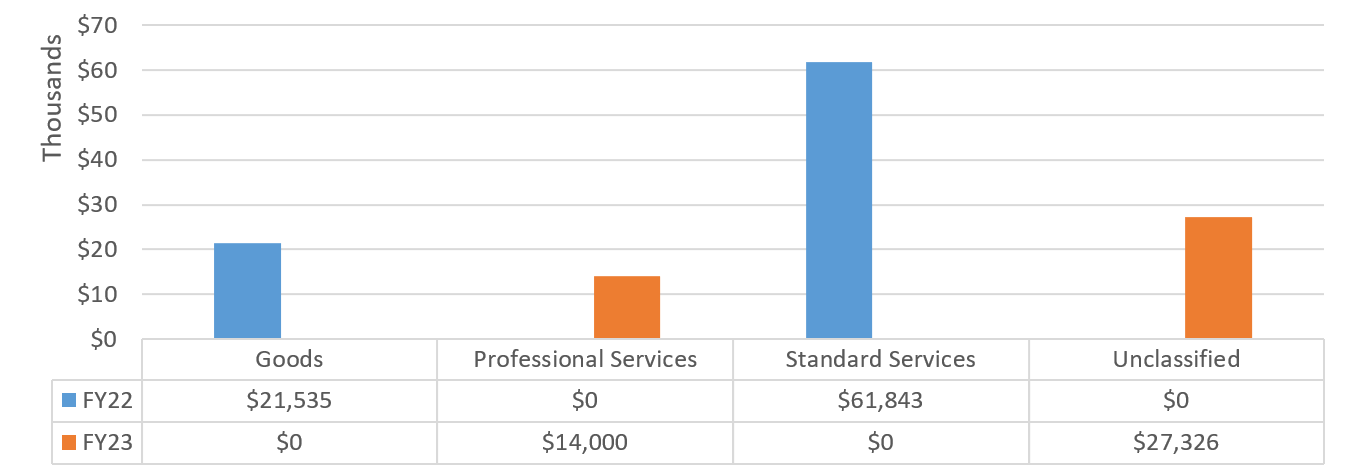
Table 72 – QBP: FY22-FY23 Registrations by Contract Category
| FY22 | FY23 | |||
|---|---|---|---|---|
| Contract Category | # of Contracts | Total Contract Value | # of Contracts | Total Contract Value |
| Limited or Non-Competitive Method Contracts | 87 | $459,150 | 62 | $267,900 |
| Grand Total | 87 | $459,150 | 62 | $267,900 |
Chart 92 – QBP: FY22-FY23 Volume of Contracts by Industry
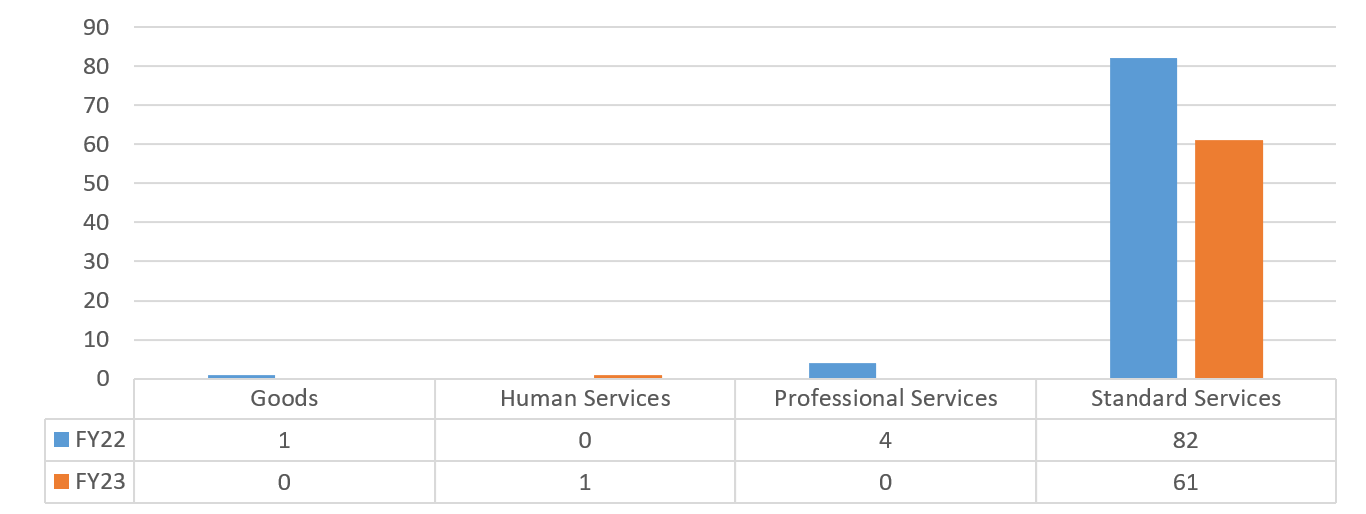
Chart 93 – QBP: FY22-FY23 Value of Contracts by Industry
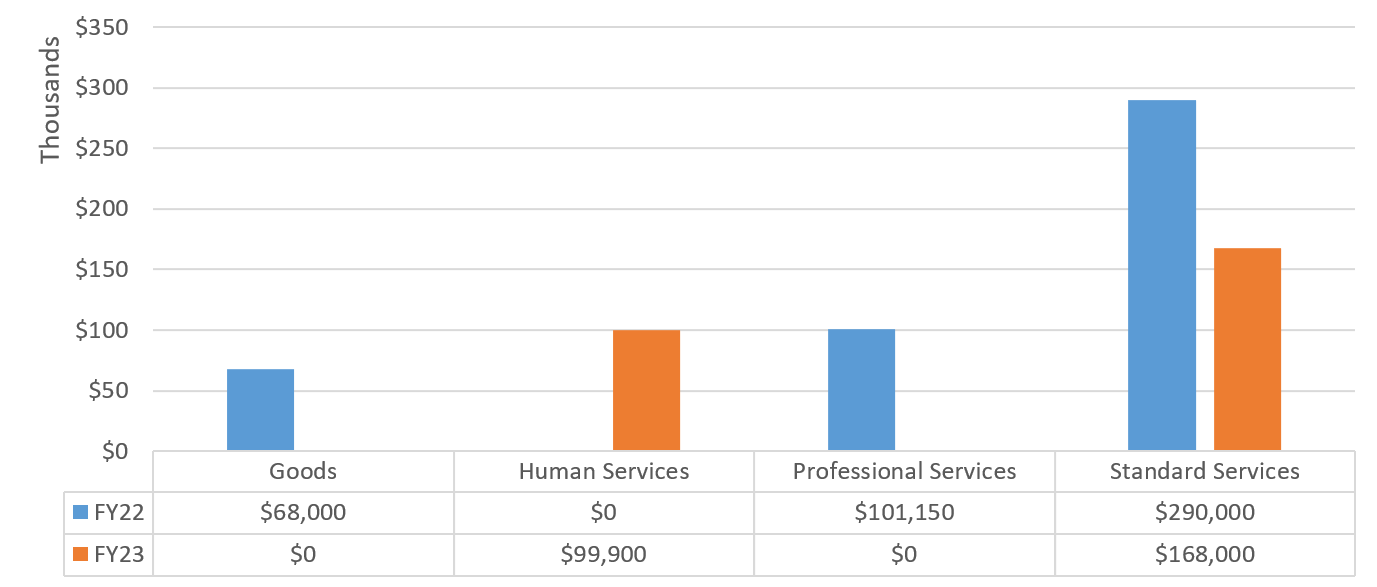
Table 73 – SIBP: FY22-FY23 Registrations by Contract Category
| FY22 | FY23 | |||
|---|---|---|---|---|
| Contract Category | # of Contracts | Total Contract Value | # of Contracts | Total Contract Value |
| Limited or Non-Competitive Method Contracts | 143 | $1,649,257 | 117 | $1,886,134 |
| Grand Total | 143 | $1,649,257 | 117 | $1,886,134 |
Chart 94 – SIBP: FY22-FY23 Volume of Contracts by Industry
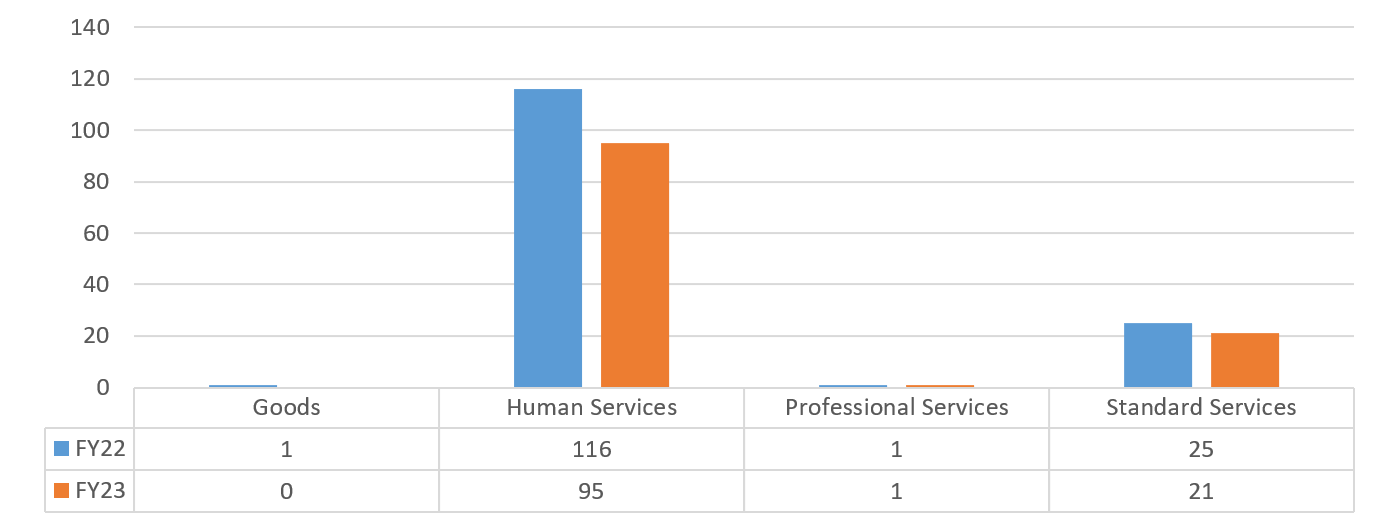
Chart 95 – SIBP: FY22-FY23 Value of Contracts by Industry
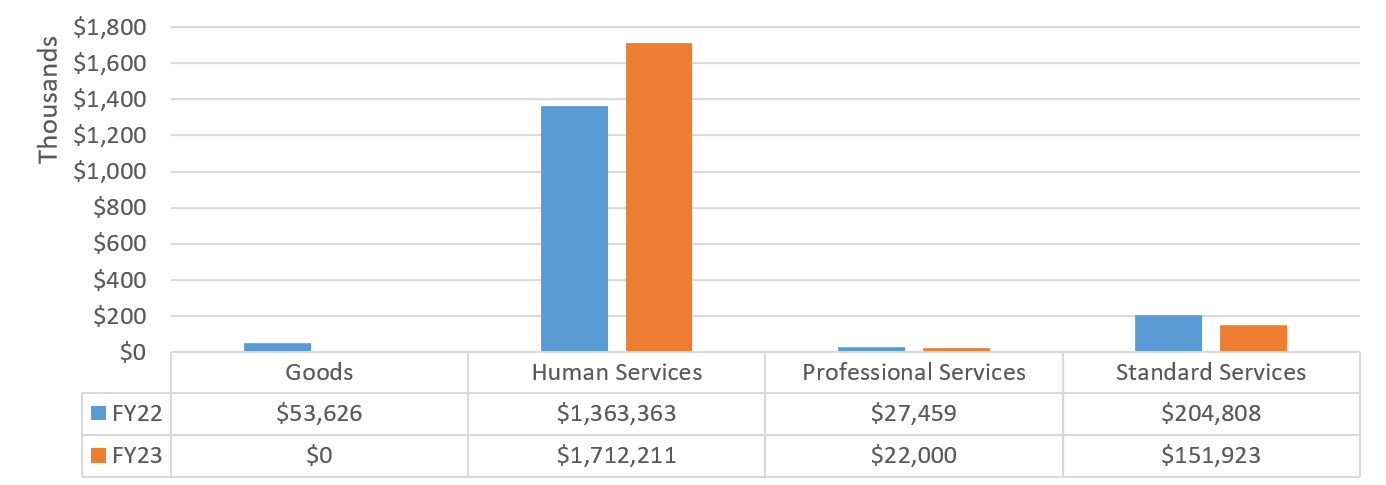
City Council (CC)
The City Council is NYC’s legislative body. There are 51 elected members, one from each council district. Besides enacting legislation, the Council approves the City’s budget and has oversight powers for the activities of City agencies. The Council monitors the operation and performance of city agencies, makes land use decisions and has sole responsibility for approving the City’s budget. It also legislates on a wide range of other subjects. The Council is an equal partner with the Mayor in the governing of New York City.
Table 74 – CC: FY22-FY23 Registrations by Contract Category
| FY22 | FY23 | |||
|---|---|---|---|---|
| Contract Category | # of Contracts | Total Contract Value | # of Contracts | Total Contract Value |
| Competitive Method Contracts | 1 | $73,065 | 1 | $208,490 |
| Limited or Non-Competitive Method Contracts | 33 | $1,425,201 | 40 | $1,614,601 |
| Transactions Not Subject to PPB Rules | 7 | $677,000 | 1 | $35,000 |
| Supplemental Contracts | 3 | $199,462 | 4 | $230,569 |
| Grand Total | 44 | $2,374,728 | 46 | $2,088,660 |
Chart 96 – CC: FY22-FY23 Volume of Contracts by Industry
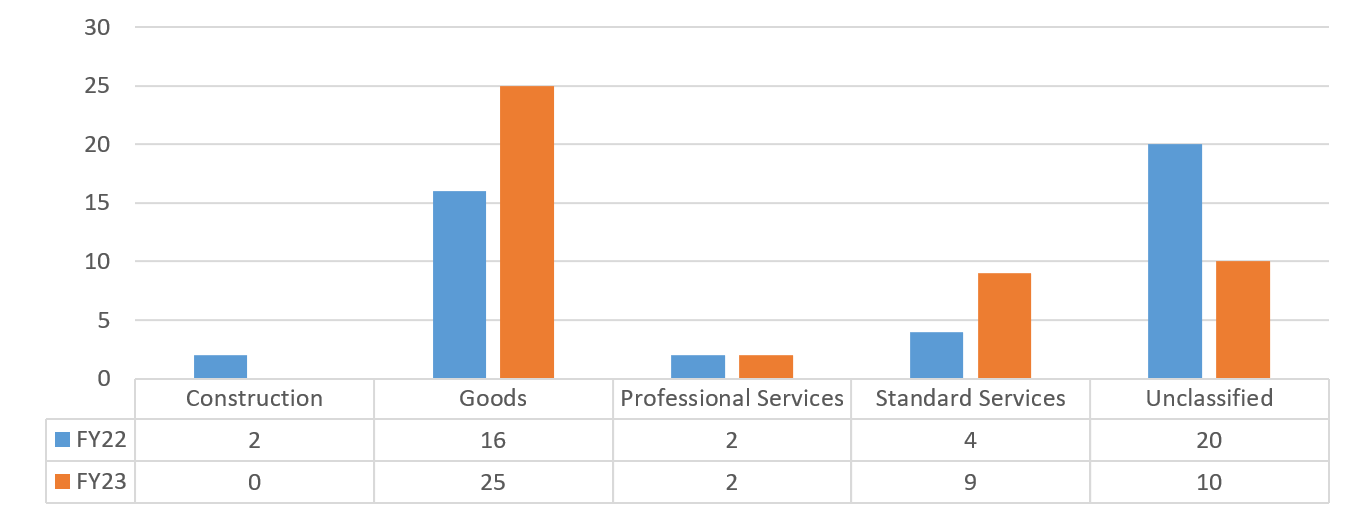
Chart 97 – CC: FY22-FY23 Value of Contracts by Industry
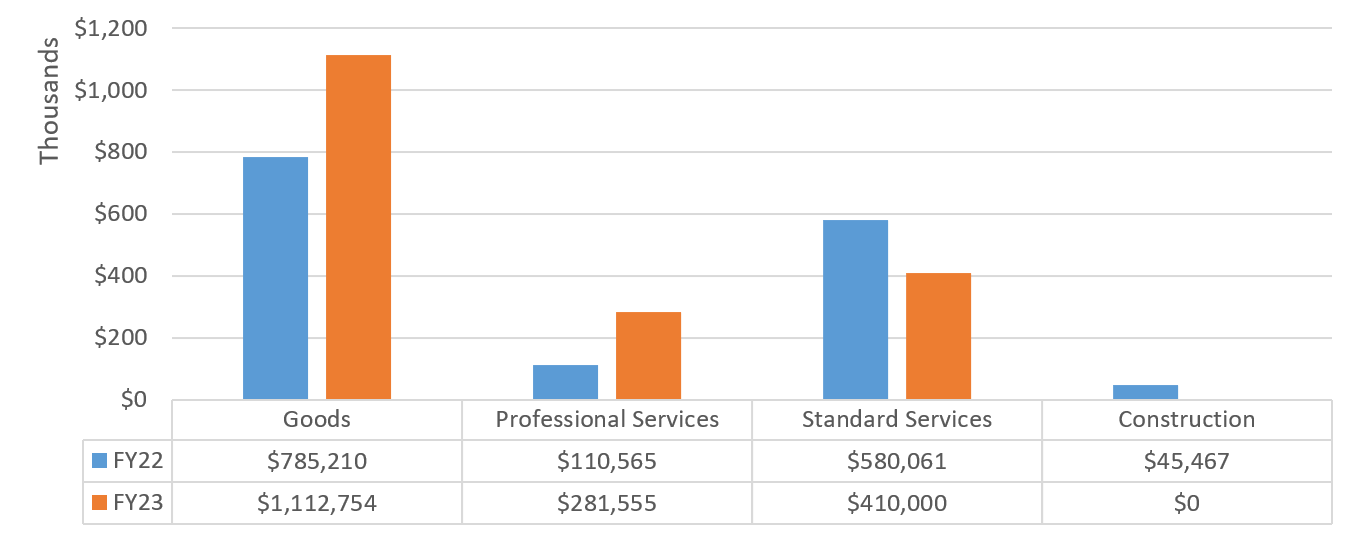
Campaign Finance Board (CFB)
In 1989, NYC voters approved a Charter revision establishing the Campaign Finance Board (CFB). The independent, nonpartisan agency is charged with limiting the role and influence of private money in the political process by providing public matching funds to candidates running for city office. The CFB is also mandated to publish a voter guide and provide public disclosure of campaign finance information.
Table 75 – CFB: FY22-FY23 Registrations by Contract Category
| FY22 | FY23 | |||
|---|---|---|---|---|
| Contract Category | # of Contracts | Total Contract Value | # of Contracts | Total Contract Value |
| Competitive Method Contracts | 3 | $13,750,000 | 3 | $6,900,000 |
| Limited or Non-Competitive Method Contracts | 12 | $2,547,428 | 16 | $2,953,305 |
| Transactions Not Subject to PPB Rules | 0 | $0 | 2 | $99,322 |
| Supplemental Contracts | 1 | $50,000 | 0 | $0 |
| Grand Total | 16 | $16,347,428 | 21 | $9,952,627 |
Chart 98 – CFB: FY22-FY23 Volume of Contracts by Industry
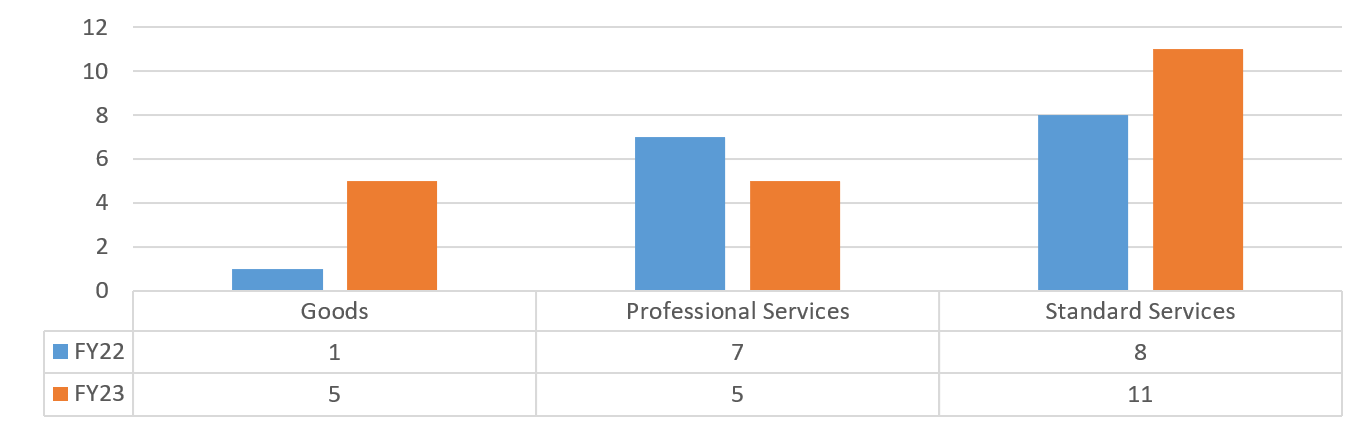
Chart 99 – CFB: FY22-FY23 Value of Contracts by Industry
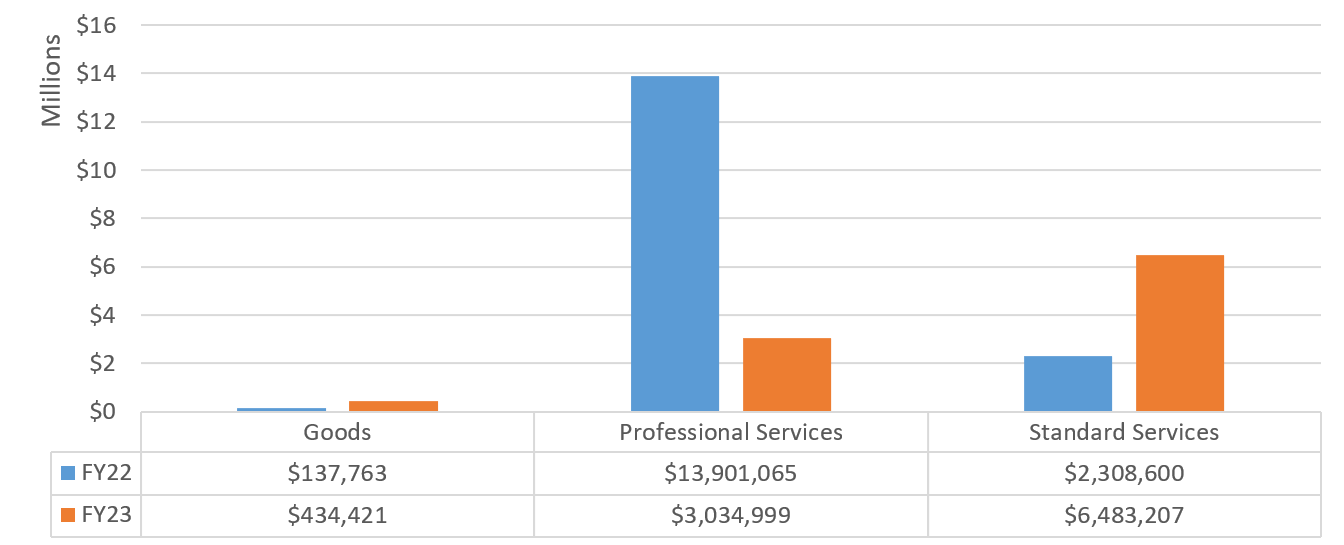
Conflicts of Interests Board (COIB)
The Conflicts of Interest Board is the independent New York City agency tasked with administering, enforcing and interpreting Chapter 68 of the New York City Charter, the City’s Conflicts of Interest Law, and Section 12-110 of the Administrative Code, the City’s Annual Disclosure Law.
Table 76 – COIB: FY22-FY23 Registrations by Contract Category
| FY22 | FY23 | |||
|---|---|---|---|---|
| Contract Category | # of Contracts | Total Contract Value | # of Contracts | Total Contract Value |
| Transactions Not Subject to PPB Rules | 1 | $8,625 | 1 | $9,000 |
| Grand Total | 1 | $8,625 | 1 | $9,000 |
Chart 100 – COIB: FY22-FY23 Volume of Contracts by Industry
Chart 101 – COIB: FY22-FY23 Value of Contracts by Industry
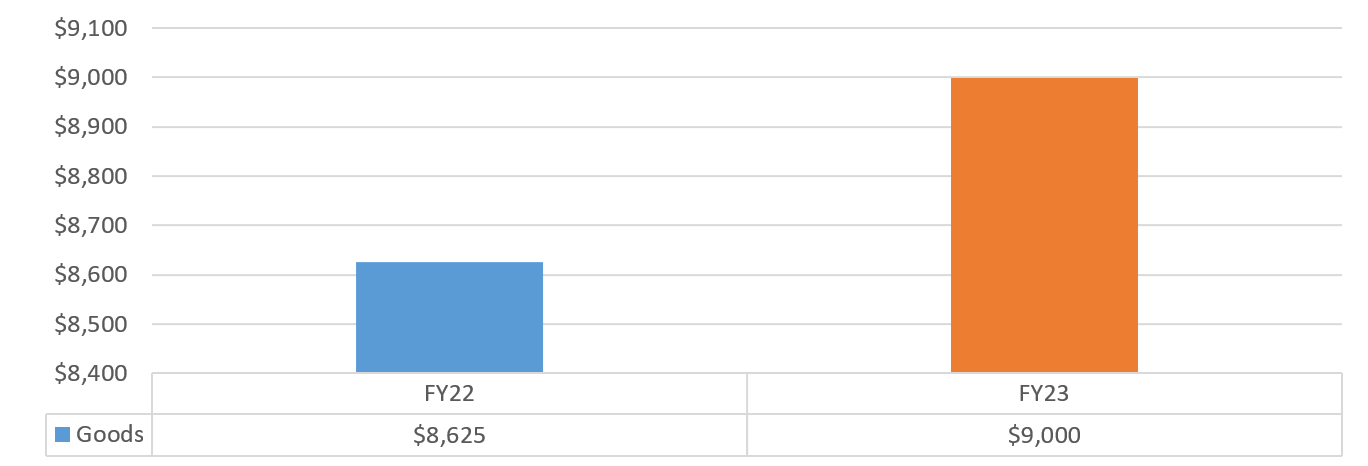
Office of the Comptroller (COMP)
The New York City Comptroller’s Office works to promote the financial health, integrity, and effectiveness of New York City government, in order to strengthen trust, secure a thriving future for all New Yorkers, and build a more just, equitable, and resilient city. Led by an independently elected citywide official, the Comptroller’s Office provides checks and balances needed to hold City government accountable for budgeting wisely, investing responsibly, operating efficiently, acting fairly, living up to its obligations and promises, and paying attention to the long-term challenges we face together.
Table 77 – COMP: FY22-FY23 Registrations by Contract Category
| FY22 | FY23 | |||
|---|---|---|---|---|
| Contract Category | # of Contracts | Total Contract Value | # of Contracts | Total Contract Value |
| Competitive Method Contracts | 3 | $1,961,152 | 3 | $1,346,080 |
| Limited or Non-Competitive Method Contracts | 24 | $14,054,076 | 44 | $10,626,831 |
| Transactions Not Subject to PPB Rules | 10 | $5,290,963 | 27 | $35,921,379 |
| Supplemental Contracts | 6 | $6,032,021 | 19 | $7,643,177 |
| Grand Total | 43 | $27,338,211 | 93 | $55,537,467 |
Chart 102 – COMP: FY22-FY23 Volume of Contracts by Industry
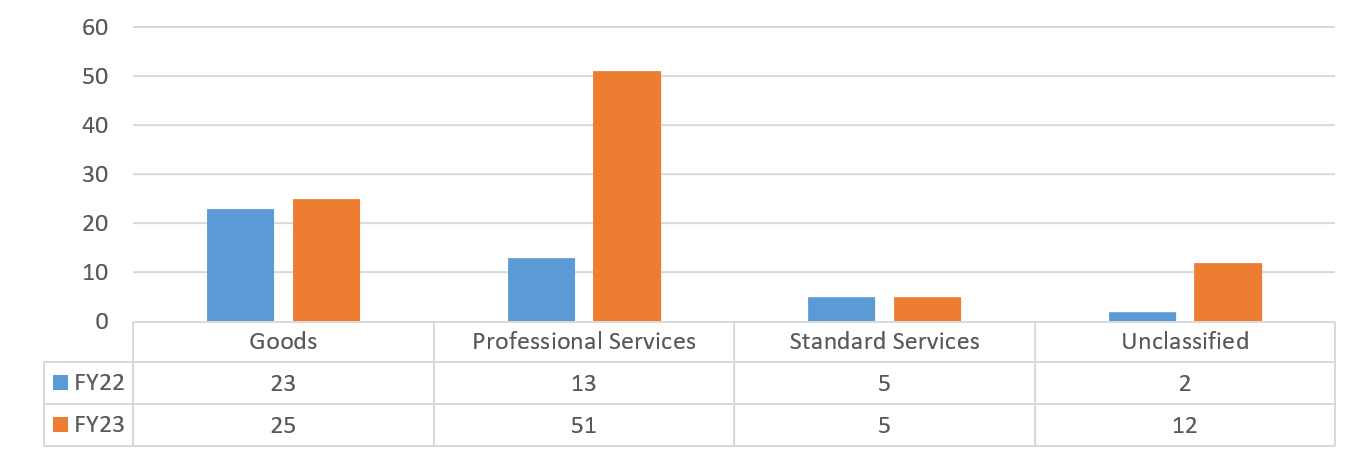
Chart 103 – COMP: FY22-FY23 Value of Contracts by Industry
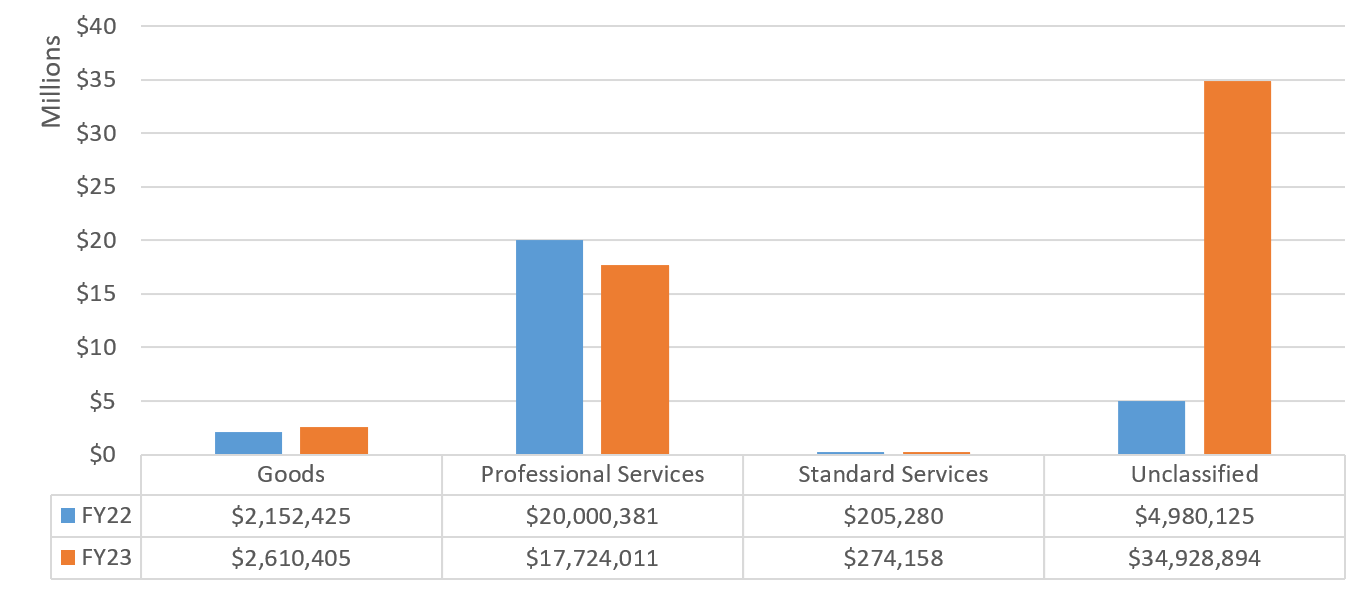
District Attorneys – Bronx (DABX), Kings (DAKINGS), New York (DANY), Queens (DAQ), Richmond (DARICH)
All 62 counties in New York State have an elected District Attorney. District Attorneys’ offices are responsible for the prosecution of violations of New York state laws.
Table 78 – DABX: FY22-FY23 Registrations by Contract Category
| FY22 | FY23 | |||
|---|---|---|---|---|
| Contract Category | # of Contracts | Total Contract Value | # of Contracts | Total Contract Value |
| Limited or Non-Competitive Method Contracts | 6 | $414,340 | 11 | $3,390,790 |
| Transactions Not Subject to PPB Rules | 2 | $109,503 | 3 | $116,589 |
| Grand Total | 8 | $523,843 | 14 | $3,507,378 |
Chart 104 – DABX: FY22-FY23 Volume of Contracts by Industry
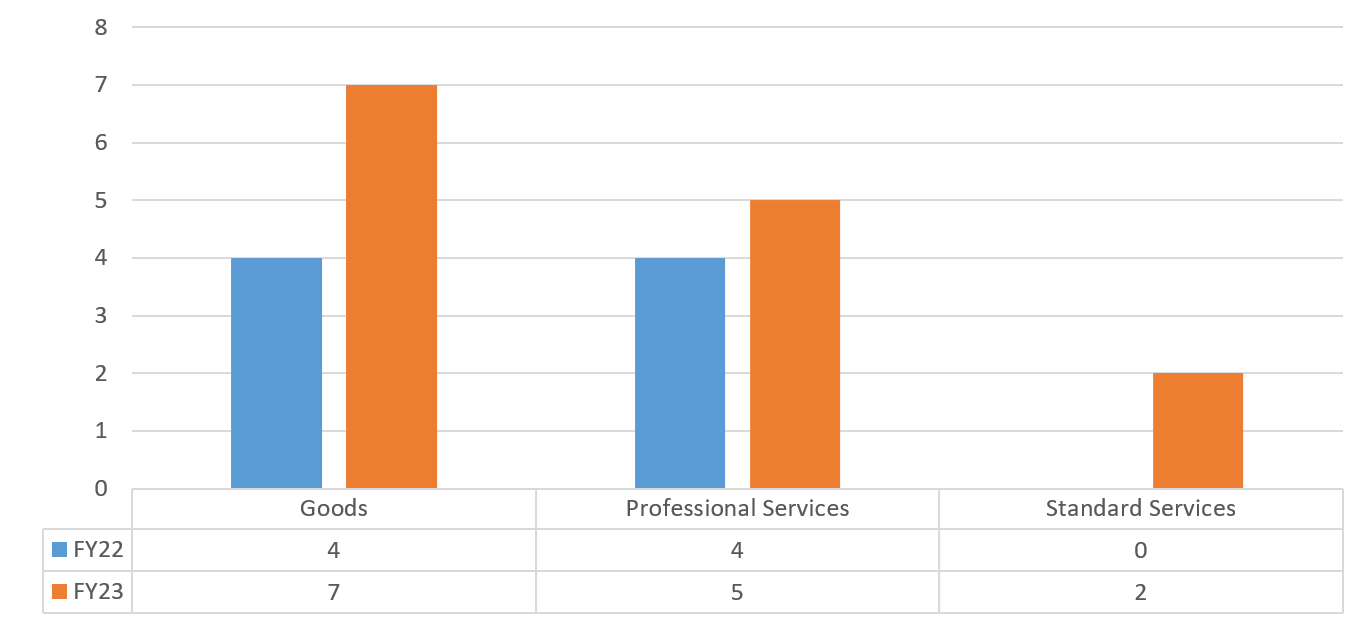
Chart 105 – DABX: FY22-FY23 Value of Contracts by Industry
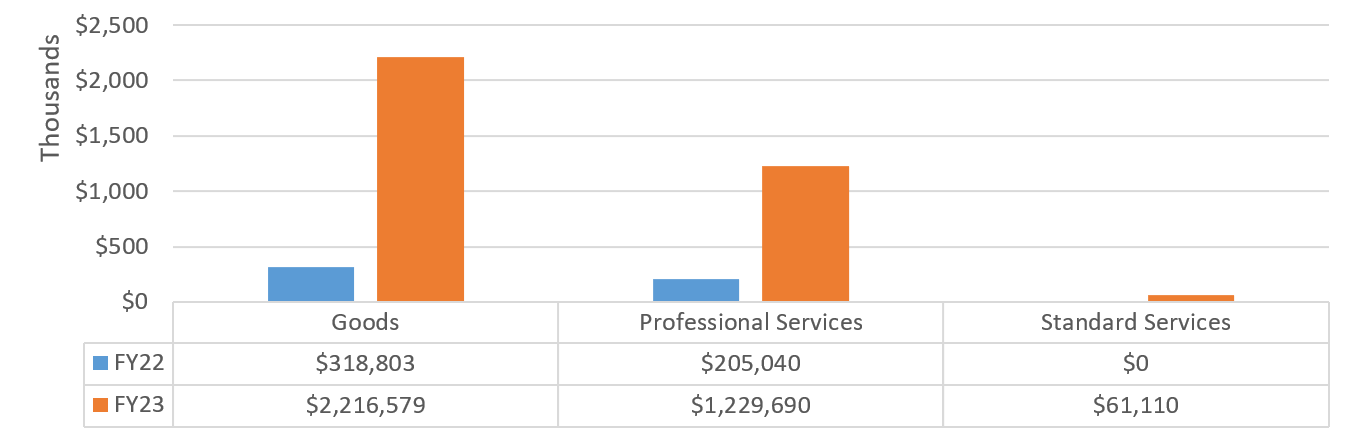
Table 79 – DAKINGS: FY22-FY23 Registrations by Contract Category
| FY22 | FY23 | |||
|---|---|---|---|---|
| Contract Category | # of Contracts | Total Contract Value | # of Contracts | Total Contract Value |
| Competitive Method Contracts | 0 | $0 | 1 | $36,000 |
| Limited or Non-Competitive Method Contracts | 5 | $310,881 | 7 | $2,740,169 |
| Transactions Not Subject to PPB Rules | 0 | $0 | 2 | $135,628 |
| Grand Total | 5 | $310,881 | 10 | $2,911,797 |
Chart 106 – DAKINGS: FY22-FY23 Volume of Contracts by Industry
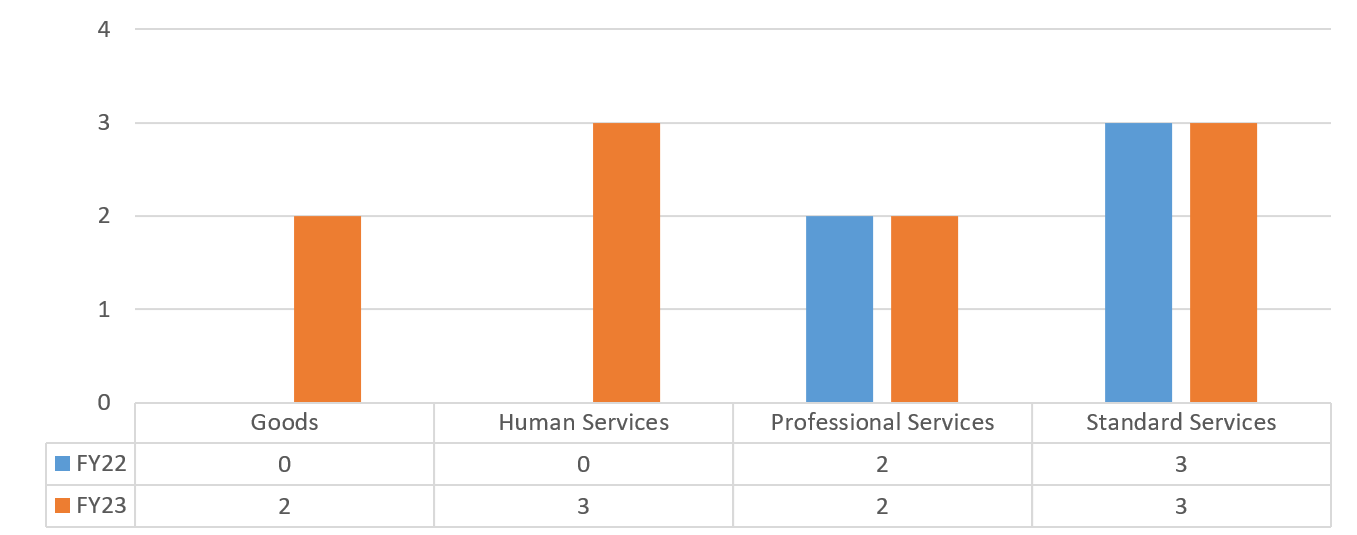
Chart 107 – DAKINGS: FY22-FY23 Value of Contracts by Industry
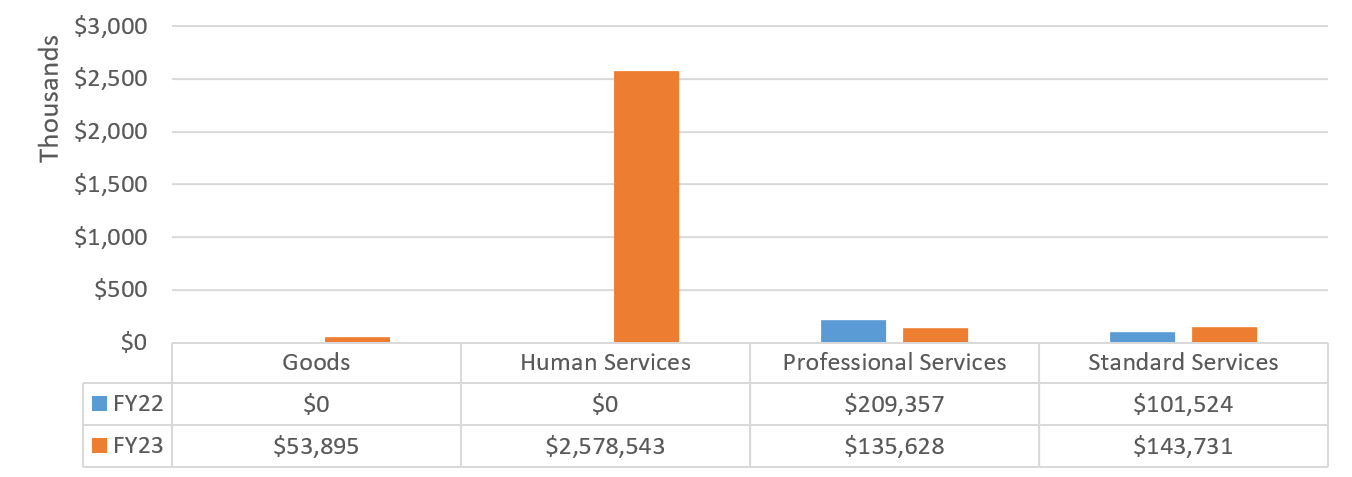
Table 80 – DANY: FY22-FY23 Registrations by Contract Category
| FY22 | FY23 | |||
|---|---|---|---|---|
| Contract Category | # of Contracts | Total Contract Value | # of Contracts | Total Contract Value |
| Competitive Method Contracts | 2 | $1,271,880 | 7 | $1,568,982 |
| Limited or Non-Competitive Method Contracts | 43 | $4,577,524 | 40 | $7,472,129 |
| Transactions Not Subject to PPB Rules | 4 | $178,235 | 5 | $313,062 |
| Supplemental Contracts | 2 | $639,100 | 2 | $250,779 |
| Grand Total | 51 | $6,666,739 | 54 | $9,604,952 |
Chart 108 – DANY: FY22-FY23 Volume of Contracts by Industry
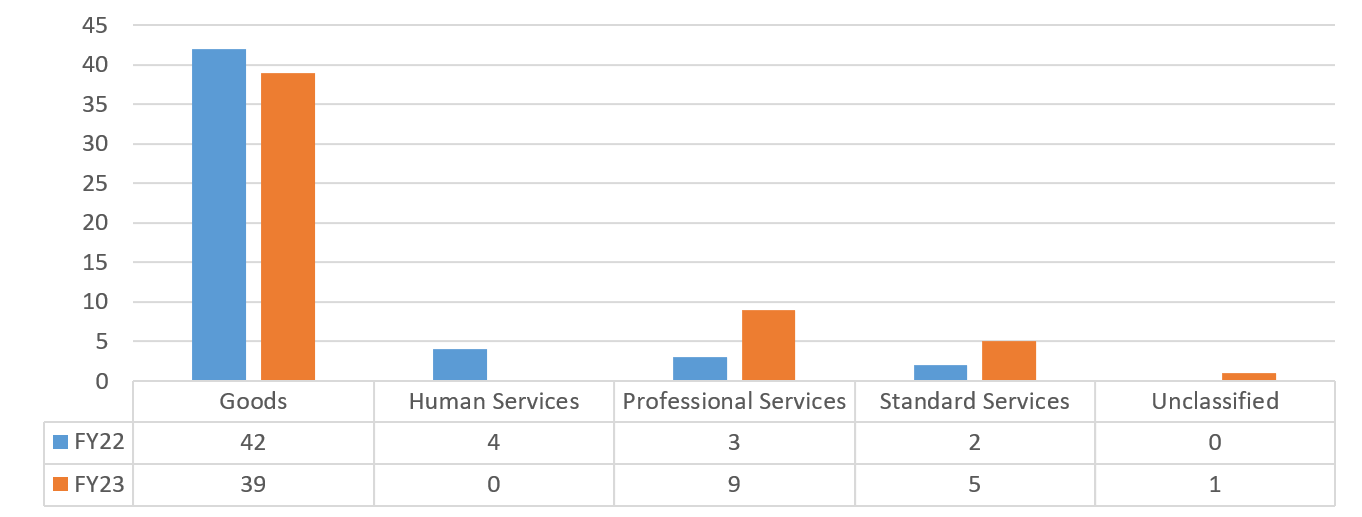
Chart 109 – DANY: FY22-FY23 Value of Contracts by Industry
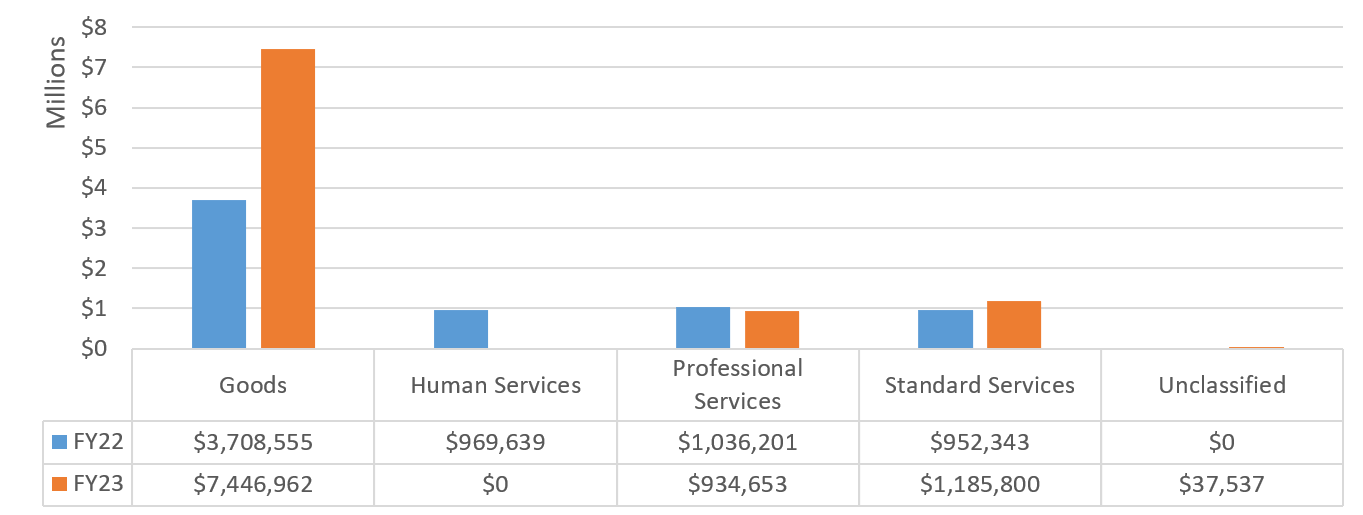
Table 81 – DAQ: FY22-23 Registrations by Contract Category
| FY22 | FY23 | |||
|---|---|---|---|---|
| Contract Category | # of Contracts | Total Contract Value | # of Contracts | Total Contract Value |
| Limited or Non-Competitive Method Contracts | 7 | $388,698 | 14 | $970,015 |
| Transactions Not Subject to PPB Rules | 1 | $74,588 | 2 | $63,560 |
| Grand Total | 8 | $463,286 | 16 | $1,033,575 |
Chart 110 – DAQ: FY22-FY23 Volume of Contracts by Industry
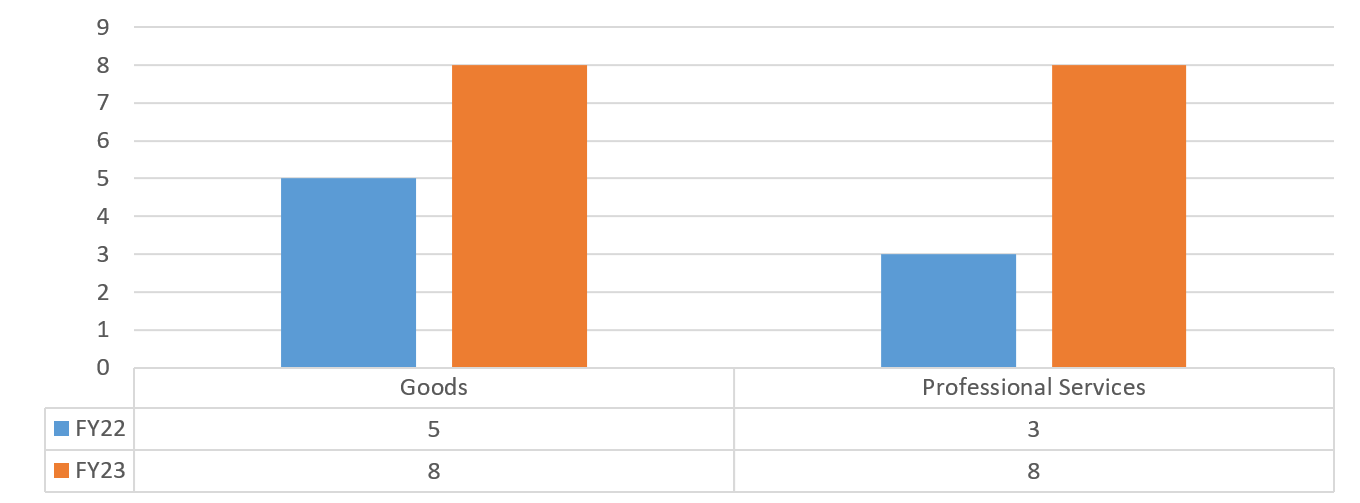
Chart 111 – DAQ: FY22-FY23 Value of Contracts by Industry
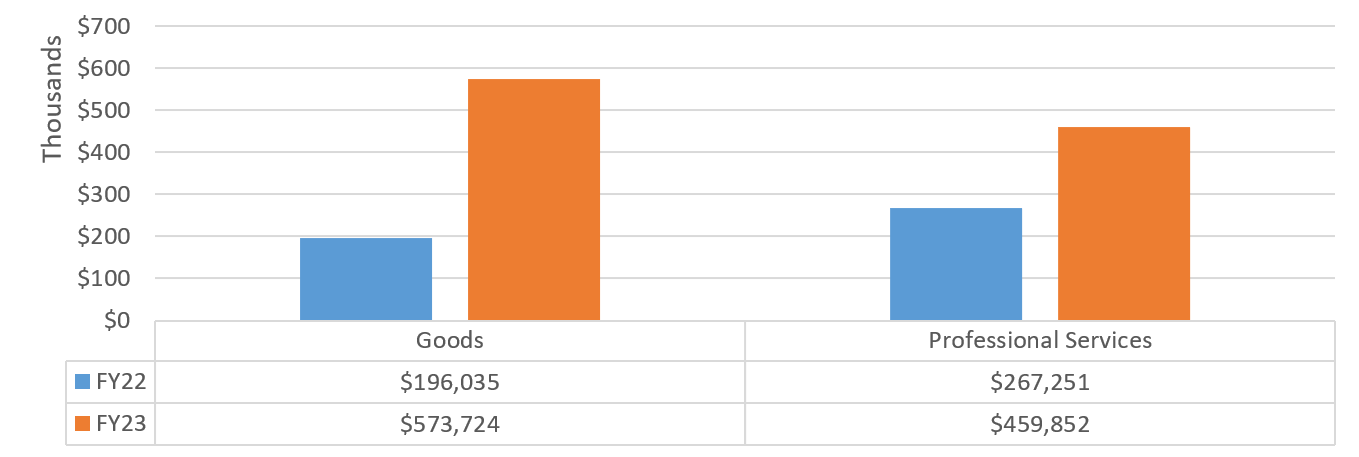
Table 82 – DARICH: FY22-FY23 Registrations by Contract Category
| FY22 | FY23 | |||
|---|---|---|---|---|
| Contract Category | # of Contracts | Total Contract Value | # of Contracts | Total Contract Value |
| Limited or Non-Competitive Method Contracts | 3 | $248,595 | 10 | $983,167 |
| Supplemental Contracts | 2 | $350,000 | 2 | $275,000 |
| Grand Total | 5 | $598,595 | 12 | $1,258,167 |
Chart 112 – DARICH: FY22-FY23 Volume of Contracts by Industry
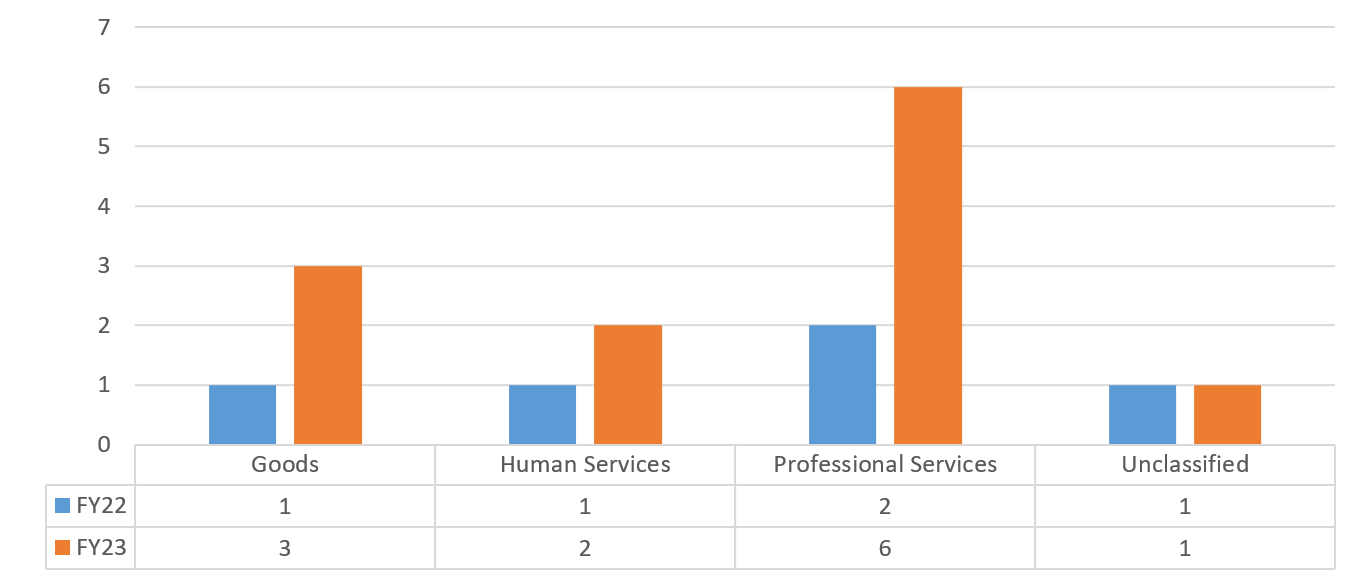
Chart 113 – DARICH: FY22-FY23 Value of Contracts by Industry
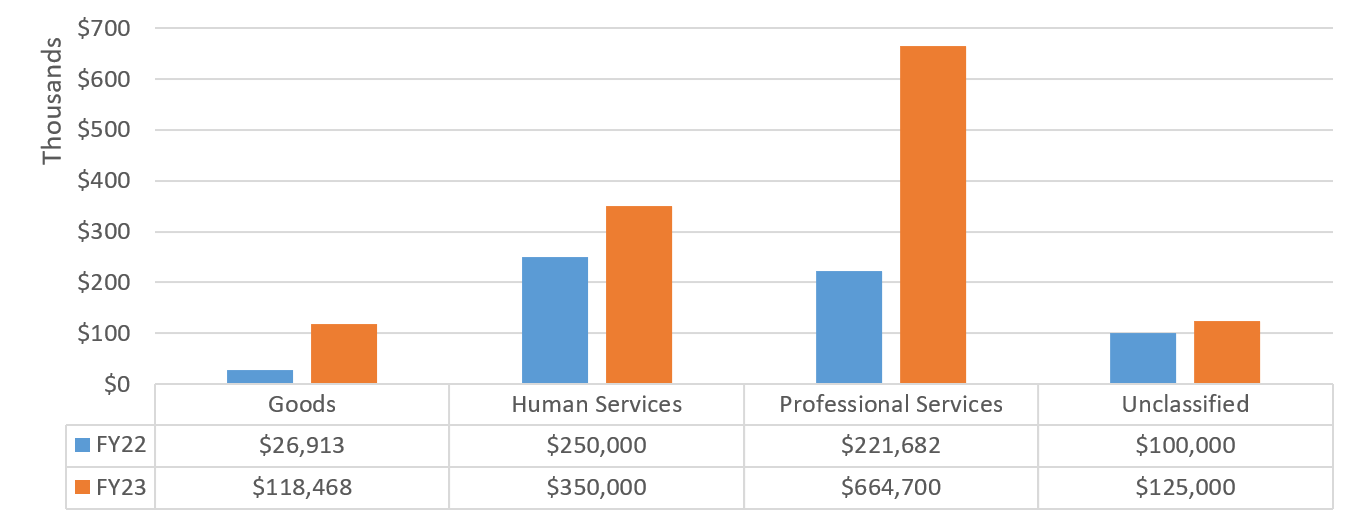
Financial Information Services Agency & Office of Payroll Administration (FISA-OPA)[36]
FISA is a joint agency of the Mayor and Comptroller’s Offices. FISA’s Board of Directors consists of a representative of the Mayor, a representative of the Comptroller, and a member of the private sector, appointed on the recommendation of the Mayor and Comptroller’s Offices. It operates citywide financial, employee and retiree payroll, and human resources applications used by City officials to carry out their charter mandated activities related to financial planning, budgeting, accounting, procurement, payroll, pension, and personnel functions.
The Office of Payroll Administration (OPA) manages payroll check, pension check, and direct deposit distributions to all City of New York employees and retirees. It also funds and reconciles payrolls, distributes payrolls to City agencies, and reports wages and tax information to federal, state, and local tax authorities. Finally, OPA analyzes labor agreements for pay/leave impact, ensures compliance with ordered deductions, collects and remits employee voluntary deductions, administers the City of New York’s commuter benefits program, and provides union services for collection and reporting of member dues and voluntary political contributions in accordance with mayoral executive orders.
Table 83 – FISA-OPA: FY22-FY23 Registrations by Contract Category
| FY22 | FY23 | |||
|---|---|---|---|---|
| Contract Category | # of Contracts | Total Contract Value | # of Contracts | Total Contract Value |
| Limited or Non-Competitive Method Contracts | 40 | $8,076,143 | 46 | $15,265,554 |
| Transactions Not Subject to PPB Rules | 1 | $24,243 | 0 | $0 |
| Supplemental Contracts | 5 | $1,881,790 | 36 | $18,773,358 |
| Grand Total | 46 | $9,982,176 | 82 | $34,038,913 |
Chart 114 – FISA-OPA: FY22-FY23 Volume of Contracts by Industry
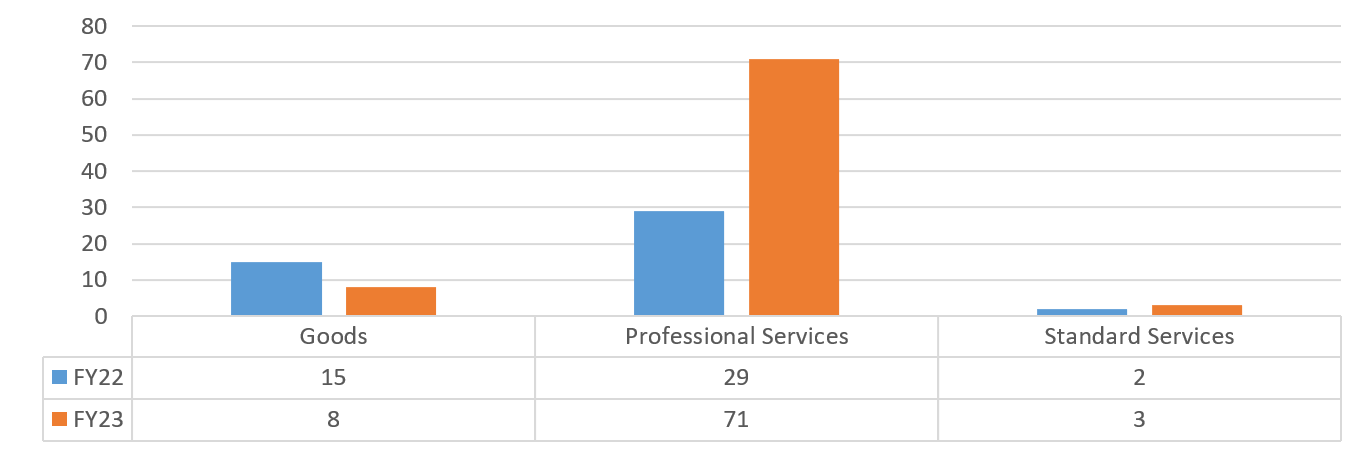
Chart 115 – FISA-OPA: FY22-FY23 Value of Contracts by Industry
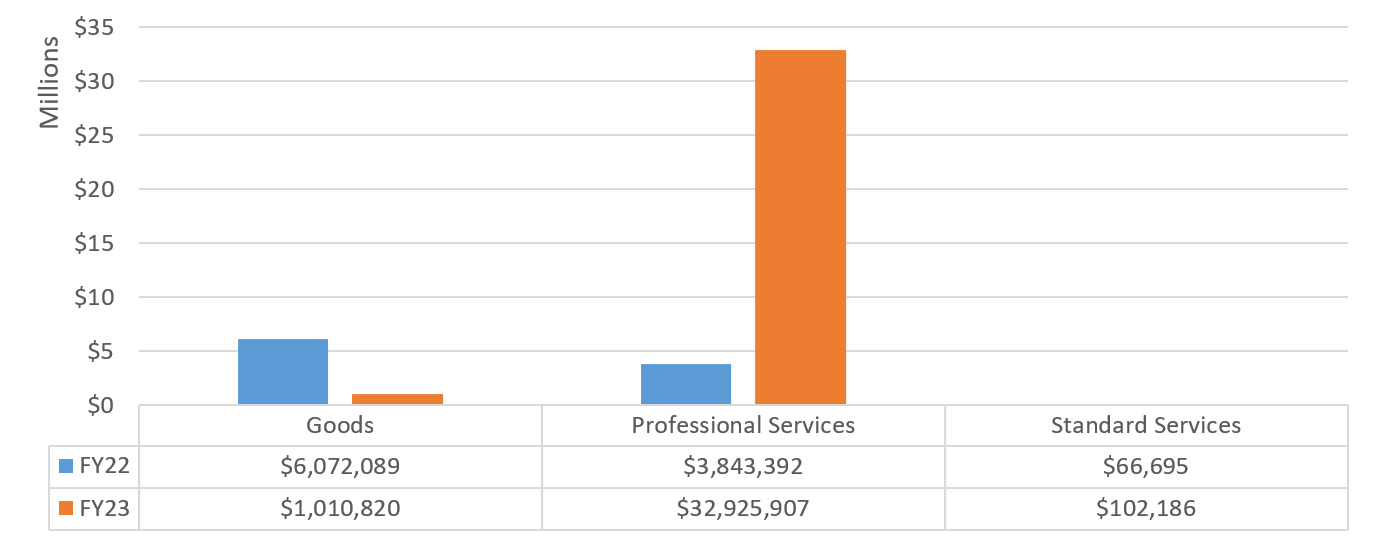
Office of Administrative Trials and Hearings (OATH)
OATH is an independent administrative tribunal that oversees cases involving employee discipline and disability hearings for civil servants, and Conflicts of Interest Board and City Human Rights Commission cases. OATH also holds hearings on summonses issued by 25 different City enforcement agencies for alleged violations of law or City rules.
Table 84 – OATH: FY22-FY23 Registrations by Contract Category
| FY22 | FY23 | |||
|---|---|---|---|---|
| Contract Category | # of Contracts | Total Contract Value | # of Contracts | Total Contract Value |
| Limited or Non-Competitive Method Contracts | 12 | $1,573,123 | 16 | $3,547,430 |
| Supplemental Contracts | 0 | $0 | 4 | $674,325 |
| Grand Total | 12 | $1,573,123 | 20 | $4,221,756 |
Chart 116 – OATH: FY22-FY23 Volume of Contracts by Industry
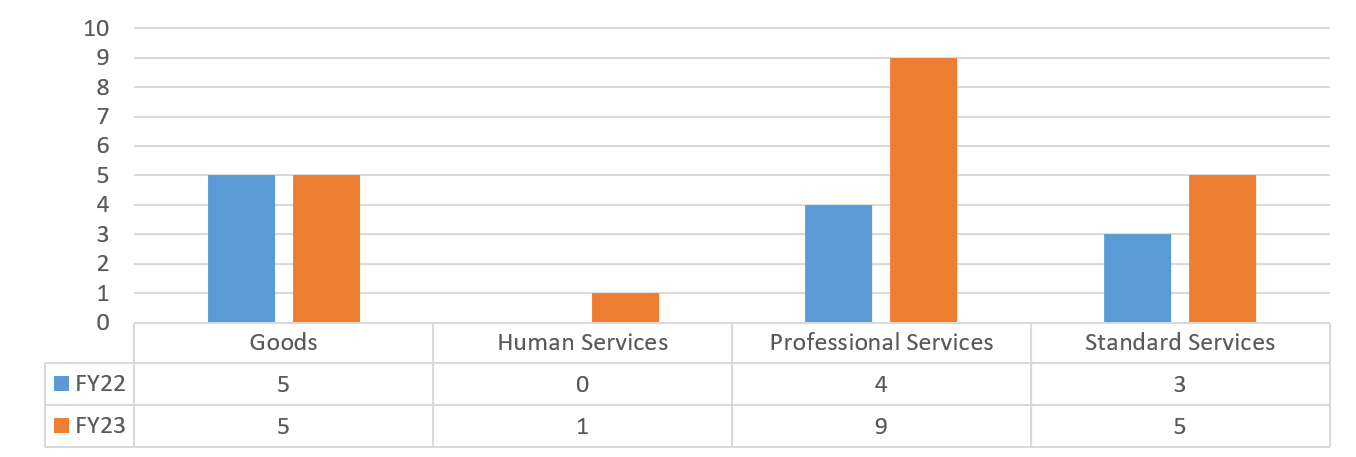
Chart 117 – OATH: FY22-FY23 Value of Contracts by Industry
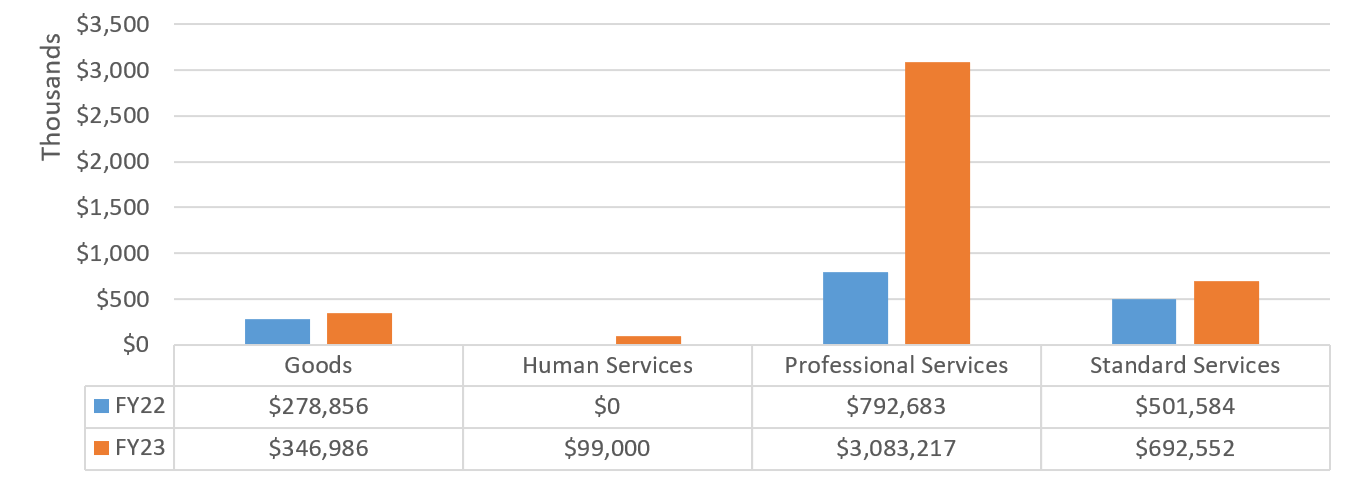
Office of Collective Bargaining (OCB)
The NYC Office of Collective Bargaining (OCB) was created with the enactment of the New York City Collective Bargaining Law (NYCCBL) in 1967. OCB is a neutral agency authorized to resolve questions concerning union representation (certifications), and adjudicate issues concerning collective bargaining, retaliation or discrimination based on union activity, and the union’s duty of fair representation. Decisions on these issues are rendered by either the Board of Collective Bargaining or the Board of Certification. OCB also conducts mediations to resolve improper practice claims, representation disputes, and disputes over terms of collective bargaining agreements. In addition, OCB administers the statutory impasse and grievance arbitration process.
Table 85 – OCB: FY22-FY23 Registrations by Contract Category
| FY22 | FY23 | |||
|---|---|---|---|---|
| Contract Category | # of Contracts | Total Contract Value | # of Contracts | Total Contract Value |
| Limited or Non-Competitive Method Contracts | 1 | $49,500 | 1 | $30,000 |
| Grand Total | 1 | $49,500 | 1 | $30,000 |
Chart 118 – OCB: FY22-FY23 Volume of Contracts by Industry
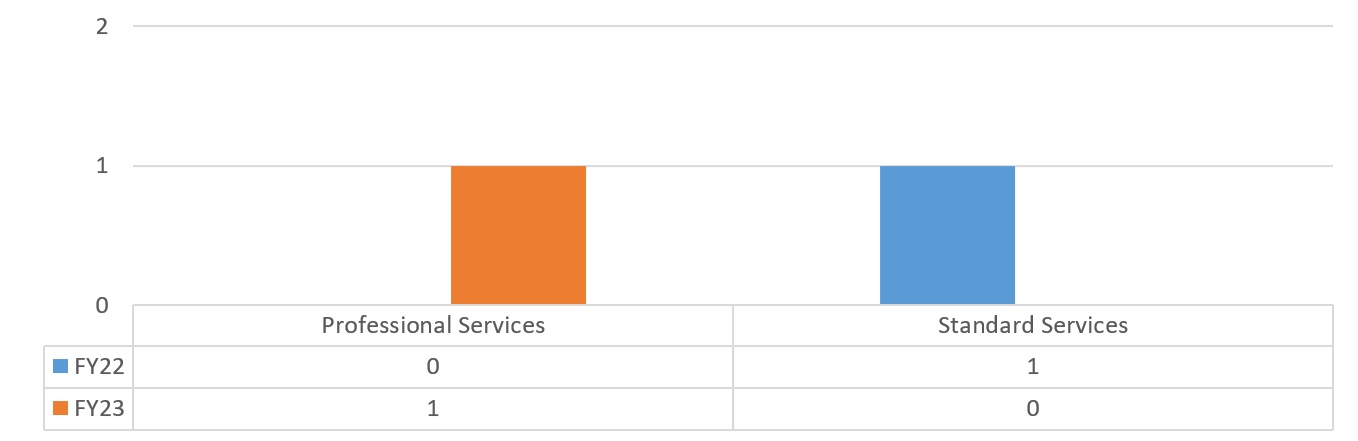
Chart 119 – OCB: FY22-FY23 Value of Contracts by Industry
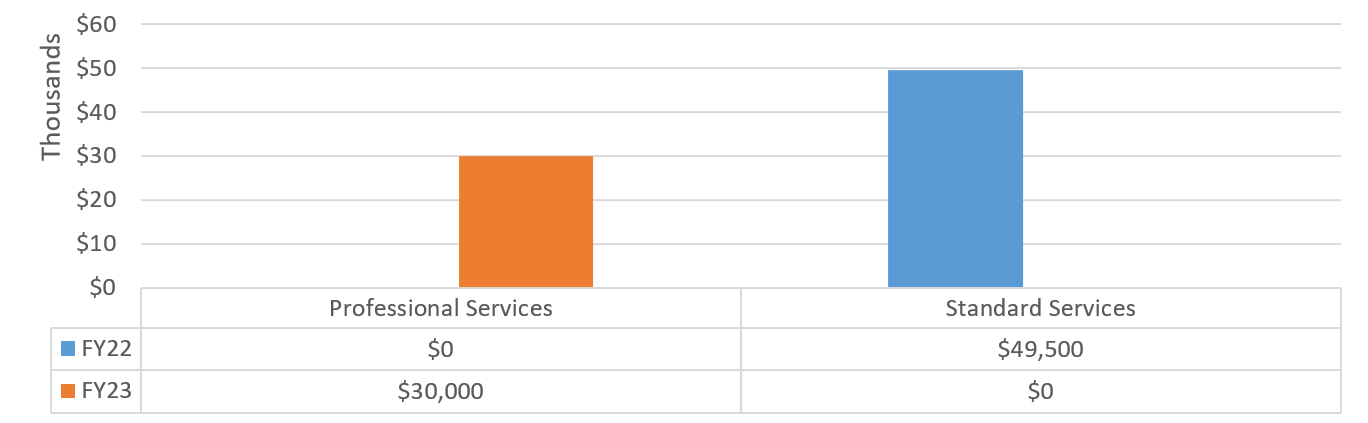
Office of Special Prosecution – Special Narcotics (OOP-SN)
The Office of the Special Narcotics Prosecutor (OOP-SN) works collaboratively with New York City’s elected District Attorneys to investigate and prosecute felony narcotics cases across all five boroughs of the City.
Table 86 – OOP-SN: FY22-FY23 Registrations by Contract Category
| FY22 | FY23 | |||
|---|---|---|---|---|
| Contract Category | # of Contracts | Total Contract Value | # of Contracts | Total Contract Value |
| Limited or Non-Competitive Method Contracts | 4 | $92,350 | 2 | $42,600 |
| Grand Total | 4 | $92,350 | 2 | $42,600 |
Chart 120 – OOP-SN: FY22-FY23 Volume of Contracts by Industry
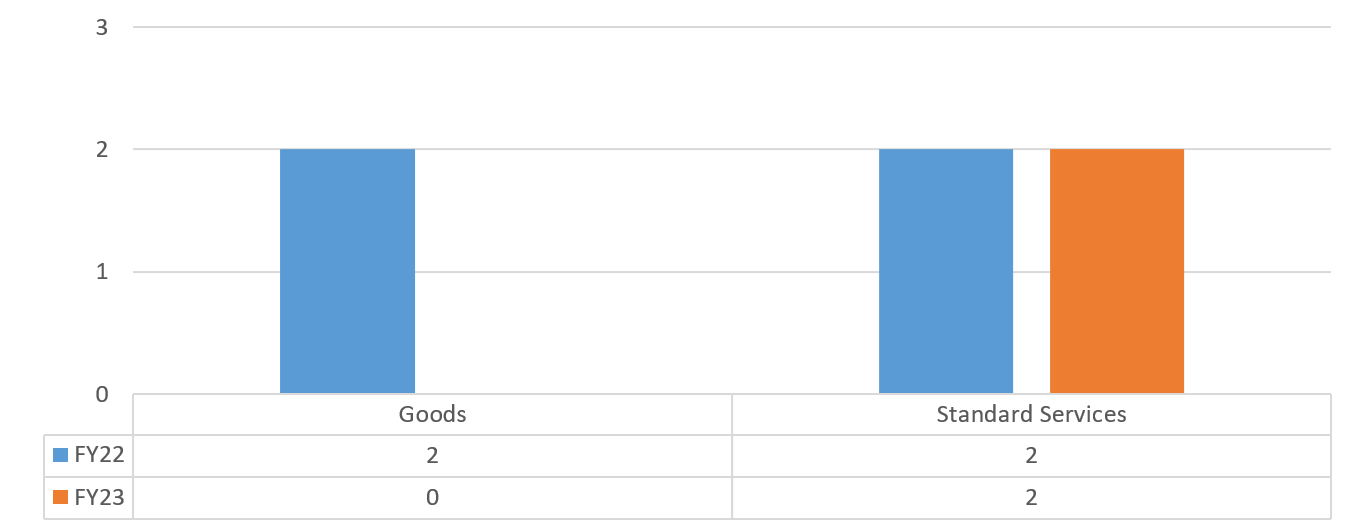
Chart 121 – OOP-SN: FY22-FY23 Value of Contracts by Industry
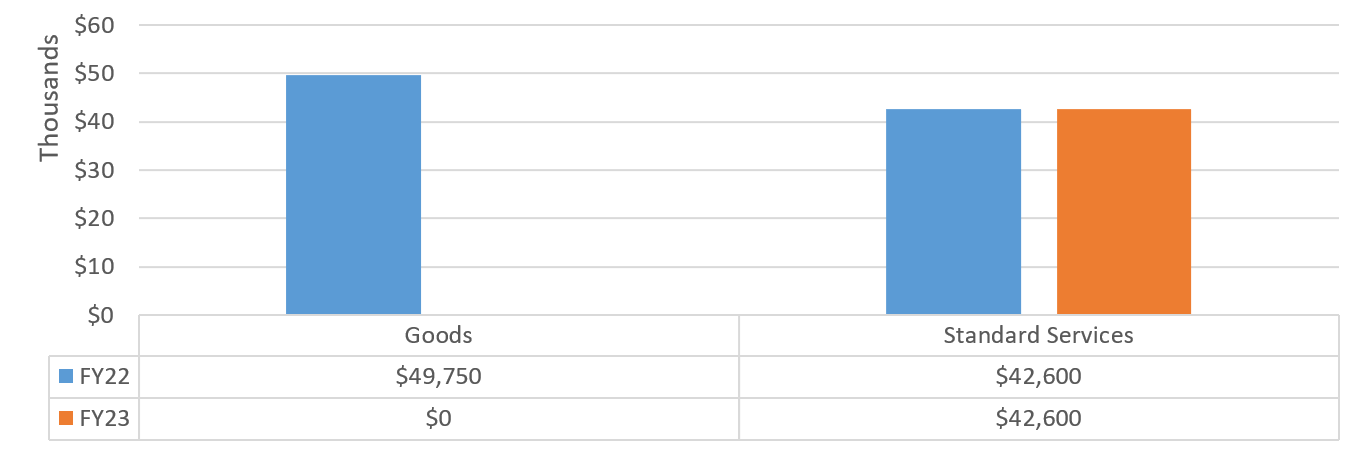
Office of the Actuary (OTA)
The New York City Office of the Actuary (OTA), a non-mayoral agency, provides actuarial information and services for the five major actuarially-funded New York City Retirement Systems and Pension Funds, collectively called the NYCRS, resulting in an annual determination of New York City’s contributions to these retirement systems and pension funds. This information is provided to the Boards of Trustees and staff of the NYCRS, to the City and other employers and labor organizations whose employees participate in the NYCRS, to fiscal oversight entities, to City and State legislators, and to other parties interested in the NYCRS.
Table 87 – OTA: FY22-FY23 Registrations by Contract Category
| FY22 | FY23 | |||
|---|---|---|---|---|
| Contract Category | # of Contracts | Total Contract Value | # of Contracts | Total Contract Value |
| Competitive Method Contracts | 1 | $575,700 | 0 | $0 |
| Limited or Non-Competitive Method Contracts | 1 | $25,000 | 1 | $24,000 |
| Grand Total | 2 | $600,700 | 1 | $24,000 |
Chart 122 – OTA: FY22-FY23 Volume of Contracts by Industry
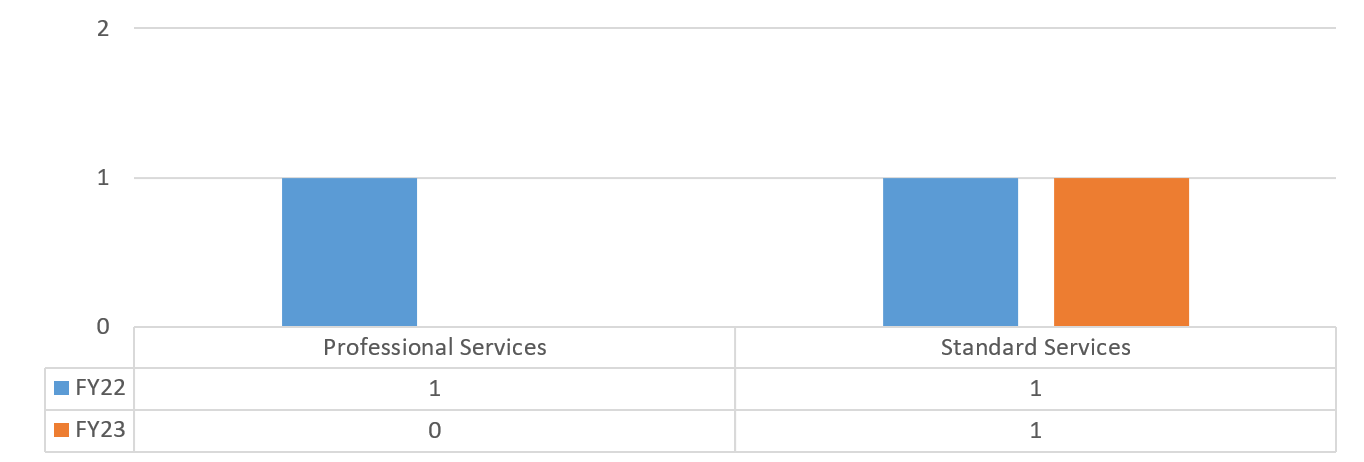
Chart 123 – OTA: FY22-FY23 Value of Contracts by Industry
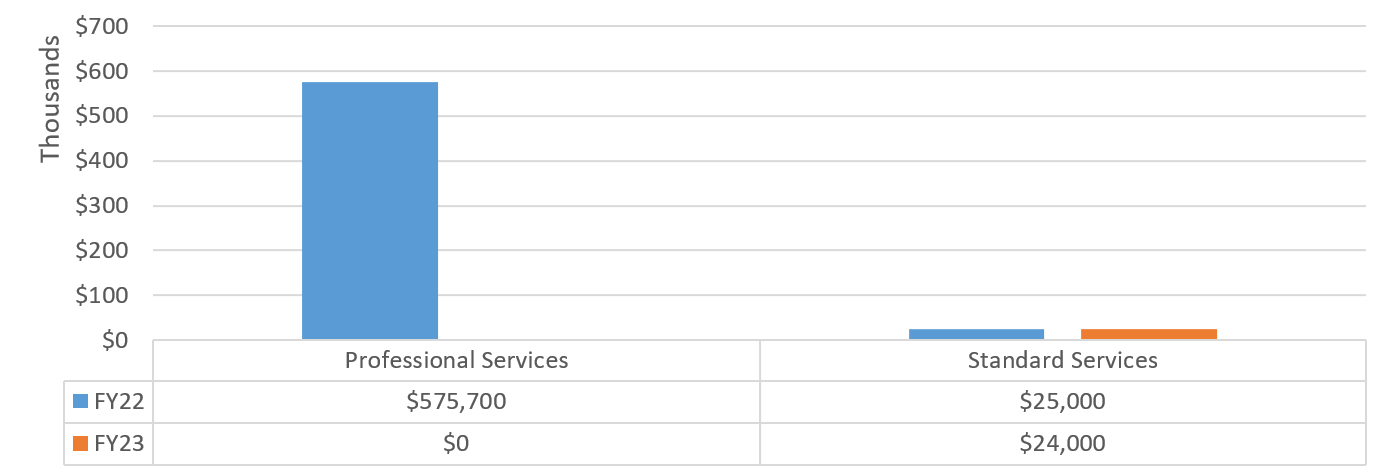
Other Agencies
Other Agencies consists of state agencies, authorities, boards, libraries, and other corporations that perform public functions in NYC. This group also includes the DOE, despite the fact that the New York State Legislature has granted control of the City schools to the Mayor’s Office since 2002. Other Agencies may not be subject to, or only partially subject to, City procurement rules since New York State law may preempt them. For example, the DOE’s procurement activities are governed by NYS Education Law (not the PPB Rules), which mandated the creation of administrative rules known as the Procurement Policy and Procedures (PPP).[37]
The City registered procurement contracts under 11 Other Agencies in FY23 for a total value of $7.97 billion. The largest driver of procurement volume and value among Other Agencies was the DOE, which registered $2.93 billion in new procurement contracts. Table 88 displays information on the number of new procurement contracts registered to each Other Agency.
Table 88: FY23 New Procurement Contracts and Task Orders by Other Agency
| Agency | # of Contracts | % Share of Contracts | Total Contract Value | % Share of Contract Value |
| BPL | 5 | 0.12% | $1,953,895 | 0.02% |
| CUCF | 30 | 0.70% | $18,479,311 | 0.23% |
| CUNY | 62 | 1.45% | $174,867,296 | 2.19% |
| DOE | 3,238 | 75.53% | $2,930,954,971 | 36.77% |
| EDC | 313 | 7.30% | $2,851,090,873 | 35.77% |
| HHC | 245 | 5.71% | $238,415,102 | 2.99% |
| IBO | 9 | 0.21% | $572,220 | 0.01% |
| NYCHA | 370 | 8.63% | $595,605,945 | 7.47% |
| NYRL | 2 | 0.05% | $674,836 | 0.01% |
| QBPL | 8 | 0.19% | $2,788,309 | 0.03% |
| TRANSIT | 5 | 0.12% | $1,155,658,035 | 14.50% |
| Grand Total | 4,287 | 100.00% | $7,971,060,793 | 100.00% |
Brooklyn Public Library (BPL)
Established in 1896, the Brooklyn Public Library (BPL) is one of the nation’s largest public library systems and currently has more than 850,000 active cardholders. BPL maintains a branch library within a half-mile of the majority of Brooklyn’s 2.7 million residents.
Table 89 – BPL: FY22-FY23 Registrations by Contract Category
| FY22 | FY23 | |||
|---|---|---|---|---|
| Contract Category | # of Contracts | Total Contract Value | # of Contracts | Total Contract Value |
| Competitive Method Contracts | 1 | $199,626 | 2 | $616,410 |
| Limited or Non-Competitive Method Contracts | 3 | $1,773,486 | 3 | $1,337,486 |
| Grand Total | 4 | $1,973,112 | 5 | $1,953,895 |
Chart 124 – BPL: FY22-FY23 Volume of Contracts by Industry
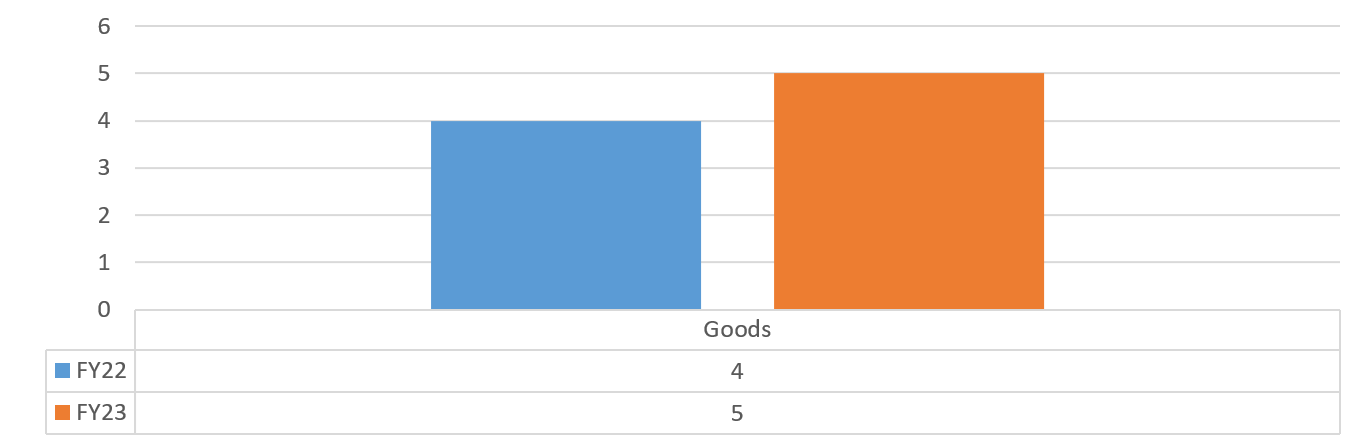
Chart 125 – BPL: FY22-FY23 Value of Contracts by Industry
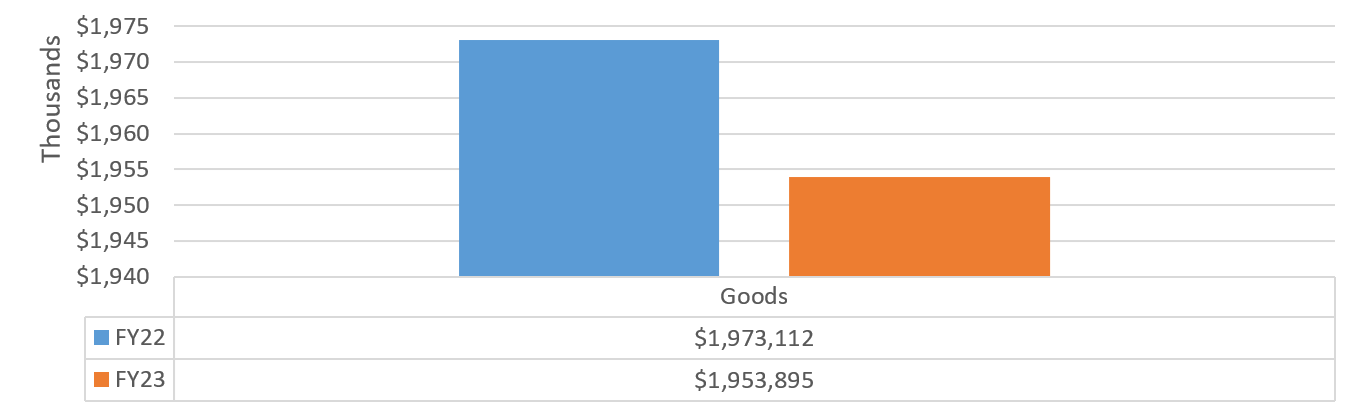
City University Construction Fund (CUCF)
The CUCF is a public benefit corporation established in 1966 by the New York State Legislature, known as the City University Construction Fund Act. The Mission of CUCF is to manage the resources necessary for the design and construction of space required to support the educational mandate of the City University of New York (CUNY). A seven-member Board of Trustees governs the CUCF’s programs.
Table 90 – CUCF: FY22-FY23 Registrations by Contract Category
| FY22 | FY23 | |||
|---|---|---|---|---|
| Contract Category | # of Contracts | Total Contract Value | # of Contracts | Total Contract Value |
| Competitive Method Contracts | 1 | $1 | 9 | $9,827,216 |
| Limited or Non-Competitive Method Contracts | 4 | $467,479 | 7 | $1,047,214 |
| Transactions Not Subject to PPB Rules | 30 | $21,789,626 | 14 | $7,604,882 |
| Grand Total | 35 | $22,257,106 | 30 | $18,479,311 |
Chart 126 – CUCF: FY22-FY23 Volume of Contracts by Industry
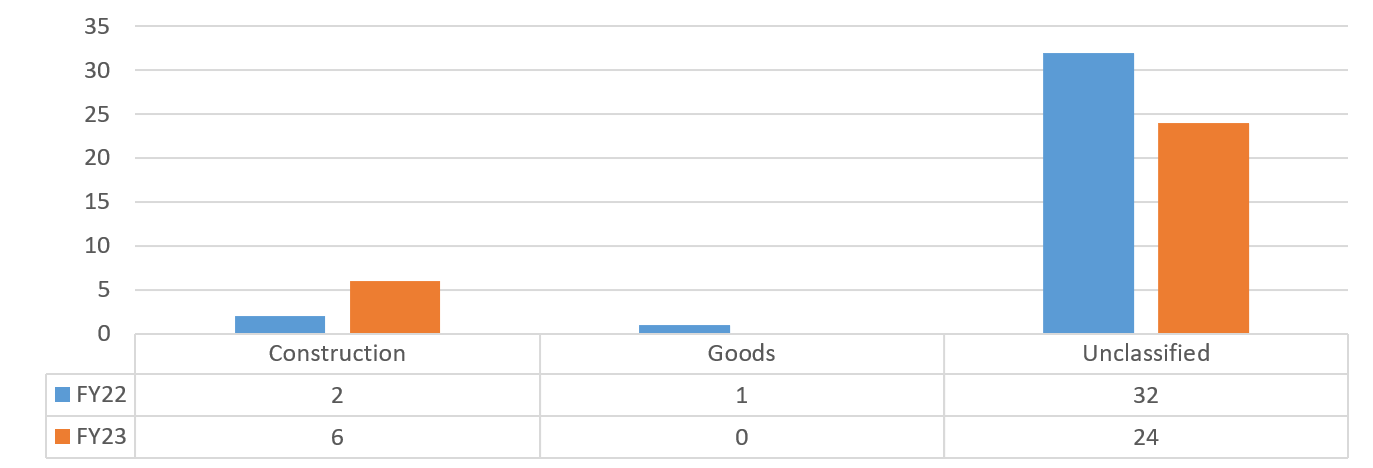
Chart 127 – CUCF: FY22-FY23 Value of Contracts by Industry
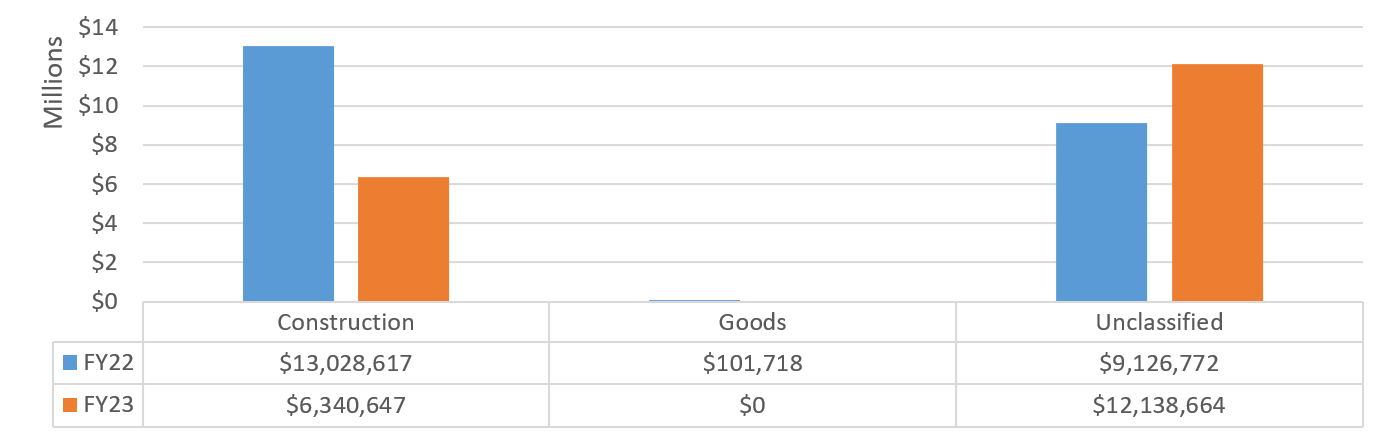
City University of New York (CUNY)
Under State Education law, CUNY is an independent system of higher education governed by its own board of trustees responsible for the governance, maintenance, and development of both senior and community college units of the city university. Founded in 1847 as the nation’s first free public institution of higher education, CUNY currently has 25 colleges spread across New York City’s five boroughs.
Table 91 – CUNY: FY22-FY23 Registrations by Contract Category
| FY22 | FY23 | |||
|---|---|---|---|---|
| Contract Category | # of Contracts | Total Contract Value | # of Contracts | Total Contract Value |
| Competitive Method Contracts | 2 | $2,136,784 | 41 | $154,655,522 |
| Limited or Non-Competitive Method Contracts | 15 | $27,544,636 | 20 | $12,974,449 |
| Supplemental Contracts | 0 | $0 | 1 | $7,237,325 |
| Grand Total | 17 | $29,681,421 | 62 | $174,867,296 |
Chart 128 – CUNY: FY22-FY23 Volume of Contracts by Industry
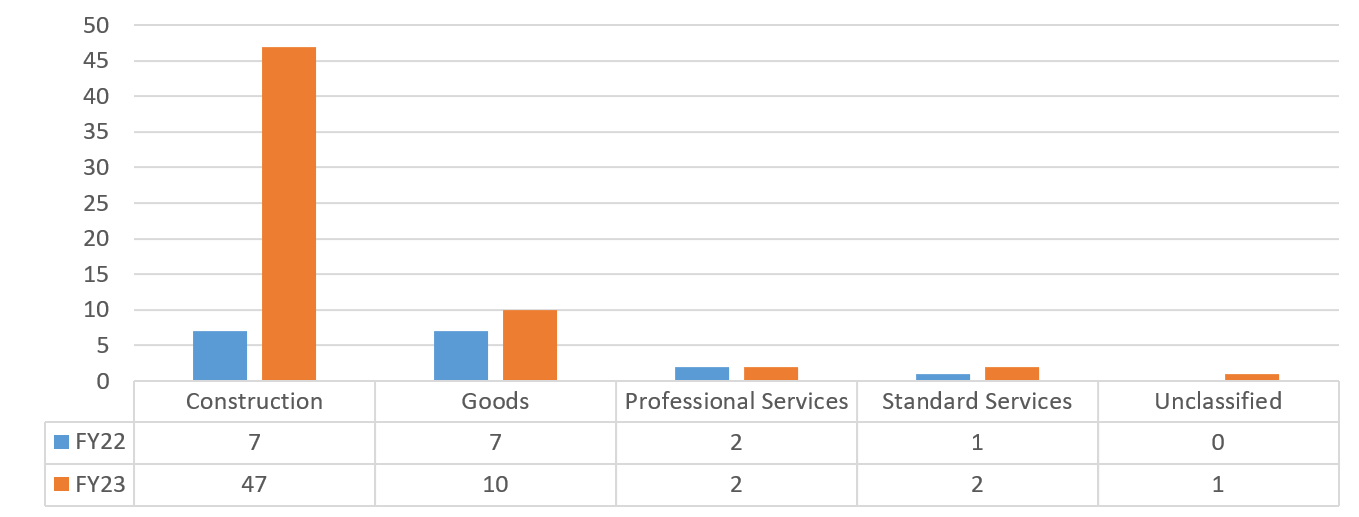
Chart 129 – CUNY: FY22-FY23 Value of Contracts by Industry
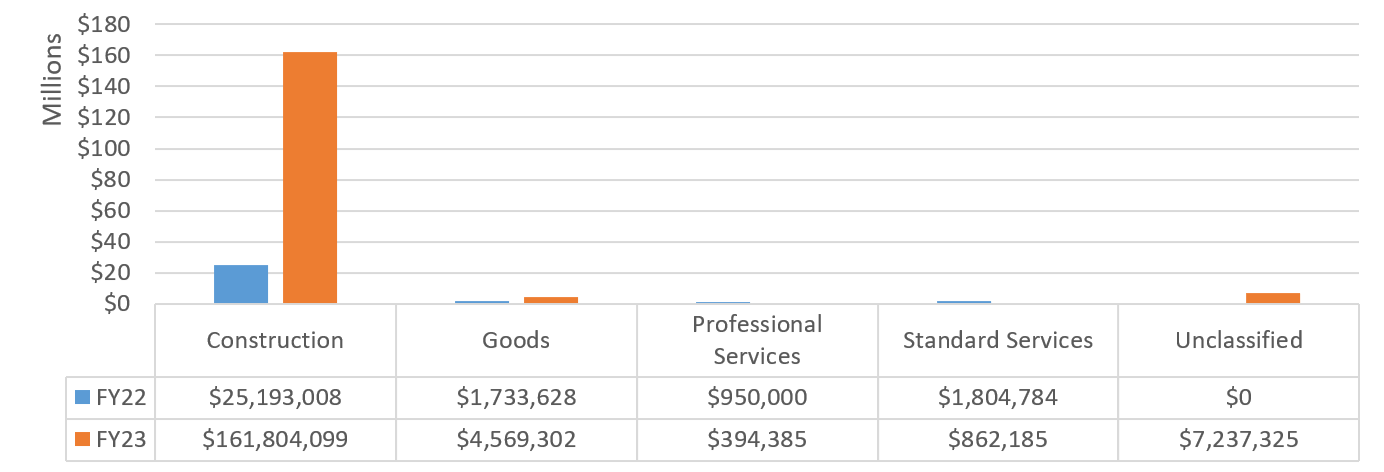
Department of Education (DOE)
The DOE is the largest school district in the U.S. and is responsible for educating 1.1 million students in over 1,800 public schools. It has an internal Division of Contracts and Purchasing that is responsible for overseeing DOE’s procurement activities. As noted above, DOE contracts are governed by the PPP rules.
Table 92 – DOE: FY22-FY23 Registrations by Contract Category
| FY22 | FY23 | |||
|---|---|---|---|---|
| Contract Category | # of Contracts | Total Contract Value | # of Contracts | Total Contract Value |
| Competitive Method Contracts | 1,262 | $6,835,739,188 | 294 | $1,193,843,554 |
| Limited or Non-Competitive Method Contracts | 7,311 | $1,805,185,876 | 2,727 | $1,215,980,718 |
| Supplemental Contracts | 285 | $933,404,408 | 217 | $521,130,698 |
| Grand Total | 8,858 | $9,574,329,472 | 3,238 | $2,930,954,971 |
Chart 130 – DOE: FY22-FY23 Volume of Contracts by Industry
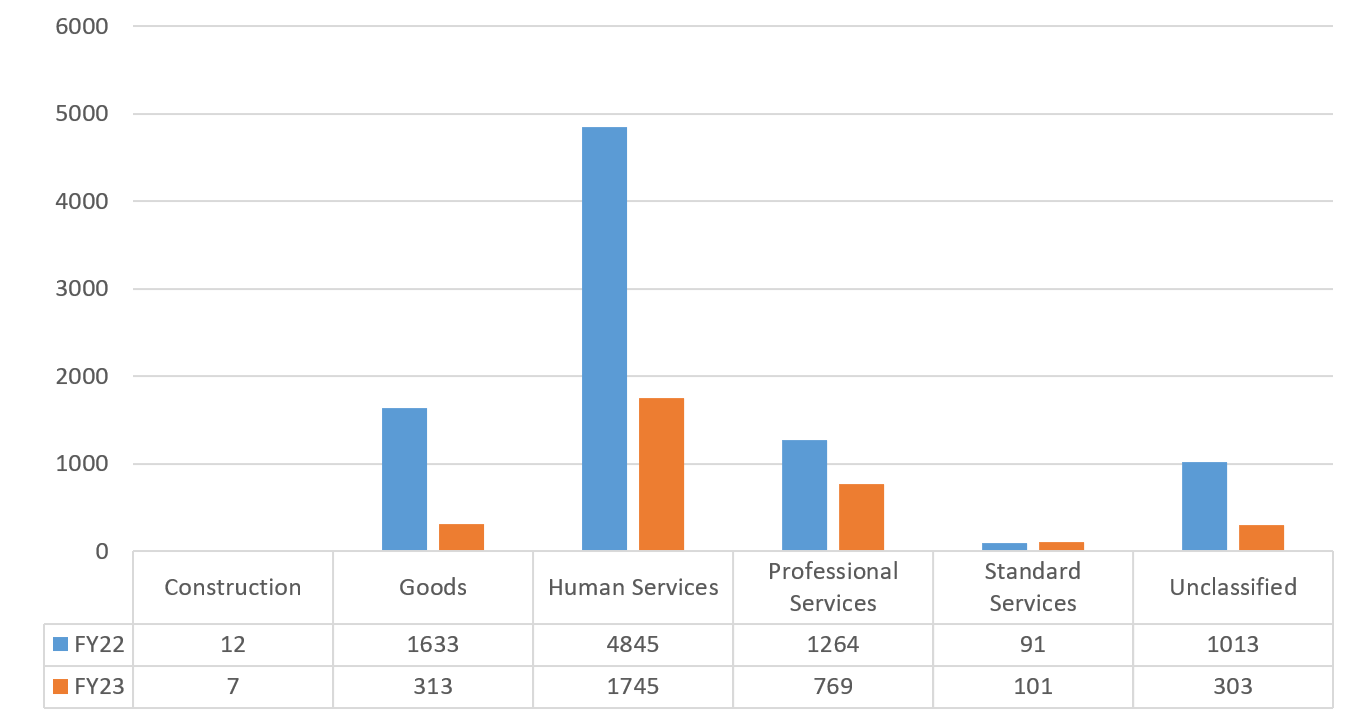
Chart 131 – DOE: FY22-FY23 Value of Contracts by Industry
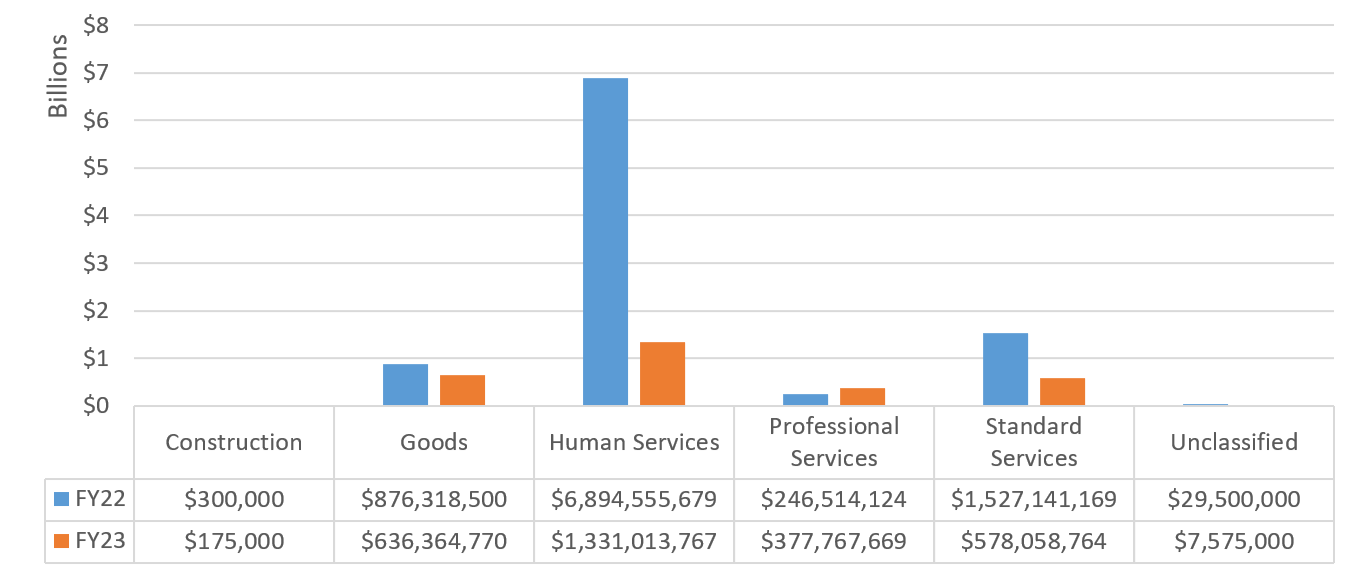
NYC Economic Development Corporation (EDC)
The New York City Economic Development Corporation (EDC) is a nonprofit organization incorporated under the Not-for-Profit Corporation Law of the State of New York. SBS contracts with and retains EDC to function as a development consultant and provide economic development-related services on behalf of the City. Since the vast majority of EDC’s contract actions were processed as TOs registered under SBS Master Awards, they are included in the totals for this section. TOs are not reflected in Section II contract groups but are listed as their own category in table 93 below.
Table 93 – EDC: FY22-FY23 Registrations by Contract Category
| FY22 | FY23 | |||
|---|---|---|---|---|
| Contract Category | # of Contracts | Total Contract Value | # of Contracts | Total Contract Value |
| Limited or Non-Competitive Method Contracts | 3 | $2,106,604,422 | 2 | $2,279,776,342 |
| Transactions Not Subject to PPB Rules | 1 | $709,000 | 1 | $544,892 |
| Task Order | 248 | $845,934,277 | 310 | $570,769,639 |
| Grand Total | 252 | $2,953,247,699 | 313 | $2,851,090,873 |
Chart 132 – EDC: FY22-FY23 Volume of Contracts and TOs by Industry
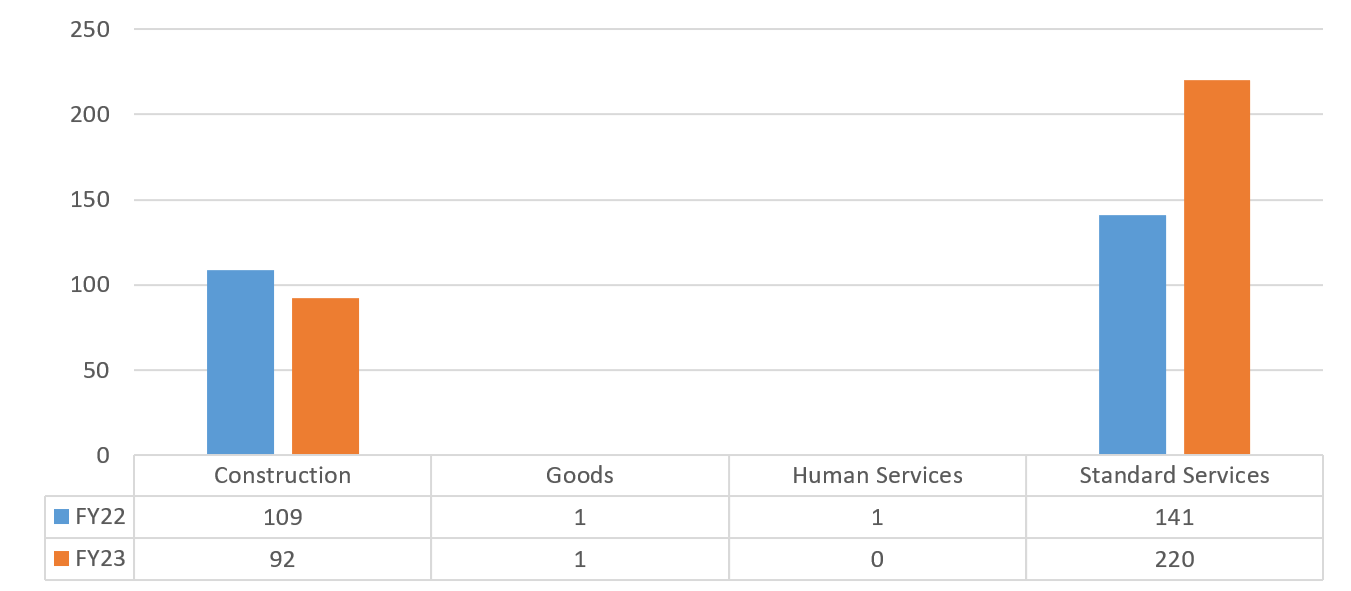
Chart 133 – EDC: FY22-FY23 Value of Contracts and TOs by Industry
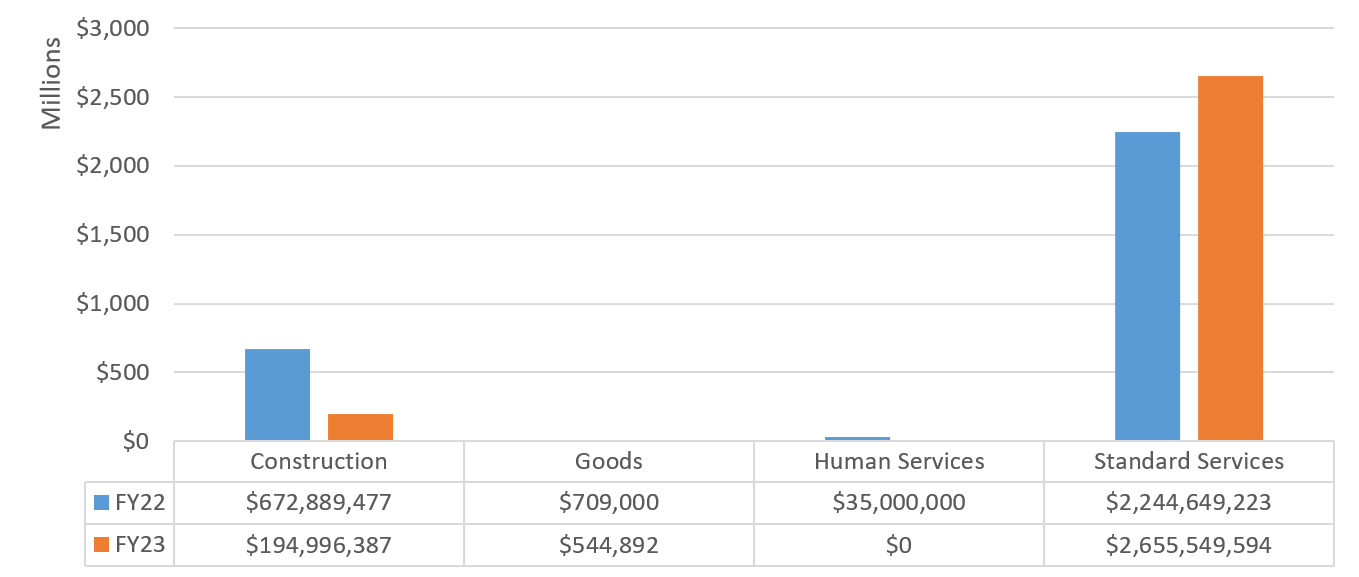
Health and Hospitals Corporation (HHC)
NYC Health and Hospitals (HHC) is a public benefits corporation and the nation’s largest municipal health care delivery system in the United States. HHC operates the City’s public hospitals and clinics.
Table 94 – HHC: FY22-FY23 Registrations by Contract Category
| FY22 | FY23 | |||
|---|---|---|---|---|
| Contract Category | # of Contracts | Total Contract Value | # of Contracts | Total Contract Value |
| Competitive Method Contracts | 66 | $231,582,947 | 81 | $93,896,197 |
| Limited or Non-Competitive Method Contracts | 132 | $110,907,969 | 164 | $144,518,906 |
| Transactions Not Subject to PPB Rules | 1 | $62,400 | 0 | $0 |
| Grand Total | 199 | $342,553,316 | 245 | $238,415,102 |
Chart 134 – HHC: FY22-FY23 Volume of Contracts by Industry
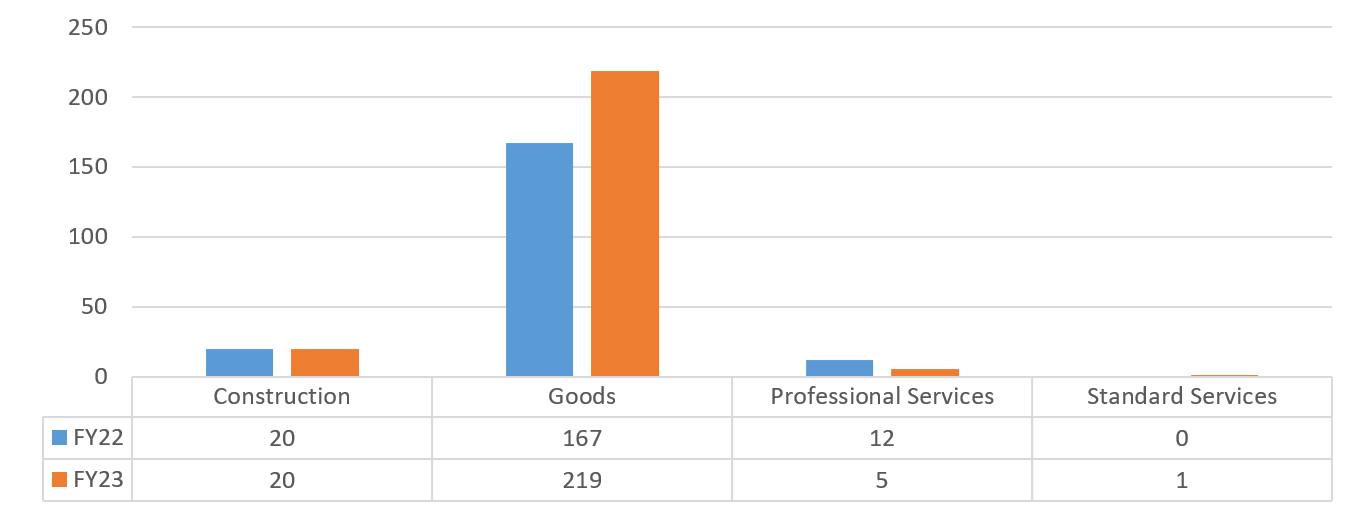
Chart 135 – HHC: FY22-FY23 Value of Contracts by Industry
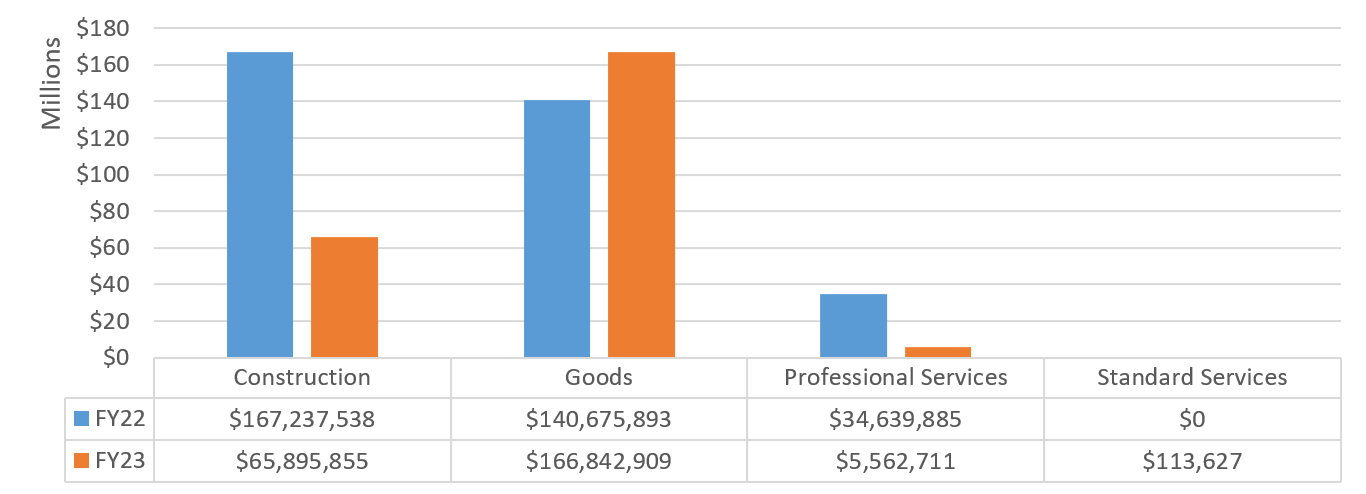
Independent Budget Office (IBO)
Established under Chapter 11 of the Charter, the Independent Budget Office (IBO) provides the Comptroller, the President of the City Council, the members and committees of the Council, the Borough Presidents, and City Community Boards with information to assist them in the discharge of their responsibilities which are related to the budgetary process.[38]
Table 95 – IBO: FY22-FY23 Registrations by Contract Category
| FY22 | FY23 | |||
|---|---|---|---|---|
| Contract Category | # of Contracts | Total Contract Value | # of Contracts | Total Contract Value |
| Limited or Non-Competitive Method Contracts | 4 | $176,378 | 7 | $464,690 |
| Transactions Not Subject to PPB Rules | 2 | $97,507 | 2 | $107,530 |
| Supplemental Contracts | 1 | $1,883,699 | 0 | $0 |
| Grand Total | 7 | $2,157,584 | 9 | $572,220 |
Chart 136 – IBO: FY22-FY23 Volume of Contracts by Industry
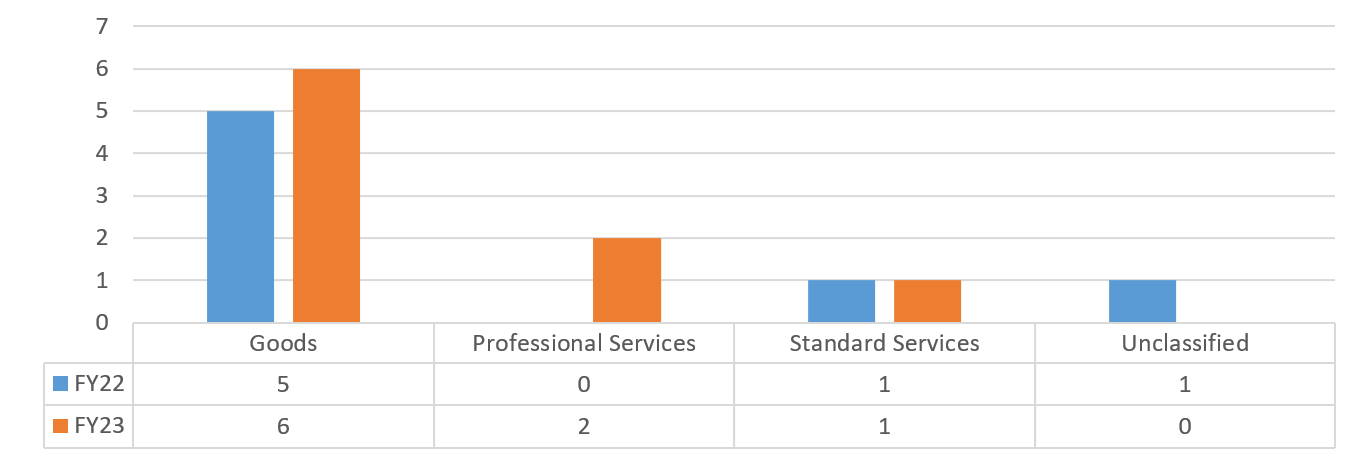
Chart 137 – IBO: FY22-FY23 Value of Contracts by Industry
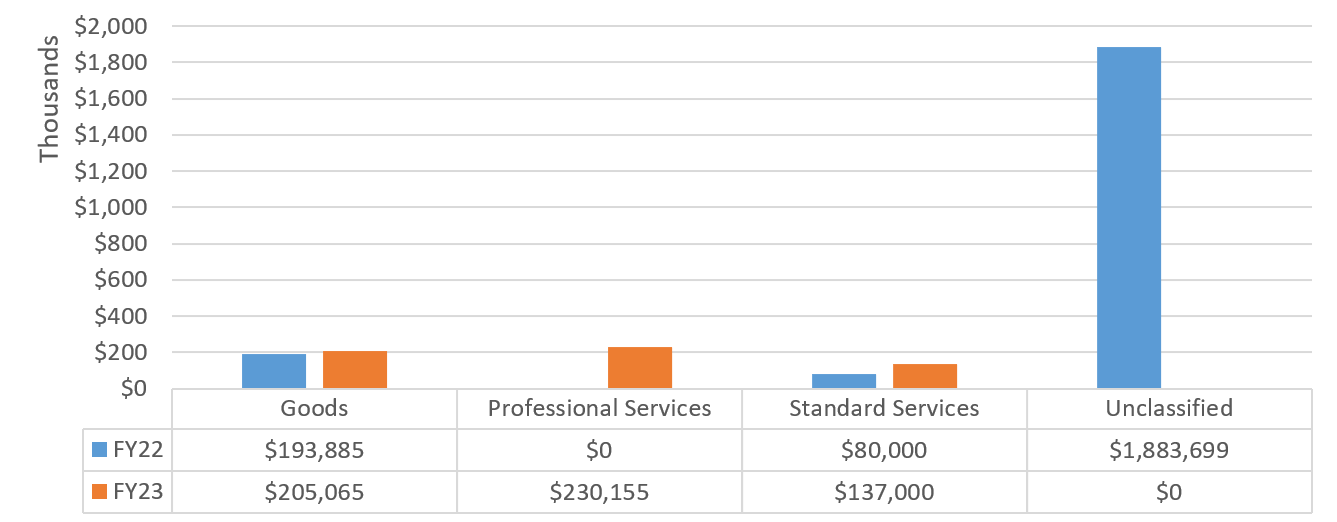
New York City Housing Authority (NYCHA)
The New York City Housing Authority (NYCHA) is a public development corporation that was created in 1935 to provide decent, affordable housing for low- and moderate-income New Yorkers. Today it is the largest public housing authority in North America. Since majority of NYCHA’s contract actions were processed as TOs registered under HPD Master Awards, they are included in the totals for this section. TOs are not reflected in Section II contract groups but are listed as their own category in table 96 below.
Table 96 – NYCHA: FY22-FY23 Registrations by Contract Category
| FY22 | FY23 | |||
|---|---|---|---|---|
| Contract Category | # of Contracts | Total Contract Value | # of Contracts | Total Contract Value |
| Competitive Method Contracts | 55 | $191,283,877 | 63 | $370,142,914 |
| Limited or Non-Competitive Method Contracts | 3 | $24,484,835 | 1 | $675,000 |
| Transactions Not Subject to PPB Rules | 1 | $85,000 | 2 | $20,075,831 |
| Supplemental Contracts | 6 | $7,854,515 | 18 | $23,325,619 |
| Task Order | 138 | $87,128,119 | 286 | $181,386,580 |
| Grand Total | 203 | $310,836,347 | 370 | $595,605,945 |
Chart 138 – NYCHA: FY22-FY23 Volume of Contracts and TOs by Industry
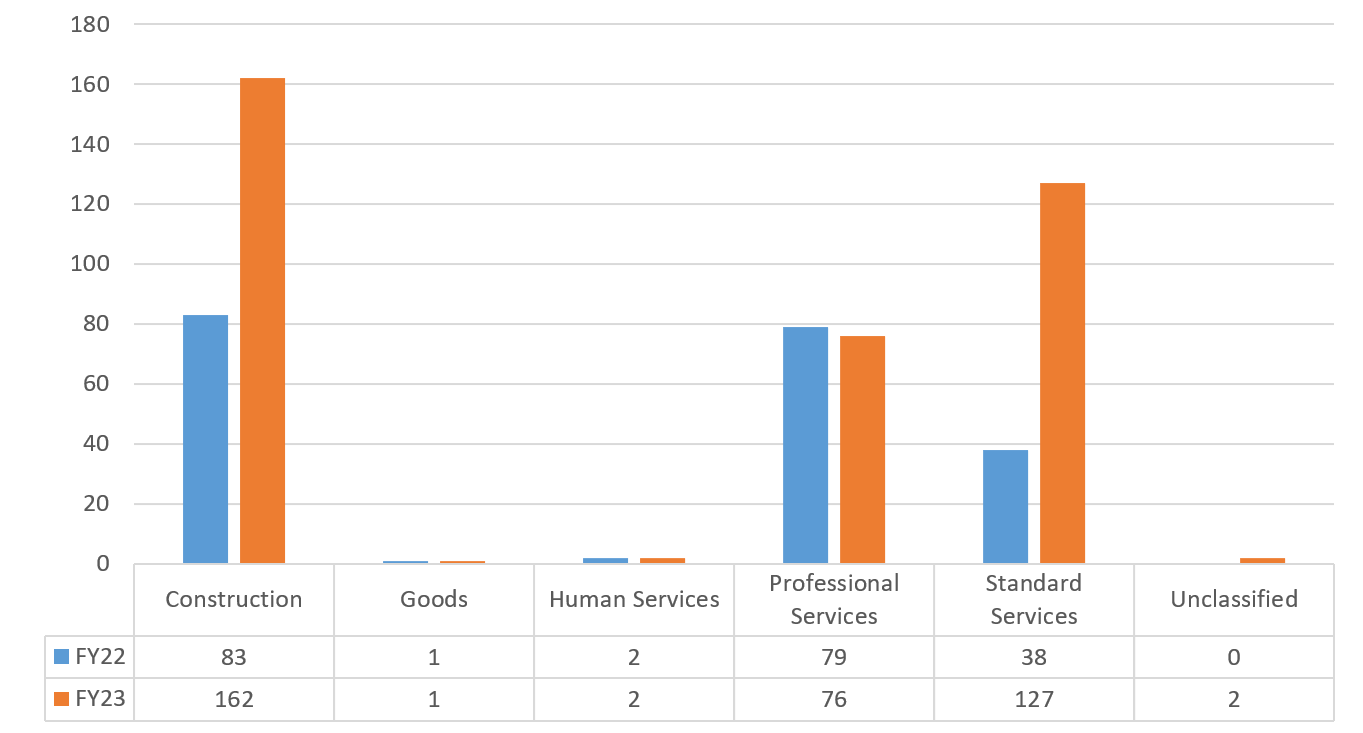
Chart 139 – NYCHA: FY22-FY23 Value of Contracts and TOs by Industry
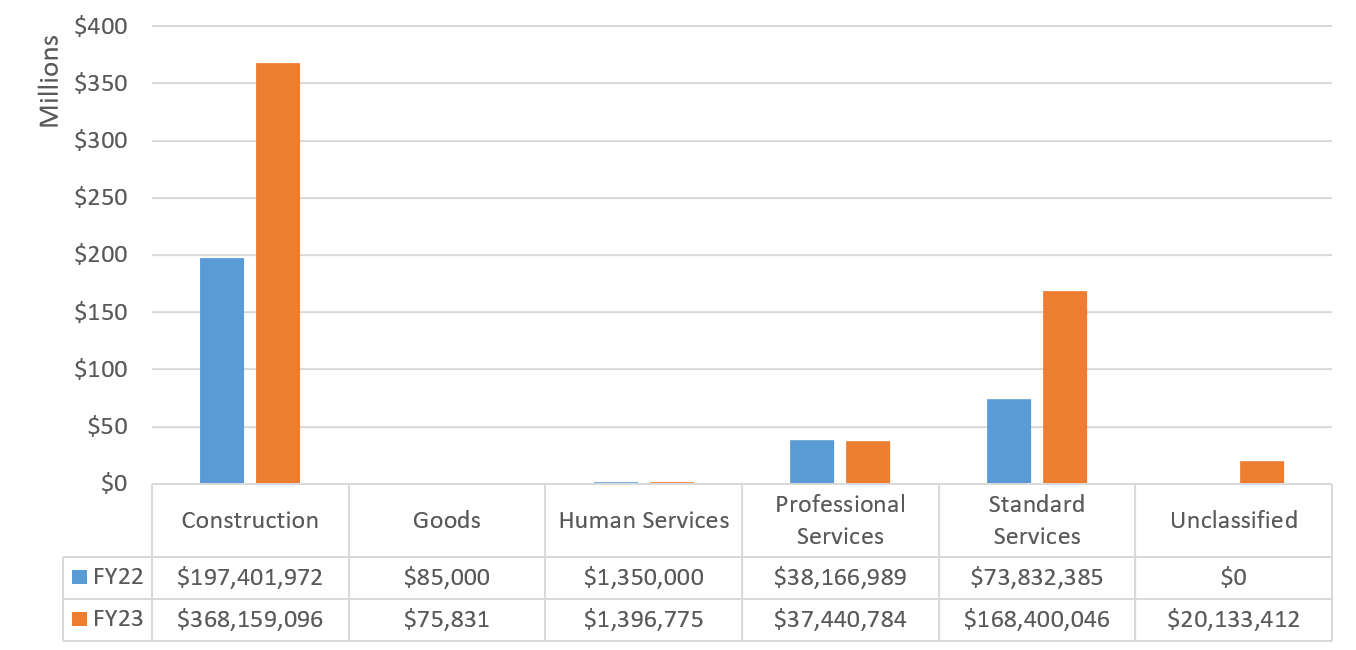
New York Research Library (NYRL)
The New York Research Library is a subset of libraries in the New York Public Library system. Its four research libraries are the Library for the Performing Arts located at Lincoln Center, the Schomburg Center for Research in Black Culture located in Harlem, the Science, Industry and Business Library in Midtown and the main library on 5th Avenue and 42nd Street (Humanities and Social Science).
Table 97 – NYRL: FY22-FY23 Registrations by Contract Category
| FY22 | FY23 | |||
|---|---|---|---|---|
| Contract Category | # of Contracts | Total Contract Value | # of Contracts | Total Contract Value |
| Limited or Non-Competitive Method Contracts | 1 | $276,110 | 2 | $674,836 |
| Grand Total | 1 | $276,110 | 2 | $674,836 |
Chart 140 – NYRL: FY22-FY23 Volume of Contracts by Industry
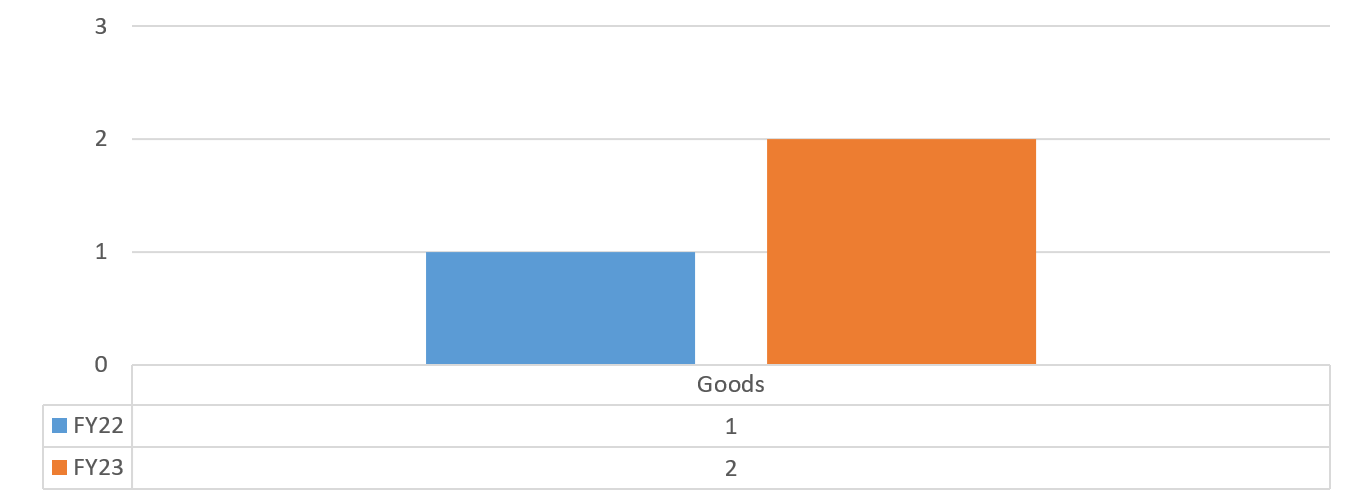
Chart 141 – NYRL: FY22-FY23 Value of Contracts by Industry
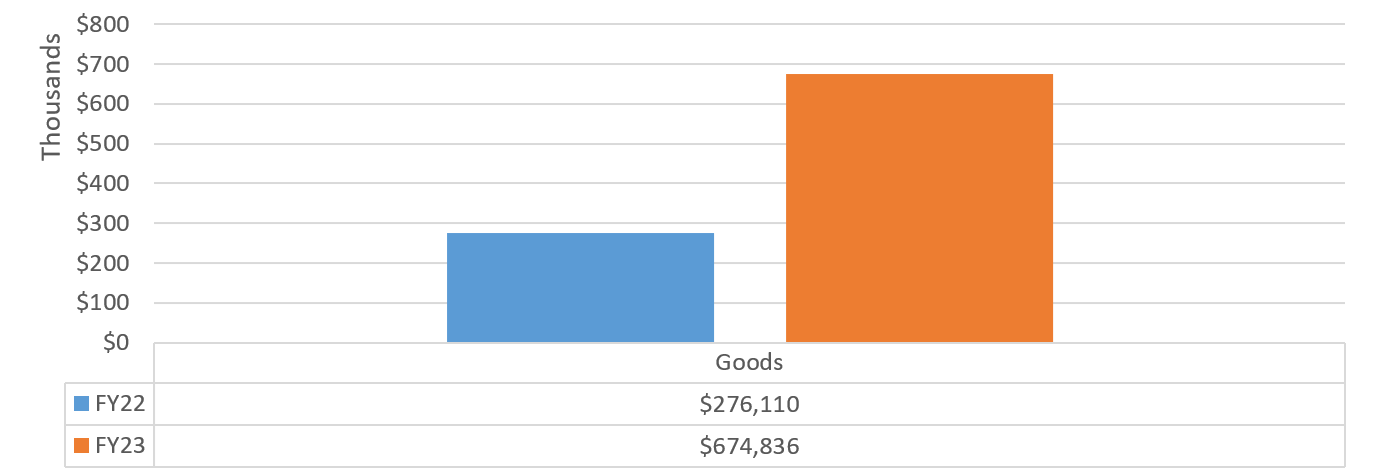
Queens Borough Public Library (QBPL)
An independent, nonprofit organization founded in 1896, Queens Borough Public Library (QBPL) offers free access to a collection of more than 5 million books and other materials in multiple languages, technology and digital resources, and more than 87,500 educational, cultural, and civic programs a year. It consists of 66 locations, including branch libraries, a Central Library, seven adult learning centers, a technology center, two universal pre-kindergartens, and two teen centers.
Table 98 – QBPL: FY22-FY23 Registrations by Contract Category
| FY22 | FY23 | |||
|---|---|---|---|---|
| Contract Category | # of Contracts | Total Contract Value | # of Contracts | Total Contract Value |
| Competitive Method Contracts | 0 | $0 | 3 | $2,659,903 |
| Limited or Non-Competitive Method Contracts | 13 | $564,923 | 5 | $128,406 |
| Grand Total | 13 | $564,923 | 8 | $2,788,309 |
Chart 142 – QBPL: FY22-FY23 Volume of Contracts by Industry
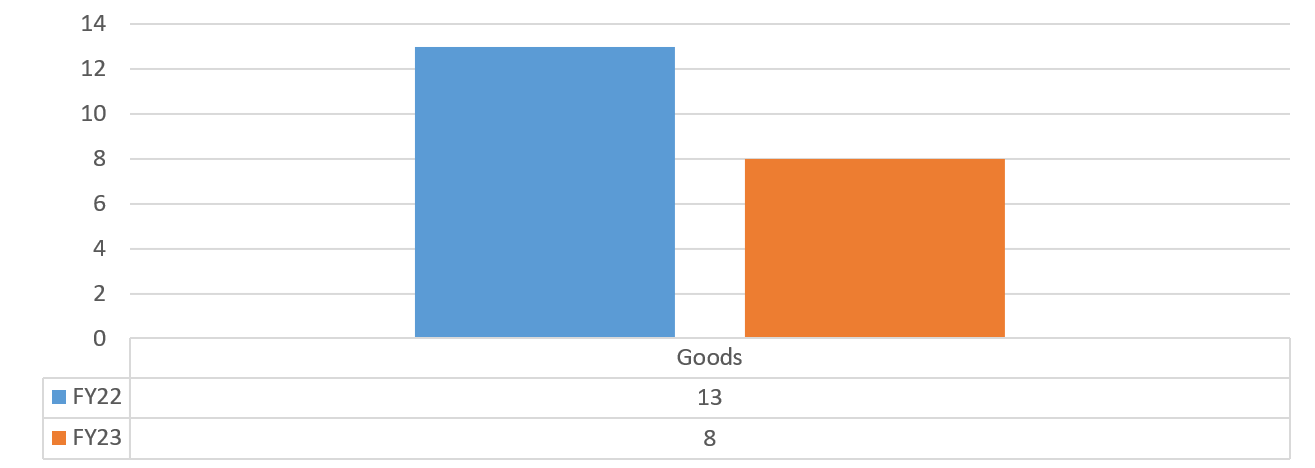
Chart 143 – QBPL: FY22-FY23 Value of Contracts by Industry
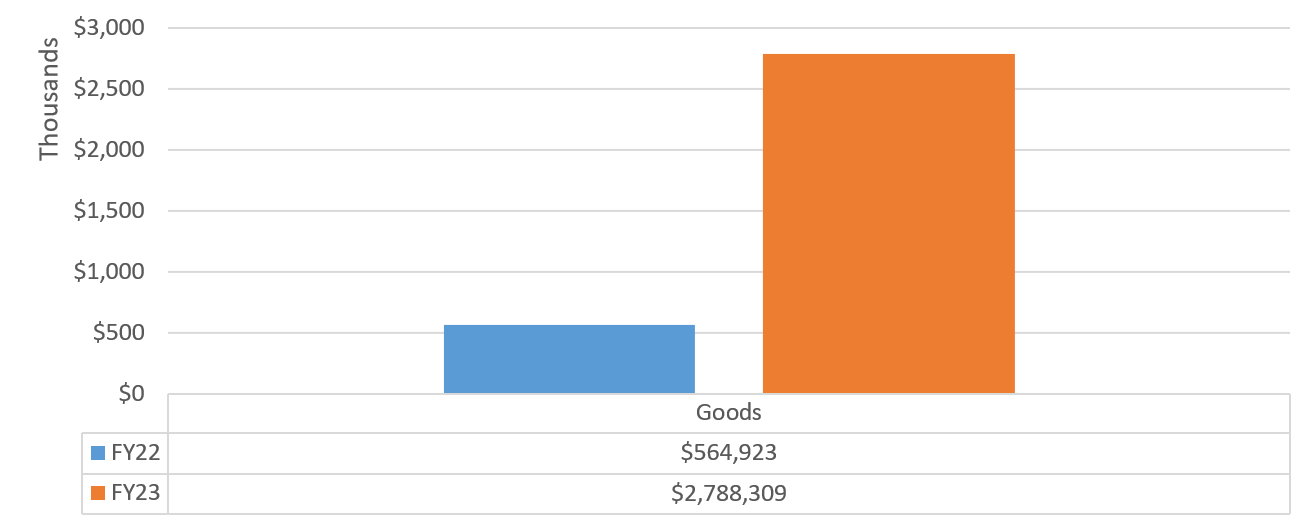
Transit Authority (TRANSIT)
The Transit Authority (Transit) encompasses the Metropolitan Transportation Authority and The New York City Transit Authority. The Transit Authority is a public benefit corporation with board members appointed by NYC and suburban counties.
Table 99 – TRANSIT: FY22-FY23 Registrations by Contract Category
| FY22 | FY23 | |||
|---|---|---|---|---|
| Contract Category | # of Contracts | Total Contract Value | # of Contracts | Total Contract Value |
| Limited or Non-Competitive Method Contracts | 7 | $609,541,740 | 5 | $1,155,658,035 |
| Grand Total | 7 | $609,541,740 | 5 | $1,155,658,035 |
Chart 144 – TRANSIT: FY22-FY23 Volume of Contracts by Industry
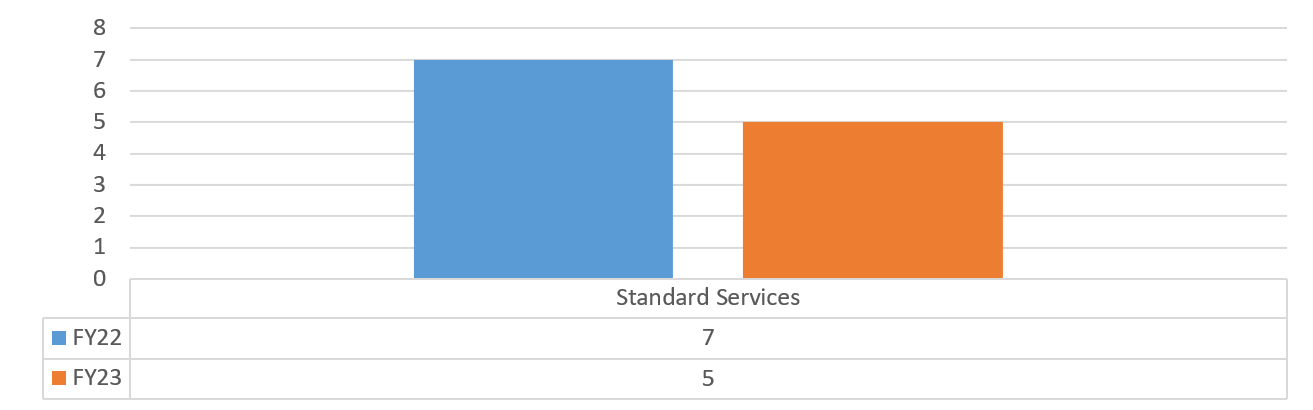
Chart 145 – TRANSIT: FY22-FY23 Value of Contracts by Industry
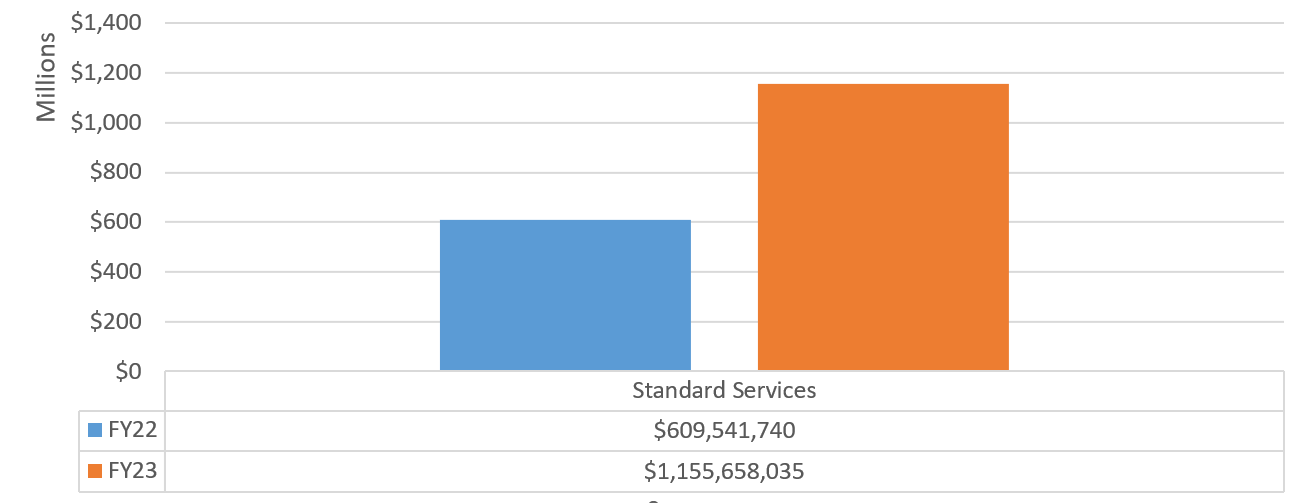
VIII. Retroactive Contract Registrations
The City’s procurement processes continue to result in registration delays that hinder the ability of its vendors, especially human service providers, nonprofits, and M/WBEs, to get paid on time. These vendors often wait half a year or more to get paid for services they have provided on behalf of the City. This causes a tremendous strain on many of these organizations, as they are forced to borrow to cover cash flow or triage their own expenses, and makes it extremely difficult to pay, sustain, and grow their businesses.
The current Mayoral and Comptroller Administrations created the Joint Task Force to Get Non-Profits Paid and the Capital Reform Task Force in 2022 to develop critical reforms needed to address components of contracting systems.[39] Some progress was made initially, including the “Clear the Backlog” initiative in the summer of 2022, an Allowance Amendment Initiative to enable the City to make certain modifications to existing contracts to add an allowance for things like cost of living increases and indirect rate increases or for the performance of additional work without requiring lengthy contract amendments, and an initiative with the City Council to make discretionary award contracts (which, in FY23, only make up 2% of total Human Service contract value, but nearly a quarter of all Human Service contracts) multi-year, which will eliminate red tape and prevent providers from having to complete the entire City procurement process annually.
Unfortunately, some of these reforms have stalled while the impact of others has not yet been felt. Most critically, timeframes and key performance indicators for the procurement and contract process have not been established as promised. The only existing timeline, set by the City Charter, is for the Comptroller’s office, which is obligated to register or return each and every contract within 30 days of receiving it – an obligation the office has met consistently.
To evaluate the scope of this problem, Section VIII of this report measures retroactivity, which is calculated by comparing FMS registration dates against contract start dates. Retroactive contracts are those that are registered after the start date listed in its terms.[40] Our analysis has found that the problem is getting worse, with the percentage of late-registered contracts growing each year since FY22 (Chart 146).
Chart 146: Percent of Late-Registered Contracts by Volume – FY21-24[41]
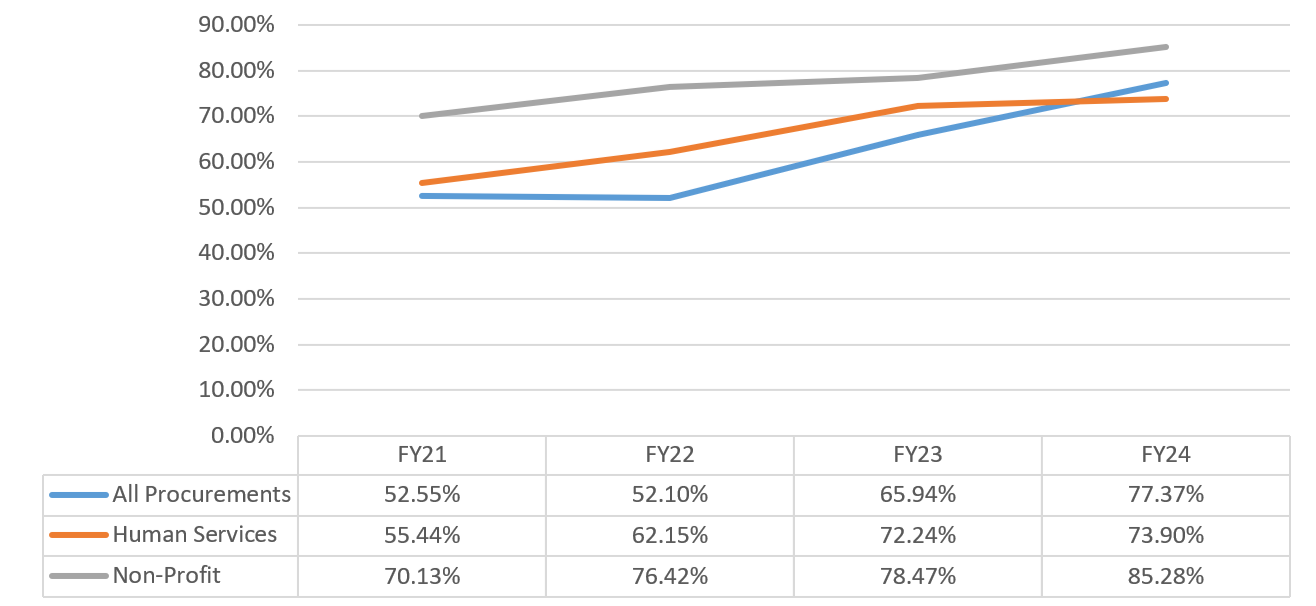
While more contract value was registered timely in FY23 relative to prior years (possibly due in part to the “clear the backlog” initiative), retroactivity rates have been increasing through the first half of FY24.[42] The problem is especially severe for human service providers and non-profit vendors. More than 95% of total contract value for human service and non-profit vendors were registered late in the first half of FY24, a significant increase from prior years (Chart 147).
Chart 147: Percent of Late-Registered Contracts by Value – FY21-24
Year Over Year Procurement Tables
The following tables present a breakdown of retroactivity rates among procurement contracts between FY21-FY23. Tables 100 and 101 layout shares for volume and value respectively for all procurement contracts. Subsequent tables zoom in on trends for the Human Services Industry and among Non-Proft vendors. Finally, Tables 106 and 107 examine how these trends have continued for the first half of FY24.
The data detailed in this Section shows that some of these contracts are registered extremely late. For FY23, more than 27% of contracts with non-profit vendors (1,218 contracts) were registered six months to one year late, and more than 31% (1,388 contracts) were registered more than a year late.
Citywide Procurements
Table 100: Citywide Retroactivity by Volume – FY21-23
| FY21 | FY22 | FY23 | ||||
|---|---|---|---|---|---|---|
| Retroactive Category | # of contracts | % Share of Contracts | # of contracts | % Share of Contracts | # of contracts | % Share of Contracts |
| On Time or Early | 5,518 | 47.45% | 8,443 | 47.90% | 4,304 | 34.06% |
| Late – Within 30 Days | 1,489 | 12.80% | 1,629 | 9.24% | 1,619 | 12.81% |
| Later – Between 31-180 Days | 2,072 | 17.82% | 3,702 | 21.00% | 2,896 | 22.92% |
| Very Late – Between 181-365 Days | 1,425 | 12.25% | 1,933 | 10.97% | 1,878 | 14.86% |
| Latest – More than 1-Year | 1,126 | 9.68% | 1,919 | 10.89% | 1,940 | 15.35% |
| Grand Total | 11,630 | 100.00% | 17,626 | 100.00% | 12,637 | 100.00% |
Table 101: Citywide Retroactivity by Value – FY21-23
| FY21 | FY22 | FY23 | ||||
| Retroactive Category | Total Value | % Share of Total Value | Total Value | % Share of Total Value | Total Value | % Share of Total Value |
| On Time or Early | $5,304,091,256 | 17.50% | $6,550,831,067 | 15.16% | $14,304,882,708 | 37.64% |
| Late – Within 30 Days | $10,750,778,212 | 35.48% | $5,133,933,532 | 11.88% | $4,966,692,098 | 13.07% |
| Later – Between 31-180 Days | $9,890,285,524 | 32.64% | $23,578,265,599 | 54.55% | $11,263,640,333 | 29.64% |
| Very Late – Between 181-365 Days | $2,978,140,493 | 9.83% | $7,075,970,114 | 16.37% | $5,462,586,575 | 14.37% |
| Latest – More than 1-Year | $1,378,932,079 | 4.55% | $882,713,839 | 2.04% | $2,005,339,743 | 5.28% |
| Grand Total | $30,302,227,565 | 100.00% | $43,221,714,152 | 100.00% | $38,003,141,457 | 100.00% |
Human Services Industry Procurements
Table 102: Human Service Contract Retroactivity by Volume – FY21-23
| FY21 | FY22 | FY23 | ||||
| Retroactive Category | # of contracts | % Share of Contracts | # of contracts | % Share of Contracts | # of contracts | % Share of Contracts |
| On Time or Early | 2,295 | 44.56% | 3,532 | 37.84% | 1,645 | 27.75% |
| Late – Within 30 Days | 378 | 7.34% | 510 | 5.46% | 376 | 6.34% |
| Later – Between 31-180 Days | 767 | 14.89% | 2,207 | 23.64% | 930 | 15.69% |
| Very Late – Between 181-365 Days | 863 | 16.76% | 1,446 | 15.49% | 1,315 | 22.19% |
| Latest – More than 1-Year | 847 | 16.45% | 1,639 | 17.56% | 1,661 | 28.02% |
| Grand Total | 5,150 | 100.00% | 9,334 | 100.00% | 5,927 | 100.00% |
Table 103: Human Service Contract Retroactivity by Value – FY21-23
| FY21 | FY22 | FY23 | ||||
|---|---|---|---|---|---|---|
| Retroactive Category | Total Value | % Share of Total Value | Total Value | % Share of Total Value | Total Value | % Share of Total Value |
| On Time or Early | $1,552,355,276 | 9.65% | $1,817,647,579 | 9.51% | $5,378,985,026 | 33.99% |
| Late – Within 30 Days | $7,370,685,364 | 45.82% | $1,594,285,652 | 8.34% | $2,325,040,886 | 14.69% |
| Later – Between 31-180 Days | $6,232,416,584 | 38.75% | $12,338,045,353 | 64.56% | $5,408,446,907 | 34.18% |
| Very Late – Between 181-365 Days | $744,377,771 | 4.63% | $2,784,730,484 | 14.57% | $1,794,763,982 | 11.34% |
| Latest – More than 1-Year | $185,829,163 | 1.16% | $576,880,844 | 3.02% | $916,497,214 | 5.79% |
| Grand Total | $16,085,664,158 | 100.00% | $19,111,589,912 | 100.00% | $15,823,734,014 | 100.00% |
Non-Profit Procurements
Table 104: Non-Profit Contract Retroactivity by Volume – FY21-23
| FY21 | FY22 | FY23 | ||||
|---|---|---|---|---|---|---|
| Retroactive Category | # of contracts | % Share of Contracts | # of contracts | % Share of Contracts | # of contracts | % Share of Contracts |
| On Time or Early | 1,086 | 29.86% | 1,364 | 23.58% | 953 | 21.53% |
| Late – Within 30 Days | 370 | 10.17% | 367 | 6.34% | 305 | 6.89% |
| Later – Between 31-180 Days | 525 | 14.43% | 1,498 | 25.89% | 562 | 12.70% |
| Very Late – Between 181-365 Days | 911 | 25.05% | 1,232 | 21.30% | 1,218 | 27.52% |
| Latest – More than 1-Year | 745 | 20.48% | 1,324 | 22.89% | 1,388 | 31.36% |
| Grand Total | 3,637 | 100.00% | 5,785 | 100.00% | 4,426 | 100.00% |
Table 105: Non-Profit Service Contract Retroactivity by Value – FY21-23
| FY21 | FY22 | FY23 | ||||
|---|---|---|---|---|---|---|
| Retroactive Category | Total Value | % Share of Total Value | Total Value | % Share of Total Value | Total Value | % Share of Total Value |
| On Time or Early | $1,159,822,017 | 7.62% | $1,484,726,916 | 6.58% | $3,768,435,994 | 26.85% |
| Late – Within 30 Days | $7,233,712,173 | 47.55% | $1,167,895,714 | 5.18% | $1,789,959,696 | 12.75% |
| Later – Between 31-180 Days | $4,339,242,680 | 28.52% | $14,218,465,903 | 63.01% | $4,341,974,597 | 30.94% |
| Very Late – Between 181-365 Days | $2,304,782,917 | 15.15% | $5,205,200,588 | 23.07% | $3,434,069,195 | 24.47% |
| Latest – More than 1-Year | $175,984,483 | 1.16% | $488,707,793 | 2.17% | $700,792,743 | 4.99% |
| Grand Total | $15,213,544,270 | 100.00% | $22,564,996,915 | 100.00% | $14,035,232,224 | 100.00% |
First Half of FY24 (July 1, 2023 – December 31, 2023)
Table 106: FY24 Human Services Retroactive Data – Volume and Value
| Retro Category | # of Contracts | % share of contracts | Total Contract Value | % share of contract value |
| On Time or Early | 690 | 26.10% | $392,436,967 | 4.33% |
| Late – Within 30 Days | 652 | 24.66% | $4,452,915,411 | 49.13% |
| Later – Between 31-180 Days | 333 | 12.59% | $3,215,781,610 | 35.48% |
| Very Late – Between 181-365 Days | 64 | 2.42% | $777,367,617 | 8.58% |
| Latest – More than 1-Year | 905 | 34.23% | $225,616,406 | 2.49% |
| Grand Total | 2,644 | 100.00% | $9,064,118,010 | 100.00% |
Table 107: FY24 – Non-Profit Retroactive Data – Volume and Value
| Retro Category | # of Contracts | % share of contracts | Total Contract Value | % share of contract value |
| On Time or Early | 286 | 14.71% | $315,518,038 | 3.45% |
| Late – Within 30 Days | 558 | 28.70% | $4,118,490,573 | 45.00% |
| Later – Between 31-180 Days | 281 | 14.45% | $4,170,538,252 | 45.57% |
| Very Late – Between 181-365 Days | 44 | 2.26% | $343,530,641 | 3.75% |
| Latest – More than 1-Year | 775 | 39.87% | $204,249,350 | 2.23% |
| Grand Total | 1,944 | 100.00% | $9,152,326,854 | 100.00% |
Focus Area – FY23 Retroactivity Trends
The rest of Section VIII takes a deeper dive into retroactivity trends within FY23, which began on July 1, 2022 and concluded on June 30, 2023. The following tables and charts lay out trends for revenue, as well as procurement contracts. Retroactivity rates by industry, agency, M/WBE certification status, and other categories are also captured.
Table 108 displays contract retroactivity for procurement and revenue contracts registered in FY23. 8,467 new procurement and revenue contracts (66.05% of all contracts) were registered retroactively. Notably, the share of contract value that was registered on time exceeded the proportion of timely-registered contracts.
Table 108: FY23 Contract Retroactivity for New Procurements and Revenue Contracts
| Retro Category | # of Contracts | % share of contracts | Total Contract Value | % share of contract value |
| On Time or Early | 4,353 | 33.95% | $14,332,016,001 | 37.50% |
| Late – Within 30 Days | 1,646 | 12.84% | $4,991,536,694 | 13.06% |
| Later – Between 31-180 Days | 2,934 | 22.89% | $11,317,951,913 | 29.61% |
| Very Late – Between 181-365 Days | 1,898 | 14.80% | $5,533,260,950 | 14.48% |
| Latest – More than 1-Year | 1,989 | 15.51% | $2,043,424,274 | 5.35% |
| Grand Total | 12,820 | 100.00% | $38,218,189,832 | 100.00% |
Chart 148 compares the share of retroactive contracts in FY22 and FY23 by both volume and value. While the share of contract value registered on time or early improved from FY22-FY23, more individual contracts were retroactively registered in FY23.
Chart 148: FY22-23 Retroactivity Rates by Volume and Value
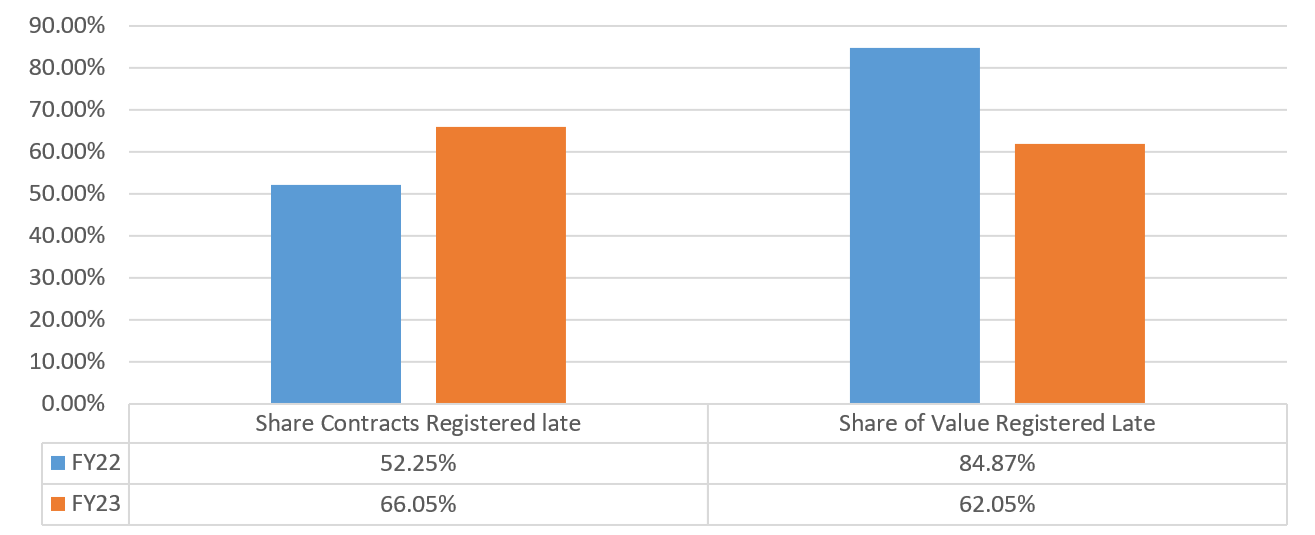
FY23 Retroactive Procurement Contracts
Table 109 below displays retroactivity rates among procurement contracts only. Most of the City’s FY23 procurement value was associated with retroactive contracts, however the share of value registered on-time improved in FY23 relative to last year. Just under two thirds of City procurement contracts were registered late in FY23.
Table 109: FY23 Procurement Contracts by Retroactivity Category
| Retroactive Category | # of Contracts | % Share of Contracts | Total Contract Value | % Share of Contract Value |
| On Time or Early | 4,304 | 34.06% | $14,304,882,708 | 37.64% |
| Late – Within 30 Days | 1,619 | 12.81% | $4,966,692,098 | 13.07% |
| Later – Between 31-180 Days | 2,896 | 22.92% | $11,263,640,333 | 29.64% |
| Very Late – Between 181-365 Days | 1,878 | 14.86% | $5,462,586,575 | 14.37% |
| Latest – More than 1-Year | 1,940 | 15.35% | $2,005,358,743 | 5.28% |
| Grand Total | 12,637 | 100.00% | $38,003,160,457 | 100.00% |
FY23 Retroactive Procurements by Industry
For the Human Services industry, which is overwhelmingly made up of Non-Profit vendors, nearly three quarters of contracts were registered late (72.25%). The Standard Services industry has the highest retroactivity rate overall, with 78.33% of procurement contracts registered late. Chart 149 displays the total number of new procurement contracts by industry. For comparison, table 110 displays the share of contract retroactivity by industry type.
Chart 149: Share of New Retroactive Procurement Contracts by Industry, FY23
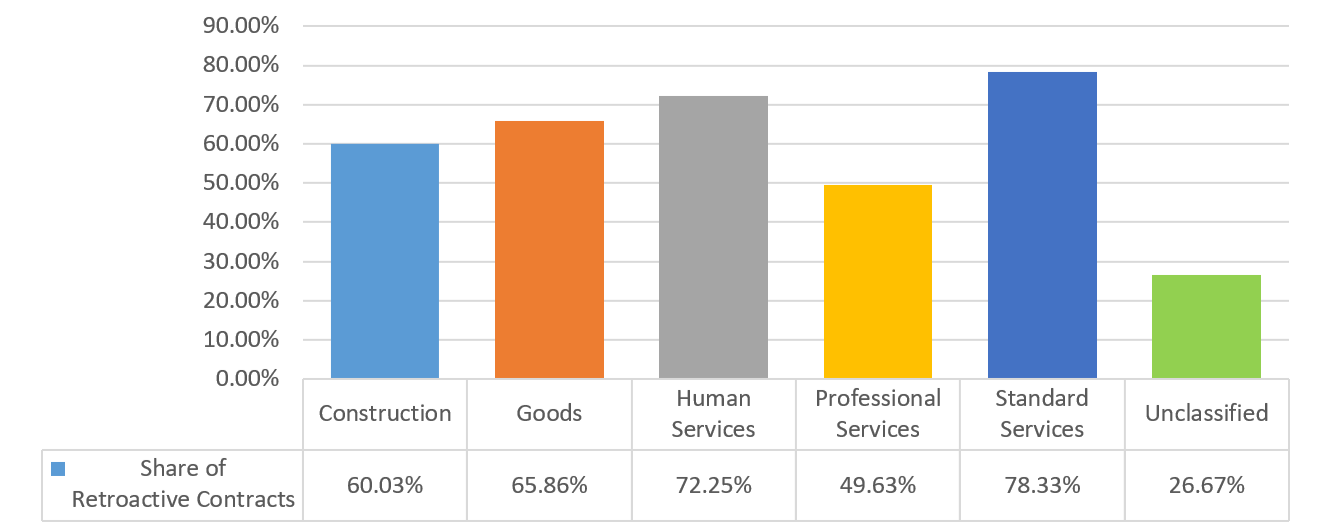
Table 110: Volume of FY23 Procurement Contracts by Retroactivity Category and Industry
| Retroactive Category | Construction Services | Goods | Human Services | Professional Services | Standard Services | Unclassified Contracts |
| On Time or Early | 39.97% | 34.14% | 27.75% | 50.37% | 21.67% | 73.33% |
| Late – Within 30 Days | 14.49% | 27.13% | 6.34% | 11.20% | 18.97% | 7.86% |
| Later – Between 31-180 Days | 32.81% | 32.05% | 15.69% | 25.93% | 32.54% | 15.00% |
| Very Late – Between 181-365 Days | 7.33% | 3.07% | 22.19% | 9.02% | 20.08% | 2.62% |
| Latest – More than 1-Year | 5.41% | 3.61% | 28.02% | 3.47% | 6.75% | 1.19% |
| Grand Total | 100.00% | 100.00% | 100.00% | 100.00% | 100.00% | 100.00% |
Retroactive Procurements by Agency
Table 111 lists the top ten agencies with the most retroactive procurement contracts. Together, these ten agencies account for over 70% of the retroactively contract registrations in the City. While DYCD registered the most retroactive contracts in FY23, the majority of these contracts are related to City Council appropriations, which tend to be delayed. As noted above, this Office has been working with the City Council to make discretionary award contracts multi-year, which will eliminate the need to register them again after the first year.
Table 111: FY23 Top Ten Agencies by Volume of Retroactive Procurement Contracts
| Agency | # of Contracts | Total Contract Value |
| DYCD | 1,486 | $274,578,856 |
| DOHMH | 1,114 | $540,046,275 |
| DOE | 837 | $2,332,728,619 |
| DFTA | 590 | $81,775,127 |
| HRA | 443 | $906,876,155 |
| DCAS | 440 | $1,265,095,704 |
| HPD | 255 | $124,732,808 |
| HHC | 245 | $238,415,102 |
| MAYOR | 242 | $1,369,783,452 |
| ACS | 208 | $381,260,508 |
| Grand Total | 586 | $7,515,292,605 |
FY23 Retroactive Procurements – M/WBEs
By a measure of contract volume, the City registered fewer M/WBE procurement contracts after their start dates (61.26%) than non-M/WBE vendors (67.30%). Table 112 presents a breakdown of M/WBE procurement contracts by category of lateness. For comparison, table 113 presents a breakdown procurement contracts by category of lateness for non-certified vendors.
Table 112: FY23 Procurement Contracts by Retroactivity Category – MWBE Vendors
| Retroactive Category | # of Contracts | % Share of Contracts | Total Contract Value | % Share of Contract Value |
| On Time or Early | 1,110 | 38.73% | $891,021,844 | 44.24% |
| Late – Within 30 Days | 655 | 22.85% | $331,736,207 | 16.47% |
| Later – Between 31-180 Days | 925 | 32.27% | $590,567,782 | 29.32% |
| Very Late – Between 181-365 Days | 126 | 4.40% | $159,695,276 | 7.93% |
| Latest – More than 1-Year | 50 | 1.74% | $41,024,601 | 2.04% |
| Grand Total | 2,866 | 100.00% | $2,014,045,710 | 100.00% |
Table 113: FY23 Procurement Contracts by Retroactivity Category – Non-Certified Vendors
| Retroactive Category | # of Contracts | % Share of Contracts | Total Contract Value | % Share of Contract Value |
| On Time or Early | 3,201 | 32.70% | $13,414,035,864 | 37.26% |
| Late – Within 30 Days | 966 | 9.87% | $4,635,000,891 | 12.88% |
| Later – Between 31-180 Days | 1,979 | 20.21% | $10,681,575,763 | 29.67% |
| Very Late – Between 181-365 Days | 1,752 | 17.90% | $5,302,891,299 | 14.73% |
| Latest – More than 1-Year | 1,892 | 19.33% | $1,964,728,602 | 5.46% |
| Grand Total | 9,790 | 100.00% | $35,998,232,419 | 100.00% |
The largest share of M/WBE procurement contracts were registered via the M/WBE Noncompetitive Small Purchase (NCSP) method (36.53%). This method was designed to reduce delays in the contracting process by allowing agencies to contract with City-certified M/WBE vendors for up to $1.5 million without competition. However, the large majority of contracts registered via the M/WBE NCSP method were registered late. Table 114 displays the breakdown of M/WBE non-competitive small purchase contracts by retroactive category.
Table 114: FY23 M/WBE Non-Competitive Small Purchase Contracts by Retroactivity Category
| Retroactive Category | # of Contracts | % Share of Contracts | Total Contract Value | % Share of Contract Value |
| On Time or Early | 314 | 30.13% | $56,981,117 | 29.44% |
| Late – Within 30 Days | 320 | 30.71% | $56,108,648 | 28.99% |
| Later – Between 31-180 Days | 359 | 34.45% | $71,551,726 | 36.97% |
| Very Late – Between 181-365 Days | 38 | 3.65% | $7,239,413 | 3.74% |
| Latest – More than 1-Year | 11 | 1.06% | $1,683,132 | 0.87% |
| Grand Total | 1,042[43] | 100.00% | $193,564,035 | 100.00% |
FY23 Retroactive Revenue Contracts
The majority of revenue contract value (88.55%) was registered on time, or within 30 days of the contract start date. This is significantly higher than the 50.71% share procurement value registered within the same time frame. Table 115 below breaks down revenue contracts by retroactivity category.
Table 115: FY23 Revenue Contracts by Retroactivity Category[44]
| Retroactive Category | # of Contracts | % Share of Contracts | Total Contract Value | % Share of Contract Value |
| On Time or Early | 48 | 29.27% | $20,849,294 | 40.40% |
| Late – Within 30 Days | 27 | 16.46% | $24,844,595 | 48.15% |
| Later – Between 31-180 Days | 33 | 20.12% | $769,379 | 1.49% |
| Very Late – Between 181-365 Days | 13 | 7.93% | $713,375 | 1.38% |
| Latest – More than 1-Year | 43 | 26.22% | $4,425,418 | 8.58% |
| Grand Total | 164 | 100.00% | $51,602,061 | 100.00% |
FY23 Retroactive Real Property Transactions
The largest group within Real Property Transactions are Lease Agreements with private landlords, which allows the City to secure the use of property for agency business or as a means to facilitate other public services. Leases must be registered in order for building owners to be paid and to secure terms for needed construction or renovation projects. Accordingly, delays in the registration of Lease Agreements can negatively impact spaces utilized by City services, including day care and senior care programs, that are run out of city-leased buildings. While the share of real property transactions registered on time improved modestly in FY23 relative to last year, most are still being registered between 1-6 months late.
Table 116: FY23 Real Property Contracts by Retroactivity Category
| Retroactive Category | # of Contracts | % Share of Contracts | Total Contract Value | % Share of Contract Value |
| On Time or Early | 10 | 10.20% | $13,088,286 | 2.00% |
| Late – Within 30 Days | 6 | 6.12% | $149,413,952 | 22.79% |
| Later – Between 31-180 Days | 45 | 45.92% | $377,318,018 | 57.54% |
| Very Late – Between 181-365 Days | 25 | 25.51% | $96,031,779 | 14.64% |
| Latest – More than 1-Year | 12 | 12.24% | $19,880,709 | 3.03% |
| Grand Total | 98 | 100.00% | $655,732,744 | 100.00% |
FY23 Retroactive Task Orders[45]
TO are used by agencies to procure particular goods or services from one or more vendors under terms that have already been established under an existing Multiple Master Agreement contract. While this structure should allow City agencies to process TOs more quickly than new contracts, over 81% were registered retroactively in FY23. Table 117 provides a breakdown of TOs by retroactivity category.
Table 117: FY23 Registered TOs by Retroactivity Category
| Retroactive Category | # of Contracts | % Share of Contracts | Total Contract Value | % Share of Contract Value |
| On Time or Early | 222 | 18.86% | $265,104,564 | 18.11% |
| Late – Within 30 Days | 213 | 18.10% | $194,054,249 | 13.26% |
| Later – Between 31-180 Days | 292 | 24.81% | $364,936,635 | 24.93% |
| Very Late – Between 181-365 Days | 117 | 9.94% | $84,304,899 | 5.76% |
| Latest – More than 1-Year | 333 | 28.29% | $555,483,782 | 37.95% |
| Grand Total | 1,177 | 100.00% | $1,463,884,130 | 100.00% |
IX. Bureau of Labor Law – Living and Prevailing Wage Cases
The Comptroller is required to submit annual reports to the Mayor and to City Council summarizing and assessing the implementation and enforcement of sections 6-109, 6-130, and 6-145 of the Administrative Code which require that:
- Contractors and subcontractors on City service contracts providing homecare services, day care services, head start services or services to persons with cerebral palsy pay their covered employees at the living wage rate and either provide health benefits or supplement the hourly wage rate by $1.50; and
- City service contractors and subcontractors providing building services, food services or temporary office services pay their covered employees at the prevailing wage and supplement rates set annually by the City Comptroller, or at the living wage rate, whichever is greater.[46]
- Human service vendors doing business with NYC above small purchase limits are required to submit an attestation or certification, relating to labor peace agreements (LPA) with labor organizations, as a condition for a new contract award or renewal. LPAs are agreements between employers and labor organizations that are designed to ensure the uninterrupted flow of goods and services.
The required reporting information is presented for below.
Section 6-109 of the Admin Code:
In FY 2023, as of 7/1/22, the Bureau of Labor Law (BLL) had three pending cases under §6-109 of the Admin Code. BLL also opened three new cases. BLL closed two cases.
Section 6-130 of the Admin Code:
In FY 2023, BLL closed two of three pending cases under §6-130 of the Admin Code involving building services.
Section 6-145 of the Admin Code:
In FY 2023, the Comptroller’s Office created a process whereby parties could submit complaints for violations of Section 6-145. BLL opened one investigation under §6-145 of the Administrative Code involving Labor Peace Agreements.
X. Glossary of Terms
Accelerated Procurement: An accelerated procurement is a procurement of commodities that is required to be made quickly due to markets experiencing significant shortages and/or short-term price fluctuations. Such markets must be identified by specific rule of the PPB. Accelerated procurement shall only be authorized when the CCPO determines those specific commodities subject to accelerated procurement, i.e., chemicals, energy, food, etc. (9 RCNY § 3-07).
ACCO: An acronym that stands for Agency Chief Contracting Officer. Position delegated authority by the Agency Head to organize and supervise the procurement activity of subordinate agency staff in conjunction with the CCPO. (9 RCNY § 1-01 (e)).
Agency Head: A term referring to heads of City, country, borough, or other office, administration, department, division, bureau, board, or commission, or a corporation, institution or agency of government, the expenses of which are paid in whole or in part from the City treasury. (9 RCNY § 1-01 (e)).
Amendment: Modification or adjustments made to an existing contract. (9 RCNY § 4-02).
Amendment Extension: A contract amendment that allows for an extension of a contract term for good and sufficient cause for a cumulative period not to exceed one year from the date of expiration of the current contract. (9 RCNY § 4-02(b)(iii)).
Buy-Against: The process by which, as part of contract administration, an agency obtains goods and services to fulfill its requirements after a vendor defaults or fails to fulfill its contract responsibilities. (9 RCNY § 1-01(e)).
Capital Project (budget, or funding): Capital projects or contracts are funded with monies from the Capital budget typically for the purposes of funding physical infrastructure. Capital projects are at least $35,000 and have a life of five years.
Change Order: Any alteration, change, amendment, or modification to any contract or agreement approved as required by law or rule. (9 RCNY § 1-01(e)).
CCPO: An acronym that stands for City Chief Procurement Officer. Position delegated authority by the Mayor to coordinate and oversee the procurement activity of Mayoral agency staff, including the ACCOs. (9 RCNY § 1-01(e)).
Charter: The New York City Charter. (9 RCNY § 1-01(e)).
City: City of New York. (9 RCNY § 1-01(e)).
Competitive Sealed Bidding (CSB): The source selection method in which sealed bids are publicly solicited and opened and a contract is awarded to the lowest responsive, responsible bidder. (9 RCNY § 1-01(e)).
Competitive Sealed Proposals (CSP): The source selection method in which a solicitation is made to potential vendors, and between receipt of proposals and award, discussions with vendors may take place to resolve uncertainties in the proposal, advise vendors of deficiencies in meeting the agency’s requirements, allow for resulting price changes, etc. (9 RCNY § 1-01(e)).
Concession: A grant made by an agency for the private use of City-owned property for which the City receives compensation other than in the form of a fee to cover administrative costs, except that concessions shall not include franchises, revocable consents and leases. (NYC Charter § 362(a)).
Construction: The process of constructing, reconstructing, demolishing, excavating, renovating, altering, improving, rehabilitating, or repairing any building, facility, or physical structure of any kind, excluding the performance of routine maintenance. (9 RCNY § 1-01(e)).
Construction Management Contract: A form of construction contract that provides the vendor is to furnish management and supervisory services necessary for the construction of facilities that may also include construction services and the ability to award the underlying construction contract. (9 RCNY § 1-01(e)).
Construction-Related Services: Those services that may reasonably be required in the planning, design, or construction of real property or other public improvements. Such services shall include, but not be limited to, engineering, construction supervision, construction management, testing and investigation. (9 RCNY § 1-01(e)).
Contract: A written agreement between the City and a vendor in an amount generally in excess of the small purchase limits that gives rise to obligations that are enforced and recognized by law. (9 RCNY § 1-01(e)).
Contractor: Any person having a contract with a governmental body. (9 RCNY § 1-01(e)).
Cost Analysis: The process of examining the reasonableness of a vendor’s price by evaluation of the separate cost elements and proposed profit in part on the basis of cost data supplied and certified by the vendor. Cost analysis is used on contract actions (including change orders) where price cannot be determined as fair and reasonable by using price analysis alone. (9 RCNY § 1-01(e)).
Demonstration Project: A short-term, carefully planned, pilot exercise designed to test and evaluate the feasibility and application of an innovative product, approach or technology not currently used by the City. Demonstration projects may be proposed for goods, services or construction. They allow the City to observe and analyze effectiveness and efficiency without a large commitment of resources. (9 RCNY § 3-11(a)).
Emergency: An unforeseen danger to life, safety, property, or a necessary service. (9 RCNY § 1-01(e)).
Emergency Procurement: Method of procurement for goods when there is an unforeseen danger to life, safety, property, or a necessary service, the existence of which creates an immediate and serious need for goods, services, or construction that cannot be met through normal procurement methods. (9 RCNY § 3-06(a)).
Emerging Business Enterprise (EBE): A business enterprise authorized to do business in this state, including sole proprietorships, partnerships and corporations, in which such individuals have demonstrated that they are socially and economically disadvantaged. (NYC Charter § 1304 (6)(c)).
Encumbrance: An action to set aside or reserve all, or a portion, of an appropriation of funds for the payment of future expenses such as payments for the receipt of goods, services or construction pursuant to a contract or agreement. (NYS Office of the State Comptroller Guide to Financial Operations Chapter XI.2.C.).
Expense Contract (budget, or funding): An expense contract is sourced with funding from the expense budget that has the explicit function of funding present City operations.
Fiscal Year: Unless otherwise indicated, the word “year” as it related to terms of contracts shall mean the City’s fiscal year. (9 RCNY § 1-01(e)). For the purpose of this Report, the fiscal year covered is Fiscal Year 2022which runs from July 1, 2021 through June 30, 2022.
FMS: An acronym stands for Financial Management System. (9 RCNY § 1-01(e)).
Franchise: A grant by an agency of a right to occupy or use the inalienable property of the City to provide a public service. (NYC § 362(b)).
Franchise and Concession Review Committee (FCRC): The FCRC consists of six members: the Mayor who serves as chair, the director of the Office of Management and Budget (OMB), the Corporation Counsel, the Comptroller and one additional appointee of the Mayor. The FCRC is primarily responsible for the establishment of rules for the granting of concessions to ensure a competitive and fair process. Each member of the FCRC is entitled to one vote, with the exception of the borough president who collectively share a single vote. Franchises require at least five votes to be approved whereas applicable concession awards typically require four votes. (NYC Charter § 373).
Goods: All personal property, including but not limited to equipment, materials, printing, and insurance, excluding land or a permanent interest in land. (9 RCNY § 1-01(e)).
Government-to-Government Procurement: Purchases made when it is in the City’s best interest to procure from another governmental entity goods, services, construction, or construction-related services where the accepted price, terms and conditions are achieved through negotiation between the agency and the governmental entity. (9 RCNY § 3-13(a)).
Grant: A cash transfer made by a government entity to another government entity, a quasi-public entity, a private organization, or an individual, for use by the recipient in accomplishing objectives established by the recipient. A grant is permissible only to accomplish a public purpose authorized by federal, state, or City law. A grant may be conditional, although awarded without other consideration. Federal and state grants are identified specifically by formula or specific allocations in law or in the annual operating budget act, bond authorizations, or other acts of Congress or the state legislature. Grants can be distinguished from procurement contacts, which call for the vendor to produce specific end products or to deliver specific goods or services. While there are requirements under a grant that result in an executed agreement between the grantor and grantee, this document is not a contract for services. (9 RCNY § 1-01(e)).
HHS (Health and Human Services) Accelerator: HHS Accelerator is an office that facilities the central management of the procurement process for client services vendors and contractual by creating and maintaining a web-based document vault for client services vendors; creating and maintaining a centralized, electronic and web accessible categorization system of services provided for all City agencies; prequalifying client services providers; and managing procurements for client services. (9 RCNY § 1-01(e)).
Human/Client Services: Programs contracted for by the City of New York on behalf of third-party clients, including programs to provide social services, health or medical services, housing and shelter assistance services, legal services, employment assistance services, and vocational, educational, or recreational programs. Agencies whose mission involves the award and administration of such contracts, or provisions of the same or similar services by agency staff are sometimes known as “Human Services agencies.” Examples of human services include but are not limited to: day care, foster care, mental health treatment, operation of senior centers, home care, employment training, homeless assistance, preventive services, health maintenance organizations, and youth services. (9 RCNY § 1-01(e)).
IFB: An acronym that stands for Invitation for Bids. (9 RCNY § 1-01(e)).
Information Technology: Systems or components thereof including, but not limited to, hardware, software, firmware, and telecommunications that integrate and process data; and services including, but not limited to, planning, consulting, project managing, developing requirements definitions, analyzing, designing, programming, testing, training, implementing, as well as conversion capacity management and quality assurance for the purpose of using, creating, maintaining, operating, or repairing computer systems or networks or computer systems or components thereof. (9 RCNY § 1-01(e)).
Innovative Procurement: Prospective procurement method that tests and evaluates the feasibility and application of procurement methods not currently used by the City or provided for under the PPB rules. (9 RCNY § 3-12 (a)).
Intergovernmental Purchase: The issuance of a purchase order or contract to procure goods, services, or construction through the United States General Services Administration, any other federal agency, the New York State Office of General Services, any other state agency or in cooperation with another public agency subject to the rules set forth under the PPB rules. (9 RCNY § 1-01(e)).
Investigative or Confidential Services: Services provided by law enforcement, scientific, and/or legal consultants, or other experts or professionals that are necessary in connection with an official matter within the scope of the acquiring agency’s authority and that directly or indirectly relate to a pending or contemplated case, trial, litigation, or confidential or sensitive investigation or negotiation for which such services of the nature and kind envisioned herein are ordinarily used. (9 RCNY § 1-01(e)).
Line-Item Appropriation: Method of procurement in which contract awards are made from line items appropriations and/or discretionary funds to community-based not-for-profit organizations or other public service organizations identified by elected City officials other than the Mayor and the Comptroller. Public officials that are able to designate awards for discretionary funding include the Public Advocate, individual members of the City Council, the City Council Speaker, and the Borough Presidents. These contract awards are typically designated by an elected official and are then administered and processed by a Mayoral agency. (9 RCNY § 1-02(e)).
Master Service Agreement: A Master Agreement (or Multiple Award Task Order Contract) may be awarded for standard services or multiple award purchase order contracts for goods upon a determination by the ACCO that it is in the best interest of the City to award multiple contracts for goods or standard services to multiple contractors and to allocate work among such contractors through a task order or purchase order system. Master Service Agreements can be awarded through either CSBs or CSPs. Once a master contract is set up, individual task orders are issued for the specific amount of the goods and or services. Task orders are typically assigned by rotation though they can also be awarded through a mini-bid or competition. These types of contracts (typically for standard services) are commonly set up by DCAS and can be utilized by other City agencies. (9 RCNY §§ 3-02(t), (j)).
Micropurchases: Procurements of which the value is $20,000 or less where no competition is required except that in making purchases below the limit, contracting officers shall ensure that the noncompetitive price is reasonable and that purchases are distributed appropriately among responsible vendors, including M/WBE vendors. (9 RCNY§ 3-08(c)(1)(ii)).
M/WBE: An acronym that stands for Minority and/or Women-owned Business Enterprise; a business authorized to do business in the state, including sole proprietorships, partnerships, and corporations, in which (i) at least fifty-one percent of the ownership interest is held by United States citizens or permanent resident aliens who are (a) either minority group members or (b) women, (ii) the ownership interest of such person is real, substantial, and continuing, and (iii) such persons have and exercise the authority to control independently the day to day business decisions of the enterprise. (9 RCNY § 1-01(e)).
Negotiated Acquisition: A method of source selection under which procurements can be made through negotiation due to circumstances and subject to conditions, as specified in these rules, in which it is not practicable and/or advantageous to the City to make the procurement through competitive sealed bidding or competitive sealed proposals. The use of negotiated acquisition requires CCPO approval. (9 RCNY § 1-01(e)).
Negotiated Acquisition Extension: A form of contract extension in which an existing contract regardless of the original procurement method, can be extended one or more times beyond the now permissible cumulative twelve-month limit, provided that the vendor’s performance is satisfactory or that any deficiencies have been or are addressed or are effectively addressed through a corrective action plan, and the extension(s) is for the minimum time necessary to meet the need. (9 RCNY § 3-04(b)(2)(iii)).
PASSPort: A computerized Citywide system providing new comprehensive contract management information and historical data migrated from VENDEX.
Person: Any business, individual, partnership, corporation, union, firm, company, committee, club, other organization, governmental body, or group of individuals. (9 RCNY § 1-01(e)).
Prequalification: The screening of potential vendors in which a purchaser may consider factors such as financial capability, reputation, and management in order to develop a list of prospective vendors qualified to be sent invitations to bid or requests for proposals. (9 RCNY § 1-01(e)).
Procurement: Buying, purchasing, renting, leasing, or otherwise acquiring any goods, services, or construction. It also includes all functions that pertain to the obtaining of any good, service, or construction, including planning, description of requirements, solicitation and selection of sources, preparation and award of contract, and all phases of contract administration, including receipt and acceptance, evaluation of performance, and final payment. (9 RCNY § 1-01(e)).
Procurement Policy Board (PPB): The PPB is the governing entity responsible for the promulgation of the City’s procurement rules. Members of the PPB set forth rules that include but are not limited to: the use of different types of procurements, how bids and proposals may be solicited, the award and administration of contracts and the resolving of contract disputes. The PPB consists of five members, three of whom are appointed by the Mayor and two of whom are appointed by the Comptroller. The PPB is required to assess and review its rules, policies and procedures annually and report to the Mayor, Comptroller and City Council on recommendations to make procurement more efficient. (NYC Charter § 311).
Professional Services: Services other than human/client services that require specialized skills and the exercise of judgment, including but not limited to: (i) accountants, (ii) lawyers, (iii) doctors, (iv) computer programmers and consultants, (v) architectural and engineering services, and (vi) construction management services. (9 RCNY §1-01(e)).
Proposer: A person submitting a proposal in response to a Request for Proposal. (9 RCNY § 1-01(e)).
Protest: A complaint about a governmental action or decision concerning procurement brought by an interested party to the appropriate administrative section with the intention of achieving a remedial result. (9 RCNY § 1-01(e)).
Purchase Order: An official document of the City directing the vendor to perform. A purchase order formalizes a purchase transaction with a vendor for purchases generally at or below the small purchase limits unless the purchase order is placed against an existing contract. (9 RCNY § 1-01(e)).
Registration: The process through which the Comptroller (1) encumbers funds to insure that monies are available to pay vendors upon the satisfactory completion of contract work; (2) maintains a registry of City contracts and agreements; (3) presents objections, if, in the Comptroller’s judgment, there is sufficient reason to believe that there is possible corruption in the letting of the contract or that the proposed contractor is involved in corrupt activity, and (4) tracks City expenditures and revenues associated with those contracts and agreements. No contract or agreement (including agreements memorializing the terms of franchises, revocable consents or concession) will be executed pursuant to the NYC City Charter or other law shall be implemented until (1) a copy has been filed with the comptroller and (2) either the comptroller has registered it or thirty days have elapsed from the date of filing, whichever is sooner. Registration authority for contracts, franchises and concessions are derived from the NYC City Charter. (9 RCNY § 1-01(e); NYC City Charter §§ 328, 375).
Renewals: Re-registration of previous contracts with the same vendor, with substantially unchanged terms and conditions, but possibly revised quantities, lists or schedules or items to be supplied. (9 RCNY §4-04(a)).
Required Method/Preferred Source: Method of procurement in which the PPB rules do not apply to procurements to the extent that a source of funds outside the City of New York, a Federal or State statute or rule, the terms of a court order or consent decree, or other applicable law expressly authorizes or requires otherwise. (9 RCNY § 1-02 (d)(1)).
Required Authorized Source: Method of procurement in which the source selection requirements of the PPB rules do not apply to procurements where a source of funds outside the City of New York, a Federal or State statute or rule, the terms of a court order or consent decree, or other applicable law expressly authorizes or requires that a procurement be made from a specified source. (9 RCNY § 1-02 (d)(2)).
Requirement Contract: Contract for standard services or multiple award purchase order contracts for goods that are awarded when it is determined by the ACCO that it is in the best interests of the City to award multiple contracts for goods or standard services to multiple contractors and to allocate work among such contractors through a task order or purchase order system. (9 RCNY § 3-02(t)(1)).
Responsible Bidder or Proposer: A vendor who has the capability in all respects to perform in full the contract requirements, and the business integrity and reliability that will assure good faith performance. (9 RCNY § 1-01(e)).
Responsive Bidder or Proposer: A vendor whose bid or proposal conforms to the terms set out by the City in the solicitation. (9 RCNY § 1-01(e)).
Revocable Consent: A grant of a right, revocable at will, (1) to any person to construct and use for private use pipes, conduits and tunnels under, railroad tracks upon, and connecting bridges over inalienable property, (2) to an owner of real property or, with the consent of the owner, to a tenant of real property to use adjacent inalienable property, or (3) to a public service corporation for facilities ancillary to, but not within a franchise granted prior to July 1, 1990. (NYC Charter § 362 (d)).
RFP: An acronym that stands for Request for Proposals. All documents, whether attached or incorporated by reference, used for soliciting competitive proposals. (9 RCNY § 1-01(e)).
Service Contract: A contract that calls for a vendor’s time and effort rather than for delivery of goods and construction. The term as defined here does not include employment agreements or collective bargaining agreements. (9 RCNY § 1-01(e)).
Small Purchases: Any procurement at or below the small purchase limit. The small purchase limit is currently set as $100,000. (9 RCNY §§ 1-01(e), 3-08(a)).
Sole Source: An award of a contract for a good, service, or construction to the only source for the required good, service, or construction. (9 RCNY § 1-01(e)).
Special Case: A situation in which it is either not practicable or not advantageous to the City to use competitive sealed bidding as defined in § 312 of the NYC Charter. (9 RCNY § 1-01(e)).
Solicitation: The process of notifying prospective vendors that a governmental body wishes to receive bids or proposals for furnishing goods, services, or construction. The process may consist of public advertising, mailing invitations for bids or requests for proposals, posting notices, telephone or facsimile messages to prospective vendors, or all of these. (9 RCNY § 1-01(e)).
Subscription: A method of transaction in which there is a subscription or continuing need to renew including electronic subscriptions, for magazines and periodicals, orders for books and “off-the-shelf” training videotapes, and attendance at standard commercially available training seminars. (9 RCNY § 1-02(f)(5)).
Standard Services: Services other than professional services and human/client services such as custodial services, security guard services, stenography services and office machine repair. (9 RCNY § 1-01(e)).
Task Order: An agreement that defines the requested scope of work and price under the parameters issued via a master services contract. (9 RCNY § 3-02(t)).
Vendor: An actual or potential contractor. (9 RCNY § 1-01(e)).
XI. Appendices
Appendix 1 – Registered Contracts by Group, Industry, Agency Type, and Retroactivity Category[47]
Appendix 2 – Registered Modifications[48]
Appendix 3 – Real Property Transactions
Appendix 4 – Registered Task Orders
Appendix 7 – New Contract Categories with Corresponding Award Method and Contract Type Codes
| Contract Groups | Award Methods | Award Method Codes |
| Group 1: Competitive Method Contracts | Competitive Sealed Bid Contracts | 1, 3 |
| Competitive Sealed Proposal Contracts | 2, 22 | |
| Accelerated Procurement Contracts | 27 | |
| Group 2: Limited or Non-Competitive Method Contracts | Buy-Against Procurement Contracts | 28 |
| Demonstration Project Contracts | 23 | |
| Determined by Government Mandate Contracts | 26 | |
| Discretionary (Line Item) Contracts | 12, 38 | |
| Emergency Procurement Contracts | 6 | |
| Government-to-Government Contracts | 17, 103 | |
| Innovative Procurement Contracts | 20 | |
| Intergovernmental Procurement Contracts | 25, 62, 251 | |
| Micropurchase Contracts | 30 | |
| Negotiated Acquisition Contracts | 21, 211 | |
| Small Purchase Contracts – General | 31, 32, 35, 36, 37, 45, 60, 109, 100, 101 111, 112, 113 | |
| Small Purchase Contracts – M/WBE | 72 | |
| Sole Source Contracts | 5, 40 | |
| Group 3: Transactions not subject to PPB Rules | Force Account Contracts | 68 |
| Grant Agreements | 51 | |
| Miscellaneous Contracts | 18, 99 | |
| Professional Membership Negotiation Contracts | 42 | |
| Regulated by Government Commission | 41, 44 | |
| Subscription Contracts | 43 | |
| Group 4: Supplemental Contracts | Renewals | 10 |
| Assignments | 29 | |
| Group 5: Revenue Contracts[49] | Franchise Agreements | CT – 15 |
| Concession Agreements | CT – 20 | |
| Revocable Consents | CT – 17 | |
| Corpus Funded agreements | CT – 25 | |
| Other Revenue | CTs – 10, 18, 29, 50 |
Appendix 8 – Award Method Codes
| Award Method Code | FMS Award Method Description |
| 1 | COMPETITIVE SEALED BIDDING |
| 2 | REQUEST FOR PROPOSAL (RFP) |
| 3 | PQVL COMPETITVE BID LIST |
| 5 | SOLE SOURCE |
| 6 | EMERGENCY |
| 7 | LESSEE NEGOTIATION |
| 10 | RENEWAL OF CONTRACT |
| 12 | BORO NEEDS/DISCRETIONARY FUND |
| 13 | PETITION PRIVATE USE/FRANCHISE |
| 14 | CONCESSIONAIRE BY PROCEDURE |
| 15 | RENEWAL FRANCHISE/CONCESSION |
| 17 | GOVERNMENT TO GOVERNMENT |
| 18 | NON PROCUREMENT TRANSACTION |
| 20 | INNOVATIVE PROCUREMENT |
| 21 | NEGOTIATED ACQUISITION AND DOE NEGOTIATED SERVICES |
| 22 | RFP FROM A PQVL |
| 23 | DEMONSTRATION PROJECT |
| 25 | INTERGOVERNMENTAL PROCUREMENT |
| 26 | DETERMINED BY GOV’T MANDATE |
| 27 | ACCELERATED PROCUREMENT |
| 28 | BUY-AGAINST |
| 29 | ASSIGNMENT |
| 30 | MICROPURCHASE – NOT EXCEEDING $35,000 |
| 31 | SMALL PURCHASE – ORAL SOLICITA |
| 32 | Small Purchase – Written |
| 35 | Small Purchase – Publicly Let |
| 36 | Small Purchase – RFP |
| 37 | Small Purchase – PQVL Comp Bid |
| 38 | Micropurchase Council & BP Needs |
| 40 | Dept Of Ed Listing Application |
| 41 | Cable Service Negotiation |
| 42 | Prof. Membership Negotiation |
| 43 | Subscription Etc Per PPB |
| 44 | Public Utility |
| 45 | Small Purchase-Public Utility |
| 51 | Grants |
| 62 | Small Purchase – Intergov’t |
| 68 | Force Account Negotiation |
| 72 | M/WBE Purchase-Not Exceeding $1m |
| 78 | Real Estate Sales And Purchases |
| 79 | Watershed Land Negotiation |
| 99 | Miscellaneous |
| 100 | Small Purch -Subscription Etc |
| 101 | Sm. Purchase -Prof. Membership |
| 103 | Sm. Purchase – Gov’t To Gov’t |
| 109 | Small Purchase – Info Tech |
| 111 | Small Purch – It- 25 K To 100k |
| 112 | Sm Purch Goods Services 100k |
| 113 | Sm Purch Constr – 50k To 100k |
| 211 | Neg Acquisitsion Extn And DOE Negotiated Services Extn |
| 251 | Intergovernmental Procurement Renewal |
Appendix 9– Contract Type Codes
| Contract Type Code | Contract Type Description |
| 5 | Construction |
| 10 | Consultant |
| 15 | Franchises |
| 17 | Revocable Consents |
| 18 | Permits |
| 20 | Concessions |
| 25 | Corpus Funded |
| 29 | Other Expense Contr Or Revenue Relatd |
| 30 | Misc Revenue-No Expense |
| 35 | Lessee |
| 36 | Miscellaneous Property Rental |
| 40 | Lessor – Accounting Lines Exist |
| 41 | Cable Service |
| 42 | Professional Membership |
| 43 | Subscriptions |
| 44 | Public Utility |
| 45 | Requirements |
| 46 | Requirements-Goods |
| 47 | Requirements-Services |
| 48 | Requirements-Construction |
| 50 | Work/Labor |
| 51 | Supplies/Materials/Equipment |
| 52 | Construction Mgmt/Build |
| 53 | Design Build |
| 65 | Loans |
| 68 | Force Account Agreement |
| 70 | Programs |
| 72 | Programs (Not Tax Levy Funded) |
| 78 | Real Estate Sales And Purchases |
| 79 | Watershed Land Acquisition |
| 80 | OTI-Requirements Contract (RC) |
| 81 | DMS-Requirements Contract (RC) |
| 85 | Intra-Agency Fund Agreements |
| 86 | Dept Of Ed-Requirement Contract |
| 88 | New York City Bond Financing |
| 99 | Others |
Appendix 10 – Agency Codes
| Agency Code | Agency | Agency Short Name | Agency Type |
| 2 | Mayoralty | MAYOR | City – Mayoral Agency |
| 3 | Board of Elections | BOE | City – Non-Mayoral |
| 4 | Campaign Finance Board | CFB | City – Non-Mayoral |
| 8 | Office of the Actuary | OTA | City – Non-Mayoral |
| 10 | Borough President – Manhattan | MBP | City – Non-Mayoral |
| 11 | Borough President – Bronx | BXBP | City – Non-Mayoral |
| 12 | Borough President – Brooklyn | BKBP | City – Non-Mayoral |
| 13 | Borough President – Queens | QBP | City – Non-Mayoral |
| 14 | Borough President – Staten Island | SIBP | City – Non-Mayoral |
| 15 | Office of The Comptroller | COMP | City – Non-Mayoral |
| 17 | New York City Emergency Management | NYCEM | City – Mayoral Agency |
| 25 | Law Department | LAW | City – Mayoral Agency |
| 30 | Department of City Planning | DCP | City – Mayoral Agency |
| 32 | Department of Investigation | DOI | City – Mayoral Agency |
| 35 | New York City Research Libraries | NYRL | Other Agency |
| 38 | Brooklyn Public Library | BPL | Other Agency |
| 39 | Queens Borough Public Library | QBPL | Other Agency |
| 40 | Department of Education | DOE | Other Agency |
| 42 | City University of New York | CUNY | Other Agency |
| 43 | City University Construction Fund | CUCF | Other Agency |
| 54 | Civilian Complaint Review Board | CCRB | City – Mayoral Agency |
| 56 | New York Police Department | NYPD | City – Mayoral Agency |
| 57 | Fire Department of New York | FDNY | City – Mayoral Agency |
| 63 | Department of Veteran Services | DVS | City – Mayoral Agency |
| 68 | Administration for Children’s Services | ACS | City – Mayoral Agency |
| 69/96 | Human Resources Administration (Department of Social Services) | DSS/HRA | City – Mayoral Agency |
| 71 | Department of Homeless Services | DSS/DHS | City – Mayoral Agency |
| 72 | Department of Correction | DOC | City – Mayoral Agency |
| 102 | City Council | CC or Council | City – Non-Mayoral |
| 125 | Department for the Aging | DFTA | City – Mayoral Agency |
| 126 | Department of Cultural Affairs | DCLA | City – Mayoral Agency |
| 127 | Financial Information Services Agency | FISA | City – Non-Mayoral |
| 131 | Office of Payroll Administration | OPA | City – Non-Mayoral |
| 132 | Independent Budget Office | IBO | Other Agency |
| 136 | Landmarks Preservation Commission | LPC | City – Mayoral Agency |
| 156 | Taxi and Limousine Commission | TLC | City – Mayoral Agency |
| 226 | Commission on Human Rights | CCHR | City – Mayoral Agency |
| 260 | Department of Youth and Community Development | DYCD | City – Mayoral Agency |
| 312 | Conflicts of Interest Board | COIB | City – Non-Mayoral |
| 313 | Office of Collective Bargaining | OCB | City – Non-Mayoral |
| 493 | Staten Island Community Board # 3 | SICB3 | City – Non-Mayoral |
| 781 | Department of Probation | DOP | City – Mayoral Agency |
| 801 | Department of Small Business Services | SBS | City – Mayoral Agency |
| 801a | New York City Economic Development Council | EDC | Other Agency |
| 806 | Housing Preservation and Development | HPD | City – Mayoral Agency |
| 810 | Department of Buildings | DOB | City – Mayoral Agency |
| 816 | Department of Health and Mental Hygiene | DOHMH | City – Mayoral Agency |
| 819 | Health and Hospitals Corporation | HHC | Other Agency |
| 820 | Office of Administrative Trials and Hearings | OATH | City – Non-Mayoral |
| 826 | Department of Environmental Protection | DEP | City – Mayoral Agency |
| 827 | Department of Sanitation | DSNY | City – Mayoral Agency |
| 829 | Business Integrity Commission | BIC | City – Mayoral Agency |
| 836 | Department of Finance | DOF | City – Mayoral Agency |
| 841 | Department of Transportation | DOT | City – Mayoral Agency |
| 846 | Department of Parks and Recreation | DPR | City – Mayoral Agency |
| 850 | Department of Design and Construction | DDC | City – Mayoral Agency |
| 856 | Department of Citywide Administrative Services | DCAS | City – Mayoral Agency |
| 857 | DCAS Division of Municipal Supply Service | DCAS (DMSS) | City – Mayoral Agency |
| 858 | Office of Technology and Innovation | OTI | City – Mayoral Agency |
| 860 | Department of Records and Information Services | DORIS | City – Mayoral Agency |
| 866 | Department of Consumer and Worker Protection | DCWP | City – Mayoral Agency |
| 901 | District Attorney – New York County | DANY | City – Non-Mayoral |
| 902 | District Attorney – Bronx County | DABX | City – Non-Mayoral |
| 903 | District Attorney – Kings County | DAKINGS | City – Non-Mayoral |
| 904 | District Attorney – Queens County | DAQ | City – Non-Mayoral |
| 905 | District Attorney -Richmond County | DARICH | City – Non-Mayoral |
| 906 | Office of Prosecution – Special Narcotics | OOP-SN | City – Non-Mayoral |
| 996 | New York City Housing Authority | NYCHA | Other Agency |
| 998 | Transit Authority | TRANSIT | Other Agency |
Acknowledgements
Dan Roboff, Director of Procurement Research Analysis and Reporting; Emerson Lazellari, Senior Data Analyst; and James Leidy, CUNY Fellow; were the lead authors of this report with support from Kerri Nagorski, Director of Procurement Policy and Partnerships; Daphnie Agami, Senior Advisor and Counsel to the Deputy Comptroller; Michael D’Ambrosio, Assistant Comptroller for the Bureau of Contract Administration; and Charlette Hamamgian, Deputy Comptroller, Contracts and Procurement. Report design was completed by Archer Hutchinson, Creative Director.
Endnotes
[1] Fiscal Year 23, or FY23, refers to the period between July 1, 2022 through June 30, 2023
[2] NYC Administrative Code §6-116.2(a)
[3] NYC Administrative Code §§6-109, 6-130
[4] NYC Charter §328(a) and §328(d)
[5] PPB Rules §1-01(e)
[6] In certain circumstances, franchises and concessions are also subject to the approval of the Franchise and Concession Review Committee (FCRC). The FCRC is comprised of the following officials or their designees: the Mayor; the Director of the Office of Management and Budget; the Corporation Counsel; the Comptroller; and one additional appointee of the Mayor. The Borough Presidents also serve as members of the FCRC. Each member of the FCRC holds one vote, except for the Borough Presidents, who share one vote, which is determined according to the location of the concession and/or franchise at issue.
[7] Section § 6-116.2 of the New York City Admin Code [Reporting of contracted goods and services; computerized data base.
[8] Tables outlining Contract Types and Award Methods, as well as their corresponding FMS codes, can be found in Section XII – Appendices
[9] For the purposes of this Report, the term “new contracts” include Renewal and Assignment contracts, which are set forth per the terms of a prior contract. Please refer to the contract primer for more information about these procurement methods: https://comptroller.nyc.gov/reports/contract-primer/
[10] Note: revenue actions may also include instances where money is neither expended nor received by the City (“zero dollar” contracts)
[11] Revenue actions exclude Corpus funded contracts for FY23.
[12] The contracts in this Report that are attributed to the NYC Economic Development Corporation (EDC) were registered under the Department of Small Business Services (SBS). EDC is a nonprofit organization incorporated under the Not-for-Profit Corporation Law of the State of New York. SBS contracts with and retains EDC to function as a development consultant and provide economic development-related services on behalf of the City.
[13] A list of agencies with at least one registered contract in FY23, inclusive of FMS code, agency short name, and agency type, can be found in Section XI – appendices
[14] The information in PASSPort public only represents a portion of total city contracts as the data sourced within PASSPort has only been available in the system since January 2020.
[15] The City Record print edition and The City Record Online are produced by the NYC Department of Citywide Administrative Services.
[16] For more information about these contract groups, please refer to the Contract Primer: https://comptroller.nyc.gov/reports/contract-primer/
[17] For more information about subgroups for each of the five contract groups in this section, please refer to the Contract Primer: https://comptroller.nyc.gov/reports/contract-primer/
[18] PPB Rules §1-01(e)
[19] The “other revenue” category in this chart reflects contracts for the management and marketing of recovered metal, auction services, etc.
[20] 9 RCNY §4-02
[21] Modifications associated with Contract types 5 (Construction), 48 (Requirements-Construction and 52 (Requirements-Construction) are considered CCOs.
[22] See MMA1-801-20238804191. SBS contracts with and retains EDC to function as a development consultant and provide economic development-related services on behalf of the City. Accordingly, SBS awards many TOs to EDC.
[23] For the FY23 report’s analysis both PON1s and Condemnations were excluded from FY22 and FY23 Purchase order totals.
[24] For a deep dive explanation of the emergency procurement method, please refer to our November 2023 report “Rethinking Emergency Procurements; A Roadmap to Efficiency and Accountability”: https://comptroller.nyc.gov/reports/rethinking-emergency-procurements/
[25]RCNY §1-01(e)
[26] 9 RCNY §1-01(e)
[27] NYC Charter §823
[28] NYC Charter §329(e)
[29] 9 RCNY §1-01(e)
[30] 9 RCNY §1-01(e)
[31] 9 RCNY §1-01(e)
[32] For the purposes of this section, contracts registered to DCAS (agency code 856), and the DCAS Municipal Supply Service (agency code 857), are both attributed to DCAS. Similarly, both of HRA’s agency codes (69 and 96), are attributed to HRA. NYCHA and HPD both register contracts under the same agency code, but we have separated them out for the purposes of this Report. FISA-OPA are two agencies that share an Executive Director and we are reflecting the data for these agencies together for this section. Finally, this section also reflects task order data registered to EDC and NYCHA.
[33] A list of agencies with at least one registered contract in FY22 or FY23, inclusive of FMS code, agency short name, and agency type, can be found in the Appendix
[34] New York City Charter §385(a)
[35] NYC Charter §82
[36] FISA-OPA are two agencies that share an executive director. Most procurements are managed under FISA. For the purposes of this Section, we are reflecting the data for these agencies together.
[37] NYS Education Law §2590-g.
[38] NYC Charter §259 and §260
[39] To learn more about the Joint Task Force to Get Nonprofits paid on time, please refer to “A Better Contract for New York”: https://comptroller.nyc.gov/reports/a-better-contract-for-new-york/
Similarly, more information can be found on the Capital Reform Task Force here: https://www.nyc.gov/assets/mocs/downloads/Regulations/legislative-regulatory-reform/CP-Reform-Task-Force.pdf
[40] Under the Charter and PPB Rules some contracts are exempted from the registration requirement in order to become legally effective. For the purposes of this Report, “registration” refers to the date when an approved contract filing is reflected in FMS. Since FMS is the vehicle by which the City encumbers contract funds, this step is necessary for agencies to release payments to vendors.
[41] Section VIII includes retroactivity data for the first 6 months of FY24 (July 1, 2023 to December 31, 2023). Charts 144 and 145 reflect retroactivity rates among procurement contracts only (revenue contracts have been excluded). Human Service contracts were classified using Checkbook NYC’s industry mapping rules. Non-Profit contracts were classified according to their 1099 status in FMS. Many Human Service Industry contracts are registered to Non-Profits.
[42] Under the Charter and PPB Rules some contracts are exempted from the registration requirement in order to become legally effective. For the purposes of this Report, “registration” refers to the date when an approved contract filing is reflected in FMS. Since FMS is the vehicle by which the City encumbers contract funds, this step is necessary for agencies to release payments to vendors.
[43] This total does not include several M/WBE NCSP method contracts that were awarded to vendors without M/WBE certifications in FMS at the time this data was collected.
[44] Corpus funded contracts were excluded from this analysis of retroactive revenue contracts.
[45] The data provided in this section is limited to TOs/CTA1s issued pursuant to master agreements registered using the Transaction Code “MMA1.” It does not include instances where agencies purchase goods using a Direct Order (“DO”) issued through master agreements registered using the Transaction Code “MA1.”
[46] NYC Administrative Code §6-109
[47] Per existing security agreements, contract records for DOI, and NYC’s five District Attorney Office are not reflected in this document.
[48] See column U to filter for CCOs
[49] Since the award methods used to enter into Revenue Actions may overlap with the awards methods listed in the other Contract Group, the transactions in Contract Group No. 5 are identified by FMS Transaction Code RCT1. The subcategories denoted in group 5 reflect contract type categories, rather than award methods.