Introduction
This office has published multiple reports highlighting the importance of access to banking and credit for all New Yorkers, particularly among groups that have historically had less access to traditional banking and a greater reliance on high-cost, nonbank alternative financial services (such as payday loans, high-cost installment loans, and nonbank check cashing services).
Community development financial institutions (CDFIs) exist to help bridge this gap and provide safer and more affordable access to capital among underserved communities. CDFIs can offer loans for many purposes, including small business, commercial real estate, personal consumer, auto, and home mortgages.
In this Spotlight, we focus on CDFIs’ role in New York City’s home mortgage market. We examine whether CDFIs are reaching borrowers and neighborhoods that have historically faced greater barriers to homeownership—particularly lower-income borrowers and Black, Hispanic, and Asian American and Pacific Islander (AAPI) New Yorkers—and whether their lending and approval patterns differ meaningfully from those of non-certified institutions.
The results highlight the importance of CDFIs’ role in New York City’s home mortgage market. Compared to conventional financial institutions, the city’s CDFIs loan to a greater proportion of Hispanic/Latino and AAPI homebuyers—particularly AAPI buyers, a trend which is driven almost entirely by two major lenders that primarily serve the city’s Asian communities. CDFIs also lend to a greater share of low-to-moderate-income borrowers, though that share has declined steeply in recent years, possibly because of surging mortgage interest rates. Among lower-income households, as well as in lower-income neighborhoods, CDFIs offer higher mortgage approval rates than non-certified institutions.
Background
Community development financial institutions are non-government financing entities formally certified by the CDFI Fund, part of the U.S. Treasury Department. The roster of certified CDFIs, which includes banks, credit unions, loan funds, and venture capital funds, changes from year to year and even month to month as institutions gain and lose certification.
Financial institutions must meet several requirements to obtain and maintain CDFI certification, including that they:
- Have a primary mission of promoting community development;
- Primarily serve one or more Target Markets—at least 60 percent of the financing activity must occur in either an Investment Area (an area meeting at least one economic distress criteria, based on poverty, income, unemployment, or population decline) or Targeted Population (individuals with median family income not more than 80 percent of their area or state’s median family income, or members of groups with a demonstrated lack of access to capital of financial products/services);
- Provide Development Services to customers in conjunction with financing activities—that is, structured training, counseling, or technical assistance services that promote access to and success with the institution’s financial products and services;
- Maintain accountability to the defined Target Market through representation of residents or members of a Targeted Population on its governing or advisory board; and
- Be a non-government entity.
For financial institutions, the benefits to CDFI certification are numerous. The CDFI Fund offers several programs and assistance for certified institutions. Notably, The Fund provides grants, loans, and investments to expand CDFIs’ lending capacity (Financial Assistance awards) as well as grants to build their technical and organizational capacity (Technical Assistance awards). Other programs available to CDFIs, or which encourage other institutions to invest in CDFIs, include the Capital Magnet Fund, which awards grants to finance affordable housing and related economic development activities; the Bond Guarantee Program, which authorizes CDFIs to issue a large volume of bonds 100 percent guaranteed by the U.S. Treasury; and the Bank Enterprise Award Program, which provides monetary awards to FDIC-insured depositories (i.e., banks and thrifts) that demonstrate an increase in investment into CDFIs or into their own qualified lending in distressed communities.
CDFIs significantly expanded their presence in the United States through the 2010s, with especially high growth from 2018 through 2023. A 2025 paper from the Federal Reserve Bank of New York finds that this was driven mostly by an increase in certified credit unions, both in the U.S. mainland and especially Puerto Rico. The paper also theorizes that an increase in the availability of federal funds from the Emergency Capital Investment Program during the pandemic may have encouraged more institutions to seek CDFI certification in 2021 and 2022.
The number of CDFIs declined somewhat in 2024 and 2025, mostly driven by a contraction in the number of CDFI-certified credit unions. In December 2023, the CDFI Fund released revised certification policies that required additional data disclosures and stricter requirements, both for new applicants and for existing CDFIs to maintain their certifications. These changes likely contributed to the decrease in CDFI-certified institutions after 2023.
For a comprehensive look at home mortgage activity in New York City and beyond from 2018 through 2025, we use data published by the Federal Financial Institutions Examination Council (FFIEC), an interagency government body that includes the Consumer Financial Protection Bureau (CFPB), which administers collection of mortgage data under the Home Mortgage Disclosure Act (HMDA). We use the Treasury’s current and past lists of certified CDFIs to identify CDFI loans and lenders within the HMDA dataset.[1]
Throughout this report we refer to “New York City CDFIs,” though the more accurate term would be “CDFIs that lend in New York City,” as we flag any CDFI loans made in the city, regardless of where the lending institution is headquartered. In fact, CDFIs headquartered in California account for almost as many mortgage originations in New York City as those headquartered in New York State—each accounting for about 48 percent of the city’s CDFI mortgages since 2018.
It’s important to note two limitations to the data. First, very small lenders are not required to report mortgages under HMDA, and are therefore excluded from our analysis.[2] Second, we are not able to identify as many CDFI loan funds as likely exist in the HMDA data.[3] However, subject-matter experts indicated to us that CDFI loan funds make up only a small proportion of CDFI mortgage origination in New York City, as loan funds tend to focus on other consumer financial products. Small lenders also, by definition, make up a smaller share of the total lending volume in New York, and experts we spoke with expressed confidence that HMDA data includes the bulk of the CDFI home mortgage market.
With these limitations in mind, we identified 5,011 home mortgages in New York City originated by CDFIs between 2018 and 2025, representing about 1.88 percent of the 266,343 total HMDA-reported mortgages in the city over that period. This is a higher proportion than the 1.25 percent of nationwide HMDA home mortgage originations we could attribute to CDFIs over the same period.
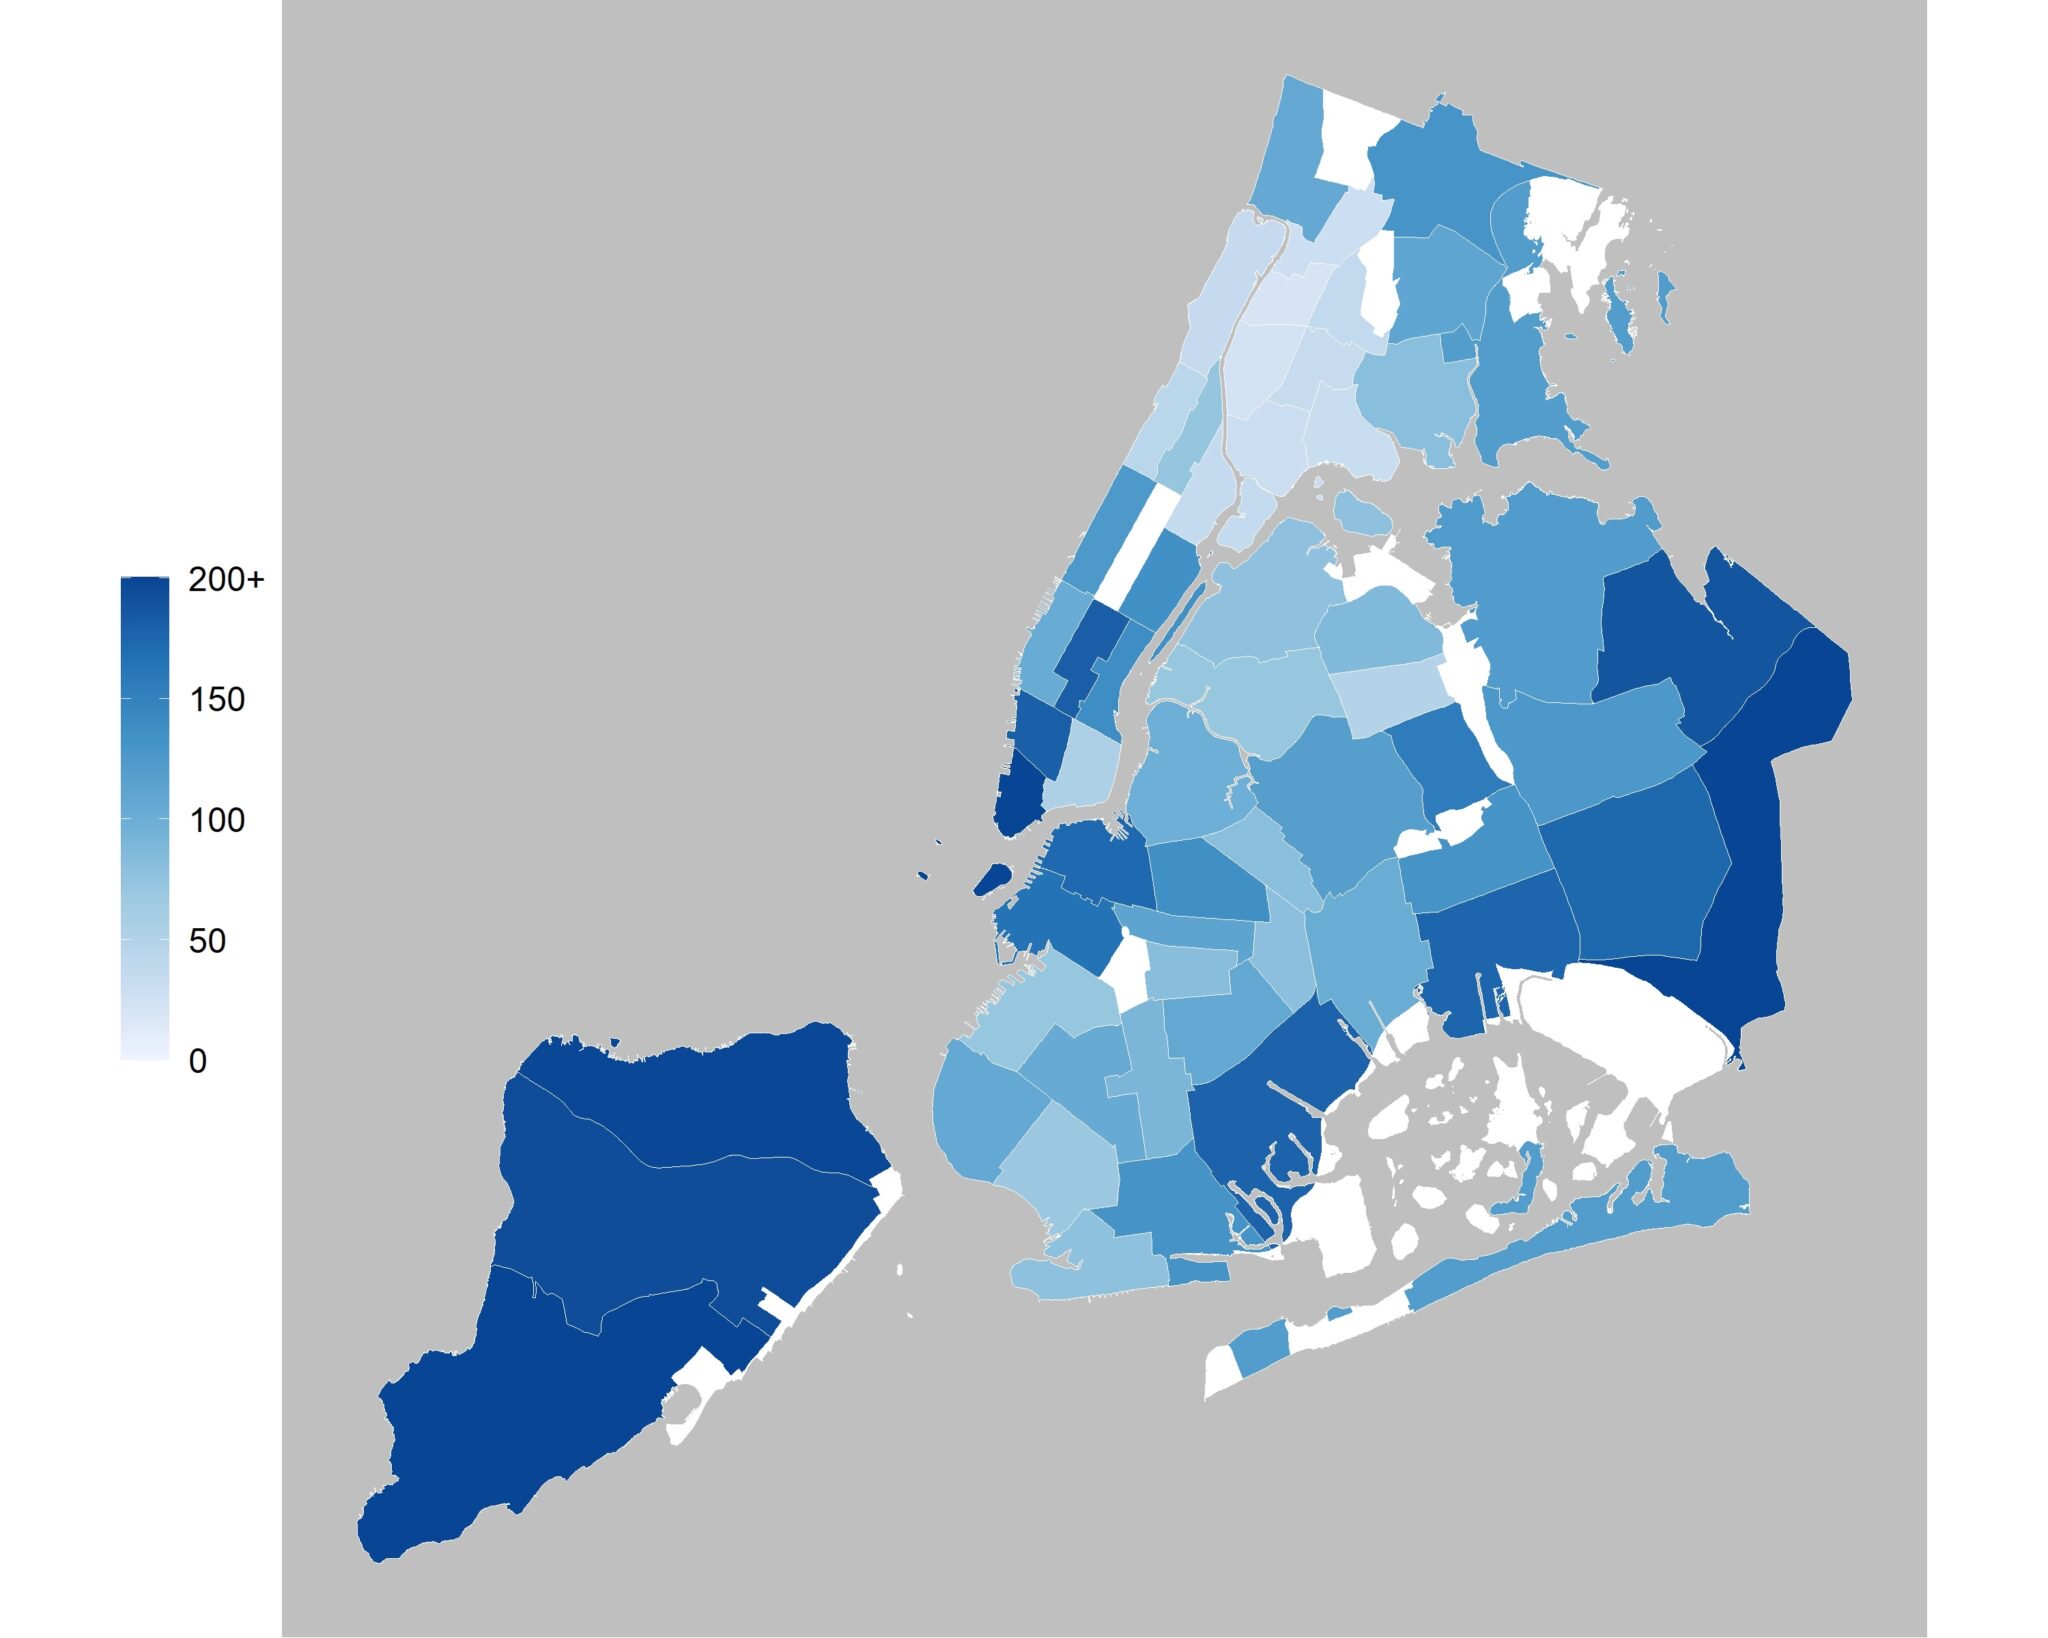
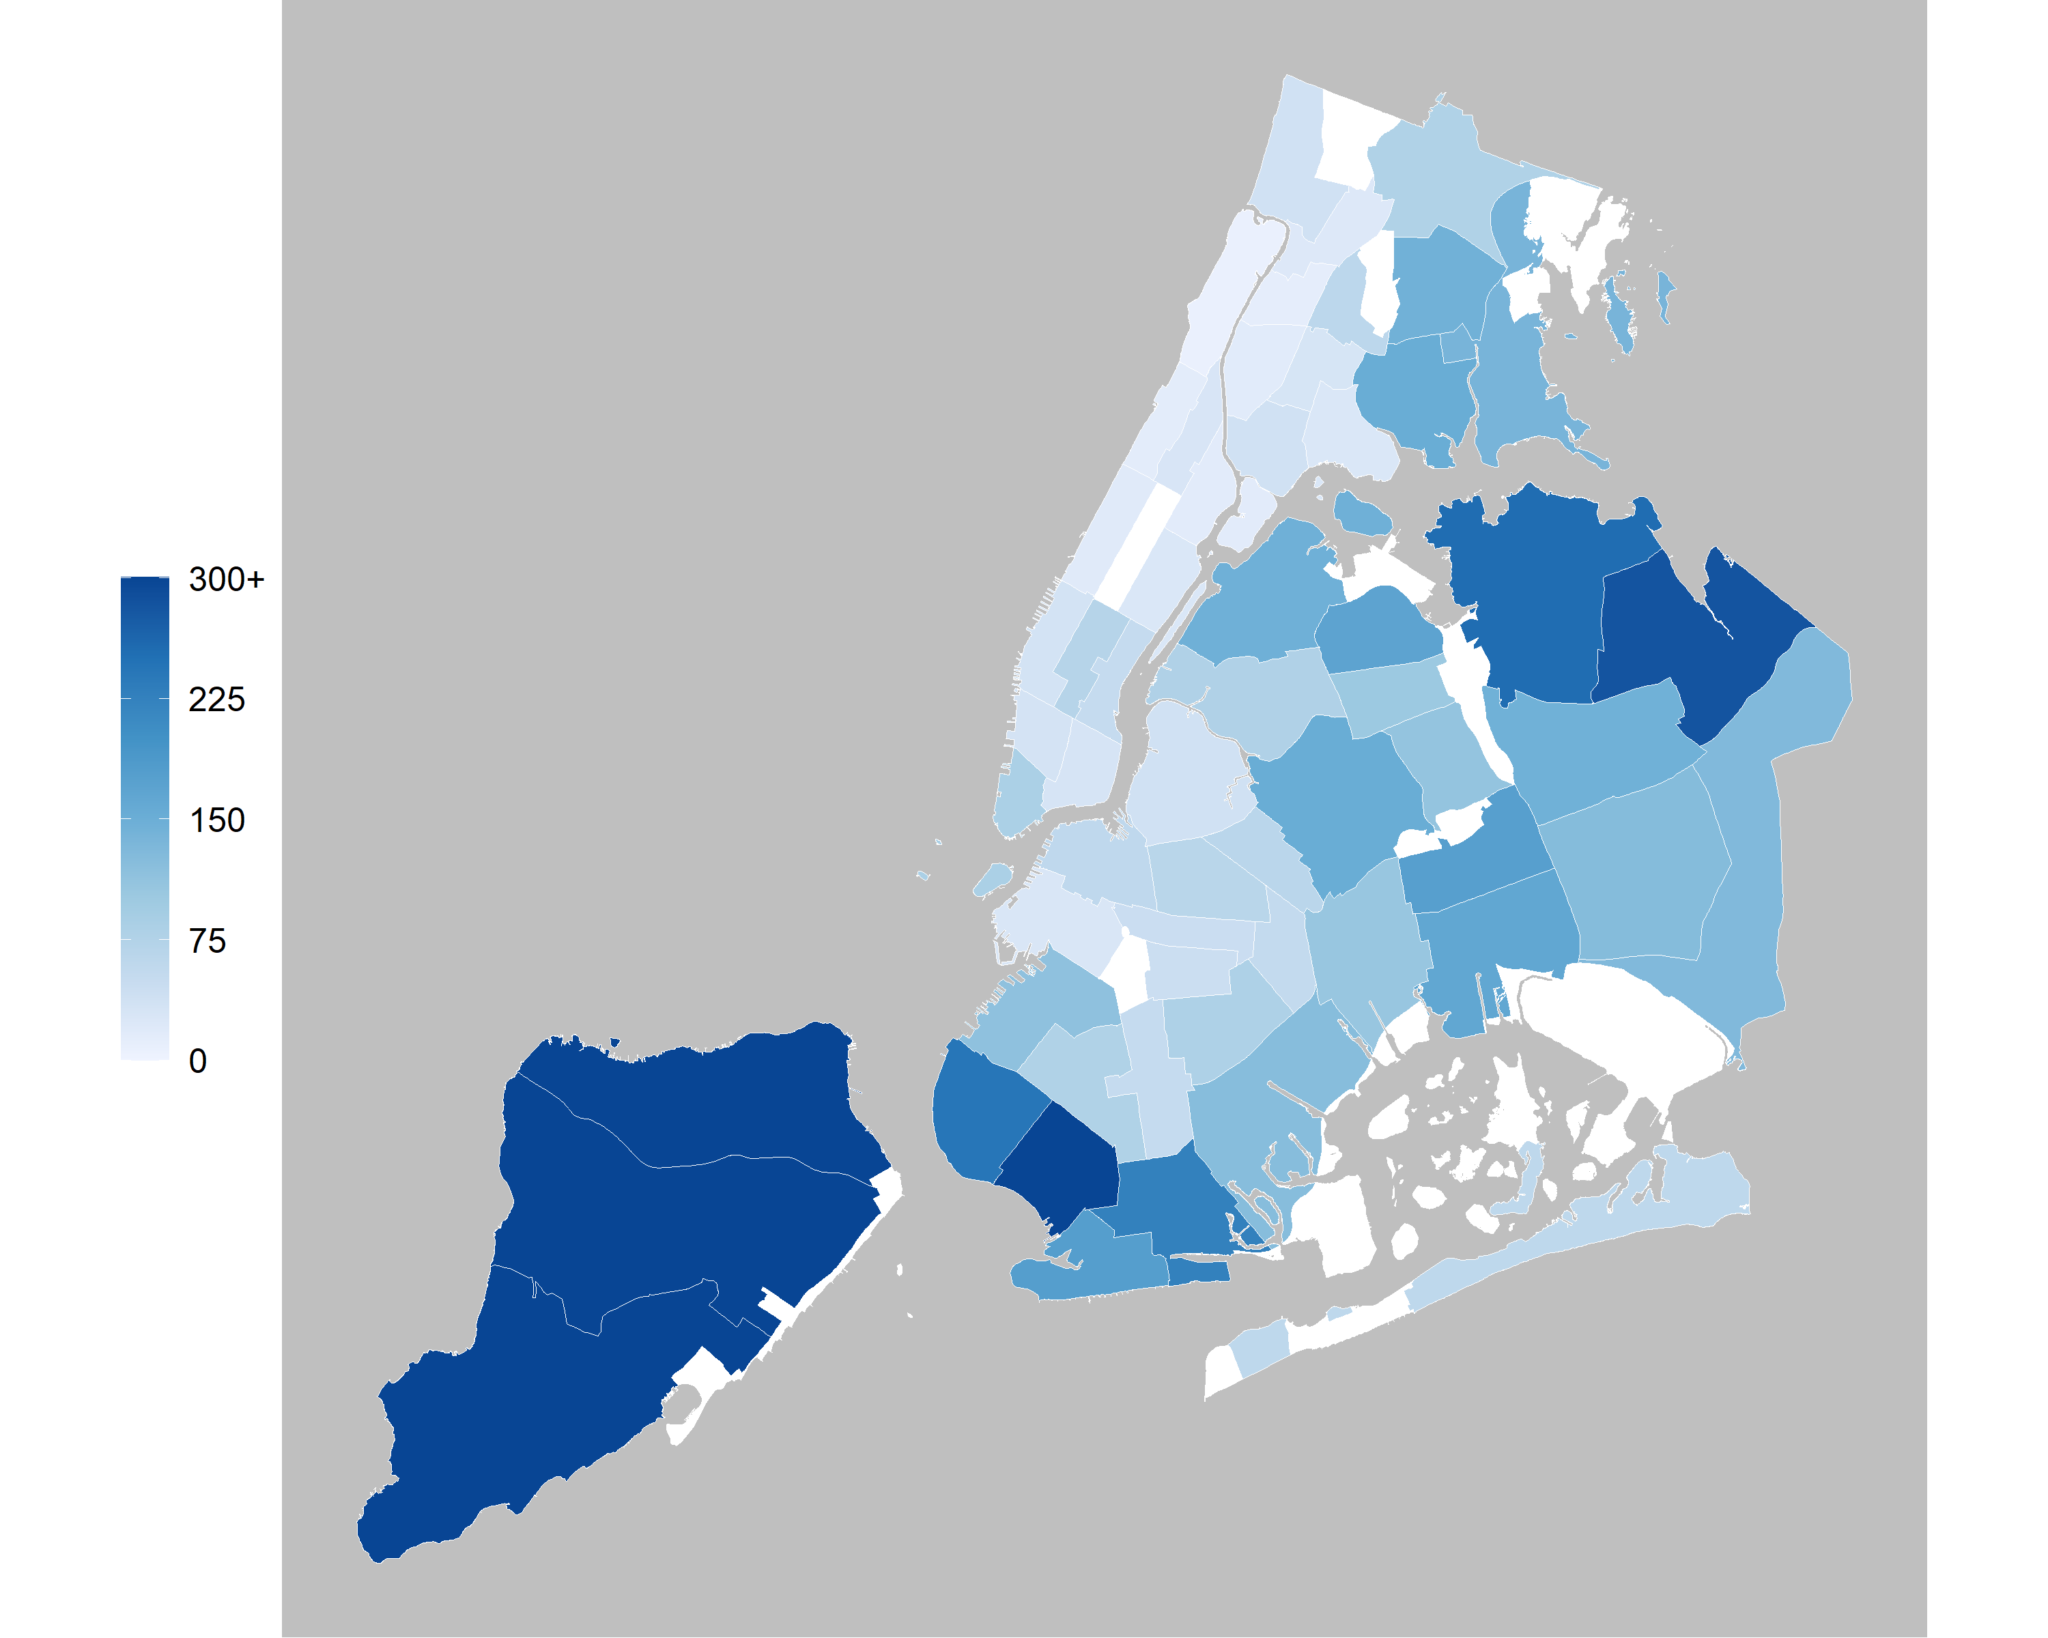
Charts 1A and 1B compare the concentrations of non-CDFI and CDFI loans in each of the city’s 59 community districts. Staten Island has the most concentrated lending both for CDFIs and non-CDFIs—unsurprising given the borough’s significantly higher homeownership rate relative to the rest of the city. CDFI lending is also particularly active in some areas of southwest Brooklyn and northeast Queens. This is driven in large part by two major CDFI lenders, Royal Business Bank and Quontic Bank, that serve the city’s Asian communities (discussed in greater detail in the next section). On the other hand, CDFIs have a proportionately smaller lending presence in Manhattan and northern Brooklyn.
Chart 1A. HMDA non-CDFI mortgage originations by community district per 1,000 residents, 2018-2025 total
Source: Home Mortgage Disclosure Act data (Federal Financial Institutions Examination Council); Office of the NYC Comptroller
Chart 1B. HMDA CDFI mortgage originations by community district per 100,000 residents, 2018-2025 total
Source: Home Mortgage Disclosure Act data (Federal Financial Institutions Examination Council); Office of the NYC Comptroller
Borrower Demographics
The U.S. home mortgage market has been notoriously volatile since the onset of the COVID-19 pandemic. Nationwide, home purchases contracted briefly in spring 2020 then rose sharply and remained elevated through 2021—reflecting the strong economic rebound and low-interest rate conditions, along with a growing need for home office space. Since then, however, in an environment of supply chain constraints, higher interest rates, and growing economic uncertainty, we have seen a drop in existing home sales below pre-pandemic levels, and relative stagnation in new home sales.
Chart 2A compares trends in home mortgage origination between CDFIs and non-CDFIs in New York City and in other major U.S. cities.[4] Chart 2B follows the same groups of institutions but tracks new mortgage lending volume rather than the absolute count. Within New York City, the annual number of CDFI home mortgage originations has declined by roughly 40 percent from 2018 to 2025. Non-CDFI mortgages, in comparison, declined about 20 percent, both in New York City and in other major cities.
Chart 2A
Source: Home Mortgage Disclosure Act data (Federal Financial Institutions Examination Council); Office of the NYC Comptroller
Chart 2B
Source: Home Mortgage Disclosure Act data (Federal Financial Institutions Examination Council); Office of the NYC Comptroller. 2025 inflation-adjusted dollars
The extent to which CDFI home mortgage lending has grown outside of New York City may seem surprising. In 2023, CDFIs in other major U.S. cities originated almost three times as many mortgages as they did in 2018. The number has since declined, though it remains elevated far above 2018 levels. This trend is consistent with findings from the Federal Reserve Bank of New York which show that the number of CDFIs and their total assets spiked dramatically through the 2010s into the early 2020s, then began to decline after the U.S. Treasury announced a revised CDFI certification process that raised the standards and documentation required for certification. Although there is no clear consensus on what caused the increase in CDFI lending between 2024 and 2025, the results are consistent with a report from Aeris Insight released earlier this year. It finds an increase in CDFI activity in 2025 for housing development loan funds, suggesting it was driven by the delayed impacts of assistance CDFIs received in 2021 and 2022.
A key question, then, is why New York City home mortgage lending didn’t follow the same trend as in other major cities. According to the CDFI Fund’s certification lists, the number of CDFIs headquartered in New York City has remained roughly constant, at around 52 institutions, throughout this period—contrary to the nationwide trend between 2018 to 2023.
But the primary driver of the decline in NYC CDFI lending between 2018-2020, and again between 2022-2025, comes down to the two biggest CDFI lending institutions in New York City: Royal Business Bank and Quontic Bank. In 2018, the two banks originated 809 mortgages in New York City, 95 percent of all CDFI mortgages that year. By 2025, their combined originations fell to 352, accounting for 69 percent of the year’s CDFI mortgages. SEC filings indicate that (aside from a 2021-2022 spike) the declines can be attributed to the banks winding down their wholesale lending activity. Putting Royal Business Bank and Quontic aside, the annual number of mortgage originations from all other New York City CDFIs grew nearly fourfold: from 42 in 2018 to 160 in 2025.
Chart 3 compares the racial breakdown of homebuyers borrowing from CDFI versus non-CDFI lenders between 2018 to 2025. Immediately apparent is the vastly disproportionate level of Asian-American and Pacific Islander (AAPI) homebuyers in New York City. While AAPI individuals made up approximately 16 percent of the city’s population, they accounted for 37 percent of its home mortgage originations during this period. And among CDFIs, that figure increases to 81 percent.
Chart 3
Source: Home Mortgage Disclosure Act data (Federal Financial Institutions Examination Council); Office of the NYC Comptroller
Again, the trend is primarily attributable to Royal Business Bank and Quontic. Royal Business Bank was specifically founded “to serve first-generation Chinese and Taiwanese communities,” while Quontic is a New York-based digital bank that targets “underserved ethnic communities in the boroughs.” Together, they accounted for 93 percent of CDFI mortgages to AAPI homebuyers between 2018 to 2025. Conversely, AAPI homebuyers constituted 98 percent of Royal Business Bank’s mortgage originations and 54 percent of Quontic’s during this period.
Setting aside AAPI originations, as done in Chart 4, New York’s CDFIs lend to a much larger proportion of Hispanic and Latino homebuyers than noncertified lenders. Historically, they have also originated a greater share of their mortgages to Black borrowers, though this pattern appears to have reversed in recent years. Because of the relatively small number of CDFI home mortgages made in NYC each year (CDFI mortgage originations to non-AAPI borrowers have numbered between 66 to 184 per year since 2018), these proportions are highly sensitive to statistical noise. In this case, the fluctuation in the proportion of Black CDFI borrowers is primarily driven by Quontic Bank, whose loans to Black homebuyers fell from twenty in 2022 to just four in 2025. The bank’s number of mortgage originations to Hispanic and white homebuyers also dropped during this period, but to smaller degrees.
Chart 4
Source: Home Mortgage Disclosure Act data (Federal Financial Institutions Examination Council); Office of the NYC Comptroller
CDFIs lend to somewhat older borrowers than noncertified lenders, as seen in Chart 5. Homebuyers age 45 and above accounted for 33 percent of New York City’s non-CDFI home mortgage originations between 2018-2025, compared to 37 percent of CDFIs’. While we cannot directly isolate the mechanism behind the trend, it is plausible that the higher average age of CDFI homebuyers reflects the fact that these institutions tend to serve more low-to-moderate-income, immigrant, and thin-credit-file households, for whom the path to a first mortgage often runs longer.
Chart 5
Source: Home Mortgage Disclosure Act data (Federal Financial Institutions Examination Council); Office of the NYC Comptroller
Compared with non-CDFI-certified financial institutions, New York City CDFIs lend to lower-income homebuyers on average. Chart 6 shows the composition of borrower income levels each year for non-CDFIs and CDFIs.[5] While CDFIs have consistently originated a greater share of mortgages to low-income borrowers than non-CDFIs, this share has declined significantly since 2018, particularly among borrowers with annual income under $75,000.
Chart 6
HMDA home mortgage originations by year and income (NYC, 2025 dollars)
Source: Home Mortgage Disclosure Act data (Federal Financial Institutions Examination Council); Office of the NYC Comptroller
A large part of this decline is likely attributable to surging mortgage interest rates since 2022 that have put homeownership out of reach for many moderate- and middle-income households. Nationally, the mortgage market has also seen a steadily declining share of low-income borrowers, as both home prices and interest rates have grown significantly.
Mortgage Approval Rates and Loan Characteristics
The previous section analyzed mortgage loans that were approved and originated. In this section, we bring mortgage denials into view, comparing CDFI versus non-CDFI approval rates across income, race, and neighborhood.[6] We then turn to the terms of the loans themselves.
While Chart 6 showed us that New York City’s CDFIs’ lending is concentrated among lower-income homebuyers compared to non-CDFIs, it did not tell us whether these institutions are actually more likely to approve a mortgage for any given borrower—in theory, the difference in borrowers’ income composition could result from CDFIs simply having a larger pool of low-income applicants, even if their underwriting standards are ultimately the same as those of non-certified lenders.
By comparing non-CDFI and CDFI mortgage approval rates across applicant income levels, Table 1 helps us understand whether CDFIs are actually more likely to award mortgages to lower-income borrowers. Across all home mortgage applications in New York City between 2018-2025, CDFIs posted a higher overall approval rate than other lenders—90 percent versus 86 percent. But when we look at prospective borrowers with incomes between $75,000 and $125,000, the CDFI approval gap jumps to 7 percentage points. And for applicants with annual income under $75,000, the city’s CDFIs had an approval rate 19 percentage points higher than that of other lenders.
Note that for each of the tables in this section, we limit our sample to applicants age 62 and below to avoid confounding effects from retiree homebuyers who may appear low-income but are asset-rich, and therefore not part of the population we are most interested in exploring.
Table 1. HMDA home mortgage approval rates by applicant income, 2018-2025 (NYC, age 62 and below)
| Applicant income | Non-CDFI | CDFI |
|---|---|---|
| <$75,000 | 69% | 88% |
| $75,000-$124,999 | 84% | 91% |
| $125,000-$199,999 | 87% | 91% |
| $200,000+ | 89% | 90% |
| Total | 86% | 90% |
Source: Home Mortgage Disclosure Act data (Federal Financial Institutions Examination Council); Office of the NYC Comptroller. 2025 inflation-adjusted dollars
Of course, even when controlling for income, the gap in mortgage approval rates cannot definitively tell us that the Treasury’s CDFI certification program creates homeownership opportunities for those who would be denied at other lending institutions. It’s possible that CDFIs might attract a customer base who tend to have stronger non-income-related mortgage qualifications than traditional banking customers, for whatever reason, but as individuals they would be equally likely to be approved at a CDFI as at a non-CDFI. Or, it might be that designated CDFIs tend to be the types of institutions that lend to lower-income borrowers, but that CDFI certification doesn’t actually promote better lending behavior (i.e., the CDFI banks and credit unions would have originated those mortgages regardless of whether they had CDFI certification).
Still, the patterns we see in Table 1 (and in Table 2 below) are what we would hope to see from mission-based lenders: the “approval bump” they demonstrate is most prominent among borrowers who are likely to face the steepest barriers to homeownership.
Table 2 tests whether CDFIs are not only more likely to approve mortgages for lower-income borrowers, but also more likely to originate mortgages in lower-income neighborhoods. To do so, we group home mortgage approvals and denials by the median income of the census tract in which they are located. Census tracts in New York City can be thought of as “micro-neighborhoods” consisting of just a few square blocks and several thousand people.[7]
Table 2: HMDA home mortgage approval rates by census tract median income, 2018-2025 (NYC, age 62 and below)
| Tract median income | Non-CDFI | CDFI |
|---|---|---|
| <$75,000 | 81% | 89% |
| $75,000-$124,999 | 84% | 89% |
| $125,000-$199,999 | 88% | 92% |
| $200,000+ | 89% | 82% |
| Total | 86% | 90% |
Source: Home Mortgage Disclosure Act data (Federal Financial Institutions Examination Council); Office of the NYC Comptroller. 2025 inflation-adjusted dollars
At the neighborhood level we see similar approval trends as at the individual level. In tracts with median income under $75,000, CDFIs approved 89 percent of mortgage applications compared to 81 percent among other lenders. They also maintained slightly higher approval rates (about 4-5 percentage points) in tracts with median household income between $75,000 and $124,999 and those between $125,000 and $199,999. The lower approval rate for CDFIs in tracts with median income above $200,000 may be the result of relatively small sample size; CDFIs in these tracts originated only 153 CDFI loans from 2018-2025, compared to at least 900 in every other income category.
Finally, we turn from analyzing whether loans are approved to quantifying the kind of loans that these institutions originate. Table 3 compares key loan characteristics by race, and in aggregate, between New York City non-CDFIs, New York City CDFIs, and CDFIs in other major cities in the years 2018 through 2025.
Table 3: Loan characteristics by race (2018-2025, age 62 and below)
Source: Home Mortgage Disclosure Act data (Federal Financial Institutions Examination Council); Office of the NYC Comptroller. 2025 inflation-adjusted dollars
Comparing New York City CDFIs to the city’s other mortgage lenders, we see that CDFI home loans tend to be smaller in absolute dollar amount as well as in relation to the value of the home (loan-to-value ratio). And the median CDFI mortgage in the city carries an interest rate 87.5 basis points higher than the rate at a non-certified lender. For white and Hispanic/Latino homebuyers, the median rate was over 200 basis points higher. The fact that CDFI loans tend to be smaller in value and carry a higher interest rate is not unexpected given that, as we have seen throughout this report, these institutions tend to loan to lower-income, and therefore potentially higher-risk, homebuyers—something which is also reflected in the generally higher debt-to-income (DTI) ratio among CDFI loans
Comparing New York’s CDFIs to CDFIs in other cities, we see that median loan amounts are higher in NYC—unsurprising given the city’s notoriously expensive housing. Interestingly, the geographies in which CDFI mortgages hold a higher interest rate varies by race: the median interest rate is higher for white and Hispanic/Latino homebuyers in NYC, but lower for Black and AAPI homebuyers. Some of these discrepancies can likely be attributed to differing socioeconomic profiles for each population across different cities, but due to the limited number of observations we cannot produce a meaningful cross-tabulation of median mortgage interest rates by both income and race in New York City.
Conclusion
Community Development Financial Institutions play an important role in expanding access to credit among individuals and communities underserved by conventional financial institutions. Across the demographic and socioeconomic dimensions explored in this Spotlight, New York’s CDFIs reach further into populations that are less likely to be able to buy a home with a conventional bank or credit union. They lend to a larger proportion of low-and-moderate-income borrowers as well as Hispanic and Asian borrowers, though the proportion of lending to Black homebuyers has declined. CDFIs also demonstrate higher loan approval ratings, particularly with lower-income borrowers. Moreover, they are more likely to lend in disadvantaged neighborhoods compared to conventional institutions, an important characteristic as homeownership tends to have positive spillover effects on nearby property values and neighborhood stability.
CDFIs have a great deal of room to expand their reach and impact. In New York City, we identified around 5,000 CDFI home mortgage originations over the past eight years—less than one in fifty total HMDA mortgages during this period. While this is still a higher rate than the U.S. as whole, two lending institutions in particular, Royal Business Bank and Quontic Bank, have dominated the New York City’s CDFI mortgage lending market. Because Quontic and especially Royal Business Bank primarily serve the city’s Asian communities, CDFI reach is even more limited among the city’s white, Black, and Hispanic homebuyers.
Nor have CDFIs been immune to the challenges facing the wider housing market since the onset of the COVID-19 pandemic. Compared to non-CDFI-certified financial institutions in New York, and especially compared to CDFIs in other major cities, New York City’s CDFIs have seen a much steeper decline in home mortgage originations and lending volume since 2018. And as interest rates have surged since 2022, making mortgages significantly more expensive, the share of CDFI lending going to low-to-moderate-income homebuyers has fallen closer to the level of conventional institutions.
As homeownership drifts further out of reach for lower-income and nonwhite New Yorkers, the institutions best positioned to reach excluded borrowers are under strain. Just how city and state policymakers should respond is a matter of debate, and will be further explored in the Office of the NYC Comptroller’s continuing series on consumer financial protection and community access to capital.
Acknowledgments
This report was prepared by Andre Vasilyev, Assistant Director for Economic Development and Amber Born, Senior Economic Development Research Analyst, with assistance from Jonathan Siegel, Chief Economist. Archer Hutchinson, Creative Director led the design, with assistance from Danbin Weng, Multimedia Designer, and Martina Carrington, Web Developer.
Endnotes
[1] HMDA data itself does not indicate whether a given loan comes from a CDFI-certified institution, so we linked the dataset to the CDFI Fund’s list of certified institutions, which varies from year to year. Past lists of certified institutions were gathered through the Wayback Machine, an internet archive service. The only identifier allowing a direct link between datasets is the RSSD ID assigned to financial institutions by the Federal Reserve. To link the datasets, we used a multi-step “fuzzy matching” process between institutions named in the HMDA data (itself matched via HMDA’s internal Reporter Panel) and those in CDFI certification lists. Through this we were also able to flag an additional set of CDFIs who could not be matched via RSSD.
[2] Lending institutions are required to submit data on all of their mortgage activity to the FFIEC if they meet several requirements, including assets above a given threshold ($59 million in 2025) for depository institutions and either 25+ mortgage loans or 200+ open-end lines of credit in each of the last two years. This is important to note for the remainder of this report, because it means that CDFI-certified lenders that issue home mortgages but fall under these thresholds are not captured in the data. Any conclusions drawn about NYC’s home mortgage market based on this data necessarily exclude smaller lenders which may exhibit different characteristics from the institutions that are represented.
[3] Because most loan funds are not assigned an RSSD, we likely did not identify a substantial share of the CDFI loan funds that exist in HMDA data—though it’s important to note that only a small proportion of loan funds are certified CDFIs, and that CDFI loan funds tend to focus on other forms of consumer and business lending than home mortgages.
[4] We use the Metropolitan Statistical Areas (MSAs) that include the nine largest cities in the U.S., excluding NYC: Los Angeles, Chicago, Houston, Phoenix, Philadelphia, San Antonio, San Diego, Dallas, and Jacksonville. When possible, we used Metropolitan Divisions (MDs) which further divide the largest MSAs (e.g., we used the Philadelphia MD, a subdivision of the Philadelphia-Camden-Wilmington MSA). Some other cities and towns are included because of how MSAs are defined; for example, the Jacksonville MSA includes St. Augustine, FL.
[5] HMDA defines income as the gross annual income “relied on in making the credit decision” (or in processing the application, if a decision is not made). Therefore, the HMDA reported income may belong to one person, if there isn’t a co-applicant, or two people, if there is. We adjust all incomes to 2025 dollars.
[6] To calculate approval rates, we also included applications that were approved but ultimately not accepted by the borrower. We include these applications only for approval rate calculations and exclude them elsewhere.
[7] More generally, census tracts are relatively small geographic subdivisions typically containing 1,200-8,000 people, meant for consistent statistical comparison across years.