NYC Neighborhood Economic Profiles
Introduction
As the city economy grows and new business centers emerge, it is essential to take stock. Today more than ever, New York has become a five-borough economy, with high-quality employment opportunities available in nearly every city neighborhood. This diffusion of jobs offers both opportunities and challenges, requiring local policymakers to pay closer attention to neighborhood changes and respond with more targeted and strategic investments in infrastructure, education, job training, and affordable housing.
Spurred by these trends, the Comptroller’s Office has assembled in-depth economic profiles of every New York City community district. This year, we’ve updated this first-of-its-kind analysis, charting the growth and composition of local businesses, commuting patterns, employment rates, commercial building stock, educational attainment, household income, and many other important variables.
In addition to these economic profiles of all 59 community districts (see below), the Comptroller’s Office has analyzed employment and business trends across all 188 New York City neighborhoods. This more granular analysis provides a closer look at a theme explored in the previous New Geography of Jobs report: the relationship between gentrification and economic development.
More specifically, it corroborates our findings that gentrification is closely tied with business and employment growth, but that long-time local residents and people of color have largely been excluded from these opportunities.
The Changing Economy of Gentrifying Neighborhoods
For this analysis, gentrification is defined as a function of both rising rents and a change in the composition of local residents. More specifically, to identify those areas that “gentrified” from 2010 to 2016, we evaluated: a) neighborhoods whose rent was below the median in 2010, b) that experienced a higher than average increase in median rent between 2010 and 2016, and c) where the share of adults with a bachelor’s degree increased by more than the city median. In total, of the city’s 188 neighborhoods delineated by the Department of City Planning, we found that 24 experienced gentrification over the last six years (see Chart 1).
Chart 1: NYC Gentrifying Neighborhoods, 2010-2016
| Neighborhood | Borough | Median Rent 2010 | Median Rent 2016 | Rent Increase | Share of Adults with Bachelor’s Degree 2010 | Share of Adults with Bachelor’s Degree 2016 |
| DUMBO-Vinegar Hill-
Downtown Brooklyn-Boerum Hill |
Brooklyn | $831 | $1,749 | 110% | 50% | 60% |
| North Side-South Side (Williamsburg) | Brooklyn | $1,038 | $1,768 | 70% | 43% | 56% |
| Grasmere-Arrochar-Ft. Wadsworth | Staten Island | $796 | $1,103 | 39% | 31% | 38% |
| East Williamsburg | Brooklyn | $970 | $1,315 | 36% | 35% | 42% |
| Bushwick South | Brooklyn | $894 | $1,206 | 35% | 15% | 24% |
| Kensington-Ocean Parkway | Brooklyn | $1,038 | $1,394 | 34% | 35% | 40% |
| Central Harlem South | Manhattan | $791 | $1,060 | 34% | 39% | 44% |
| Bushwick North | Brooklyn | $1,023 | $1,359 | 33% | 14% | 23% |
| East Harlem South | Manhattan | $761 | $1,007 | 32% | 30% | 40% |
| Homecrest | Brooklyn | $1,010 | $1,333 | 32% | 31% | 38% |
| Crown Heights South | Brooklyn | $960 | $1,263 | 32% | 22% | 32% |
| Central Harlem North-Polo Grounds | Manhattan | $728 | $952 | 31% | 28% | 31% |
| Bedford (Stuyvesant) | Brooklyn | $891 | $1,165 | 31% | 21% | 32% |
| Bath Beach | Brooklyn | $998 | $1,299 | 30% | 22% | 34% |
| Hamilton Heights | Manhattan | $936 | $1,200 | 28% | 29% | 34% |
| Claremont-Bathgate | Bronx | $609 | $778 | 28% | 5% | 12% |
| Flatbush | Brooklyn | $1,012 | $1,283 | 27% | 25% | 33% |
| Stuyvesant Heights | Brooklyn | $887 | $1,123 | 27% | 20% | 27% |
| Manhattanville | Manhattan | $742 | $934 | 26% | 20% | 30% |
| Madison | Brooklyn | $1,015 | $1,276 | 26% | 37% | 41% |
| Woodlawn-Wakefield | Bronx | $1,036 | $1,296 | 25% | 23% | 27% |
| Springfield Gardens North | Queens | $881 | $1,102 | 25% | 19% | 26% |
| Chinatown | Manhattan | $823 | $1,028 | 25% | 26% | 34% |
| Schuylerville-Throgs Neck-
Edgewater Park |
Bronx | $1,030 | $1,286 | 25% | 21% | 25% |
| Typical NYC Neighborhood | $1,039 | $1,299 | 25% | 27% | 30% |
NYC DCP. “New York City Population FactFinder: Neighborhood Tabulation Area,” 2018.
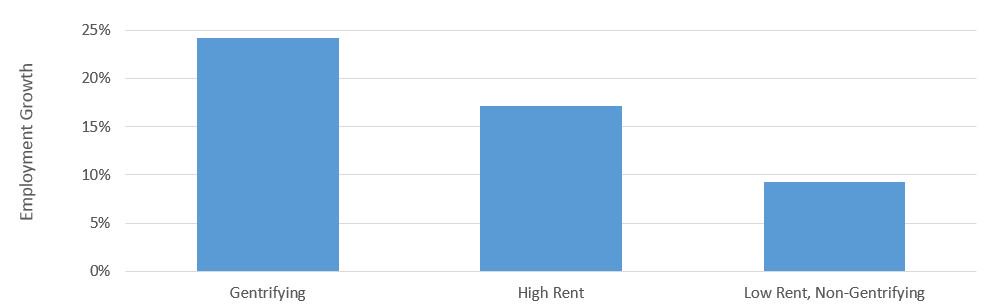
Comparing these gentrifying neighborhoods with both “high rent neighborhoods” and “low rent, non-gentrifying neighborhoods” (where increases in rent and/or educational attainment did not exceed the city median), revealed important differences in their economic fortunes. Specifically, from 2010 to 2015, gentrifying areas experienced explosive economic growth, with the number of local private sector jobs jumping by 24 percent. In comparison, local employment grew by 9 percent in low-rent, non-gentrifying neighborhoods and by 17 percent in high-rent neighborhoods (see Chart 2).
Chart 2: Local Job Growth, by Community Type, 2010-2015
United States Census Bureau. “LEHD Origin-Destination Employment Statistics.” 2015.
Drilling down to the individual neighborhood, 18 of the city’s 24 gentrifying areas experienced more than 10 percent job growth from 2010 to 2015. They were led by Claremont-Bathgate, where local employment more than doubled, and by Williamsburg, Central Harlem South, Kensington-Ocean Parkway, and Crown Heights South, where job growth exceeded 40 percent (see Chart 3).
Chart 3: Employment Growth in Gentrifying Neighborhoods
| NTA | Local Jobs 2010 | Local Jobs 2015 | Local Job
Growth |
| Claremont-Bathgate | 3,208 | 7,021 | 119% |
| North Side-South Side (Williamsburg) | 14,907 | 27,193 | 82% |
| Central Harlem South | 6,434 | 9,594 | 49% |
| Kensington-Ocean Parkway | 3,564 | 5,128 | 44% |
| Crown Heights South | 2,822 | 3,982 | 41% |
| Central Harlem North-Polo Grounds | 5,972 | 8,299 | 39% |
| Homecrest | 8,009 | 11,095 | 39% |
| Bedford (Stuyvesant) | 8,834 | 12,136 | 37% |
| Flatbush | 10,064 | 12,681 | 26% |
| East Williamsburg | 13,094 | 16,195 | 24% |
| Bushwick South | 6,906 | 8,469 | 23% |
| Woodlawn-Wakefield | 3,520 | 4,146 | 18% |
| DUMBO-Vinegar Hill-Downtown Brooklyn-Boerum Hill |
36,818 | 42,929 | 17% |
| Stuyvesant Heights | 2,802 | 3,242 | 16% |
| East Harlem South | 22,919 | 26,449 | 15% |
| Chinatown | 18,034 | 20,246 | 12% |
| Bath Beach | 2,614 | 2,896 | 11% |
| Hamilton Heights | 2,812 | 3,112 | 11% |
| Bushwick North | 10,105 | 10,907 | 8% |
| Madison | 7,225 | 7,750 | 7% |
| Schuylerville-Throgs Neck -Edgewater Park | 4,545 | 4,771 | 5% |
| Manhattanville | 6,180 | 5,567 | -10% |
| Grasmere-Arrochar-Ft. Wadsworth | 2,787 | 1,971 | -29% |
| Springfield Gardens North | 3,588 | 2,268 | -37% |
United States Census Bureau. “LEHD Origin-Destination Employment Statistics.” 2015.
Who’s being left behind?
While this surge in local employment offers distinct opportunities for neighborhood residents, too often, these benefits have not been forthcoming or have been inequitably distributed. New jobs, for instance, are rarely filled by people of color, even though they continue to represent the vast majority of local residents. As a consequence, the demographics of the local labor market have been remade even more dramatically than the local residential market. These business dynamics and employment disparities are important to grapple with, perhaps altering how we envision, define, and counteract the consequences of gentrification.
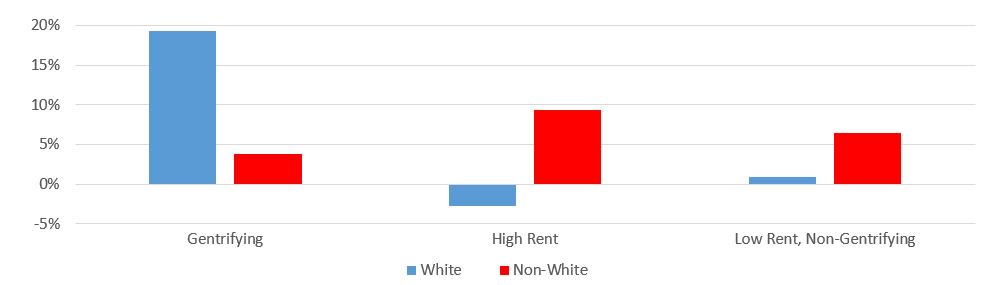
It is widely understood, for instance, that gentrification is accompanied by a significant change in the demographics of a neighborhood. This is clearly true in New York City, where growth in the local White population in gentrifying neighborhoods (up 19 percent) far outpaced high-rent (down 3 percent) and low-rent, non-gentrifying neighborhoods (up 1 percent). The non-White population, meanwhile, grew by a much smaller 4 percent in these gentrifying areas (see Chart 4).
Chart 4: Population Change, by neighborhood, 2010-2016
NYC DCP. “New York City Population FactFinder: Neighborhood Tabulation Area,” 2018.
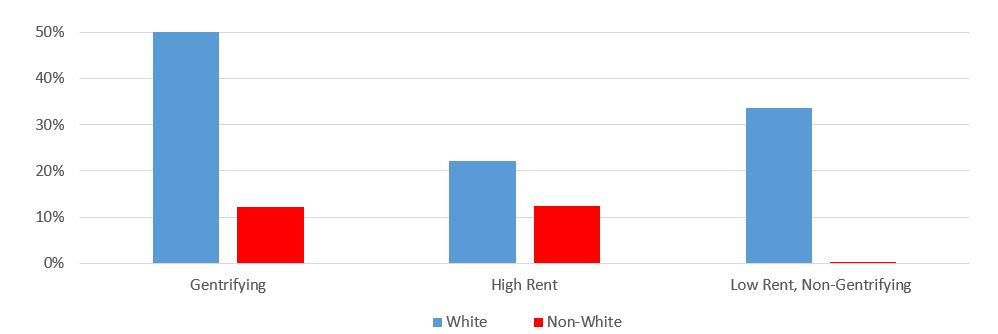
Less well documented, however, is the even more dramatic disparities in local employment. In gentrifying neighborhoods, for instance, the number of local jobs filled by White employees rose 50 percent while those for non-White employees rose by only 12 percent (see Chart 5).
Chart 5: Local Job Growth, by neighborhood and race, 2010-2015
United States Census Bureau. “LEHD Origin-Destination Employment Statistics.” 2015.
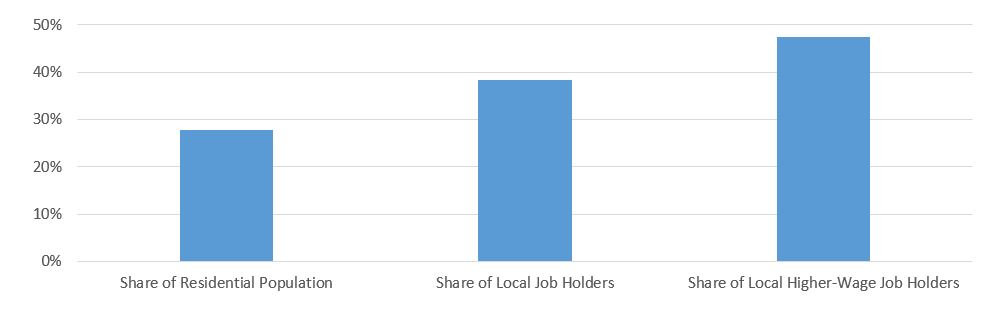
As a consequence of these employment disparities, people of color occupy a much smaller share of local jobs than they do local homes (see Chart 6). In the city’s 24 gentrifying neighborhoods, only 28 percent of the residential population is White, but 38 percent of all local jobs are filled by White employees, including 47 percent of higher-wage jobs (paying more than $40,000 per year).
Chart 6: In gentrifying neighborhoods, White people represent only 28% of the residential population, but hold 38% of local jobs and 47% of local higher-wage jobs (>$40,000/year)
Employment: United States Census Bureau. “LEHD Origin-Destination Employment Statistics.” 2015.
Residential: NYC DCP. “New York City Population FactFinder: Neighborhood Tabulation Area,” 2018.
Evidently, the effects of gentrification are more pronounced in employment trends than in residential trends. This is also true regarding turnover and displacement, a word that is often synonymous with gentrification.
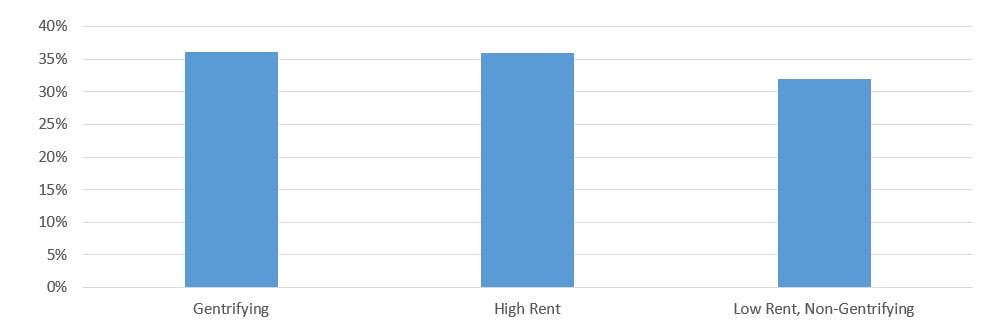
Whether gentrifying or not, residential turnover rates are actually fairly consistent. For instance, over 35 percent of residents have lived in their home for less than five years in both gentrifying and high-rent neighborhoods (see Chart 7). This corroborates research from several prominent scholars, who have found that gentrification is driven less by higher rates of turnover and more by the dramatic differences between in-migrants and out-migrants.
Chart 7: Share of Residents who have lived in their home for less than five years, by neighborhood
Residential: NYC DCP. “New York City Population FactFinder: Neighborhood Tabulation Area,” 2018.
By contrast, gentrification does appear to have a distinct effect on business turnover (see Chart 8). In gentrifying neighborhoods, 22 percent of local residents are employed in businesses that are less than five years old—nearly double the rate in the remainder of the city (13 percent).
Chart 8: Companies Less than Five Years Old, Share of Employment, by neighborhood

United States Census Bureau. “LEHD Origin-Destination Employment Statistics.” 2015.
These high turnover rates and employment disparities have a number of consequences for local residents.
As the local retail and restaurant corridor is dramatically remade, many long-time residents can feel estranged in their own neighborhood. Displacement, then, can be as much a psychological and existential phenomenon as a physical one.
And while local economic and entrepreneurial opportunities should boost incomes and help long-time residents to better afford their rent, this is too rarely the case. Without dramatic improvements in business development, job training, and job placement programs, residents of color will continue to be excluded from the local job boom and increasingly priced out of their homes and communities.
Where to go from here
To improve employment outcomes and address disparities, it is important to understand the nature of the labor market in gentrifying neighborhoods.
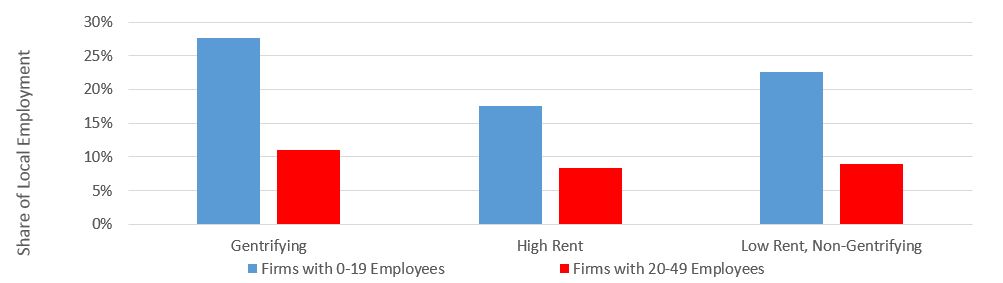
Importantly, the business ecosystem is heavily skewed toward small (less than 20 employees) and medium-sized firms (20 to 49 employees). Small businesses employ 28 percent of local employees in gentrifying neighborhoods and medium-sized businesses employ 11 percent. The corresponding figures are much smaller in the remainder of the city (see Chart 9).
Chart 9: In gentrifying neighborhoods, small- and medium-size businesses provide a larger share of local employment
United States Census Bureau. “LEHD Origin-Destination Employment Statistics.” 2015.
Many of the City’s workforce development programs, however, are heavily skewed toward placement at larger businesses, thus overlooking firms in gentrifying neighborhoods.[i] Without better targeting to these smaller firms, employment disparities in these neighborhoods will be left to fester. Medium-sized firms—where job openings are more plentiful, pay is higher, advancement opportunities are available, but HR departments are often small or non-existent—would particularly benefit from better training and placement services in partnership with the City’s workforce development agencies.
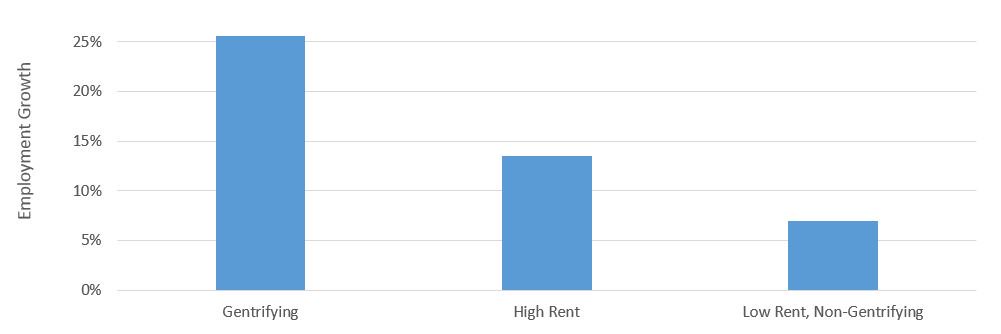
Youth training and employment programs, too, would benefit from a greater focus on medium-sized firms and gentrifying neighborhoods. The number of positions for New Yorkers under the age of 30 rose by 26 percent in gentrifying areas, compared to 13 percent in high rent neighborhoods and 7 percent in low-rent, non-gentrifying neighborhoods (see Chart 10).
Chart 10: Local job growth, positions filled by employees under 30, 2010-2015
United States Census Bureau. “LEHD Origin-Destination Employment Statistics.” 2015.
The growth in jobs held by those under 30 is largely driven by the industry mix in gentrifying areas. Job growth was particularly fast in arts and entertainment (82 percent increase), food services (73 percent), and retail (33 percent) businesses that all employ a large share of youth (see Chart 11).
Chart 11: Fastest Growing Industries in Gentrifying Neighborhoods
| 2010 | 2015 | Growth | |
| Arts, Entertainment, and Recreation | 2,707 | 4,931 | 82% |
| Accommodation and Food Services | 15,860 | 27,491 | 73% |
| Professional, Scientific, and Technical Services | 7,774 | 11,562 | 49% |
| Retail Trade | 22,618 | 30,061 | 33% |
| Construction | 8,165 | 10,694 | 31% |
United States Census Bureau. “LEHD Origin-Destination Employment Statistics.” 2015.
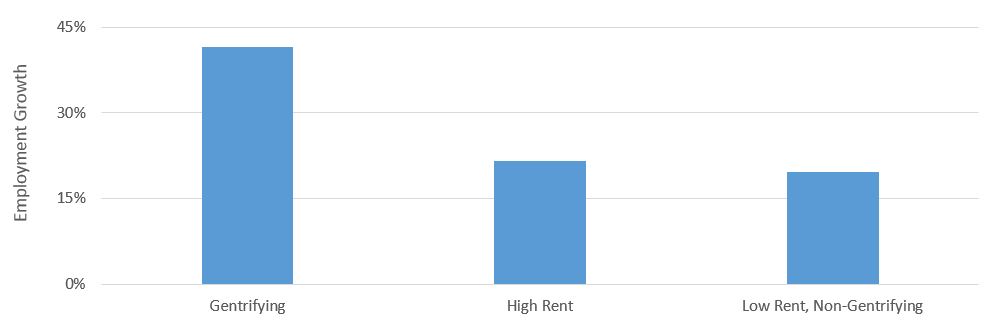
And while these industries are not always associated with high-wage employment opportunities, gentrifying neighborhoods did, in fact, see a significant upsurge in local jobs paying more than $40,000. The number of higher wage positions grew by 42 percent in gentrifying neighborhoods, compared to 22 percent in high-rent neighborhoods and 20 percent in low-rent non-gentrifying neighborhoods (see Chart 12).
Chart 12: Local Job Growth with Salary >$40,000, 2010-2015
United States Census Bureau. “LEHD Origin-Destination Employment Statistics.” 2015.
Clearly, good paying jobs abound in New York City. More than ever before, then, the imperative is not only for government to help “create” high-paying jobs, but also to ensure that New Yorkers of all races, ethnicities, incomes, and neighborhoods are sufficiently educated, trained, and prepared for these positions. Investments in basic education, ESOL, Career and Technical Education, early college, CUNY community colleges, and agency workforce development programs are of critical importance.
In 2014, the City released its Career Pathways plan to reform, reorient, and reinvigorate the City’s workforce development system. Under this plan, the City hoped to move from a “rapid attachment” model that emphasized matching a job-seeker with an immediate opportunity to one that favored skills-building, career advancement, and higher wage employment. City agencies would work more closely with industry to develop appropriate training and curriculum in order to help move workers up a career ladder and into higher paying jobs. The City also created the Mayor’s Office of Workforce Development to better oversee and integrate technical education, community college, adult education, and job training programs that span multiple agencies.
However, when the Administration last released its “annual” Career Pathways progress report two years ago, a number of the plan’s key recommendations were off-track. Most glaringly, as of FY17, only $7.5 million had been budgeted for “bridge programs”—which pair academic instruction with job training. This expenditure did not put the City on pace to reach its $60 million goal by 2020.[ii]
The Mayor’s Office of Workforce Development, meanwhile, has not had an Executive Director in six months, and has never been sufficiently empowered to set policy or funding priorities for the field or to ensure that workforce development contracts actually pay providers for the true cost of services.
To improve employment outcomes among city residents and address the glaring disparities throughout New York City neighborhoods—gentrifying or otherwise—it is essential that the City redouble its efforts to fund and implement its Career Pathways plan.
The City should also improve coordination among non-profit providers, particularly at the community level. The Lower East Side Employment Network (LESEN), a partnership of seven lower Manhattan workforce development providers and Community Board 3, should serve as inspiration.
LESEN was formed in 2007 to connect local job-seekers to new businesses and avoid antagonistic and duplicative business recruitment efforts. The Network streamlines business outreach and helps local employers recruit, hire, and retain quality candidates, access available subsidies and tax incentives, and develop customized training for new and existing employees.
The Mayor’s Office of Work Development should convene Community Boards and community-based organizations in every district to help build partnerships and cultivate a collaborative business outreach model that suits the needs and resources of individual neighborhoods. Appointing a Network Coordinator in every community district would represent a definitive step toward a more robust, integrated, and inclusive local economy.
Finally, the City can help preserve longstanding neighborhood businesses by developing a “re-entrepreneur” program and online portal. Given that half of business-owners in the New York City metro area are over 55 years old, support for business succession and resale has never been more urgent. Pioneered in Barcelona and Quebec, these programs help connect retiring small-business owners with aspiring entrepreneurs. Financial advisors rigorously evaluate the fiscal health of local companies and help retirees post their businesses to an online portal for potential buyers to peruse. When a match is made, program advisors help manage the transfer and provide business training for new owners. Introducing a Re-Entrepreneur program—as well as more effective entrepreneurship programs—can help preserve neighborhood anchors and maintain some continuity along New York’s fast changing business corridors.
Acknowledgements
Comptroller Scott M. Stringer thanks Adam Forman, Chief Policy & Data Officer and the lead author of this report. He also recognizes the important contributions made by David Saltonstall, Assistant Comptroller for Policy; Zachary Schechter-Steinberg, Deputy Policy Director; Angela Chen, Senior Web Developer and Graphic Designer; Frank Giancamilli, Director of Communications; Ilana Maier, Press Secretary; and Tian Weinberg, Press Officer.
Endnotes
[i] Messina, Judith. “Making The Connection: Aligning Small Businesses And The Workforce Development System,” Center for an Urban Future. October 2017.
[ii] Testimony provided at the November 27, 2017 New York City Council Oversight Hearing (Update on Career Pathways/Workforce Development Systems).