
A Message from the Comptroller
 Dear New Yorkers,
The New York City Board of Education Retirement System (BERS) has long been a global leader in stewarding the retirement BERS’s financial wellbeing in the face of climate change and the pervasive risks it poses to our economy. In my role as New York City Comptroller, it is my honor to continue advancing their efforts to address climate risk and work with my fellow trustees to uphold their stated commitments, consistent with our fiduciary duty. Safeguarding the retirement security of the current and retired public servants remains my top priority.
In 2023, BERS adopted an ambitious goal to reach net zero by 2040 (an elimination of financed greenhouse gas emissions throughout their investment portfolio) and laid out clear strategies for a just transition to a low-carbon economy aimed at – reducing our carbon footprint in direct response to the climate crisis. I am pleased to announce that the System has made meaningful progress on this goal, building on their previous climate action including a divestment from publicly traded fossil fuel reserves. This report provides an update as of the end of Fiscal Year 2025 for the BERS’s efforts to reach this goal.
The time has never been more urgent for addressing the threats of climate change to investment portfolios and the global economy. As a long-term and universal owner of financial assets globally, we know that confronting the growing climate risks and seizing the opportunities from the energy transition are a mandate. In the past year, extreme weather events have become an unfortunate norm, and the devastating impacts have left a trail of financial aftermath. At the same time, renewable energy and battery storage have become cost competitive compared to fossil fuel-based electricity production. According to the International Energy Agency, renewables provided one third of the global power generation in 2025. We believe these represent tremendous investment opportunities.
The progress BERS has made, which is laid out comprehensively in this report, is no easy feat. Federal policy and rhetoric pose numerous challenges for pension funds across the country, as legislators threaten to undermine efforts. Despite this, we continued to make progress towards the net zero goal. BERS’ Scope 1 and 2 financed emissions intensity decreased by 24.28% between Jun 30, 2024, and June 30, 2025, yielding a total reduction of 45.72% from the baseline of Dec 31, 2019.
To further the BERS’s overall goal of reducing their carbon footprint, the Bureau of Asset Management also engaged with over 100 publicly traded portfolio companies in the BERS’s portfolio to encourage swift action that will position their company to meet our current moment and take advantage of growing opportunities in the clean energy sector. Two of the largest banks in the world disclosed their energy supply ratios and methodologies after reaching settlement with BERS. The majority of our public market managers have plans that are aligned with BERS’ net zero expectations. BERS also expanded its investments in clean energy and climate solutions.
The following report is more than a standard annual update. It is a crucial tool that allows pension members and beneficiaries to grasp the full scope of our climate progress, efforts to mitigate climate risk throughout our investment portfolio, and we hope it serves as a model for other pension funds and institutional investors seeking ways to move forward on their climate action plans in the face of federal, statewide and local pressures.
It is my sincere commitment to continue moving the needle on meaningful climate action and working in partnership with trustees to maximize risk-adjusted returns while addressing the need for more investments to advance the climate transition. Achieving a just transition to a low-carbon economy is complex and requires deep collaboration between large investors, government, and other industries. The future depends on the work that we are doing right now and without both an intentional increase in our climate solution investments and an aggressive plan for supporting real economy decarbonization, the progress made in the past several years will be eroded.
And while we are encouraged by the progress we have made since the adoption of the 2023 net zero implementation plan, we know that we have much further to go if we are going to achieve net zero by 2040 to ensure a sustainable and resilient future and safeguard the retirement assets of the System for the generations to come.
Net zero by 2040 is no light goal, but we are determined to continue leading the charge on these efforts with a disciplined and prudent investment strategy, and our fiduciary duty as our guide because we know that failing to position our investment portfolio for the changing economy and world, will increase challenges in the future. I look forward to updating you next year, and to the progress we will continue to make, in the meantime.
Sincerely,

New York City Comptroller Mark D. Levine
| Summary of 2025 BERS Net Zero Actions |
| DISCLOSE Emissions and Risk |
| As of June 30, 2025, for the public markets, BERS’ Scope 1 and 2 financed emissions intensity was 44 tons of financed emissions / million dollars invested (FE/$m), marking a decrease of 24.28% from June 30, 2024. Compared to the December 31, 2019 baseline, BERS has observed a reduction of 45.72% in Scope 1 and 2 financed emissions intensity, against an interim target of 22% reduction by June 2025. BERS had surpassed its interim emissions reduction target for Scope 1,2 intensity for public equity and corporate bonds a year earlier in 2024, and has continued to decrease the footprint in FY2025 |
| As of June 30, 2025, BERS’ Scope 3 financed emissions intensity was 256.9, marking a decrease of 26.62% from June 30, 2024. |
| Active equity explains majority of the decrease in financed emissions for both Scopes 1 and 2 and Scope 3 for BERS in FY2025. |
| ENGAGE for Alignment and Action |
| In the last three years, BAM has engaged with over 100 companies on climate change. |
| By the end of fiscal year 2025, approximately 28% of the BERS’s financed emissions are covered by validated targets.
This figure is inclusive of the financed emissions of companies with targets validated by Science-Based Targets Initiative (SBTi) and the Global Steel Climate Council (GSCC) standard as well as those with commitments to have targets validated through either organization |
| In addition to engaging across the portfolio on science-based targets and other general decarbonization topics, BERS also works at a sector and systemic level to engage with high-priority industries and on critical cross-sectoral issues including focusing on utilities, hyperscalers and data centers, and the largest banks on the energy supply ratio.
The BERS Net Zero Implementation Plan included the exploration of alternative frameworks to measure and monitor the state and progress of net zero alignment of portfolio companies. In 2025, BAM implemented the alignment assessment for the Sytem’s listed equity and corporate fixed income portfolios using the NZIF 2.0, developed by Paris Aligned Investment Initiative (PAII). |
| All BERS’s 17 public markets managers submitted plans to align with the BERS’s net zero goal by adopting a net zero goal, science-based targets or acceptable alternative approach to support a transition to a net zero economy.
A substantial majority, or 65%, of the BERS’s public markets managers adopted net zero goals and/or quantified engagement or portfolio targets that apply to the BERS’s investments. A substantial majority, or 65%, of BERS’s public markets managers created new policies or practices or enhanced existing policies or practices to support decarbonization of their portfolio companies and assets as a result of the BERS’s net zero expectations. |
| INVEST in Climate Change Solutions |
| As of 6/30/25, BERS has a total of $726 million in invested and unfunded commitments in climate change solutions across all asset classes, after having surpassed the interim goal of $400 million by 2025 in FY 2024. The 2035 goal remains $1.8 billion.
BAM is reviewing strategies to maximize the impact of climate solution investments to advance BERS’s net zero goals while delivery superior risk-adjusted financial returns. |
Section 1: Disclose Emissions and Risks
1.1. Public Equity and Corporate Bonds Interim Scope 1 and 2 Emissions Reduction Targets and Annual Carbon Footprint Analysis
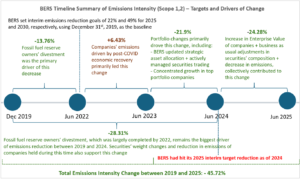
The emission intensity for BERS decreased during FY 2025, after surpassing the interim emission reduction target set for Jun 30, 2025. BERS’ Scope 1 and 2 financed emissions intensity decreased by 24.28% between Jun 30, 2024, and June 30, 2025, yielding a total reduction of 45.72% from the baseline of Dec 31, 2019. While we welcome this decrease in our portfolio’s footprint, it is important to understand and acknowledge the drivers of this change: most of this emission reduction is driven by portfolio and market changes (including changes in securities’ weight and increase in the valuation of companies) while actual company emission decreased as well. (See Section 1.2 for more detail on the attribution analysis.)
In our Net Zero Implementation Plan, BERS set targets to reduce the Scope 1 and 2 financed emissions intensity in our public equity and corporate bonds portfolio (including investment grade, high yield and convertible bonds) by 22% by 2025, 49% by 2030, and 100% by 2040, using a baseline of December 31, 2019. For these interim emissions reduction targets, BERS uses “financed emissions intensity” (tons of CO2 equivalent emissions/$million invested) based on Enterprise Value Including Cash (EVIC) as the primary metric for emissions. We also report, measure and evaluate changes in absolute financed emissions (which will be also referred to as financed emissions or FE in this report) and weighted average carbon intensity (WACI) (tons of CO2/$million sales) and strive toward comparable progress among all metrics. Scope 3 emissions and target-setting are discussed in the subsection further below. For definitions of Scopes 1, 2 and 3, please see Appendix A.
1.2. Public Equity and Corporate Bonds Annual Carbon Footprint Analysis
On behalf of BERS, BAM conducted an annual updated carbon footprint analysis of the BERS’s public equity and corporate bond portfolios and a blended benchmark portfolio. We do not yet have complete and accurate enough data for measuring greenhouse gases (GHGs) emissions in private markets. The analysis used holdings data as of June 30, 2025, and MSCI’s carbon footprint data and analytics (which includes PCAF-aligned metrics for 2025)[1]. Public equity and corporate bonds constituted 53% of BERS’ total assets as of June 30, 2025. Corporate bonds include investment grades and high yields.
1.2.1. Scope 1 and 2 – Financed Emissions and Intensity
During Fiscal Year (FY) 2025 BERS’ public portfolio emissions intensity experienced a much greater reduction than the blended benchmark, as depicted in Table 1. Most of this decrease was driven by portfolio level changes: business as usual changes in the actively managed securities and the concentrated expansion of low carbon intensity companies (e.g., the Magnificent Seven) in BERS’ portfolio value. It also helped that overall emissions in developed economies decreased in 2024.[2]
BERS’ public equity and corporate bonds’ absolute financed emissions also decreased more than that of the benchmark during FY 2025. Actively managed equities accounted for most of the reduction in BERS’s portfolio. Though, the financed emissions in the fixed income portfolios also decreased during this time. For the more detailed breakdown of Scope 1 and 2 financed emissions by asset class, see Appendix B.
Table 1: Public Equity and Corporate Bonds Scope 1 and 2 Financed Emissions Intensity and Absolute Financed Emissions
| BERS – Financed Emissions Intensity – Scope 1 and 2 | ||
| BERS Portfolio Tons carbon emissions/$m invested |
Blended Benchmark Tons carbon emissions/$m invested |
|
| 31-Dec-19 | 80.95 | 81.01 |
| 30-Jun-22 | 69.81 | 61.50 |
| 30-Jun-23 | 74.30 | 67.10 |
| 30-Jun-24 | 58.03 | 55.53 |
| 30-Jun-25 | 43.94 | 47.42 |
| Change % (2019-2025) | -45.72% | -41.46% |
| Change % (2024-2025) | -24.28% | -14.60% |
| BERS – Absolute Financed Emissions – Scope 1 and 2 | ||
| BERS Portfolio Tons carbon emissions |
Blended Benchmark Tons carbon emissions |
|
| 31-Dec-19 | 295,390 | 339,056 |
| 30-Jun-22 | 323,849 | 274,940 |
| 30-Jun-23 | 358,822 | 324,335 |
| 30-Jun-24 | 284,059 | 271,341 |
| 30-Jun-25 | 236,174 | 254,879 |
| Change % (2019-2025) | -20.05% | -24.83% |
| Change % (2024-2025) | -16.86% | -6.07% |
Source: Bureau of Asset Management
Like previous years, the highest emitting sectors in BERS’ portfolio are materials, utilities, energy, and industrials based on the Global Industry Classification Standard categorization, collectively representing almost 84% of financed emissions for Scope 1 and 2, as reported in Table 2 below. On behalf of BERS, BAM is actively engaging with portfolio companies in these high-emitting sectors (see more details in the engagement section).
Table 2: High Emitting Sectors – Financed Emissions (Scopes 1 and 2)
| BERS Portfolio – High Emitting Sectors’ Financed Emissions (Scope 1 and 2) | ||
| 2025 | 2024 | |
| Utilities | 30% | 32% |
| Materials | 22% | 24% |
| Energy | 16% | 18% |
| Industrials | 16% | 12% |
| Combined contribution of top 4 sectors | 84% | 86% |
Source: Bureau of Asset Management
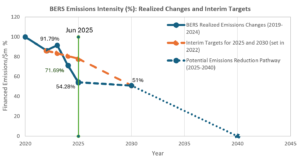
Figure 1 below shows the percentage of Scope 1 and 2 emissions reductions pathways for the public equity and corporate bonds portfolios each year to achieve the interim emissions reduction targets of 2025 and 2030 and net zero emissions by 2040. If we assume a linear emission reduction pathway, BERS surpassed the 2025 emissions reduction targets ahead of schedule (in 2024) and has continued to see further reduction in FY2025. We caveat that the emission reduction pathway required for the whole real economy to reach net zero by 2050 is nonlinear.[3] Figure 2 summarizes the timeline and drivers of emissions intensity changes between 2019 and 2025.
Fig 1: BERS – Realized and Projected Emissions Reduction Targets (Scope 1 and 2)
Source: Bureau of Asset Management
Fig 2: BERS – Timeline of Emissions Intensity (Scope 1 and 2)
– Milestones and Drivers of Change
Source: Bureau of Asset Management
1.2.2. Scope 1 and 2 Attribution Analysis of Financed Emissions
Last year, to further our understanding of the drivers of reduction in this emissions intensity between 2019 and 2024, we conducted a detailed attributional analysis[4] by separating the effect of each factor that affects the emissions intensity calculation one factor at a time from 2019 to 2024, assuming everything else is held constant. These factors include changes in portfolio positions, changes in coverage of emission data, changes in emissions in the real economy, etc. The analysis identified fossil fuel divestment as the biggest driver of emission reduction between 2019 and 2024. We conducted a similar attribution analysis for FY2025. To analyze the contribution of changes in financed emissions from portfolio position changes, we looked at these areas:
- Divestments: securities in the portfolio in 2024, but not in 2025. These sales are driven primarily by business-as-usual changes in in the BERS portfolio.
- New investments:securities that were not in the 2024 portfolio but are held in the 2025 portfolio.
- Securities that were held between FY 2024 and FY 2025: for these securities, we broke down the marginal effects of changes in individual factors (company emissions, EVIC, weight, and portfolio coverage) that changed portfolio financed emissions. The interaction term captures the residual portion that cannot be explained by changing factors individually.
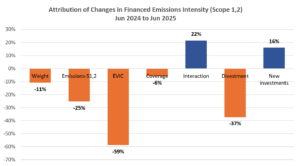
Figure 3 summarizes the findings of the attribution analysis. Business as usual changes (buying and selling of securities) had the largest effects on financed emission changes in FY2025. Changes in companies’ valuation/EVIC and decrease in actual company emissions also affected the drop of financed emissions.
Fig 3: BERS – Attribution Analysis of Change in Emissions Intensity
(Scope 1 and 2) – Jun 2024 to Jun 2025
Source: Bureau of Asset Management
1.2.3. Scope 3 – Financed Emissions and Intensity
During FY 2025, BERS’ Scope 3 public portfolio emissions intensity experienced a much greater reduction than the blended benchmark, as depicted in Table 3.
The absolute financed emissions of BERS’ public equity and corporate bonds also decreased more than that of the benchmark during FY 2025. Actively managed equities accounted for most of the reduction in BERS Scope 3 financed emissions during FY 2025, while fixed income related financed emission increased during this time. For the more detailed breakdown of Scope 3 financed emissions by asset class, see Appendix C.
Table 3: Public Equity and Corporate Bonds Scope 3 Financed Emissions and Intensity
| BERS – Financed Emissions Intensity – Scope 3 | ||
| BERS Portfolio Tons carbon emissions/$m invested | Blended Benchmark Tons carbon emissions/$m invested | |
| 30-Jun-22 | 292.94 | 383.90 |
| 30-Jun-23 | 406.80 | 428.90 |
| 30-Jun-24 | 350.11 | 361.20 |
| 30-Jun-25 | 256.90 | 318.60 |
| Change % (2024-2025) | -26.62% | -11.79% |
| BERS – Absolute Financed Emissions – Scope 3 | ||
| BERS Portfolio Tons carbon emissions | Blended Benchmark Tons carbon emissions | |
| 30-Jun-22 | 1,363,932 | 1,716,811 |
| 30-Jun-23 | 1,965,756 | 2,072,283 |
| 30-Jun-24 | 1,713,932 | 1,764,999 |
| 30-Jun-25 | 1,380,816 | 1,712,449 |
| Change % (2024-2025) | -19.44% | -2.98% |
Source: Bureau of Asset Management
1.2.4. Decision Around Target Setting on Scope 3 Financed Emissions
The BERS’s Net Zero Implementation Plan created in 2023 committed BAM to “annually measure, assess and report progress in Scope 3 emissions beginning with 2022 data, with a focus on high emitting sectors and sectors and companies where Scope 3 is material” and to “set interim Scope 3 emissions reduction targets by 2025 as data availability and quality improve.” Investors have focused on Scope 3 emissions because they capture the emissions coming from companies’ whole value chain, whether from upstream (e.g., extraction, processing, manufacturing, transport and distribution for a consumer-electronics company) or downstream emissions (e.g., the lifetime emissions of vehicles sold by an automotive company). Scope 3 emissions can represent over 90% of a company’s Scope 1, 2, and 3 emissions.[5]
For Scope 3 data to guide BAM’s corporate engagement and communicate status and progress to our stakeholders, they need to accurately represent emissions in portfolio companies’ value chain, and changes in the data need to represent efforts that portfolio companies or BAM makes vs factors outside of companies’ or our control. Unfortunately, at this point, Scope 3 data do not meet these criteria. Reported Scope 3 data are limited, have a high degree of estimation, and cover few of the material categories. The graph below illustrates these points.[6]
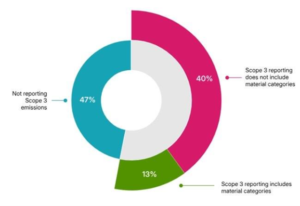
Given the current sparse reporting of Scope 3 emissions, changes in the data could come from an increased number of companies reporting their emissions differently than the previously estimated data by data providers, increased categories that companies report, or actual changes in Scope 3 emissions. Only the last category is meaningful for BAM’s objectives.
Another challenge with Scope 3 emissions at a portfolio level is the same emissions by a real economy activity can be counted multiple times. Using a portfolio containing a carmaker, an oil & gas company, a car leasing company, and a bank providing financing for all three companies above as an example, the emissions from driving a car will be captured by the Scope 3 emission of the carmaker, the oil & gas company, the car leasing company, and the bank. The Scope 3 emissions of the bank would capture the Scope 1, 2, and 3 emissions of the three real economy companies. Setting Scope 3 targets at a portfolio level could lead to unintended actions that are not necessarily the best outcome to reduce real economy emissions[7].
Recognizing these challenges, the guidance on Scope 3 emissions by Net Zero Asset Owner Alliance and the Net Zero Investment Framework developed by the Paris-Aligned Investor Initiative does not require target-setting on Scope 3 emissions and suggest reporting Scope 3 data separately from that of Scope 1 and 2. The practices around Scope 3 emissions of multiple asset managers surveyed by BAM are consistent with the guidance.
There are alternative metrics to capture the emissions associated with companies’ value chain. For downstream emissions that are material to sectors such as extractive mining and automakers, these metrics could be low-carbon product mix, use phase efficiency, and customer engagement metrics. For upstream emissions that are material to sectors such as retailers and food producers, these metrics could be percentage of recycled materials used, energy intensity of purchased goods, and percentage procurement from low-emission suppliers.
BAM commits to explore the most effective ways to reduce Scope 3 emissions in 2026. We plan to engage with market leaders and peer asset owners on what is needed to make disclosure of and manage material categories of Scope 3 emissions a market standard. We will do more systematic Scope 3 engagement after we understand the best practices and our ability to effect change.
Section 2: Public Portfolio Company Engagement
BERS’s Net Zero Implementation Plan articulates the core role that corporate engagement plays in reaching Net Zero. BERS intends to be a partner with portfolio companies throughout their journey to net zero.
In the last three years, BAM has engaged with over 100 companies on climate change. It was the first time that BAM engaged with most of these companies on any issue.
2.1. Science-Based Target Goal
In the Net Zero Implementation Plan, BERS set an interim goal of 70% of scopes 1 and 2 financed emissions to be covered by science-based targets by FY 2025. This goal has not been met. By the end of FY 2025, approximately 28% of the BERS’s financed emissions are covered by validated targets.
This figure is inclusive of the financed emissions of companies with targets validated by Science-Based Targets Initiative (SBTi) and the Global Steel Climate Council (GSCC)[8] standard as well as those with commitments to have targets validated through either organization. BERS evaluated GSCC and determined it meets its needs as a robust target setting protocol given both its methodological design and requirement for third-party validation.
Several factors prevented the adoption of acceptable science-based targets among the highest emitting companies, including the lack of validating entities beyond SBTi, the lack of protocol for high-emitting sectors, and ongoing political challenges. In 2025, BAM on behalf of BERS submitted comments to SBTi during its public consultation for its revised Corporate Net Zero Standard (CNZS). It is BAM’s view that while SBTi remains best-in-class for target setting, it is unfortunately not well-suited for use by the highest emitting companies and sectors, particularly those in North America. An excerpt from BERS’s comments on the first public consultation for the revised standard states:
Currently, there is limited SBTi adoption among companies in the most critical sectors. Many such companies currently have voluntary net zero commitments that are not validated or backed with science-based interim targets, which weakens the meaning of net zero and does not facilitate progress towards limiting global temperature rise. The proposed revisions to the [Corporate Net Zero Standard] CNZS and its relationship to the sector-specific standards will likely make this situation more pronounced.
As written, it is unlikely that the highest emitting large companies… will utilize this standard.
Given the trust that SBTi has among investors and other stakeholders, identifying a way to grow the tent rather than shrink it is critical to achieving the economy-wide results that are necessary to limit global temperature rise.
We still believe that setting and managing to targets that are aligned with 1.5 degree and well-below 2 degree goals are critically important actions for a company to take. Our expectation remains that portfolio companies will set science-based targets, but BERS is adjusting its approach because of the reality on the ground.
Given the limitations of the SBTi framework for the highest emitting companies in 2025, BERS began reviewing additional ways to evaluate and differentiate among portfolio companies using other metrics and assessments with the Net Zero Investment Framework being one of them.
2.2. Net Zero Investment Framework (NZIF)
The BERS Net Zero Implementation Plan included the exploration of alternative frameworks to measure and monitor the state and progress of net zero alignment of portfolio companies. In 2025, BAM implemented the alignment assessment for the Sytem’s listed equity and corporate fixed income portfolios using the NZIF 2.0, developed by Paris Aligned Investment Initiative (PAII). For these markets, the graph from PAII below shows the criteria underpinning the NZIF alignment assessment:
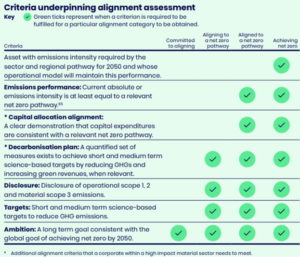
Source: The Institutional Investors Group on Climate Change
BAM chose to implement this alignment assessment for a few reasons:
- The NZIF framework captures a range of actions companies can take to decarbonize beyond science-based targets, which BAM can engage on. For example, a company could have capex spending on decarbonization without setting short- and medium-term science-based targets. Using this framework, BAM has compiled and analyzed decarbonization actions leading companies in a sector are taking and can use the information to engage with other companies in the same sector. BERS expects that this will allow for focused engagement around topics specific to one sector. BERS will also be able to differentiate at a more granular level among peer companies.
- Many asset managers have developed in-house alignment assessment methodologies using the NZIF framework to support their investment and engagement. The framework is also widely used by peer asset owners.
- The NZIF framework is consistent with other key assessments such as the Climate Action 100+ Net Zero Company Benchmarkand Climate Engagement Canada Net Zero Benchmark. Holistically, the components of this framework are already covered in collective engagements.
The NZIF guidance states that “NZIF outlines the key components of a net zero strategy and transition plan that an investor can consider… It is only a guide, not a prescriptive protocol, nor a standard, and it is not a reporting framework.” For example, there is no widely accepted definition of what a good decarbonization plan is, or how to measure capital allocation alignment. Data on companies’ targets and capex is generally lacking. The criteria described above are most suitable for higher-emitting sectors, not so much for pure play renewable or electric vehicle companies, such as Orsted and Tesla Orsted and Tesla do not set climate targets or disclose their emissions, which would disqualify them from being assessed as “Achieving Net Zero” even when their emission intensity meets the net zero pathways.
In next year’s Annual Climate Report, we plan to communicate specific engagement goals and targets to supplement existing targets.
2.3. Ongoing Systemic and Sectoral Engagement
In addition to engaging across the portfolio on targets and other general decarbonization topics, BERS also works at a sector and systemic level to engage with high-priority industries and on critical cross-sectoral issues.
2.3.1. Engagement on Utilities
Utilities remain a critical lynchpin to economy-wide decarbonization. For FY 2025, utilities were responsible for approximately 30% of BERS’s financed emissions. For two years, BAM served as a stakeholder advisor to the Electric Power Research Institute’s (EPRI) effort to design an alternative target setting methodology called SMARTargets. During that period, BAM also served as lead investor for the topic of science-based targets among Climate Action 100+ (CA100+) signatories primarily to engage with the highest emitting US utilities on targets and other topics and is now the CA100+ co-lead investor for engagement with American Electric Power (AEP). BAM has assessed that EPRI SMARTargets is unfortunately not likely to fill the need for a decision-useful target-setting protocol that produces validated targets aligned with pathways that limit warming to 1.5 degrees and could present an unacceptable greenwashing risk. In comments to SMARTargets during the public consultation process, BAM articulated several of the core issues:
As large, diversified funds with broad exposure across the global economy, [BERS has] direct economic interest in the overall strength of the financial markets and broader economy in which [we] invest. With obligations to our beneficiaries that extend for decades, we are obligated to attend to long-term risks and opportunities. We have a fiduciary duty, therefore, to protect against downside and systemic risks and foster stable financial markets and long-term economic growth essential to the performance of [BERS’s] investments. [BERS] has in place a set of plans and policies reflective of our Investment Belief that our role as a fiduciary obligates us to “mitigate the risks, take advantage of opportunities, and reduce the contributions our investments make to climate change.” One such policy, in line with our fiduciary obligation, is a short-term goal for the highest emitting public portfolio companies to set science-based emissions reductions targets to “increase[e] the alignment of our investments with science-based pathways to limit global warming to 1.5⁰ C.”
The science-based methodology that SMARTargets puts forth is not consistent with this approach. SMARTargets integrates climate science findings with a company’s economic and business considerations under the umbrella of scientific rigor. This could result in misleading claims of alignment with science and be challenging for stakeholders who are assessing targets based on the targets’ climate alignment.
While we agree that economic efficiency is important and understand that utilities need to manage issues of affordability, reliability, equity, and resiliency within particular regulatory frameworks, the starting-point of a standardized methodology to develop targets should be emissions reductions …SMARTargets fundamentally redefines what constitutes “science-based” methodology by incorporating economic considerations as scientific requirements… [examples include SMARTargets approach to] “[a]ccounting for and informing the multiple social priorities that a company is responsible for beyond decarbonization, such as affordability and reliability” and [c]onsidering “differences in decarbonization opportunities due to differences in, among other things, assets, markets, regulatory structure.” These are fundamentally economic and business considerations, not climate science findings. Yet SMARTargets presents them as emerging from “assessment of all the relevant science” and labels them as “scientific requirements.”
BERS continues to expect its portfolio companies to set science-based emissions reductions targets. In October 2025, then-Comptroller Brad Lander convened a roundtable focused on addressing the need for a mutually agreeable framework for setting and assessing emissions reductions targets in the utility sector. This roundtable was attended by over 60 institutions with representation from asset owners, asset managers, utilities, and service providers.
There are some strong and positive elements to EPRI SMARTargets, such as the focused transition planning process, and there seems to be opportunity for alignment around different metrics and assessments. In 2026, BERS engagement will focus on the identification of metrics that demonstrate interim goals, which their investors can track. BAM is also working with nonprofits and research entities (such as Rocky Mountain Institute, Center for Climate and Energy Solutions, etc.) to assess a company’s existing disclosures and to determine how future SMARTargets outputs, disclosed as part of a formal SMARTargets process, might allow investors to track portfolio companies’ emissions trajectories and emission reduction targets.
Utilities face significant challenges as they decarbonize because of the exponential load growth driven by AI, reshoring, and electrification. BERS remains concerned about utilities’ greenwashing and representing their targets in a way that is inconsistent with global consensus definitions and frameworks, which poses reputational and litigation risks. BERS will continue to address these risks with our portfolio companies through engagement.
2.3.2. Engagement on Data Centers and AI
BERS is increasingly concerned about the increasing carbon emissions of and electricity costs caused by AI-driven data centers and is engaging with both utilities and increasingly with hyperscalers on this issue. In their own 2025 disclosures, the largest technology companies reported significant increases in emissions in the last several years. For example:
- In 2025, Microsoft reported a 23.4% increase in emissions since 2020.[9]
- Amazon reported its first emissions increase since 2021(+6%).[10]
- Google reported that its “ambition-based emissions” grew 11% in 2025, which is a 51% increase compared to 2019.[11]
BERS will be engaging with the largest tech companies on this alarming trend and are calling on these companies to disclose additional information to their investors. We expect companies to take all steps, including during contracting, to protect ratepayers, shareholders, and live up to their climate commitments in a way that does not result in economy-wide emissions increases.
2.3.3. Engagement on Banks
In 2025, BERS also continued its engagement with the largest North American banks on the Energy Supply Ratio. After reaching a settlement with BERS in 2024 concerning BERS’ shareholder proposal, JP Morgan and Citigroup disclosed their energy supply ratios and methodologies. JP Morgan and Citigroup used vastly different approaches in designing the methodology for their energy supply ratio, reflective of the two banks’ different approaches to disclosures and managing risk associated with those disclosures.
- As a result of different design choices, the published Ratios are not comparable to one another.
- JP Morgan’s choices led to the publication of a ratio that paints the bank in a more favorable light from a climate perspective, while Citi went the opposite direction. In fact, while JPM’s self-published ratio is higher than its Bloomberg New Energy Finance-calculated ratio, Citi’s is lower.
In the next year, investors will be able to track each bank’s progress against its own previously published ratios but will not be able to use these disclosures to compare peers. Royal Bank of Canada (RBC), who also reached settlement with BERS in 2024, was unable to disclose its ratio but did disclose its methodology for constructing its ratio.
In 2025, BERS re-filed proposals at Bank of America, Goldman Sachs, Morgan Stanley, and Wells Fargo. At Bank of America, the proposal received 16.4% of the vote, at Goldman Sachs 15.1%, at Morgan Stanley 13%, and at Wells Fargo 18%.
Section 3: Asset Managers: Net Zero Plans by 2025
BERS’ Net Zero Implementation Plan set expectations for our asset managers to align as best as possible with BERS’s net zero goal:
- Public markets asset managers were expected to have a net zero goal, science-based targets, or acceptable alternative approach to support a transition to a net zero economy, and an implementation plan covering, at a minimum, assets managed for the System, by June 30, 2025 and submit summary plans for their goals and strategies by that date.[12]
- Private markets managers are expected to meet the same expectations for commitments BERS makes from July 1, 2025 onward.
3.1 Summary of Assessment of Public Markets Asset Managers’ Plans
By June 30, 2025, all of BERS’ 17 public markets managers submitted plans to align with the BERS’s net zero expectations. This successful response followed extensive engagement of all public markets managers by BAM beginning in 2023 continuing through 2025. During this time, BAM communicated with all of BERS’ current managers, in writing and through meetings, to ensure they were aware of the Systems’ Net Zero by 2040 expectations and encourage them to align with the expectations, consistent with fiduciary duty and their investment objectives. In addition, in April 2025, BAM sent guidance to all public markets managers highlighting key elements to consider as they developed their goals and plans. Please see further below for a summary of this guidance.
BAM closely reviewed and assessed every manager’s plan to evaluate how well they align with the BERS’s net zero expectations, considering differences across managers and their investment strategies. For most managers, BAM held individual meetings to provide feedback and ask clarifying questions to support them in improving their plans. BAM also engaged managers on how their plans were consistent with fiduciary duty and the objective of delivering optimal investment performance for the BERS’s beneficiaries.
Based on BAM’s initial assessment in 2025, 94% (16 of 17) of public markets managers’ plans were aligned with BERS’s net zero expectations. BlackRock was assessed as insufficiently aligned.
In November 2025, then-Comptroller Lander submitted a memorandum[13] to the Board of Trustees of the System providing the rationale for the assessment of BlackRock and recommending that the System put BlackRock’s mandates for U.S. equity index funds totaling $1.9 billion out to bid.
3.1.1. Summary of BAM’s Assessment Framework
BAM assesses managers’ plans primarily on whether they have a systematic approach to engage portfolios companies to drive real economy decarbonization in line with best available science on achieving the 1.5° C ambition of the Paris Agreement where feasible and consistent with fiduciary duty. BAM’s guidance to managers emphasizes this core expectation:
Asset managers should not exclude or select investments (portfolio companies or assets) for the purpose of meeting these expectations unless doing so is fully consistent with the manager’s fiduciary duty and the relevant fund’s investment objectives and standards. The Systems seek to support real economy decarbonization which cannot be achieved through portfolio decarbonization alone but requires broad engagement of investments to appropriately transition.
In addition, BAM does not seek a single approach for all managers but evaluates what is appropriate based on asset class, investment strategy, industry, geography, market factors, resources and other characteristics of the asset manager, portfolio companies and underlying assets.
BAM also encourages managers to consider established industry frameworks on net zero alignment such as the STBi, NZIF, CA100+ Net Zero Company Benchmark, Transition Pathway Initiative (TPI), Net Zero Aset Owners Alliance (NZAOA) publications, and the Private Markets Decarbonization Roadmap (PMDR)[14]. Many of the BERS’s managers use, or have begun to use, one or more of these frameworks to inform their approach to decarbonization.
BAM assesses managers based on key elements highlighted in BAM’s guidance. First, BAM assesses whether the manager has a net zero goal or science-based targets that apply to the BERS’s assets. If the manager has such a goal or targets, BAM will generally view the manager as aligned with the BERS’s expectations but will continue to assess the manager on whether it demonstrates a systematic approach to stewardship. BAM also assesses every manager on whether they incorporate material climate change-related risks and opportunities in investment-decision making, including due diligence and portfolio management.
Second, if the manager has not adopted a formal net zero goal or science-based targets, BAM will assess whether the manager has an acceptable alternative approach to support a transition to a net zero economy. In this assessment, BAM places particular weight on the manager’s approach to stewardship given the emphasis of the BERS’s net zero expectations on real economy decarbonization. Specifically, BAM assesses the following aspects of managers’ stewardship and engagement approaches:
- Focus List and Engagement Target: Does the manager have a clear rationale and process for identifying companies to prioritize for engagement (e.g. creating a focus list)? Does the manager have a quantified portfolio coverage target such as the NZIF-recommended target of 70% of financed emissions (Scope 1 & 2) of investments managed on behalf of the Systems increasing to 90% of financed emissions (Scope 1, 2 & material 3) by 2030?
- Systematic Engagement on Climate Practices: Does the manager have a systematic approach to engage companies to achieve continuous improvement in their practices to address climate risks and opportunities? Does the manager consider engaging companies to adopt the following important climate practices?
| Governance | Emissions Measurement | Quantified Climate Ambition |
| Transition Plan | Capital Expenditures Alignment | Performance on climate goals |
| Climate Risk Disclosures | Lobbying Alignment | Just Transition |
BAM expects, and communicates with managers, that portfolio companies will increase and improve their climate practices on different timelines and paces. While it is not expected that all companies will necessarily be able to adopt all the climate practices during the manager’s holding period, BAM encourages managers to make best efforts to encourage companies to be on a pathway to adopting all the practices.
BAM also assesses how managers monitor portfolio companies’ progress, consider escalation measures when engagement is not successful, and have a coherent proxy voting policy as it relates to climate. Lastly, BAM assesses the manager’s willingness to provide annual reporting on engagement activities conducted under the plan. As of the writing of this report, BAM is in the process of finalizing more detailed guidance on how managers can provide annual reporting on their climate-related engagement activities.
When a manager lacks an approach on any of the elements summarized above, BAM engages the manager to seek clarification and encourages the manager to adopt an appropriate policy or practice. Virtually all managers have been responsive and willing to develop new practices, as needed, to meet the BERS’s expectations, consistent with fiduciary standards.
3.1.2. Highlights of Public Markets Managers Net Zero Alignment Approaches
Substantial Majority Managers Adopted a Net Zero Goal, Science-Based Targets, and/or Quantified Targets to Support a Net Zero Economy
As described above, the System set expectations for managers to adopt a net zero goal, science-based targets, or acceptable alternative approach to support a transition to a net zero economy. Where a manager does not have a formal net zero goal or science-based target, they are expected to demonstrate a systematic approach to stewardship on decarbonization including a clear process for prioritizing companies for engagement and systematically engaging companies toward continuous improvement on decarbonization practices.
Best practice for this includes adopting quantified targets for engagement and/or portfolio net zero alignment. As noted earlier, BAM specifically encourages managers to consider a quantified portfolio coverage target of 70% of financed emissions (Scope 1 & 2) of investments managed on behalf of the Systems, increasing to 90% of financed emissions (Scope 1, 2 & material 3) by 2030. These targets may also include goals to increase the percentage of the portfolio that is advanced on decarbonization. This is consistent with guidance of NZIF.
As an example, a corporate bonds asset manager for BERS set an aspirational quantitative target for a significant percentage of its engagements to be with the highest emitters in the portfolio. The engagement is based on a framework to assess comprehensive ESG risks and focuses on timelines and targets for addressing these risks and an assessment of whether any targets are achievable and prudent.
The following graph shows the numbers and percentages of managers that adopted net zero goals and/or quantified engagement or portfolio targets.
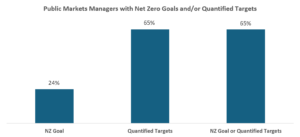
Source: Bureau of Asset Management as of December 2025
Note: Net Zero Goals include managers with science-based targets.
- A substantial majority, 65% or 11, of the BERS’s public markets managers adopted net zero goals and/or quantified engagement or portfolio targets that apply to the BERS’s assets.
- 65% or 11 of public markets managers adopted quantified engagement targets. This means the manager adopted targets identical or similar to those recommended by NZIF, i.e., engaging 70% of financed emissions (Scope 1 & 2) of investments increasing to 90% of financed emissions (Scope 1, 2 & material 3) by 2030.
- 24% or 4 of public markets managers adopted net zero goals.
- The number of managers with net zero goals and/or quantified targets is fewer than the sum of managers with net zero goals and managers with quantified targets. This is because some managers have both net zero goals and quantified targets.
- All four managers with net zero goals have quantified targets.
- 7 managers have quantified targets but do not have net zero goals.
- The total number of managers that have quantified targets includes three funds of funds managers. BAM counts these managers as having quantified targets based on their plans to engage 100% of their submanagers on the net zero expectations.
The next two graphs show the numbers and percentages of managers with net zero goals and/or quantified engagement or portfolio targets broken down by public equity and fixed income managers. Note that some managers have mandates with BERS to invest in both public equity and fixed income. BERS has 14 managers for public equity mandates and 6 managers for fixed income mandates. BAM assessed all managers for how they approached all applicable mandates.
The following graph shows the numbers and percentages of managers in Public Equity that adopted net zero goals and/or quantified engagement or portfolio targets. BERS has 14 total managers that manage public equity mandates for the System.
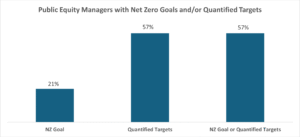
Source: Bureau of Asset Management as of December 2025
- A majority, 57%, of BERS’s public equity managers adopted net zero goals and/or quantified engagement or portfolio targets that apply to the BERS’s assets.
- 57% of public equity managers adopted quantified engagement targets.
- 21% of public equity managers adopted net zero goals.
The following graph shows the numbers and percentages of managers in Fixed Income that adopted net zero goals and/or quantified engagement or portfolio targets. BERS has 6 managers that manage fixed income mandates for the System.
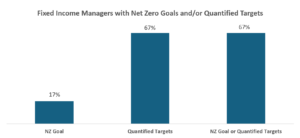
Source: Bureau of Asset Management as of December 2025
Substantial Majority of Managers Created New Practices or Enhanced Existing Practices
Most managers created new policies or practices or enhanced existing policies or practices, consistent with fiduciary standards, to meet BERS’s net zero expectations. The following graph shows the numbers and percentages of managers that created or enhanced policies or practices because of BAM’s engagement on BERS’s behalf.
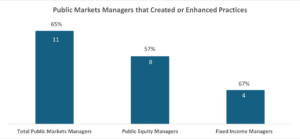
Source: Bureau of Asset Management as of December 2025
Note: The percentages shown are only for the corresponding category of managers.
- A substantial majority – 65% or 11 – of BERS’s total public markets managers created new policies or practices or enhanced existing policies or practices as a result of the BERS’s expectations.
- A substantial majority of public equity managers – 57% of public equity managers – created or enhanced policies or practices.
- A substantial majority of fixed income managers – 67% of fixed income managers – created or enhanced policies or practices.
- All four of the public markets managers that have net zero goals for BERS’s assets adopted these goals because of BERS’s net zero expectations.
The new or enhanced practices of other managers include measuring and reporting financed emissions, conducting new or additional tracks of engagement of companies to support decarbonization, and assessing and monitoring the net zero alignment of companies. The BERS’s fund of funds managers in Public Equity and Fixed Income also created new practices to communicate BERS’s net zero expectations to their submanagers and assess, engage and monitor submanagers on their decarbonization efforts and progress.
3.1.3. Highlights of Private Markets Managers Net Zero Alignment Approaches
As described above, private markets managers are to meet the same expectations for commitments BERS makes from July 1, 2025, onward. Since the implementation of expectations for private markets funds through December 31, 2025, BERS committed to three private markets funds, all of which have aligned with the net zero expectations. BAM provides guidance to every private market manager approved for due diligence on how to align with the BERS’s expectations. BAM reviews and assesses every manager’s plan, considering differences across asset managers and their investment strategies including whether they are a control or non-control investor. In most cases, BAM meets with asset managers to provide feedback and support on improving their plans. BAM also engages managers on how their plans are consistent with fiduciary duty and the objective of delivering optimal investment performance for the BERS’s beneficiaries.
BAM’s guidance and assessment framework for private markets managers is very similar to that of the public markets managers described earlier. When economically feasible and consistent with fiduciary duty, managers are expected to pursue value creation strategies with investments to drive real economy decarbonization in line with best available science on achieving the 1.5° C ambition of the Paris Agreement. Managers should also track portfolio companies and assets on their decarbonization maturity and have a clear process for prioritizing engagement of companies to continuously advance their practices.
3.2. Monitoring and Engagement of Managers’ Assessment of Climate-Related Risks and Opportunities
BAM regularly monitors and assesses managers on environmental, social, and governance (ESG) policies and practices, including climate-related practices, with an annual ESG questionnaire. The questionnaire includes specific questions related to climate and net zero alignment on topics such as:
- Measurement and reporting of Scope 1, 2, and 3 GHG emissions
- Utilizing decarbonization as a strategy for value creation
- Assessment of the resilience of portfolio companies or assets in different warming scenarios
- Assessment of physical climate risk, transition risk, biodiversity-related impacts and dependencies, deforestation risk, water-related risk and environmental justice.
BAM received responses from 108 managers for 278 funds that represent 97% of BERS’ AUM.
For GHG emissions disclosure, about 39% of managers covering 26% of BERS AUM stated they measure and report Scope 1 and 2 emissions for all investments. 33% of managers covering 20% of the AUM stated they measure and report Scope 3 emissions for all investments.
3.2.1. Decarbonization as a Strategy for Value Creation
Many of BERS’ managers use decarbonization as a strategy for value creation as shown by the following graph per the percentages of BERS’ AUM across all asset classes.
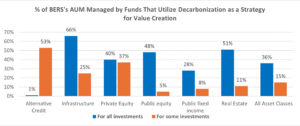
Source: Bureau of Asset Management as of June 2025
3.2.2. Assessment of Physical Climate Risk
The following graph shows the percentages of BERS’ AUM that report systematic assessment of physical climate risk in investment due diligence, research and monitoring across all asset classes. Physical climate change risks include risks to property, assets, infrastructure and business operations from extreme weather events and longer-term changes and variability in weather, weather patterns and associated conditions.
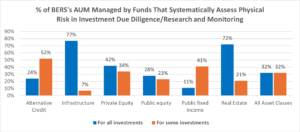
Source: Bureau of Asset Management as of June 2025
A substantial majority of the AUM in real estate and infrastructure is managed in funds that systematically assess physical risk in investment due diligence, research, and monitoring. BAM addresses physical climate risk assessment when conducting due diligence, monitoring and engagement of asset managers, particularly in the real estate and infrastructure asset classes.
3.2.3. Assessment of Climate Transition Risk
The following graph shows the percentages of BERS’ AUM that report systematic assessment of climate transition risk in investment due diligence, research, and monitoring in all asset classes. Transition risks are those associated with the transition to a lower-carbon economy such as changes in technology, policy, market conditions and consumer preferences. This includes the risks of higher emissions in a company’s or asset’s business activities and value chain.
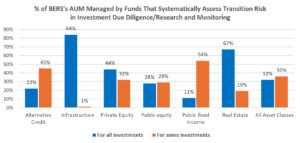
Source: Bureau of Asset Management as of June 2025
Real estate and infrastructure funds also lead the asset classes in terms of systematically assessing transition risks with 84% of infrastructure funds and 67% of real estate funds conducting this assessment for all investments. Mitigating and managing transition risk is central to the BERS’s net zero goals to encourage decarbonization across its portfolio. BAM will continue to engage managers and funds to encourage appropriate assessment of transition risk.
3.2.4. Assessment of Additional Climate-Related Risks: Water, Biodiversity, Deforestation & Environmental Justice
The following graph shows the percentages of BERS’ AUM that report assessment of water-related risk, biodiversity-related impacts and dependencies, deforestation risk, and environmental justice.
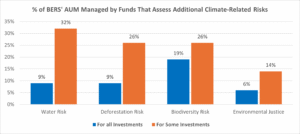
Source: Bureau of Asset Management as of June 2025
Among these risks, the most systematic assessment is conducted for biodiversity risk followed by water and deforestation risks.
3.2.5. Additional Manager Engagement Activities
BAM continues to engage managers to encourage and support further adoption of net zero goals, science-based targets or other appropriate decarbonization goals. In addition, BAM will seek to further understand managers’ integration and pricing of physical, transition, nature, and water risks.
BAM has increased its participation and collaborative work, on behalf of the System, in industry initiatives to support net zero alignment with asset managers across asset classes. For example:
- BAM co-hosted a half-day workshop for middle market private equity managers (general partners (GPs)) during New York Climate Week 2025 to provide guidance on portfolio decarbonization and value creation. BAM co-hosted the event with three other limited partners (LPs) (APG, PGGM and AlpInvest). Approximately 50 GPs participated and provided positive feedback on the workshop citing helpful features such as GP decarbonization examples, networking opportunities and LP perspectives. BAM plans to co-host the event again in 2026.
- In 2024-2025, BAM participated in a working group of LPs to develop a set of climate-related due diligence questions to support LPs in assessing how private equity managers govern and manage climate-related risks and opportunities. This initiative was led by the Principles for Responsible Investment (PRI) in collaboration with the Institutional Limited Partners Association (ILPA) and Initiative Climate International. The due diligence questions are titled “PRI Supplementary Climate Module” and were released in November 2025. As of January 2026, BAM incorporated the questions of the Module in its supplemental due diligence questionnaire while adapting them to be more in-depth in certain areas as well as applicable more broadly for private markets.
- In 2025, BAM joined the ESG Data Convergence Initiative (EDCI), a global consortium of LPs and GPs formed to promote industry-wide convergence towards a standardized, foundational set of ESG metrics, including key climate metrics, in private markets. EDCI provides GPs with a process to report a core set of ESG data from their portfolio companies and make this data available to LPs. EDCI also creates a benchmark for this data enabling LPs and GPs to compare the ESG performance of their investments and identify correlations between ESG performance and value creation. EDCI enables reporting for each portfolio company on: (1) Scope 1, 2 and 3 GHG emissions (2) whether it has a decarbonization strategy/plan, (3) whether it has a short-term GHG emissions reduction target (Paris-aligned or non-Paris-aligned), (4) whether it has a long term net zero goal, (5) total energy consumption and (6) total renewable energy consumption.
3.3. Due Diligence of Asset Managers
BAM conducts due diligence of material ESG factors, including climate change-related risks and opportunities, for all asset managers across all asset classes as part of the overall diligence process conducted prior to recommendations and approvals of investments to the Board. Climate change poses both systemic and idiosyncratic risks for the investment portfolio and is, therefore, actively assessed in the diligence for all managers and strategies and explored in more depth where it may be more financially material.
As a starting point for diligence, BAM utilizes the Due Diligence Questionnaire template of the ILPA for private markets managers and a similar template for public markets managers. BAM supplements the ILPA-based template with a BAM-specific due diligence questionnaire (BAM DDQ) that includes additional questions on ESG and climate. Using both questionnaires, BAM assesses how managers consider climate change-related risks and opportunities, including physical risk and transition risk, in diligence and portfolio management. BAM also asks whether and how managers measure the GHG emissions (including Scopes 1, 2 and 3) of their investments and whether managers have specifically adopted net zero goals, science-based targets or other emissions reduction targets for their investments. During diligence, the BAM team meets with the managers to gain additional insights and explores managers’ climate-related approaches in greater depth, particularly for higher-emitting investments.
As mentioned above, as of January 2026, BAM updated its BAM DDQ with an adaptation of the PRI Supplementary Climate Module to ask more specific questions on how GPs approach climate-related issues in due diligence, post-investment and reporting/disclosure. For example, the BAM DDQ now delves further into how the GP approaches climate-related value creation, assessment of physical risks, resilience and adaptation for physical risks, climate-related KPIs and portfolio level climate risk analysis, including climate scenario analysis. BAM further updated the questionnaire to ask about managers’ approaches to assessing nature/biodiversity impacts and dependencies. BAM summarizes and reports findings related to climate-related ESG diligence in investment memoranda to the Board.
Section 4: Invest in Climate Change Solutions
4.1. Progress on Climate Solution Investments
BERS’ investment in climate solutions has been an integral part of our net zero ambitions. BERS has a goal of investing a total of $1.8 billion in climate change solutions by 2035, and had an interim goal of $400 million by 2025, consistent with our fiduciary duties and our investment objectives. BERS surpassed the goal set for 2025, earlier, in June 2024. As of June 30, 2025, BERS has a total of $726 million in invested and unfunded commitments in climate change solutions across all asset classes, an increase of 19.4% over FY2024. Table 4 shares the climate solutions exposure by each asset class for Jun 30 2025, as well as changes from FY2024.[15]
Details of BERS’ climate solutions investments’ definitions by asset class are in Appendix D.
Table 4: BERS Climate Solutions Investments – Jun 2025
| BERS – Climate Solutions Investments ($million) – Jun 30, 2025 | ||||||||
| Total Portfolio | Public Equity Active | Public Equity Passive | Public Fixed Income | Alternative Credit | Private Equity | Real Estate | Infrastructure | |
| 2Q 2025 – (1Q24 data for infrastructure) – Including unfunded commitments | ||||||||
| 06/30/25 total NAV | 10,067 | 1,710 | 2,726 | 2,599 | 566 | 1,202 | 835 | 430 |
| 06/30/25 climate exposure | 726 | 57 | 324 | 41 | 48 | 35 | 112 | 108 |
| 06/30/25 climate % | 7.21% | 3.34% | 11.90% | 1.58% | 8.54% | 2.93% | 13.40% | 25.17% |
| BERS – Climate Solutions Investments ($million) – Jun 30, 2024 | ||||||||
| Total Portfolio | Public Equity Active | Public Equity Passive | Public Fixed Income | Alternative Credit | Private Equity | Real Estate | Infrastructure | |
| 2Q 2024 (1Q24 data for infrastructure; 4Q23 data for real estate) – Including unfunded commitments | ||||||||
| 06/30/24 total NAV | 9,363 | 1,596 | 2,361 | 2,631 | 439 | 1,152 | 754 | 430 |
| 06/30/24 climate exposure | 608 | 51 | 240 | 47 | 38 | 32 | 93 | 108 |
| 06/30/24 climate % | 6.50% | 3.18% | 10.15% | 1.78% | 8.71% | 2.79% | 12.27% | 25.17% |
| Analysis of Changes from Jun 2024 to Jun 2025 | ||||||||
| Total Portfolio | Public Equity Active | Public Equity Passive | Public Fixed Income | Alternative Credit | Private Equity | Real Estate | Infrastructure | |
| Total NAV % Change | 7.5% | 7.2% | 15.4% | -1.2% | 28.9% | 4.3% | 10.7% | 0.0% |
| Climate exposure % Change | 19.4% | 12.5% | 35.4% | -12.6% | 26.3% | 9.6% | 20.9% | 0.0% |
Source: Bureau of Asset Management
While this demonstrates strong progress towards BERS’s established goals, BERS is reflecting on how we can be more intentional in its climate solution investments. The climate solutions definitions for public companies have evolved since BERS set its climate solutions investments target four years ago. In 2023, the methodology changed from only companies with more than 50% revenue from green categories to including the proportion of investments based on the companies’ green revenue percentage based on MSCI’s Environmental Impact Metrics. Two years on, the increasing urgency of climate change requires us to be more intentional in our climate solution investments and seeking high performing assets. The market has also evolved. Given these drivers, we provide more granular reporting on the make-up of our climate solution investments in this report, starting with the private real estate and public markets. We are also reviewing peer asset owners’ practices on climate solutions investments to make sure we adhere to the best practice. Going forward, we aim to focus our effort on investments that have the highest effect on emission reduction while also providing superior risk adjusted returns.
4.2. Review of Inclusion of Products and Services Associated with Data Centers as Climate Solutions
BERS has been monitoring the increasing emissions of artificial intelligence (AI)-driven data center growth, which are projected to increase significantly in coming years. Accenture research, for example, found that carbon emissions from AI data centers could increase 11-fold in this decade, accounting for a 3.4% share of total global CO2 emissions by 2030 and more than the aviation industry’s current share of emissions[16].
Because cloud computing is more energy efficient than local servers which was prevalent a decade ago when MSCI designed its methodology, to date, MSCI has categorized revenues from products and services associated with cloud computing which AI relies on as contributing to energy efficiency, hence part of the environmental impact metrics,[17] We currently define climate solution investments using MSCI’s environmental impact metrics. This means that a significant portion of the investments associated with AI are designated as climate solutions. For example, MSCI classifies 88% of Nvidia’s revenue as contributing to energy efficiency, hence 88% of BERS’s investment in Nvidia is classified as a climate solution investment. Nvidia is currently the largest single contributor to BERS’s climate solutions. Nvidia, Microsoft, and Amazon combined comprise almost 30% of BERS total climate solutions (both public and private combined) in FY 2025.
Given the significant climate impact of AI, BERS began reviewing the inclusion of related forms of revenue in its climate solutions portfolio and engaging with both hyperscalers and other portfolio companies on this issue (see additional detail in the corporate engagement section). Additionally, BERS has requested that MSCI review its environmental impact metrics definitions as well and has committed to participate with other investors in such a review. The results of these reviews and engagements will inform potential changes to BERS’s definitions (and reporting) of climate solutions.
4.3. Review of Private Real Estate Climate Solution Investments
Up until FY 2024, we defined real estate climate solutions as buildings that achieve Energy Star certification. Energy Star certification is based on a building’s energy efficiency and requires a score of 75 or higher, regardless of whether they are existing buildings, new builds, or major renovations, placing it in the top 25% of all Energy Star-rated buildings. However, Energy Star certification is generally limited to buildings in the U.S. and Canada and does not capture high-performing buildings in Europe in the BERS’s portfolio. What’s more, because of the higher building standards for new buildings, most new buildings have an Energy Star rating of 75 or above.
For FY 2025, we collected additional indicators for building energy performance to expand our understanding of high-performing assets in our real estate portfolio. Specifically, in late 2025, we expanded the climate-related data collection from our real estate managers to include the Energy Performance Certificate (EPC) levels for European properties.
Furthermore, we have begun to examine standards for higher levels of building energy efficiency performance to assess and differentiate how the BERS’s real estate investments are with this performance. One established standard is the Climate Bonds Initiative’s green bond eligibility criterion for residential buildings. This criterion requires performance in the top 15% of similarly located buildings.[18] BAM applied this concept of the top 15% to analyze the EPC levels of buildings in the BERS’s portfolio and found that, for the countries in which the System has real estate investments, existing buildings, as opposed to newly developed buildings, with the top two EPC ratings (e.g., A or B for the UK, A+ or A for Germany), outperform around 85% of similar buildings. Because of the high energy efficiency requirements for new buildings in Europe, most new buildings have the top two ratings. To be consistent with the U.S. real estate climate solution definition, we counted both new buildings and existing buildings in Europe with the two top ratings as climate solutions in the headline numbers in Table 4.
While we currently retain the definition of real estate climate solutions as the top 25% in Energy Star ratings for U.S. properties, in this report, we begin to report additional data on higher performing real estate investments to provide more helpful insights into the BERS’s real estate investments that contribute to the transition to a net zero economy. Specifically, we report (1) real estate investments in European existing buildings achieving the top two EPC ratings and (2) U.S. real estate investments with Energy Star ratings of 85 or higher indicating they perform in the top 15%. Combined, these two categories of investments total $61 million which is 7% of the real estate portfolio NAV as of June 30, 2025. This is about half of the total NAV of the headline real estate climate solutions total investments.
| US Investments in Existing Buildings with 85+ Energy Star Ratings | European Investments in Existing Buildings with Top Two EPC Levels | |
| Higher Performing Real Estate Investments | $51mm | $9.6mm |
Appendix A – Definitions of GHG Emissions and their Categories (Scopes 1, 2 and 3)
Scopes 1, 2 and 3 are ways of categorizing the different sources of GHG emissions from a company’s direct operations and its wider value chain.
| Scope 1 | Scope 2 | Scope 3 |
| Covers the direct emissions from sources owned or controlled by a company – for example, by running its boilers and vehicles | Covers indirect emissions from the generation of energy a company purchases | Covers all other indirect emissions up and down a company’s supply and value chain. For example, a petroleum company’s Scope 3 emissions include the emissions from the gasoline they produce when it is burned by a customer’s car. A bank’s Scope 3 emissions include those from extracting fossil fuels from projects they finance. It is estimated that Scope 3 emissions constitute 75% of firms’ emissions on
Average.10 |
Illustration of Scopes 1, 2 and 3 emissions
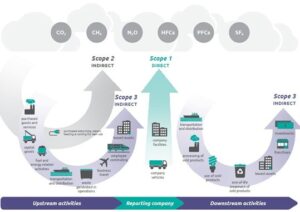
Source: Greenhouse Gas Protocol Corporate Value Chain (Scope 3) Accounting and Reporting Standard (2011)
Appendix B – Scope 1,2 Financed Emissions Breakdown
As of June 30, 2025, total public equity and corporate bonds represent about 81% and 19% of the measured public security portfolio’s market value, but their contributions to Scope 1 and 2 financed emissions are 58% and 42%, respectively. U.S. equity has higher total financed emissions but lower financed emissions intensity than international equity. Within fixed income, high yield has higher total financed emissions and higher emissions intensity than investment grade corporate bonds.
Sub-Asset Classes Financed Emissions (Scope 1 and 2) – Jun 30, 2025
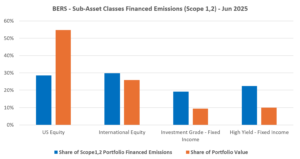
Source: Bureau of Asset Management as of June 2025
Between June 2024 and June 2025, the Scope 1 and 2 financed emissions for both public equity and corporate fixed income decreased for the BERS portfolio, with active equity leading the reduction.
While the portfolio’s total passive equity market value is much greater than the active equity market value, the contribution of actively managed equity to Scope 1 and 2 financed emissions is greater than that of the passive equity.
Active vs Passive Equity Financed Emissions (Scope 1 and 2) – Jun 30, 2025
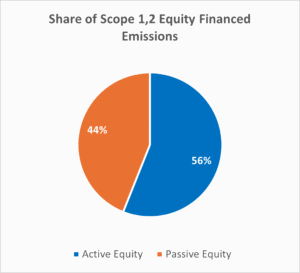
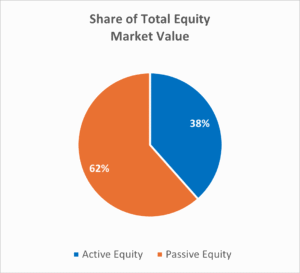
Source: Bureau of Asset Management as of June 2025
Between June 2024 and June 2025, the decrease in active public equity financed emissions was the primary driver of the overall portfolio’s financed emissions reduction, though passive equity financed emissions decreased too.
The top 70% of Scope 1 and 2 financed emissions are attributed to 122 issuers in the BERS portfolio, and the high emitting sectors in the top 70% financed emissions companies mirror the overall portfolio’s high emitting sectors.
Sector Contribution to Top 70% Financed Emissions (Scope 1 and 2)
Jun 2025 and Jun 2024
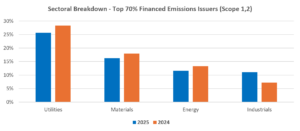
Source: Bureau of Asset Management as of June 2025
The Utilities and Materials sectors are the highest emitting sectors among the top 70% of Scope 1 and 2 financed emissions, representing 26% and 16% financed emissions of the group, respectively. This information continues to be critical to our engagement activities.
As shown below, the Weighted Average Carbon Intensity (WACI) (financed emissions per million dollars of sales) decreased by 10.36% for Scopes 1,2 during the year 2024-2025.
WACI – Scope 1 and 2
| BERS – Weighted Average Carbon Intensity – Scope 1 and 2 | ||
| BERS Portfolio Tons carbon emissions/$m sales | Blended Benchmark Tons carbon emissions/$m sales | |
| 31-Dec-19 | 218.18 | 187.03 |
| 30-Jun-22 | 187.85 | 179.70 |
| 30-Jun-23 | 158.20 | 164.90 |
| 30-Jun-24 | 148.60 | 139.20 |
| 30-Jun-25 | 133.20 | 134.90 |
| Change % (2019-2025) | -38.95% | -27.87% |
| Change % (2024-2025) | -10.36% | -3.09% |
Source: Bureau of Asset Management as of June 2025
Appendix C – Scope 3 Financed Emissions Breakdown
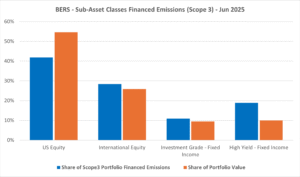
As of June 30, 2025, public equity and corporate bonds represent approximately 81% and 19% of the combined market value, with their contributions to Scope 3 financed emissions are 70% and 30%, respectively. U.S. equity has higher Scope 3 absolute financed emissions but lower emissions intensity than international equity. Within corporate bonds, high yield has much higher total financed emissions intensity and higher total financed emissions than investment grade corporate bonds.
Sub-Asset Classes Financed Emissions (Scope 3) – Jun 30, 2025
Source: Bureau of Asset Management as of June 2025
Between June 2024 and June 2025, the Scope 3 finance emission of public equity financed emissions decreased for the BERS portfolio, while overall fixed income’s financed emissions increased.
While the portfolio’s total passive equity market value is much greater than the active equity market value, the contribution of actively managed equity to Scope 3 financed emissions is not far off from that of the passive equity.
Active vs Passive Equity Financed Emissions (Scope 3) – Jun 30, 2024
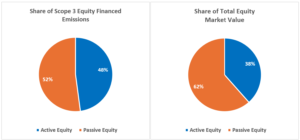
Source: Bureau of Asset Management as of June 2025
Between June 2024 and June 2025, the decrease in active public equity financed emissions was the primary driver of the overall portfolio’s financed emissions reduction.
WACI – Scope 3
| BERS – Weighted Average Carbon Intensity – Scope 3 | ||
| BERS Portfolio Tons carbon emissions/$m sales | Blended Benchmark Tons carbon emissions/$m sales | |
| 30-Jun-22 | 705.61 | 817.80 |
| 30-Jun-23 | 675.30 | 783.30 |
| 30-Jun-24 | 605.60 | 698.80 |
| 30-Jun-25 | 599.20 | 725.50 |
| Change % (2024-2025) | -1.06% | 3.82% |
Source: Bureau of Asset Management as of June 2025
WACI (financed emissions per million dollars of sales) decreased slightly by 1.06% for Scope 3 during the year 2024-2025.
Appendix D – Current Climate Solutions Investments Definitions
Public Equity: Companies that derive revenue from MSCI’s Environmental Impact categories of alternative energy, energy efficiency, green building, pollution prevention, or sustainable water. New weighted average method adopted as of 4Q 2022.
Public Fixed Income: Companies that derive revenue from MSCI’s Environmental Impact categories of alternative energy, energy efficiency, green buildings, sustainable water, pollution prevention, or sustainable agriculture, as analyzed by Risk Management. New weighted average method adopted as of 4Q 2022.
Also includes green bonds based on manager surveys conducted by Fixed Income Team. Managers were allowed discretion in defining green bonds.
Alternative Credit: OFI market values are based on manager surveys conducted by Alternative Credit Team. The definition of climate solutions used for OFI is “investments in companies that generate 50% or more revenue from clean and renewable energy technologies and assets including (1) renewable energy such as solar, wind, geothermal and hydropower; (2) energy efficiency and energy smart technologies such as power storage, fuel cells and carbon capture and storage; (3) energy efficient transport and (4) low carbon buildings.” This definition is a summary of the MSCI and Burgiss definitions as well as a reflection of a definition by Ceres. Total OFI NAV based on data from Alternative Credit Team.
Private Equity: Companies predominantly focused on a business activity classified under the Burgiss category of “Eco Friendly” activities, including renewable energy, biofuel and other clean tech or associated companies. All data is NAV. We also included companies that largely aligned with our definition of climate solutions in public markets.
Real Estate: Properties certified as Energy Star or having a score above 75 for US properties and having the top two ratings of the Energy Performance Certificate of the corresponding countries for European properties. Includes properties certified as LEED only if they are also certified as Energy Star. All data is based on manager surveys conducted by the Real Estate Team. All data is NAV.
Infrastructure: Includes categories of alternative energy, energy efficiency, green buildings, sustainable water, pollution prevention, and sustainable agriculture.
Economically Targeted Investments (ETI): ETI data is incorporated in the data for Public Fixed Income and Real Estate due to the portfolio’s investment structure.
The calculations include only assets for which BAM provides investment advice and, therefore, does not include VSFs.
Endnotes
[1] MSCI’s Total Portfolio Footprinting (TPF) methodology was used to obtain PCAF-aligned emissions metrics for Scopes 1 and 2 in 2025. However, we used MSCI’s legacy Carbon Footprint Calculations for Scope 3 this year given challenges we experienced in TPF. TPF is a relatively new tool developed by MSCI and is still a work in progress. We strive for the highest data and analytic quality and will review and update the methodologies as the carbon footprinting field evolves.
[2] https://www.iea.org/reports/global-energy-review-2025/co2-emissions
[3] Net Zero by 2050 – Analysis – IEA
[4] Applying the same methodology as MSCI’s ‘Framework for Attributing Changes in Portfolio Carbon Footprint
[5] Greenhouse Gas Protocol Scope 3 Frequently Asked Questions
[6] Material, But Missing: Gaps in Scope 3 Reporting Persist | MSCI
[7] IIGCC Investor Approaches to Scope 3
[8] The Steel Climate Standard – Global Steel Climate Council
[9] https://cdn-dynmedia-1.microsoft.com/is/content/microsoftcorp/microsoft/msc/documents/presentations/CSR/2025-Microsoft-Environmental-Sustainability-Report-PDF.pdf
[10] https://sustainability.aboutamazon.com/2024-report
[11] https://www.gstatic.com/gumdrop/sustainability/google-2025-environmental-report.pdf
[12] These expectations apply only to public markets managers that manage public equity or corporate bonds for the System including actively and passively managed public equity, investment grade credit and high yield fixed income. They do not currently apply to managers that manage Treasuries or Mortgages.
[13] Comptroller Lander Recommends Pension Boards Drop BlackRock, Fidelity, and PanAgora Due to Inadequate Decarbonization Plans – Office of the New York City Comptroller Mark Levine
[14] While PMDR specifically addresses private markets, it provides a reporting protocol and decarbonization maturity scale that can also information public markets decarbonization approaches.
[15] For real estate climate solutions, we expanded our coverage of managers that were reporting since last year, by including European assets. The climate solutions for Infrastructure will be updated when the new consultant for BERS completes their assessment
[16] Unlocking Alpha in Transactions Report | Accenture
[17] MSCI Sustainable Impact Metrics
[18] World Green Building Council Sustainable Finance factsheet series – Energy Performance Certificates