
Letter from the Comptroller
New York City’s storefronts are the cornerstone of our neighborhoods. Restaurants, bars, bookstores, music venues, galleries, salons, and bodegas create jobs, support immigrant and minority entrepreneurship, and shape communities across all five boroughs.
Yet years after the pandemic, too many storefronts remain vacant. While some corridors have rebounded, others continue to experience persistent vacancy, particularly in parts of Downtown Manhattan, Northern Brooklyn, and Western Queens. These vacancies have serious impacts on our communities, reducing neighborhood character and putting downward pressure on hyper local economies and quality of life.
In this report, we see a number of important trends: where vacancy rates are improving and where they aren’t, that vacancy rates are hyper-localized and tends to cluster, that long-term persistent vacancy remains a problem in some neighborhoods, and that small businesses in New York City have not broadly ceded storefronts to national chains since 2020. That finding speaks to the persistence, adaptability, and entrepreneurial strength of small business owners across the five boroughs. At the same time, many small business owners continue to struggle with excessive bureaucracy, rising costs, slow permitting processes, and limited confidence in the City’s ability to support them. Earlier this year, our Office reviewed the City’s “Small Business Forward” initiative and found that, while well-intentioned, it failed to significantly cut red tape.
This report marks the beginning of an ongoing initiative by my office to address storefront vacancies and support small business growth. In the coming months, we will continue analyzing the drivers of long-term vacancies, while working with small business owners, labor unions, merchant associations, cultural institutions, and community leaders to better assess community needs.
New York’s economy cannot simply be measured by aggregate economic growth or rising commercial rents. We must also measure whether local businesses can survive, neighborhoods remain vibrant, and New Yorkers can afford to build a future here.
Sincerely,
![]()
Mark D. Levine
New York City Comptroller
Executive Summary
- Storefront vacancy across New York City remains above pre-pandemic levels. The citywide storefront vacancy rate rose from 10.5% at the start of 2020 to 11.6% in late 2023 and remains elevated at 11.0% as of April 15, 2026. Currently, approximately 15,700 storefronts remain vacant.
- Lower Manhattan, North Brooklyn, and Western Queens continue to experience the highest vacancy rates in the city. The neighborhood vacancy rates are concentrated in: Financial District–Battery Park City (21.1%), Old Astoria–Hallets Point (20.1%), Ocean Hill (19.5%), Tribeca–Civic Center (19.5%), East New York (North) (19.4%).
- Vacancies are concentrated in clusters. Storefronts located within one block (250 feet) of a vacancy are 30% more likely to be vacant than the citywide average.
- Small businesses tend to be replaced by other small businesses, not by chain expansion. Of the roughly 96,500 small business storefronts operating at the beginning of 2020, 84% are still operating as the same business or were replaced by another small business.
- Persistent vacancy remains a major concern for small business storefronts. In many neighborhoods, 80–90% of storefronts vacant in early 2026 had already been vacant for at least nine months. Some corridors show persistent storefront vacancy over multiple years. In Lower Manhattan, Harlem, Bedford-Stuyvesant, Crown Heights, Williamsburg, East Flatbush, Astoria, and parts of southeast Queens, more than one in ten storefronts previously occupied by a small business is vacant.
- New York City is an outlier among peers. Nationally, retail demand has largely recovered since the pandemic. Compared to other major cities, New York City has a greater range of vacancy rates by neighborhood.
Findings
Citywide Storefront Vacancies
Vacancy rate remains above pre-pandemic levels
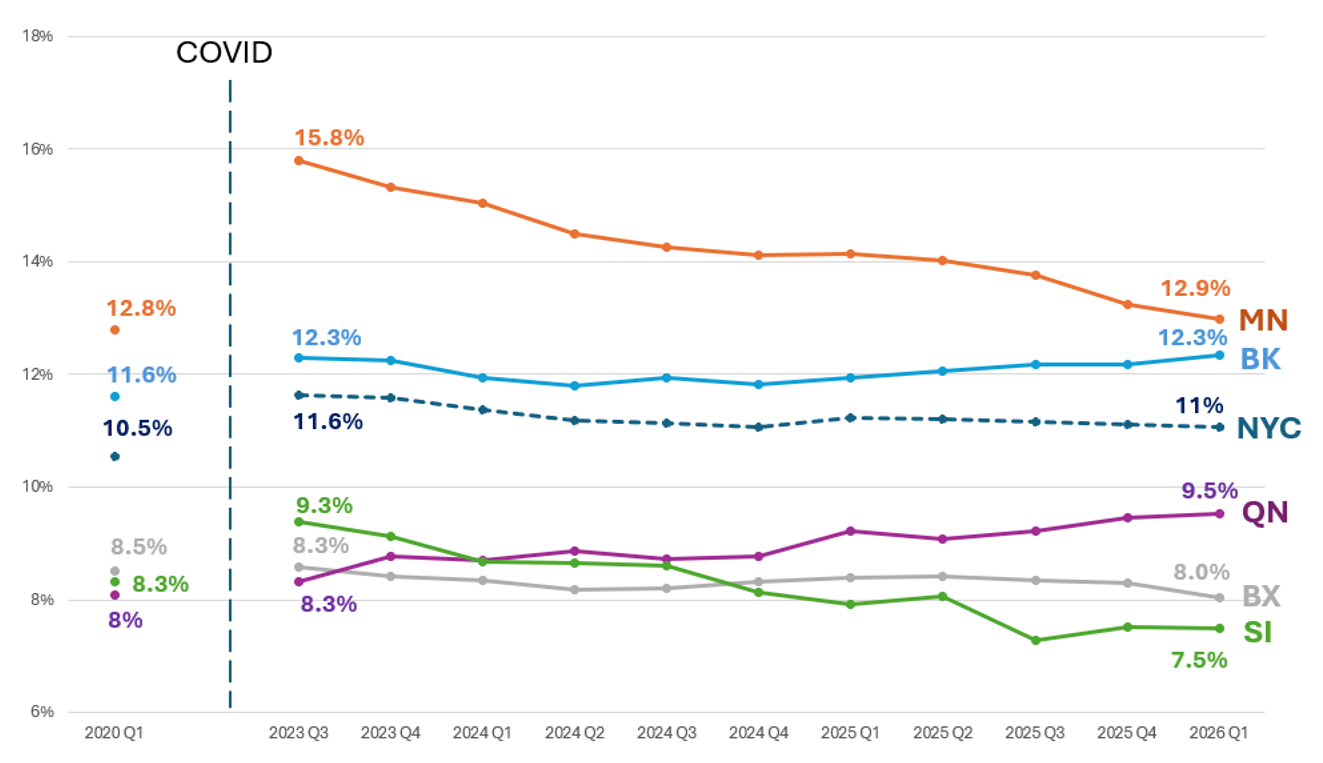
The pandemic took a heavy toll on New York City’s storefront businesses. Even as the public health emergency eased, business activity was slow to recover, and vacant storefronts became a more common sight. The citywide storefront vacancy rate rose from 10.5% at the beginning of 2020 to 11.6% in late 2023, the first post‑pandemic period with complete data. Since then, the rate has improved and remains above pre‑pandemic levels at 11.0% as of April 15, 2026. Of the 142,000 storefronts in New York City, 15,700 are vacant.
These elevated vacancy rates also reflect a longer-term trend that predates the pandemic. A 2019 analysis by the Office of the New York City Comptroller, which relied on retail square footage and vacancy status reported to the Department of Finance (DOF), found that citywide retail vacancy increased from 4.0% in 2007 to 5.8% by 2017.[1] That data source has important limitations, including inconsistencies in property owner reporting and omission of small commercial spaces. These smaller spaces are key to understanding the needs and vitality of small business storefronts. Additionally, the methodology, based on vacant retail square footage rather than direct storefront counts, does not allow direct comparison with this new analysis. The earlier analysis nonetheless showed that commercial vacancy pressures have been building across the five boroughs for more than a decade, predating COVID-19 storefront instability. This new analysis is the first of its kind – based on complete, comprehensive data covering all storefronts across the city, and on observed status, rather than relying on self-reported information from building owners. While this dataset is robust, it does have limitations (see the methodology section for more information).
Current storefront vacancy patterns vary significantly across the five boroughs. Manhattan continues to have the City’s highest storefront vacancy rate, though conditions have improved significantly since the pandemic. Vacancy rates in Manhattan were already higher than in the other boroughs before 2020, then climbed sharply during the pandemic, peaking at 15.8% in late 2023—roughly one empty storefront for every eight. Since then, the borough’s vacancy rate has declined to 12.9% as of April 2026. Brooklyn now has the second-highest vacancy rate at 12.3%, remaining relatively stable in recent years, followed by Queens at 9.5%, where vacancies have trended slightly upward over the past two years. The Bronx and Staten Island continue to have the lowest vacancy rates at 8.0% and 7.5%, respectively, with the Bronx remaining steady and Staten Island showing modest improvement.
Figure 1: Vacancy Rate by Borough
Vacancy rates are highest in Lower Manhattan, North Brooklyn, and Western Queens
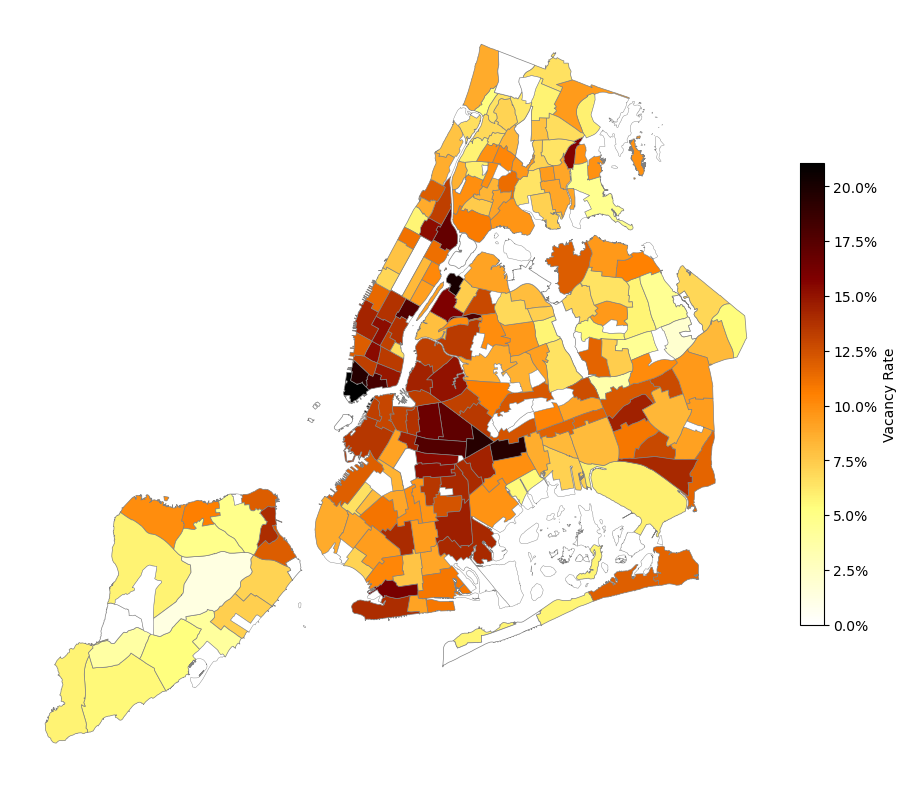
The highest vacancy rate in the city is in the Financial District–Battery Park City, where nearly one in four storefronts (21.1%) are vacant. Elevated vacancy extends across much of Manhattan below 59th Street, including Tribeca–Civic Center (19.4%), Chinatown–Two Bridges (18.1%), and East Midtown–Turtle Bay (17.7%). Farther uptown, East Harlem (north of 109 St. and east of 5 Ave) reaches 16.9%, and central Harlem (below 126 St.) is at 15.2%, well above the citywide average. This analysis measures vacancy across entire neighborhoods using Neighborhood Tabulation Areas developed by the Department of City Planning. Where business improvement districts exist, they generally cover smaller areas, and the vacancy rate within a BID’s territory may differ from that of the neighborhood as a whole.
Outside Manhattan, vacancy hotspots appear in several distinct clusters. Brooklyn shows some of the most widespread elevated vacancy in the City, with Ocean Hill, East New York (North), Bedford‑Stuyvesant (East), Crown Heights (North), and Bedford–Stuyvesant (West) forming a broad zone with vacancy rates above 15%. Additional pockets extend north into Williamsburg and Greenpoint and south into East Flatbush and Flatlands. Queens contains several of the City’s most acute vacancy concentrations outside Manhattan. Old Astoria–Hallets Point’s 20.1% vacancy nearly matches the Financial District, while elevated rates appear in Sunnyside Yards (North) (17.7%), Queensbridge-Ravenswood-Dutch Kills (15.9%), South Jamaica (14.5%), Springfield Gardens (South) (14.1%), and Sunnyside (13.4%). In the Bronx, the highest rates are in Hutchinson Metro Center (18.6%) and a corridor of neighborhoods stretching from Mott Haven through Crotona Park East and Eastchester, where vacancies exceed 10%. Staten Island’s highest vacancy rates cluster along the North Shore, including Tompkinsville–Stapleton–Clifton–Fox Hills (14.0%), Rosebank–Shore Acres–Park Hill (12.0%), and St. George–New Brighton (11.9%). Together, these patterns show that while Manhattan’s commercial core contains the largest concentrations of vacant storefronts, significant pockets of elevated vacancy appear across all five boroughs.
Figure 2: Vacancy rate by Neighborhood Tabulation Area: 2026 Q1
Vacancies are concentrated in clusters
Zooming in even further, this analysis finds that even within neighborhoods, vacant storefronts are clustered together, not spread at random. This analysis reveals vacancies are generally concentrated along particular corridors or within sections of neighborhoods.
The clustering of vacancies is evidenced by the higher vacancy rate in the area immediately surrounding each vacant location. Storefronts within 250 feet (approximately one Manhattan block) of a vacant storefront have a vacancy rate of 15.4%, 4.4 percentage points higher than the citywide average vacancy rate. Framed another way, a storefront that is within one block (250 feet) of a vacant storefront is 30% more likely to be vacant than a storefront observed at random. This pattern is strongest at a close range, but storefronts located within approximately three Manhattan blocks (750 feet) of a vacant storefront are still 2 percentage points more likely to be vacant than the overall rate (with a 13.0% vacancy rate).
This clustering of vacancies is highly localized. An analysis of statistically significant concentrations of vacant storefronts shows that even in high-vacancy neighborhoods, empty storefronts are most common in small subsections, such as along Nostrand Ave. in Crown Heights or near Church St. and Chambers St. in Tribeca.
Nearly one in six Arts and Culture storefronts is now vacant
Among business types, art galleries, breweries, and tours & visitor information centers, classified by Live XYZ as “Arts and Culture” establishments, have the highest rate of categorical current vacancy. Across the storefronts which are either now operating as an Arts & Culture-type establishment or are vacant but were last operated in that category, 16.1% of storefronts are currently vacant. Other sectors with notably high vacancies include business-to-business fields such as real estate firms, tax services, and travel agencies (13.3%); and bars and nightclubs (10.9%). These elevated rates reflect both the closure of businesses in these sectors and the slow pace of new tenants moving in to fill the empty spaces. This may be because such spaces are more difficult to re-fill with new tenants.
Figure 3: Vacancy Rate by Business category in 2026 Q1
Portion of storefronts in each business category which are now vacant. Storefronts are included in a category if they are either now operating as a business in the category or are vacant and were last operated as a business in the same category.
Closed food and essentials storefronts are the largest categories of vacancies
Looking across all vacant storefronts in the City, a relatively small number of categories account for a large share of total vacancies. Shuttered storefronts which were last operated as food‑related businesses—restaurants and cafés—represent the single largest share at 13.6% of vacancies, reflecting both the scale of the sector and the continued churn in food service. Closed essential goods providers such as grocery stores, pharmacies, and vitamin shops make up 10.5% of vacancies, followed closely by business and professional services (10.0%) and home and hobby retailers (8.8%). These categories collectively account for more than 40% of all vacant storefronts, underscoring how vacancy is concentrated in the everyday commercial fabric of neighborhoods rather than in niche sectors.
This distribution shows that while some high‑vacancy categories have elevated rates of vacancy, the absolute number of vacant storefronts is driven primarily by large, everyday retail and service sectors that anchor neighborhood commercial corridors.
Figure 4: Portion vacant storefronts by last operating business category, 2026 Q1
Small Business Vacancies
To investigate trends in small‑business closures and the factors affecting storefront viability in New York City, this study focused on identifying unique, local storefronts most likely to be owned and operated by local entrepreneur s.[2]
Small businesses mostly remain small businesses
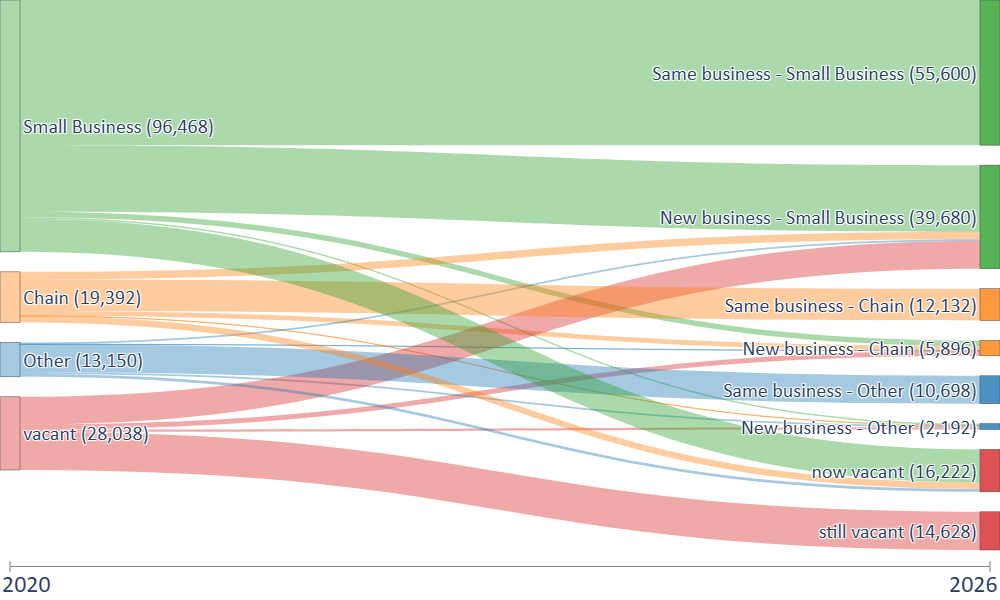
Despite common narratives of small businesses disappearing and being replaced by chains, this analysis found that the most common fate for a storefront operating as a small business at the beginning of 2020 is that it is still operating as the same business today, and the second most common outcome is that that storefront has reopened as a new small business. While nearly 12,700 small businesses that were operating in 2020 are now vacant storefronts, an almost comparable 10,700 storefronts that were vacant in 2019 are now operating as new small businesses. The turnover of small businesses to chains is relatively uncommon; of the 96,500 storefronts with small businesses in 2020, 2,150 storefronts are now chains.
Figure 5: Storefront turnover 2020 to 2026 by type
Small business storefront vacancies are concentrated in certain neighborhoods
Neighborhoods feel the impact of small business closures most acutely when the storefronts they leave behind remain vacant. New Yorkers often mourn the loss of long‑standing institutions and distinctive places that give their communities character. These closures can signal uncertainty about local conditions and can erode the informal social networks that grow around neighborhood institutions and regular meeting places.
Figure 6: Small Business Vacancy Rate by Neighborhood Tabulation Area: 2026 Q1
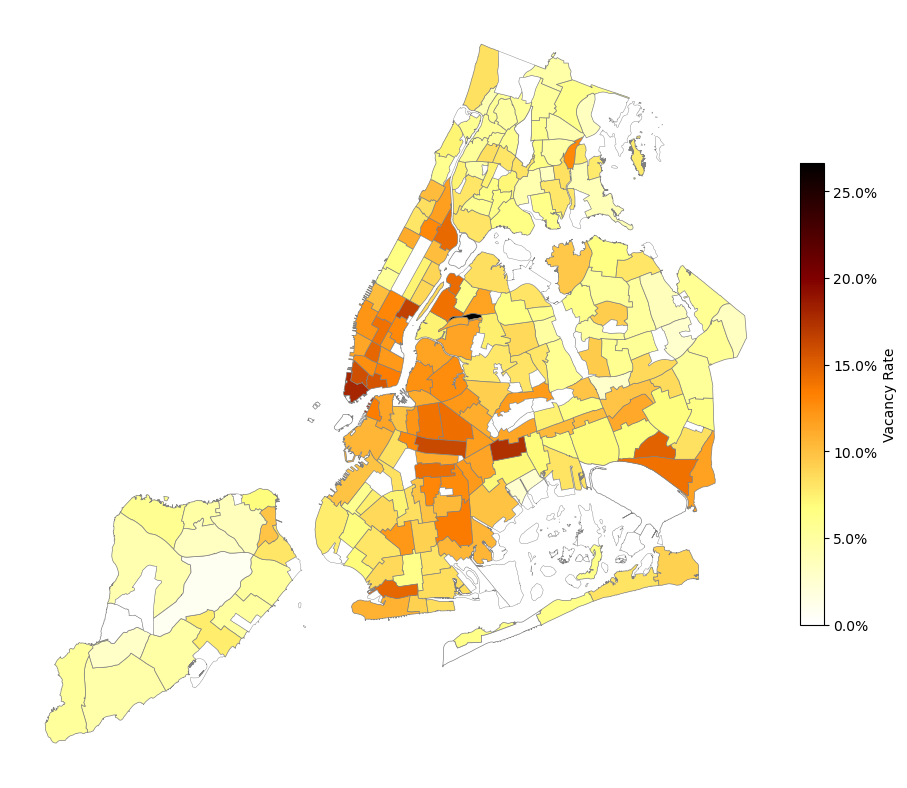
Note: Portion of storefronts which are vacant as of 2026 Q1 and were previously small businesses
Small business storefront vacancy is concentrated in many of the same areas that show high overall vacancy, but the pattern is more focused.
Figure 7: Neighborhoods with highest small business vacancy rate, by borough
| Borough | Neighborhood Tabulation Area | Vacancy Rate |
| Manhattan | Financial District–Battery Park City | 17.9% |
| East Midtown–Turtle Bay | 16.6% | |
| Tribeca-Civic Center | 15.9% | |
| Chinatown-Two Bridges | 15.5% | |
| Greenwich Village | 14.6% | |
| Brooklyn | East New York (North) | 17.4% |
| Crown Heights (North) | 16.2% | |
| Gravesend (South) | 14.6% | |
| Prospect Lefferts Gardens-Wingate | 14.3% | |
| Bedford Stuyvesant (East) | 14.1% | |
| Queens | Sunnyside Yards (North)[3] | 26.6% |
| Springfield Gardens (North) | 14.8% | |
| Old Astoria-Hallets Point | 14.4% | |
| Queensbridge-Ravenswood-Dutch Kills | 14.1% | |
| Springville Gardens (South)-Brookville | 14.1% | |
| Bronx | Hutchinson Metro Center[3] | 12.9% |
| Mount Hope | 8.3% | |
| Westchester Square | 8.2% | |
| Riverdale-Spuyten Duyvil | 8.2% | |
| West Farms | 8.2% | |
| Staten Island | Tompkinsville-Stapleton-Clifton-Fox | 9.7% |
| Rosebank-Shore Acres-Park Hill | 7.9% | |
| Oakwood-Richmondtown | 7.6% | |
| St. George-New Brighton | 6.8% | |
| Mariner’s Harbor-Arlington-Graniteville | 5.8% |
This measure captures only storefronts that were previously recorded as small businesses. It does not include very long‑term vacancies where no occupant has been recorded since data collection began in 2018. It also reflects a single point in time. Many of these neighborhoods are among the City’s most commercially active, with rapid turnover and frequent openings and closings. Even so, the concentration of closed small businesses in these areas represents a meaningful disruption to neighborhood commercial life and to the local establishments and “third places” that anchor community activity.
Persistent Vacancies Are a Challenge in Many Neighborhoods
Figure 8: Small Business Long-Term Vacancy (3 Consecutive Quarters)
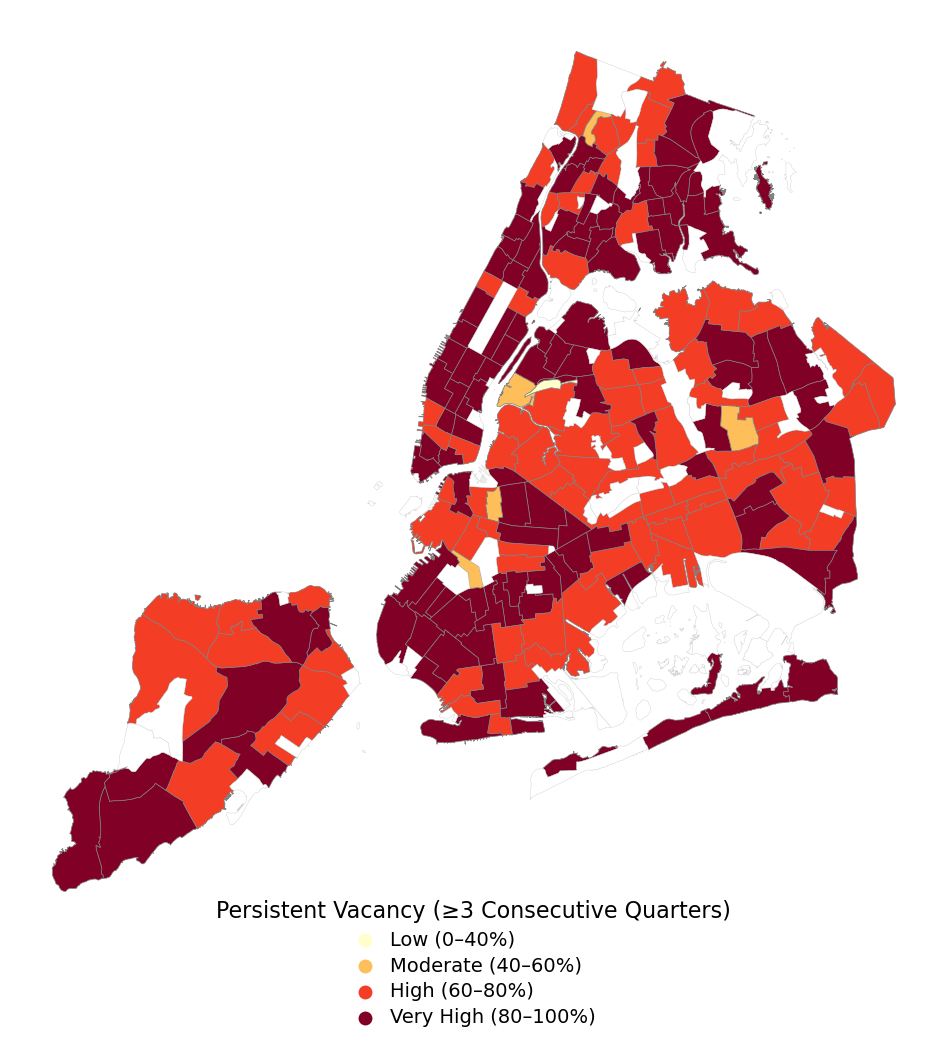
While some areas show relatively rapid turnover of vacant storefronts to new businesses, many neighborhoods across the City show a pattern of persistent, long-term vacancy. In many neighborhoods, 60–80% or more of the storefronts vacant in 2026 Q1 had already been vacant for at least three consecutive quarters (nine months). This pattern appears in every borough, although the specific neighborhoods vary. Manhattan shows some of the highest persistence, with many NTAs exceeding 80%, including Lower Manhattan, Midtown, the Upper East Side, the Upper West Side, Harlem, and Washington Heights. The Bronx also exhibits elevated persistence across large swaths of the borough, particularly in Concourse, Claremont Village, Crotona, Eastchester, Pelham Gardens, Kingsbridge, and Norwood. Brooklyn and Queens show more variation, but many neighborhoods still exceed 60%, including East Flatbush, Crown Heights, Williamsburg, Sunset Park, Astoria, Long Island City, Flushing, and Kew Gardens. Staten Island also shows high persistence in several areas, including Tompkinsville–Stapleton, Arden Heights, and portions of the North Shore. These are the neighborhoods where small‑business storefronts tend to remain empty for months once they close, reflecting slow re‑tenanting rather than rapid turnover.
Long-term vacancies are entrenched in specific corridors
When the threshold is extended to six and eight consecutive quarters, the geography of long‑term vacancy becomes more selective, revealing where vacancy has become entrenched rather than temporary. Many neighborhoods that appeared highly persistent at the 3‑quarter window fall back toward the citywide average at 6 and 8 quarters, indicating that their vacancies are more recent.
Figure 9: Small Business Long-Term Vacancy (6 Consecutive Quarters)
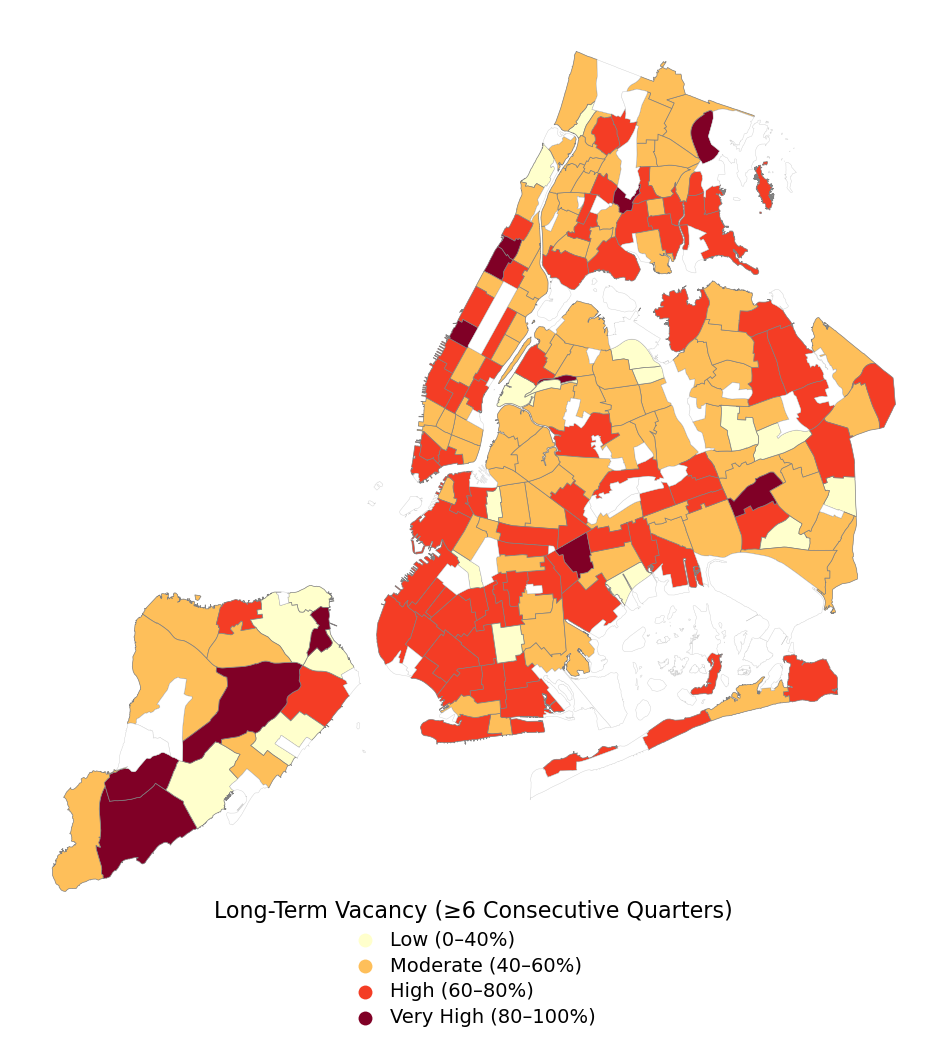
A smaller set of neighborhoods continue to show very high multi‑year persistence, with long‑term vacancy rates still above 60% even at the 8‑quarter window. These include parts of Manhattan (Upper East Side, Upper West Side, Midtown, Washington Heights, Inwood), the Bronx (Concourse, Kingsbridge, Norwood, University Heights–Fordham), Brooklyn (Williamsburg, East Williamsburg, Crown Heights, Starrett City), and Queens (Astoria, East Elmhurst, North Corona, Flushing, Rosedale). Staten Island also shows pockets of entrenched vacancy in areas such as New Dorp, Midland Beach, and parts of the North Shore. These neighborhoods represent places where small‑business storefronts remain vacant for multiple years, forming the city’s most persistent long‑term stagnation corridors.
Figure 10: Small Business Long-Term Vacancy (8 Consecutive Quarters)
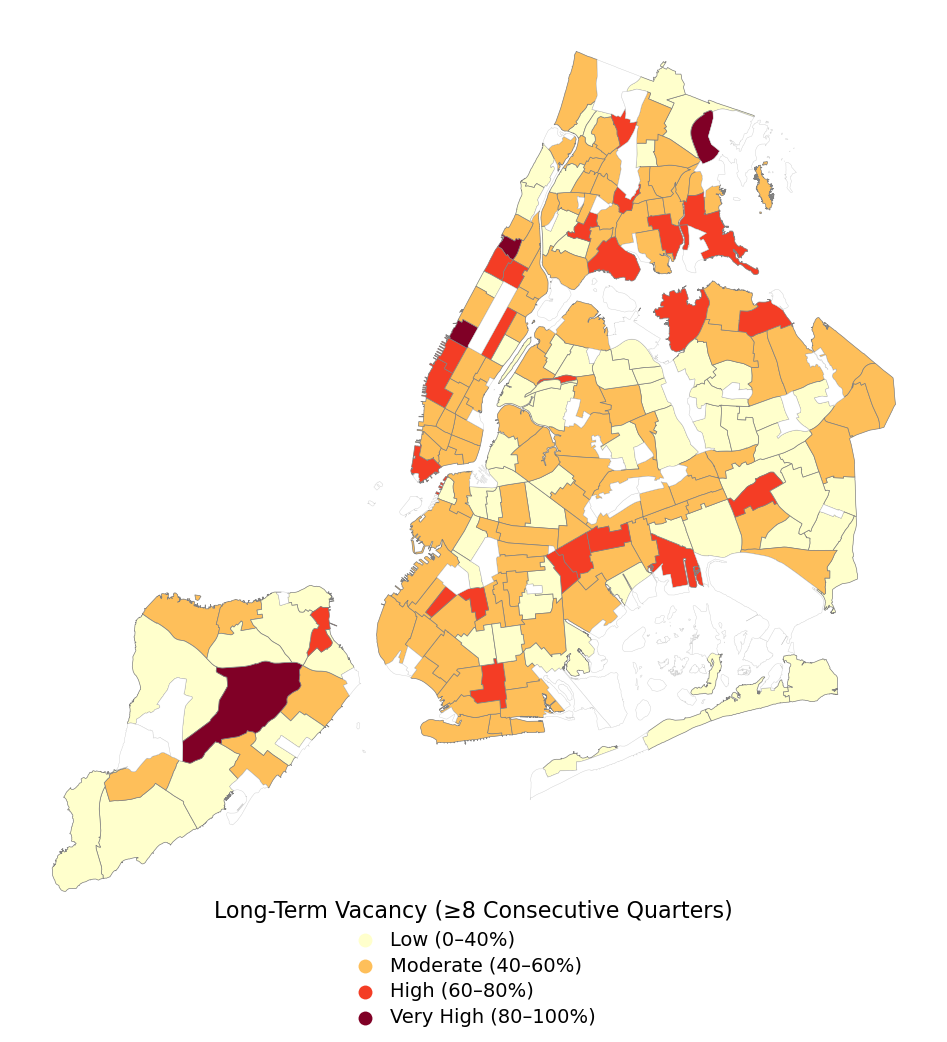
Together, the three vacancy tiers show a layered landscape in which persistent vacancy is widespread, entrenched vacancy is concentrated, and deep structural vacancy is limited to a small set of struggling commercial areas.
National Storefront Vacancies
New York City is an outlier among peers
In general, demand for retail space has grown since the pandemic across the United States.[4] While supply by square foot has remained relatively stable, data shows a slight uptick in demand. As of 2024, national retail vacancy rates had fallen to a five-year low. A Brookings Institution analysis of CoStar data found that the national retail vacancy rate was 4.08% in 2024, slightly below the pre-pandemic rate of 4.37% in 2019. Across eight other major metropolitan areas, vacancy rates ranged from 2% in Boston to 4.75% in Los Angeles. This national trend continued into Q2 2025.[5]
Retail vacancy rates vary dramatically across cities and neighborhoods, underscoring what some researchers have described as “retail inequality”5 — the concentration of exceptionally high vacancy rates in specific commercial corridors. Chicago, Seattle, and Washington, D.C. show patterns that somewhat resemble New York City, with relatively healthy citywide retail markets alongside pockets of severe distress. In both Washington and Chicago, neighborhood vacancy rates ranged from near zero to roughly 13%. In Washington, D.C., the median retail vacancy rate by square foot was 3.52% in 2024, while downtown vacancy was more than double that level at 7.17%. Seattle experienced an even sharper disparity, with a median vacancy rate of 2.95% compared to a downtown vacancy rate of 12.63%.
Yet among the nine largest metropolitan areas in the country, New York City exhibited the widest disparity in neighborhood retail vacancy rates in 2024. While the citywide median vacancy rate by square foot was just 3.75%, some neighborhoods recorded vacancy rates exceeding 30%. Because these figures are measured by square footage rather than storefront count, they likely understate the impact on smaller businesses occupying lower-square-foot retail spaces. Even so, the data clearly suggest that New York is an outlier among major U.S. cities, with particularly acute concentrations of retail vacancy in certain neighborhoods.
Methodology
Data
This report utilizes data from Live XYZ which indexes and maps every visible storefront in New York City, providing a comprehensive directory of all occupied and vacant locations. Locations are organized into primary and sub-categories for storefront composition analysis. https://livexyz.com/. Data was accessed from Live XYZ on May 27, 2026. Current status was assessed as of April 15, 2026, the date on which Live XYZ completed ground surveys and had a complete, citywide assessment for Q12026.
Neighborhoods were defined using Neighborhood Tabulation Areas, as defined by the Department of City Planning.[6]
Defining vacancy
In this study, storefronts are counted as vacant when they have no occupying business. Storefronts with occupants that are temporarily closed, coming soon, or otherwise not operating are counted as occupied, not vacant.
This analysis defines vacancy rate as the count of storefronts that are not occupied divided by the count of all storefronts (within a given geography or category, as indicated)
All storefronts (those with public entrances from the street) are counted. Each storefront is given equal weight (i.e. there is no weighting by square footage, frontage, or other dimension).
Defining unique business
To analyze small business vacancy trends across New York City, the Comptroller’s Office developed a consistent, rule‑based system for classifying every storefront into one of three business‑type categories – Small Business, Chain, or Other – and for identifying whether each storefront was vacant or occupied in each quarter.
We first standardized business names to produce a clean, comparable name field that allowed us to reliably detect chains, non-profits, and generic placeholders. This normalization step ensured that “McDonald’s,” “McDonalds,” and “mc donalds” were treated as the same operator.
We classified storefronts as Chains using two complimentary approaches:
- Storefronts explicitly tagged with a chain identifier in the Live XYZ dataset.
- Any business name that appeared in five or more distinct locations citywide
The first approach produced a curated list of known national and international chains, while the second approach captured smaller local chains that operate at scale across the city.
We categorized businesses as “Other” by identifying storefronts that should not be treated as a small business because they represent institutions, public facilities, nonprofits, or ambiguous/generic entities. These included places like government offices, schools and universities, religious institutions, stadiums, arenas, department stores, and more.
The remaining storefronts were classified as small businesses. This approach ensures that small businesses are defined as:
- Independent operators
- Unique or infrequently occurring business names
- Not part of a chain
- Not institutional or ambiguous
Even with the classification system, some businesses that did not conform to these standards were mislabeled as a small business. These include businesses that have fewer than five locations but may have large staff and substantial revenues, local NYC business with few locations but have expanded outside of the five boroughs, and any national or global chain which Live XYZ’s curation system may have missed. These businesses represent a small fraction of the total dataset, and any individual misclassification of this type would have a small impact on the aggregate data as, by definition, businesses in this category have fewer than five locations total in New York.
Finally, business type and vacancy status were treated as separate dimensions. For each storefront and quarter, a storefront was categorized as vacant or occupied. If a storefront was currently vacant, it would retain the business type of the most recent operating business. If a location was newly built without a previous tenant or vacancy existed longer than the dataset provided identification for, the location was listed as solely vacant. This allowed us to measure vacancy within each business type and track transitions over time.
Storefront locations were spatially joined to Neighborhood Tabulation Area geography, then storefronts and vacancies were aggregated by borough and neighborhood, and vacancy rates were calculated at each level. Local clustering was computed using join count and local join count statistics, computed over 250-foot and 750-foot radii.[7]
Conclusion
Storefront vacancy remains a significant feature of New York City’s post-pandemic economic landscape. Elevated vacancy rates persist across many neighborhoods and commercial corridors. The findings in this report demonstrate that vacancy is unevenly distributed, often concentrated in clusters, and particularly acute in certain sectors and communities. At the same time, the data indicates that New York City’s small businesses continue to thrive and have resisted being overtaken by chains. As policymakers and stakeholders consider future interventions, a more comprehensive understanding of the drivers, duration, and localized impacts of storefront vacancy will be critical.
Acknowledgments
This report was prepared by Jacob Bogitsh, Policy Data Analyst, Dan Levine, Director of Data Analytics, Liya Rechtman, Policy Director – Transportation and Infrastructure, and Jordan Stockdale, Deputy Comptroller for Policy. Report design was completed by Archer Hutchinson, Creative Director and Danbin Weng, Multimedia Designer.
Endnotes
[1] Office of the New York City Comptroller. Bureau of Budgets. “Retail Vacancy in New York City: Trends and Causes 2007-2017.” September 2019.
[2] Because the dataset does not include business revenues or employee headcounts, which are the typical criteria used to define small businesses, we used the presence of a unique business name as an approximate proxy. For the purposes of this analysis, a storefront is categorized as a small business if it meets three conditions: 1) it is a business (after filtering out non‑business uses), 2) it is not labeled as a chain, and 3) its name appears at fewer than five storefronts citywide. See below for more detail on this classification method.
[3] Both Sunnyside Yards (North) and Hutchinson Metro Center have comparatively smaller storefront counts and limited geographic footprints, resulting in higher vacancy rates relative to NTAs with larger inventories
[4] According to Q1 2024 Brookings analysis of CoStar Market Research Data
[5] Q2 2025 CBRE analysis
[6] https://www.nyc.gov/content/planning/pages/resources/datasets/neighborhood-tabulation
[7] Anselin, Luc & Li, Xun. 2019. Operational Local Join Count Statistics for Cluster Detection. Journal of Geographical Systems. https://pmc.ncbi.nlm.nih.gov/articles/PMC6546301/