New York by the Numbers
Weekly Economic and Fiscal Outlook
By NYC Comptroller Scott M. Stringer
Preston Niblack, Deputy Comptroller
Andrew McWilliam, Director of Economic Research
No. 1 – May 18, 2020
Photo Credit: haeryung stock images / Shutterstock.comA Message from the Comptroller

We are living through extraordinary times – as a nation, as a city, and as individuals and communities. A pandemic is raging that has no parallel in the past century. And in an unprecedented move, our economy has been put on hold in order to protect lives and “flatten the curve.” The shutdown has resulted in mass layoffs and lost income for hundreds of thousands of New Yorkers, and a dramatic drop in tax revenues that blew a hole in the Fiscal Year 2021 budget proposed by Mayor de Blasio in January. In these difficult and uncertain times, I offer this weekly update on the state of our city’s economy and finances in order to provide the public, elected officials, advocates and experts with a clear-eyed, sober assessment of the challenges.
Make no mistake – New York City and our economy will recover. Together we have overcome many challenges, and I know we will rise to the one ahead.
Read the Comptroller’s presentation on the FY 21 Executive Budget
Sincerely,

Scott M. Stringer
The Economy
National Indicators
The U.S. economy continues to suffer the worst downturn on record since the Great Depression.
- U.S. Gross Domestic Product (GDP) fell 4.8 percent in the first quarter of 2020 (January through March) on an annualized basis, the worst quarterly decline since the fourth quarter of 2008 (Chart 1).
- Unemployment reached 14.7 percent for the month of April – the highest level since modern unemployment statistics began in 1948 (Chart 2).
Chart 1 and 2
- Since mid-March, initial jobless claims total 36.8 million, with continuing claims at 22.8 million.
New York City
- Since the COVID-19 pandemic led to the shutdown of nonessential businesses, nearly 931,000 New York City residents have applied for unemployment (Chart 3).
- Both residential and commercial real estate transactions declined by over 30 percent in March 2020 compared to March 2019 (Chart 4). This is the largest year-over-year decline since 2009 when residential sales declined by 34 percent and commercial sales declined by 32 percent. The number of transaction is lower than its March 2009 level.
Chart 3 and 4
City Finances
COVID Spending and Federal Funding
The authorized budget for COVID-related spending is $2.623 billion for FY 2020 as of May 15 (Table 1). More than half of this spending, $1.42 billion is for medical, surgical and lab supplies. Other significant COVID-related spending includes $246 million for NYC Health+Hospitals, $379 million for COVID-19 response in the Department of Emergency Management, and $250 million for uniformed agencies overtime.
Of this total, $2.09 billion has been committed – that is, the City has incurred contractual obligations for that amount – and $427 million has been expended. Medical, surgical and lab supplies account for $1.1 billion of the commitments.
Table 1: COVID19 Budget and Expenditures, FY 2020
| Budgeted | Committed | Expended | |
| Medical, Surgical and Lab Supplies | $1.424 B | $1.111 B | $209 M |
| NYC Health+Hospitals | 246 M | 0 | 0 |
| Dept. of Emergency Management | 379 M | 278 M | 44 M |
| Uniformed Agencies Overtime | 250 M | 0 | 0 |
| Other | 324 M | 701 M | 174 M |
| Total | $2.623 B | $2.090 B | $427 M |
SOURCE: Office of the Comptroller from FMS.
The City anticipates receiving $4.3 billion in COVID-related federal revenues as of the April 16 Executive Budget (Table 2). The majority consists of reimbursement from the Federal Emergency Management Agency (FEMA) for 75 percent of emergency COVID19-related expenditures. The City recognized $1.4 billion in CARES Act funding from the Coronavirus Relief Fund, of which $800 million is being treated as available for all COVID-related expenditures. The City is reserving the remaining $600 million to cover its share of the 25% match for FEMA Disaster Relief reimbursement. If the match is ultimately waived by the federal government, the funds will be available for other purposes.
Table 2: Federal COVID Stimulus Aid Funding to New York City Budget
| Source/Purpose | FY 2020 | FY 2021 | TOTAL |
| FEMA Disaster Relief | $1.874 B | $38 M | $1.911 B |
| Unrestricted CARES Act Funding | 800 M | – | $800 M |
| Restricted CARES Act Funding | 600 M | – | $600 M |
| Enhanced FMAP | 498 M | 444 M | $942 M |
| Other | 45 M | – | $45 M |
| TOTAL | $3.817 B | $482 M | $4.298 B |
SOURCE: Office of the Comptroller
On Monday, May 11, the federal Department of Housing and Urban Development announced the allocation of $1 billion in CARES Act coronavirus relief funding through the Community Development Block Grant (CDBG) program. New York State received $70.5 million, or about 7% of the total. The City’s share of this total remains to be determined. The City previously was allocated $102 in the first round of CDBG coronavirus relief funds, in addition to $50.5 million in Emergency Shelter Grants and $6.4 million through the Housing Opportunity for People With AIDS (HOPWA) program. The New York City Housing Authority (NYCHA) also received $149.9 million.
Cash Position
The City’s central treasury balance (funds available for expenditure) stood at $6.608 billion as of Thursday, May 14. At the same time last year, the City had $8.384 billion.
On April 20, 2020 the City received $1.454 billion from the Federal government as part of the CARES Act.
Chart 5
Federal and State Developments
New York State
On Friday, the State Comptroller released an update on cash collections for the month of April, reporting a 68 percent drop in revenues compared to last April, or $7.9 billion. Although much of the drop is attributable to the delay of the April personal income tax filing deadline until July, the report is the basis on which the State Division of the Budget (DOB) could announce across-the-board cuts to the enacted State budget. The DOB released an enacted budget update on April 24th showing a $13.3 billion gap in the current fiscal year and proposing $8.2 billion in cuts to aid to localities as one step toward closing the gap.
Federal Government
The House of Representatives voted Friday on a $3 trillion fourth round of coronavirus relief funding. The bill – which will form the starting point for negotiations with the Senate and White House – would provide substantial fiscal assistance to beleaguered state and local governments. Among other things, the federal government would assume up to 14% of Medicaid spending by states and reimburse state and local governments for 100% of FEMA-eligible COVID spending (currently reimbursed at 75%).
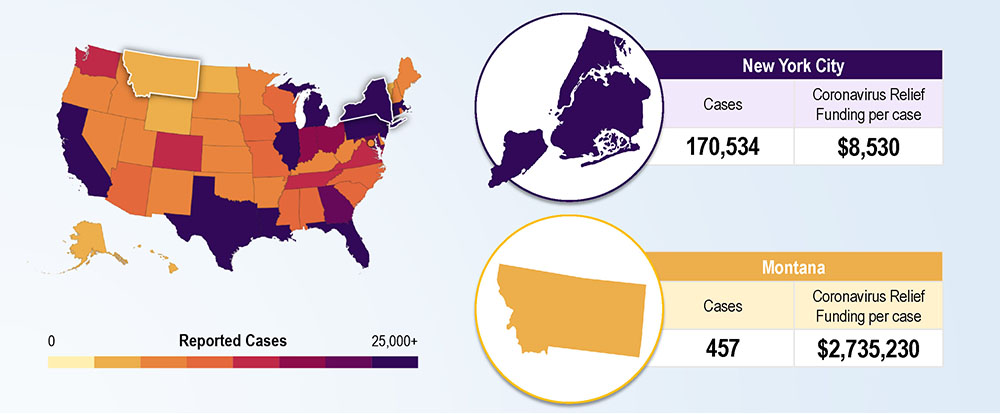
The initial $150 billion Coronavirus Relief Fund was distributed on the basis of state population only, with 17 states receiving the minimum payment of $1.25 billion. As a result, New York City, with over 170,000 cases as of the end of April, received the equivalent of just $8,500 per case, while Montana, with 457 cases, received $2.7 million per case.
Comptroller Stringer has highlighted the patent unfairness of this distribution formula – not only because New York City represents one-third of all COVID cases in the U.S., but also because New York contributes some $26.6 billion more in tax revenues to the federal government every year than it receives back in federal spending and benefits.
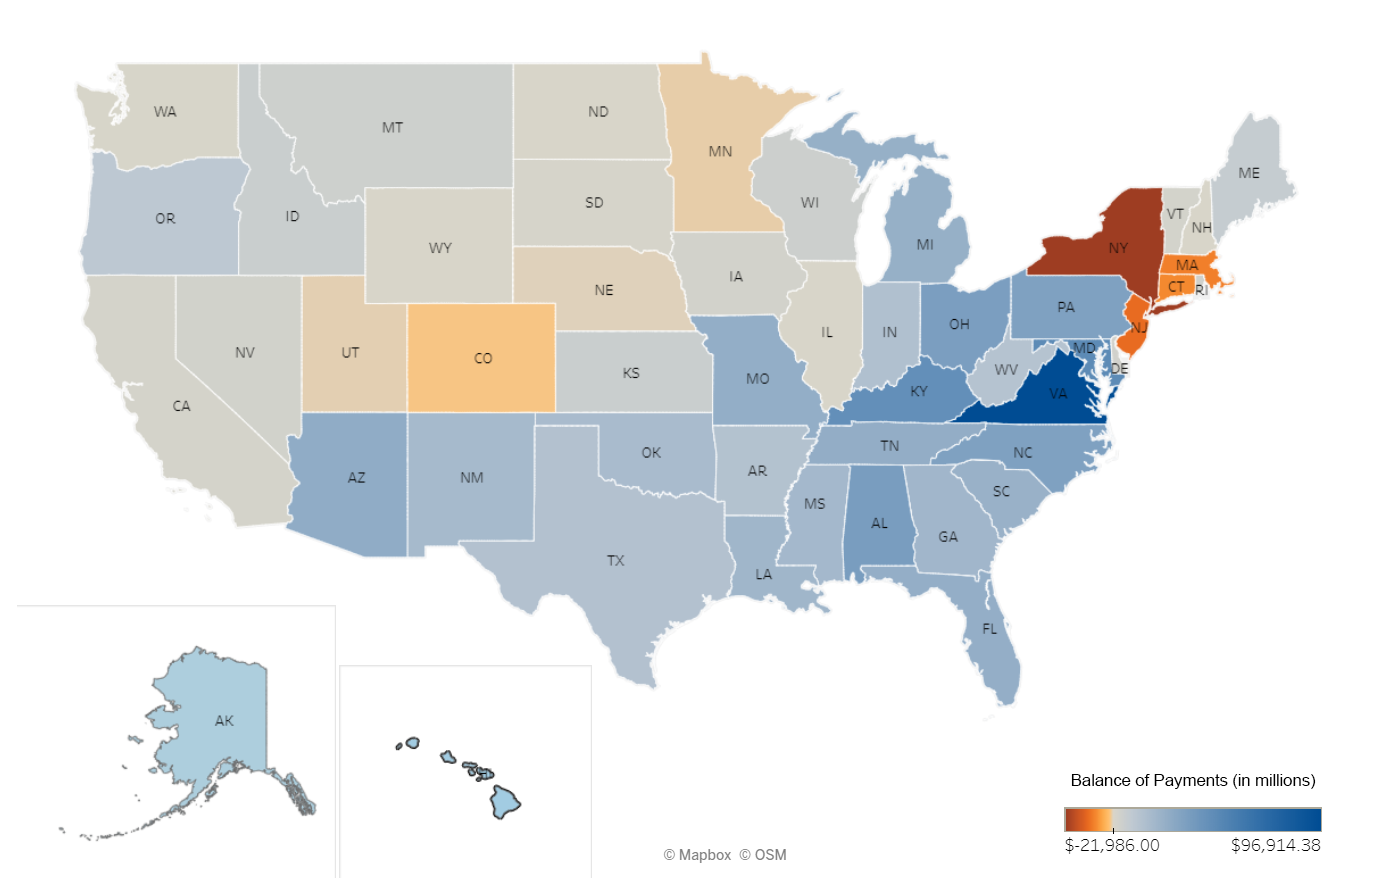
| State | Balance of Payments |
| New York | -$21.9 B |
| New Jersey | -$11.5 B |
| Massachusetts | -$9.1 B |
| Connecticut | -$8.1 B |
| Montana | $4.2 B |
| Florida | $24.9 B |
| Kentucky | $45.2 B |
SOURCE: SUNY Rockefeller Institute of Government
Spotlight of the Week
Summer Youth Programs

As part of the Executive Budget released in April, Mayor de Blasio proposed saving more than $175 million by suspending summer youth programs provided by the City’s Department of Youth and Community Development (DYCD) for the upcoming season. The cuts would impact nearly 175,000 youth.[1] According to DYCD, the decision was made out of an abundance of caution for participants and providers.
About two-thirds of the savings would stem from suspending the popular Summer Youth Employment Program (SYEP). Last summer SYEP provided paid work and educational experience to more than 74,000 city adolescents through more than 13,000 work sites and 808 learning projects.[2] While the program has more than doubled since 2010, applications have far exceeded funding capacity. Last year roughly 150,000 young people applied for a slot.
Other DYCD-funded summer youth services and camps that would also be suspended under the Mayor’s proposal include Comprehensive After School System (COMPASS) for elementary students, Beacon, Cornerstone, and School’s Out NYC (SONYC). COMPASS and SONYC provide programming to about 70,000 youth during the summer, while Beacon and Cornerstone sites serve another 30,000.
In my response to the Mayor’s FY 2021 Executive Budget, I demanded answers from the City on its decision to suspend SYEP – noting the cancellation will impact our city’s youngest New Yorkers as well as burden providers with costs and force them to abruptly lay off staff. I have urged the City to ensure that budgetary decisions do not jeopardize our children’s futures and the ability of the city’s nonprofit organizations to continue to serve New Yorkers.
Table 3
| Proposed cuts to Summer Youth Programs in FY 2021 | ($ in thousands) |
| Summer Youth Employment Program | $115,984 |
| Comprehensive After School System (COMPASS) Elementary | $36,570 |
| Cornerstone | $8,536 |
| Beacon | $8,534 |
| School’s Out NYC (SONYC) | $5,730 |
| Total | $175,354 |
[1] https://www.cccnewyork.org/blog/youth-services-in-nyc-who-they-serve-and-why-they-are-necessary-to-a-covid-recovery-plan/
http://www.campaignforchildrennyc.com/news/fund-youth-nyc-sign-on-letter
[2] https://www1.nyc.gov/assets/dycd/downloads/pdf/2019_NYC_SYEP_Annual_Summary.pdf