New York by the Numbers
Weekly Economic and Fiscal Outlook
By NYC Comptroller Scott M. Stringer
Preston Niblack, Deputy Comptroller
Andrew McWilliam, Director of Economic Research
No. 10 – July 20, 2020
Photo Credit: tetiana.photographer / Shutterstock.comA Message from the Comptroller

We are living through extraordinary times – as a nation, as a City, and as individuals and communities. A pandemic is raging that has no parallel in the past century. And in an unprecedented move, our economy was put on hold in order to protect lives and “flatten the curve,” resulting in mass layoffs and lost income for hundreds of thousands of New Yorkers, and a dramatic drop in tax revenues. In these difficult and uncertain times, I offer this weekly update on the state of our City’s economy and finances in order to provide the public, elected officials, advocates and experts with a clear-eyed, sober assessment of the challenges.
Make no mistake – New York City will recover. Together we have overcome many challenges, and I know we will rise to the one ahead.
Sincerely,

Scott M. Stringer
The Economy
National Indicators
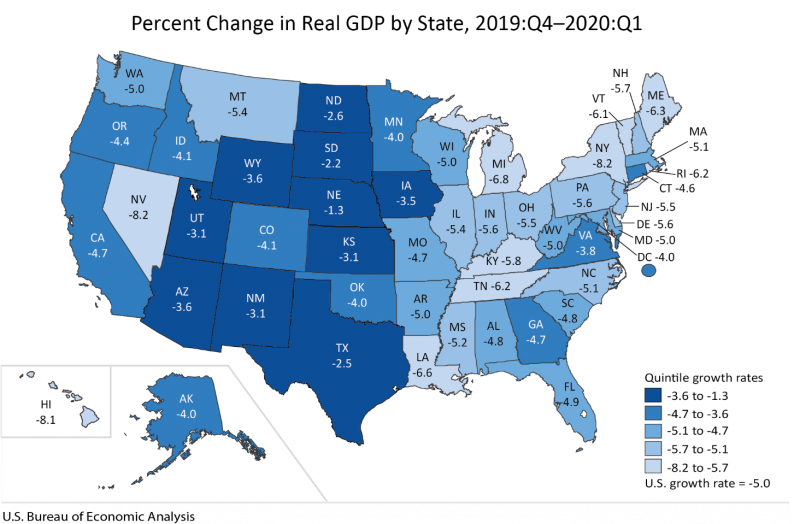
- U.S GDP declined by 5% from the 4th quarter of 2019 to the 1st quarter of 2020, reflecting widespread shutdowns at the end of March (Figure 1).
- New York State GDP declined by 8.2%, tied with tourism dependent Nevada for the largest GDP decline in the nation.
Figure 1
- U.S. employment rose by 4.8 million in June – an increase of 4.3%. New York State employment rose by 296,000, an increase of 4.5%.
- The U.S. unemployment rate fell from 13.3% in May to 11.1% in June.
- Initial claims for unemployment insurance fell modestly again to 1.3 million for the week ending July 11th (Chart 1). Continuing claims also declined to 17.3 million, from 18 million the prior week.
Chart 1
- Pandemic Unemployment Assistance (PUA), enacted as part of the CARES Act, covers workers who are typically not eligible for state unemployment benefits, including the self-employed or those unable to work due to COVID-19. Regular and PUA continuing claims together cover over 32 million unemployed Americans (Chart 2).
Chart 2
New York State and New York City
- The New York Federal Reserve’s Empire State Manufacturing Survey (Chart 3) conducted in early July and released July 15 shows the index rose to 17.2. Positive index values indicate improving business conditions, and this represents the first improvement in New York State business activity since February.
- Orders, shipments, and delivery times increased. Inventories and selling prices declined. Employment levels and hours worked remained unchanged.
- Optimism about future changes declined from June but remained positive.
Chart 3
SOURCE: https://www.newyorkfed.org/survey/empire/empiresurvey_overview.html
Note: The shaded areas indicate periods of recession by the National Bureau of Economic Research.
- The New York City unemployment rate rose from 18.3% to 20.4%. The increase largely reflects higher June labor force participation, which had dipped from 60.4% in February to 55.8% in April. Since then, more New Yorkers have begun looking for work again as the economy begins to re-open.
- Initial unemployment claims by New York City residents remained roughly flat for the week ending July 11, at 46,256 (Chart 4).
Chart 4
SOURCE: New York State, Department of Labor
MTA Ridership
- Average weekday MTA subway ridership rose to 1.22 million during the week beginning July 13th (through Thursday), an increase of roughly 6% from the previous week. Average weekday bus ridership also increased to nearly 1.20 million (Chart 5). Prior to the shutdown, weekday ridership averaged 5.4 million on subways and 2.2 million on buses.
Chart 5
SOURCE: Metropolitan Transportation Authority, Day-by-Day Ridership Numbers.
NOTE: Excludes holidays. Figures for the week ending July 17 includes data through Thursday, July 16.
- Manhattan small business revenue was already declining in early March, and had declined by 70% by the end of March, as businesses shut, and commuters stayed home. Despite some recovery Manhattan small business revenue in early July is still down over 40% from the beginning of January.
- Outer borough small businesses, less dependent on commuters, fared better but still experienced revenue declines of 40% to 60% by early April. In July, Staten Island and Queens small business revenue remains down over 20% from January.
Chart 6
SOURCE: Womply, via tracktherecovery.org
City Finances
COVID Spending
- The authorized modified FY 2020 budget for COVID-related spending is $4.01 billion for FY 2020 (Table 1). One third of the budget, $1.34 billion, is for medical, surgical and laboratory supplies. The modified budget also anticipates that $351 million of employee health insurance expenditures will be eligible for Federal COVID reimbursement.
- Of the total authorized COVID budget, $2.78 billion has been committed – that is, the City has incurred obligations for that amount – as of July 15. Medical, surgical and lab supplies account for $1.26 billion of the commitments. Of the total commitments, $1.45 billion has been expended.
Table 1: COVID-19 Budget and Expenditures, FY 2020
| Budgeted | Committed | Expended | |
| Medical, Surgical and Lab Supplies | $1.343 B | $1.260 B | $541 M |
| NYC Health+Hospitals | 246 M | – | – |
| Dept. of Emergency Management | 377 M | 341 M | 181 M |
| Uniformed Agencies Overtime | 145 M | – | – |
| Dept. of Design and Construction | 223 M | 143 M | 111 M |
| Dept. of Small Business Services | 168 M | 147 M | 92 M |
| Dept. of Education | 119 M | 141 M | 45 M |
| Dept. of Homeless Services | 140 M | 49 M | 19 M |
| Health Insurance | 351 M | – | – |
| Food/Forage | 310 M | 280 M | 273 M |
| Other | 587 M | 415 M | 184 M |
| Total | $4.009 B | $2.776 B | $1.446 B |
SOURCE: Office of the Comptroller from FMS.
NOTE: Expenditures in Dept. of Emergency Management, Dept. of Education and Dept. of Homeless Services are net of expenditures for food and forage, shown separately.
COVID Contracts
- Through July 15, the City has registered $3.27 billion in contracts to procure goods and services in response to the COVID pandemic (Table 2). More than a quarter of the contracts, $883 million, are for the procurement of personal protective equipment (PPE). Other significant contracts include $505 million for medical staffing for COVID-19, food related contracts for $620 million, $349 million for hotels, $146 million for ventilators and $100 million for testing centers, as shown in Table 2.
Table 2: Registered COVID Contracts through 7-15-2020
| Maximum Contract Amount | |
| Personal Protective Equipment | $883 M |
| Ventilators | 146 M |
| Medical Staffing for COVID-19 | 505 M |
| Hotels | 349 M |
| Food Related Contracts | 620 M |
| IT Related Contracts | 93 M |
| Temporary Staff Contracts | 24 M |
| Testing Centers | 100 M |
| Other Medical, Surgical and Lab Supplies | 197 M |
| Other | 353 M |
| Total | $3.270 B |
SOURCE: Office of the Comptroller analysis of NYC FMS data.
NOTE: Includes only contracts with COVID budget codes.
Cash Position
- The City’s central treasury balance (funds available for expenditure) stood at $12.004 billion as of Wednesday, July 15. At the same time last year, the City had $9.627 billion (Chart 7). The Comptroller’s Office’s review of the City’s cash position during the first quarter and projections for cash balances through September 30th, 2020, are available here.
Chart 7
State Developments
- On July 15, the Office of the State Comptroller released the State’s financial results for the month of June. Total state tax receipts were $1.5 billion, or 17%, below total collections last June. (Table 3.) For the first three months of the fiscal year, total tax collections were down 42%, in part due to the tax return filing extension from April to July.
- While the state budget enables the Governor and the Division of Budget (DOB) to maintain budget balance by implementing mid-year spending reductions, the Governor has yet to present a plan. A supplement to the State’s Annual Information Statement published on July 8 revealed that DOB does not expect to present a plan until late in the second quarter of state fiscal year 2021 (September 2020). DOB acknowledged that it has begun withholding a minimum of 20 percent of most local aid payments and noted that it will continue to do so in the absence of unrestricted federal aid.
Table 3: New York State All Funds Tax Receipts
| $ in millions | June 2019 | June 2020 | $ Diff. | % Diff. | April-June 2019 | April-June 2020 | $ Diff. | % Diff. |
| Personal Income Tax |
5,210 | 4,369 | -841 | -16% | 16,910 | 8,634 | -8,276 | -49% |
| Consumption/ Use Taxes |
1,775 | 1,389 | -387 | -22% | 4,491 | 3,350 | -1,141 | -25% |
| Business Taxes | 1,497 | 1,194 | -303 | -20% | 2,220 | 1,513 | -707 | -32% |
| Other Taxes | 163 | 198 | 35 | 22% | 471 | 429 | -42 | -9% |
| Total State Taxes | $8,645 | $7,149 | -$1,495 | -17% | $24,091 | $13,926 | -$10,166 | -42% |
Spotlight of the Week
Mounting Challenges for Institutes of Higher Education
In any other year, New York City would welcome the late summer arrival of students and faculty from all over the world to the city’s roughly 120 institutes of higher education. In 2019, the city’s colleges and universities enrolled more than half a million students and employed nearly 121,000 workers. This year, however, the arrival of students and faculty is far less certain.
In recent weeks, schools have begun to announce detailed reopening plans. According to a tracker from the Chronicle of Higher Education, among undergraduate institutions that have announced plans, about 75% of New York City colleges and universities plan to offer a hybrid model of in-person and online learning, including City University of New York (CUNY) campuses. Conversely, across the country currently more than half of campuses plan to reopen in person.
NYC Undergrad
SOURCE: NYC Comptroller’s Office analysis of data provided by The Chronicle of Higher Education.
Note: Data is current as of July 15, 2020 and includes institutions that serve undergraduate students. CUNY campuses are counted individually. According to The Chronicle, “Colleges that plan a mix of online, in-person, hybrid, or blended learning are classified as ‘hybrid.’ Colleges that intend to convene only a few classes in person, such as labs, are classified as ‘online.’”
Institutes of higher education face a multitude of challenges including health and safety concerns, travel restrictions, financial uncertainty, changing visa rules for international students, and a recent spike in COVID-19 cases among young adults. While blaming a dim fiscal outlook and the absence of federal funding, CUNY notified 2,800 adjunct faculty and staff in late June that they would not be reappointed in the fall. The union representing CUNY staff filed a lawsuit in federal court shortly thereafter, alleging that the layoffs violate the terms of federal coronavirus aid.
Further complicating plans, on July 6 the U.S. Immigration and Customs Enforcement (ICE) announced that students would be denied visas if their fall classes were fully online. However, following widespread criticism and legal challenges, ICE withdrew the guidelines on July 14.