New York by the Numbers
Weekly Economic and Fiscal Outlook
By NYC Comptroller Scott M. Stringer
Preston Niblack, Deputy Comptroller
Andrew McWilliam, Director of Economic Research
No. 12 – August 3, 2020
Photo Credit: MAYUMI NASHIDA / Shutterstock.comA Message from the Comptroller

We are living through extraordinary times – as a nation, as a City, and as individuals and communities. A pandemic is raging that has no parallel in the past century. And in an unprecedented move, our economy was put on hold in order to protect lives and “flatten the curve,” resulting in mass layoffs and lost income for hundreds of thousands of New Yorkers, and a dramatic drop in tax revenues. In these difficult and uncertain times, I offer this weekly update on the state of our City’s economy and finances in order to provide the public, elected officials, advocates and experts with a clear-eyed, sober assessment of the challenges.
Make no mistake – New York City will recover. Together we have overcome many challenges, and I know we will rise to the one ahead.
Sincerely,

Scott M. Stringer
The Economy
National Indicators
- U.S. GDP decreased by 32.9% (at an annualized rate) in the second quarter of 2020, the largest decline since the inception of quarterly GDP statistics in 1947 (Chart 1).
Chart 1
SOURCE: U.S. Bureau of Economic Analysis
- Initial claims for unemployment insurance remained unchanged at 1.4 million for the week ending July 25. Continuing claims rose from 16.2 million to 17.0 million (Chart 2).
Chart 2
SOURCE: U.S. DOL
- Regular and Pandemic Unemployment Assistance (PUA) continuing claims together covered over 28.5 million unemployed Americans as of July 11, down from 30.5 million the prior week (Chart 3). Pandemic Unemployment Assistance, enacted as part of the CARES Act, covers workers who are typically not eligible for state unemployment benefits, including the self-employed or those unable to work due to COVID-19.
Chart 3
SOURCE: U.S. DOL
New York State and New York City
- Initial unemployment claims by New York City residents remained at about 46,000 for the week ending July 25, the same as the previous two weeks (Chart 4).
Chart 4
SOURCE: NYS DOL
Wall Street Profits
- The 1st quarter of 2020 was Wall Street’s most profitable quarter in over a decade. Wall Street firms were able to take advantage of market volatility to realize quarterly pretax profits of $10.7 billion (Chart 5).
Chart 5
SOURCE: Intercontinental Exchange/NYSE
Small Business Revenue
- New York City small business revenue continues to recover slowly but remains 10% below January levels in Queens, and over 40% below January levels in Manhattan (Chart 6).
Chart 6
SOURCE: Womply, via tracktherecovery.org
MTA Ridership
- Average weekday ridership on MTA subways has been roughly flat over the last two weeks (Chart 7). However, ridership reached post-lockdown highs of 1.29 million on subways and 1.27 million on buses on Wednesday, July 29. Weekday subway ridership is still about 77% below typical levels.
Chart 7
SOURCE: Metropolitan Transportation Authority, Day-by-Day Ridership Numbers.
NOTE: Excludes holidays. Figures for the week ending July 31 includes data through Thursday, July 30.
City Finances
COVID Spending
- The authorized modified FY 2020 budget for COVID-related spending is $4.01 billion. One third of the budget, $1.34 billion, is for medical, surgical and laboratory supplies. The modified budget also anticipates that $351 million of employee health insurance expenditures will be eligible for Federal COVID reimbursement.
- Of the total authorized COVID budget, $2.88 billion has been committed – that is, the City has incurred obligations for that amount – as of July 29. Medical, surgical and lab supplies account for $1.17 billion of the commitments. Of the total commitments, $1.85 billion has been expended.
Table 1: Covid19 Budget and Expenditures, FY 2020
| Budgeted | Committed | Expended | |
| Medical, Surgical and Lab Supplies | $1.343 B | $1.165 B | $569 M |
| NYC Health+Hospitals | 246 M | – | – |
| Dept. of Emergency Management | 377 M | 299 M | 189 M |
| Uniformed Agencies Overtime | 145 M | 30 M | 30 M |
| Dept. of Design and Construction | 223 M | 148 M | 117 M |
| Dept. of Small Business Services | 168 M | 146 M | 121 M |
| Dept. of Education | 119 M | 140 M | 78 M |
| Dept. of Homeless Services | 140 M | 68 M | 28 M |
| Health Insurance | 351 M | – | – |
| Food/Forage | 310 M | 306 M | 303 M |
| Other | 587 M | 579 M | 410 M |
| Total | $4.009 B | $2.881 B | $1.845 B |
SOURCE: Office of the Comptroller from FMS.
NOTE: Expenditures in Dept. of Emergency Management, Dept. of Education and Dept. of Homeless Services are net of expenditures for food and forage, shown separately.
COVID Contracts
- Through July 29, the City has registered $3.42 billion in contracts to procure goods and services in response to the COVID pandemic. Almost a quarter of the contracts, $847 million, are for the procurement of personal protective equipment (PPE). Other significant contracts include $781 million for food related contracts, $505 million for medical staffing for COVID-19, $349 million for hotels, $141 million for ventilators and $100 million for testing centers.
Table 2: Registered COVID Contracts through 7-29-2020
| Maximum Contract Amount | |
| Personal Protective Equipment | $847 M |
| Ventilators | 141 M |
| Medical Staffing for COVID-19 | 505 M |
| Hotels | 349 M |
| Food Related Contracts | 781 M |
| IT Related Contracts | 93 M |
| Temporary Staff Contracts | 24 M |
| Testing Centers | 100 M |
| Other Medical, Surgical and Lab Supplies | 197 M |
| Other | 378 M |
| Total | $3.415 B |
NOTE: Includes only contracts with COVID budget codes.
Cash Position
- The City’s central treasury balance (funds available for expenditure) stood at $11.2 billion as of Wednesday, July 29 (Chart 8). At the same time last year, the City had $8.5 billion. The Comptroller’s Office’s review of the City’s cash position during the first quarter and projections for cash balances through September 30th, 2020, are available here.
Chart 8
Spotlight of the Week
Outdoor Dining by Neighborhood
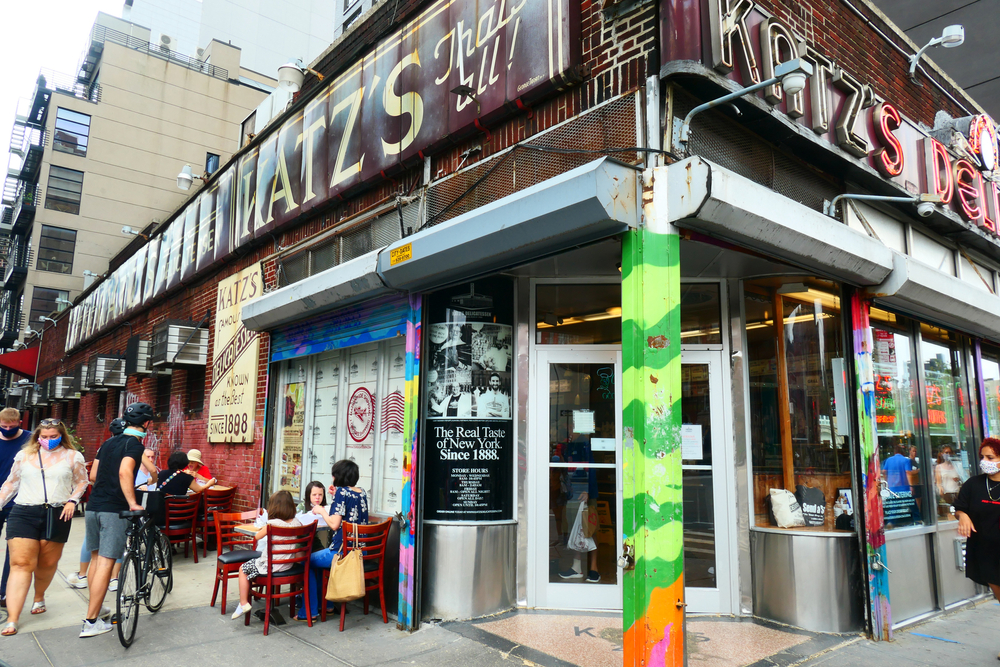
MAYUMI NASHIDA / Shutterstock.com
Since New York City entered phase two of reopening on June 22, restaurants have been allowed to offer outdoor seating, either on sidewalks or roadways. Indoor dining remains indefinitely prohibited. To operate outdoor seating, restaurants must abide by dozens of mandatory, and evolving, guidelines and follow recommended best practices related to physical distancing, protective equipment, hygiene and cleaning, communication and employee screening.
The current ban on indoor dining has compelled restaurants across the City to find creative approaches to installing outdoor dining spaces on sidewalks, streets or other areas in close physical proximity to the restaurant itself. New York’s definition of “outdoor space” only requires the absence of a fixed roof which has given restauranteurs some latitude to create outdoor dining spaces that suit their needs. However, some number of restaurants in New York, because of the circumstances of their location, have faced obstacles to reopening, including the availability and practicality of nearby outdoor dining space itself, new changes to pedestrian activity that may hamper a restaurant’s ability to attract customers, and access to resources for outdoor dining infrastructure.
As of July 29, 2020 close to 8,000 restaurants in New York City have applied to open outdoor seating on sidewalks and streets and over 99 percent of those applications have been approved for at least one of those forms of outdoor seating. The twenty neighborhoods in New York City with the greatest number of restaurants are detailed in the table below. Restaurant-rich neighborhoods with large stocks of commercial office space such as Midtown- and Lower-Manhattan have seen lower outdoor dining application rates compared to counterpart neighborhoods such as Astoria, Jackson Heights and the East Village.
Table 3: Outdoor Dining Applications in Neighborhoods with the Greatest Number of Restaurants
| Neighborhood Tabulation Area | Restaurants | Applications | Application Rate |
| Midtown-Midtown South | 1,734 | 360 | 20.8% |
| Hudson Yards-Chelsea-Flatiron-Union Square | 773 | 288 | 37.3% |
| West Village | 769 | 424 | 55.1% |
| SoHo-TriBeCa-Civic Center-Little Italy | 682 | 309 | 45.3% |
| Turtle Bay-East Midtown | 582 | 158 | 27.1% |
| East Village | 556 | 343 | 61.7% |
| Clinton | 530 | 219 | 41.3% |
| Chinatown | 523 | 209 | 40.0% |
| Battery Park City-Lower Manhattan | 496 | 113 | 22.8% |
| Flushing | 458 | 50 | 10.9% |
| Park Slope-Gowanus | 417 | 203 | 48.7% |
| North Side-South Side | 396 | 230 | 58.1% |
| Astoria | 372 | 226 | 60.8% |
| Hunters Point-Sunnyside-West Maspeth | 342 | 162 | 47.4% |
| Upper West Side | 325 | 155 | 47.7% |
| DUMBO-Vinegar Hill-Downtown Brooklyn-Boerum Hill | 318 | 116 | 36.5% |
| Murray Hill-Kips Bay | 317 | 110 | 34.7% |
| Sunset Park East | 295 | 50 | 16.9% |
| Jackson Heights | 292 | 151 | 51.7% |
| Bay Ridge | 289 | 135 | 46.7% |