New York by the Numbers
Weekly Economic and Fiscal Outlook
By NYC Comptroller Scott M. Stringer
Preston Niblack, Deputy Comptroller
Andrew McWilliam, Director of Economic Research
No. 13 – August 10, 2020
Photo Credit: Kits Pix / Shutterstock.comA Message from the Comptroller

We are living through extraordinary times – as a nation, as a City, and as individuals and communities. A pandemic is raging that has no parallel in the past century. And in an unprecedented move, our economy was put on hold in order to protect lives and “flatten the curve,” resulting in mass layoffs and lost income for hundreds of thousands of New Yorkers, and a dramatic drop in tax revenues. In these difficult and uncertain times, I offer this weekly update on the state of our City’s economy and finances in order to provide the public, elected officials, advocates and experts with a clear-eyed, sober assessment of the challenges.
Make no mistake – New York City will recover. Together we have overcome many challenges, and I know we will rise to the one ahead.
Sincerely,

Scott M. Stringer
Read the Comptroller’s Comments on the FY 2021 Adopted Budget, and remarks at the annual meeting of the New York State Financial Control Board.
The Economy
National Indicators: A “Reverse Square Root” Recovery?
- After an initial partial recovery in May and June, job growth slowed in July, with 1.8 million jobs added to employer payrolls (Chart 1). Private sector job growth was 1.5 million.
- The unemployment rate declined to 10.2%, from 11.1% in June and a peak of 14.7% in April.
- The slowdown in the jobs recovery nationally was most likely due to the resurgence of COVID infections in the South and West in July which led to tightening of restrictions in several states.
- This leaves employment down 8.4%, or 12.9 million jobs, below its pre-pandemic (February) peak of 152.5 million.
Chart 1
SOURCE: Bureau of Labor Statistics
- Roughly 45% of private sector job losses between February and April have been recovered by July (Chart 2). Construction (59%), personal services (54.2%), and trade, transportation and utilities (49.1%) have shown the strongest rebounds. The leisure and hospitality sector, which suffered a catastrophic 49.3% employment loss through April, has recovered nearly 48% of jobs lost nationwide.
- Professional and business services and financial activities – which had relatively smaller losses – have also recovered fewer of the jobs lost (28.2% and 22.6%, respectively). The information sector continues to lose jobs, down 11.4% since February.
Chart 2
- Seasonally-adjusted initial claims for unemployment insurance fell for the last week of July to under 1.2 million (Chart 3).
- Seasonal adjustment factors may not be applicable in the current economic conditions; the unadjusted figures have declined more steadily, falling by 35% over the past three weeks, to under 1 million.
- Initial claims still exceed the previous peak of 665,000 during the 2008/09 recession by nearly 80 percent.
Chart 3
- Initial claims for Pandemic Unemployment Assistance, PUA, also fell this week, dropping 28% to 655,707. PUA, enacted as part of the CARES Act, covers workers who are typically not eligible for state unemployment benefits, including the self-employed or those unable to work due to COVID-19.
- Regular and PUA continuing claims together covered 29.8 million unemployed Americans as of the week ending July 18th (Chart 4).
Chart 4
New York City
- Initial unemployment claims by New York City residents fell below 40,000 for the first time since the start of the pandemic in the last week of July (Chart 5).
Chart 5
SOURCE: NYS DOL
- Average weekday MTA subway and bus ridership dipped slightly during the week ending August 7 in part due to a decline during Tropical Storm Isaias (Chart 6).
- As of August 5, subway ridership was about 76% below typical levels while bus ridership was down 40%.
Chart 6
SOURCE: Metropolitan Transportation Authority, Day-by-Day Ridership Numbers.
NOTE: Excludes holidays. Figures for the week ending August 7 includes data through Wednesday, August 5.
- MTA Bridge and Tunnel crossings are much closer to recovering their pre-pandemic levels, with a 7-day average of over 767,000 crossings for the week ending August 5th – roughly 13 percent below the level prior to shutdowns in March (Chart 7). The rate of growth slowed during the month of July, however.
Chart 7
City Finances
Revenues
- City personal income taxes (PIT) withheld from wages and salaries of employees (withholding) has continued its negative downward trend since the beginning of the pandemic with four consecutive months of year-over-year declines (Chart 8).
- Following June’s smaller decline of 2.3 percent, July took a downward turn, declining by 7.9 percent.
- In the four-month period from April through July, the City has lost over $225 million in withholding revenue compared to last year.
Chart 8
SOURCE: NYS Dept. of Taxation and Finance
COVID Spending
- The authorized modified FY 2020 budget for COVID-related spending is $4.01 billion (Table 1). One third of the budget, $1.34 billion, is for medical, surgical and laboratory supplies. The modified budget also anticipates that $351 million of employee health insurance expenditures will be eligible for Federal COVID reimbursement.
- Of the total authorized COVID budget, $2.77 billion has been committed – that is, the City has incurred obligations for that amount – as of August 5. Medical, surgical and lab supplies account for $1.02 billion of the commitments.
- Of the total commitments, $1.96 billion has been expended – an increase of $548 million from last week’s report.
Table 1: COVID19 Budget and Expenditures, FY 2020
| Budgeted | Committed | Expended as of July 29 |
Expended as of Aug. 5 |
|
| Medical, Surgical and Lab Supplies | $1.343 B | $1.018 B | $529 M | $571 M |
| NYC Health+Hospitals | 246 M | – | – | – |
| Dept. of Emergency Management | 377 M | 299 M | 171 M | 191 M |
| Uniformed Agencies Overtime | 145 M | 76 M | – | 76 M |
| Dept. of Design and Construction | 223 M | 149 M | 111 M | 117 M |
| Dept. of Small Business Services | 168 M | 143 M | 92 M | 125 M |
| Dept. of Education | 119 M | 113 M | 43 M | 86 M |
| Dept. of Homeless Services | 140 M | 69 M | 15 M | 50 M |
| Health Insurance | 351 M | – | – | – |
| Food/Forage | 310 M | 322 M | 271 M | 319 M |
| Other | 587 M | 580 M | 177 M | 422 M |
| Total | $4.009 B | $2.769 B | $1.409 B | $1.957 B |
SOURCE: Office of the Comptroller from FMS.
NOTE: Expenditures in Dept. of Emergency Management and Dept. of Education are net of expenditures for food and forage, shown separately.
COVID Contracts
- Through August 5, the City has registered $3.45 billion in contracts to procure goods and services in response to the COVID pandemic (Table 2). Almost half of the contracts, $1.66 billion, are for food related contracts and the procurement of personal protective equipment (PPE). Other significant contracts include $505 million for medical staffing for COVID-19, $349 million for hotels, $141 million for ventilators and $100 million for testing centers.
Table 2: Registered COVID Contracts through 08-05-2020
| Maximum Contract Amount |
|
| Personal Protective Equipment | $794 M |
| Ventilators | 141 M |
| Medical Staffing for COVID-19 | 505 M |
| Hotels | 349 M |
| Food Related Contracts | 865 M |
| IT Related Contracts | 94 M |
| Temporary Staff Contracts | 24 M |
| Testing Centers | 100 M |
| Other Medical, Surgical and Lab Supplies | 197 M |
| Other | 384 M |
| Total | $3.453 B |
SOURCE: Office of the Comptroller analysis of NYC FMS data.
NOTE: Includes only contracts with COVID budget codes.
Cash Position
- The City’s central treasury balance (funds available for expenditure) stood at $10.791 billion as of Wednesday, August 5. At the same time last year, the City had $8.250 billion (Chart 9).
- The Comptroller’s Office’s review of the City’s cash position during the first quarter and projections for cash balances through September 30th, 2020, are available here.
Chart 9
Spotlight of the Week
How NYC is Spending Its Coronavirus Relief Funds
In late March, Congress appropriated $150 billion in Coronavirus Relief Funds to states and local governments. On April 20, New York City received its share – $1.455 billion to be used or committed by the end of calendar year 2020. Under federal law, funds may only be used for previously unbudgeted costs that are necessary expenditures related to the COVID-19 public health emergency. Funds may not be used to fill revenue shortfalls.
However, federal guidance clarified that a wide range of activities may qualify, including actions taken to address medical or public health needs or provide economic support to impacted residents and businesses. Allowable expenses include testing; purchasing medical and protective supplies; payroll for public safety, public health, and human services employees who are substantially dedicated to responding to the public health emergency; food delivery; facilitating distance learning; caring for homeless persons; and providing small business grants, among other eligible categories.
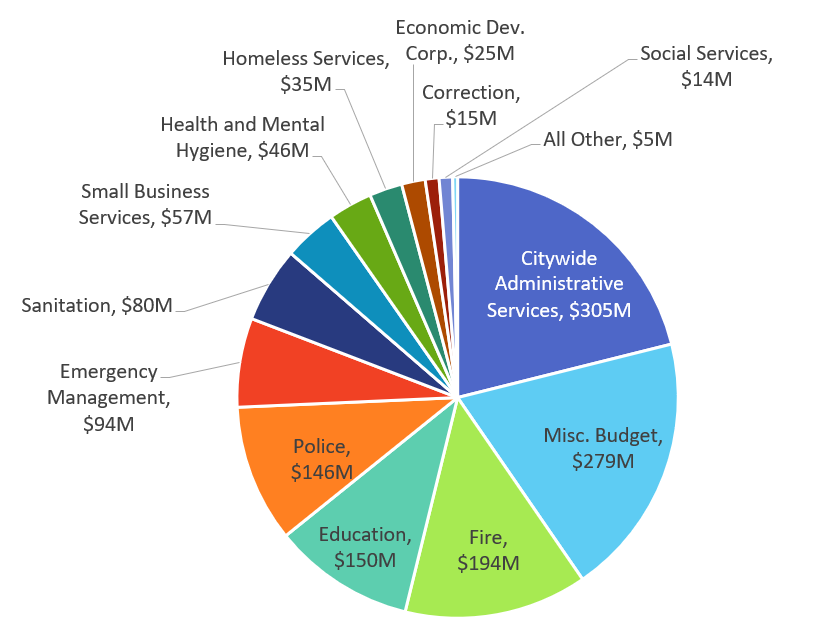
New York City used $1.446 billion in FY 2020 (ending June 30th) and anticipates using $3.4 million in FY 2021. The City’s allocation of the funds reflects the broad range of eligible uses and the broad impact that the pandemic has had on city services. Allocation plans in FY 2020 included $305 million for citywide administrative services, $194 million for the fire department (including emergency medical services), $150 million for the education department (including $136 million for regional enrichment centers), and $146 million for the police department. Other funds were allocated for new expenses in city jails, grants for small businesses, public health expenses, and homeless services.
While current reporting from the City allows for a broad analysis of relief funds by agency, the public would benefit from a more detailed accounting and tracking system of these limited federal resources.