New York by the Numbers
Weekly Economic and Fiscal Outlook
By NYC Comptroller Scott M. Stringer
Preston Niblack, Deputy Comptroller
Andrew McWilliam, Director of Economic Research
No. 18 – September 28, 2020
Photo Credit: Photo credit: CKY123 / Shutterstock.comA Message from the Comptroller

Dear New Yorkers,
The failure to enact another federal stimulus that provides real relief to the millions of Americans who are still unemployed is a stain on the Trump Administration and the Republican majority in the U.S. Senate. And it will have real consequences for the economy. As we note this week, personal income was sustained by pandemic unemployment relief in the spring – if it is not renewed and extended, the economic recovery will falter this Fall. Unemployment claims continue to be 5 times pre-pandemic levels, indicating that the jobs picture may not be improving as much as the unemployment statistics would suggest – and making relief for workers all the more urgent.
This week we spotlight the profound impact the COVID-19 pandemic has wrought on the City through a look at performance statistics in the annual Mayor’s Management Report, released last week for Fiscal Year 2020. Without a doubt, life in New York City changed this year, in ways both good and bad.
New Yorkers are coming together and working harder than ever to build our city back, and their resilience, creativity and determination are nothing short of inspiring. It is my hope that this weekly newsletter serves as a helpful resource and regular update on the city’s progress as we navigate the challenges ahead.
Sincerely,

Scott M. Stringer
The Economy
National Indicators
- According to Bureau of Economic Analysis numbers released Thursday, personal income increased 34.2 percent at an annual rate in the second quarter of 2020 (Chart 1), as relief payments provided through the CARES act (such as the $600 weekly supplement to unemployment insurance) more than offset Covid-19 related declines in wages and self-employment income.
- Personal income increased in every state, and by 21.8 percent in New York — well below the national average, but greater than the increases in Connecticut, Tennessee, Virginia, the District of Columbia and New Hampshire.
- Relief payments will fall in the third quarter with the expiration of the $600 supplemental unemployment insurance. This, combined with ongoing high unemployment nationwide (8.4% in August), will likely cause personal income to drop in the third quarter, providing a headwind for economic recovery in the fall and, absent new action by Congress, on into the winter.
Chart 1
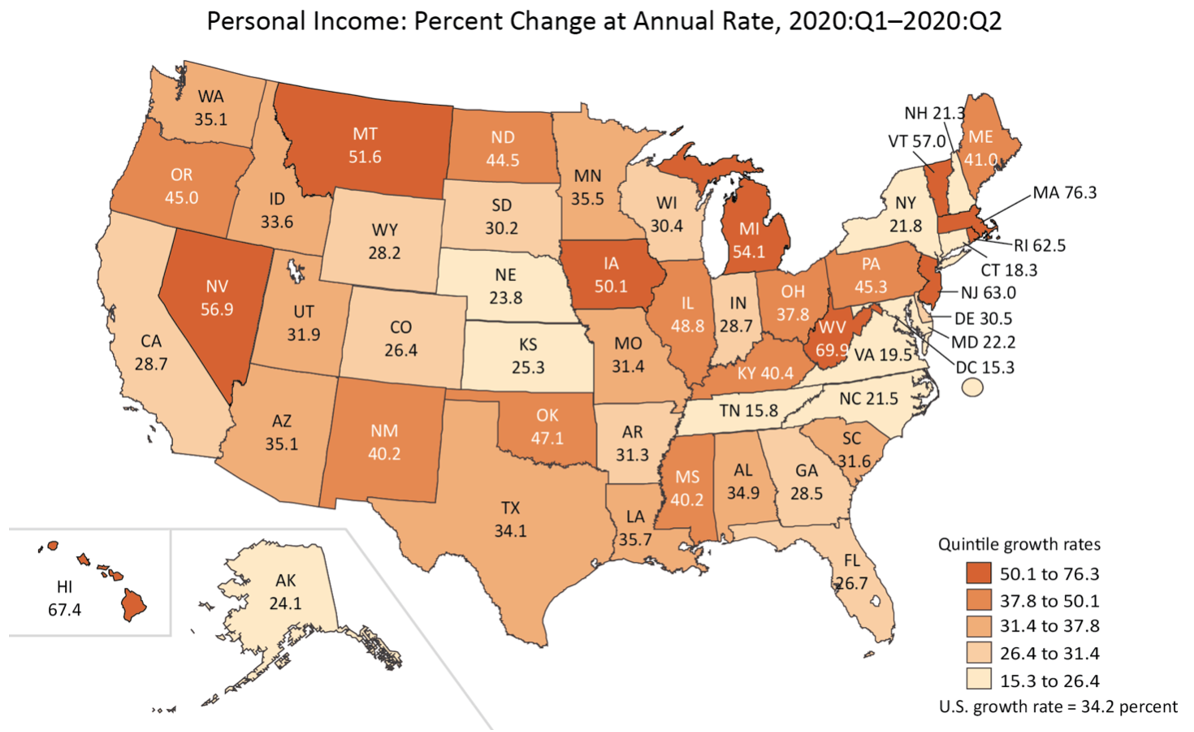
Source: Bureau of Economic Analysis, full report available here.
- Initial U.S. unemployment claims rose to 870,000 for the week of September 19th, little changed from 866,000 the week prior (Chart 2). Initial claims have remained at about the same level for four weeks straight, and have stabilized at a level roughly 400 percent of pre-pandemic weekly claims, raising worries about the pace of economic recovery.
- Continuing claims fell to 12,580,000 for the week of September 12th, down from 12,747,000 the week prior, a decline of 167,000.
Chart 2
SOURCE: U.S. DOL
- Continuing claims for Pandemic Unemployment Assistance (PUA) fell to 11,510,888 from 14,467,064 the week prior (Chart 3), a decline of almost 3 million. PUA, enacted as part of the CARES Act, covers workers who are typically not eligible for state unemployment benefits, including the self-employed or those unable to work due to COVID-19.
- Regular and PUA continuing claims together covered 23,951,749 unemployed Americans as of the week ending September 5th (Chart 3).
Chart 3
SOURCE: U.S. DOL
New York City
- Initial unemployment claims by New York City residents rose to 41,463 for the week of September 19th, up from 36,465 the week prior (Chart 4), up 46 percent from a post-pandemic low of 28,447 the week of August 8th.
Chart 4
SOURCE: NY DOL
Real Estate Transactions
- Real estate transactions continue to be significantly below prior years (Chart 5). Year over year, residential real estate transactions declined by 40 percent in July and 57 percent in August. Commercial real estate transactions declined by 28 percent in July and 43 percent in August, compared to last year.
Chart 5
Source: NYC Comptroller’s Office tabulation of data from the New York City Department of Finance
MTA Ridership
- The subway system hit another milestone on Friday, September 18th, surpassing 1.7 million riders for the first time since March. From Monday, September 21st to Wednesday, September 23rd, daily ridership averaged 1.69 million, a slight increase over the prior week (Chart 6).
- As of Wednesday, September 23rd, subway ridership was down 68% compared to last year, and MTA bus ridership was down 50%.
Chart 6
SOURCE: Metropolitan Transportation Authority, Day-by-Day Ridership Numbers.
NOTE: Excludes holidays. Figures for the week ending September 25 includes data through Wednesday, September 23.
- Traffic on MTA bridges and tunnels recovered earlier and faster than public transit. As of September 23rd, crossings were just 10% below last year (Chart 7).
- For the seven days ending on September 23rd, MTA bridges and tunnels had an average of 811,784 crossings per day, similar to levels reached in mid-August.
Chart 7
SOURCE: Metropolitan Transportation Authority, Day-by-Day Ridership Numbers.
City Finances
Sales Tax Revenue
- New York City sales tax revenue declined by 7.1 percent in August compared to the previous year (Chart 8).
- The ongoing reopening of the City’s economy has caused the rate of decline to moderate from previous months. However, the negative drag from certain sectors, particularly those related to hospitality, remains.
- These declines have been partially offset by growth in online and stay-at-home sales.
Chart 8
SOURCE: Office of the New York State Comptroller. Local monthly sales tax revenue are estimates subject to adjustments
COVID-19 Spending
- The authorized modified FY 2020 budget for COVID-related spending is $4.01 billion (Table 1). One third of the budget, $1.34 billion, is for medical, surgical and laboratory supplies. The modified budget also anticipates that $351 million of employee health insurance expenditures will be eligible for Federal COVID reimbursement.
- The City is in the process of finalizing the fiscal year-end close for FY 2020. As of September 23rd, preliminary data shows that $2.61 billion has been committed – that is, the City has incurred obligations for that amount. Medical, surgical and lab supplies, Department of Education, and food/forage expenses account for $1.15 billion, or 41 percent of the commitments. Of the total commitments, $2.49 billion has been expended.
Table 1: COVID-19 Budget and Expenditures, FY 2020
| Budgeted | Committed | Expended | |
| Medical, Surgical and Lab Supplies | $1.343 B | $586 M | $570 M |
| NYC Health+Hospitals | 246 M | 71 M | 269 M |
| Dept. of Emergency Management | 377 M | 202 M | 191 M |
| Uniformed Agencies Overtime | 145 M | 94 M | 94 M |
| Dept. of Design and Construction | 223 M | 56 M | 25 M |
| Dept. of Small Business Services | 168 M | 136 M | 134 M |
| Dept. of Education | 119 M | 242 M | 177 M |
| Dept. of Homeless Services | 140 M | 140 M | 56 M |
| Health Insurance | 351 M | 0 | 0 |
| Food/Forage | 310 M | 329 M | 327 M |
| Other | 587 M | 750 M | 649 M |
| Total | $4.009 B | $2.606 B | $2.492 B |
SOURCE: Office of the Comptroller from FMS.
NOTE: Expenditures in Dept. of Emergency Management, Dept. of Education and Dept. of Homeless Services are net of expenditures for food and forage, shown separately.
COVID-19 Contracts
- Through September 23rd, the City has registered $3.92 billion in contracts to procure goods and services in response to the COVID pandemic (Table 2). Sixty percent of the contracts, $2.36 billion, are for hotel and food related contracts and the procurement of personal protective equipment (PPE). Other significant contracts include $505 million for medical staffing for COVID-19, $132 million for ventilators and $100 million for testing centers, as shown in Table 2.
Table 2: Registered COVID-19 Contracts through 9-23-2020
| Maximum Contract Amount | |
| Personal Protective Equipment | $787 M |
| Ventilators | 132 M |
| Medical Staffing for COVID-19 | 505 M |
| Hotels | 651 M |
| Food Related Contracts | 922 M |
| IT Related Contracts | 95 M |
| Temporary Staff Contracts | 24 M |
| Testing Centers | 100 M |
| Other Medical, Surgical and Lab Supplies | 217 M |
| Other | 482 M |
| Total | $3.915 B |
SOURCE: Office of the Comptroller analysis of NYC FMS data.
NOTE: Includes only contracts with COVID budget codes.
Cash Position
- The City’s central treasury balance (funds available for expenditure) stood at $6.33 billion as of Wednesday, September 23. At the same time last year, the City had $4.83 billion (Chart 9).
- The Comptroller’s Office’s review of the City’s cash position during the first quarter and projections for cash balances through September 30th, 2020, are available here.
Chart 9
SOURCE: Office of the NYC Comptroller
Spotlight of the Week
COVID Hits the Mayor’s Management Report
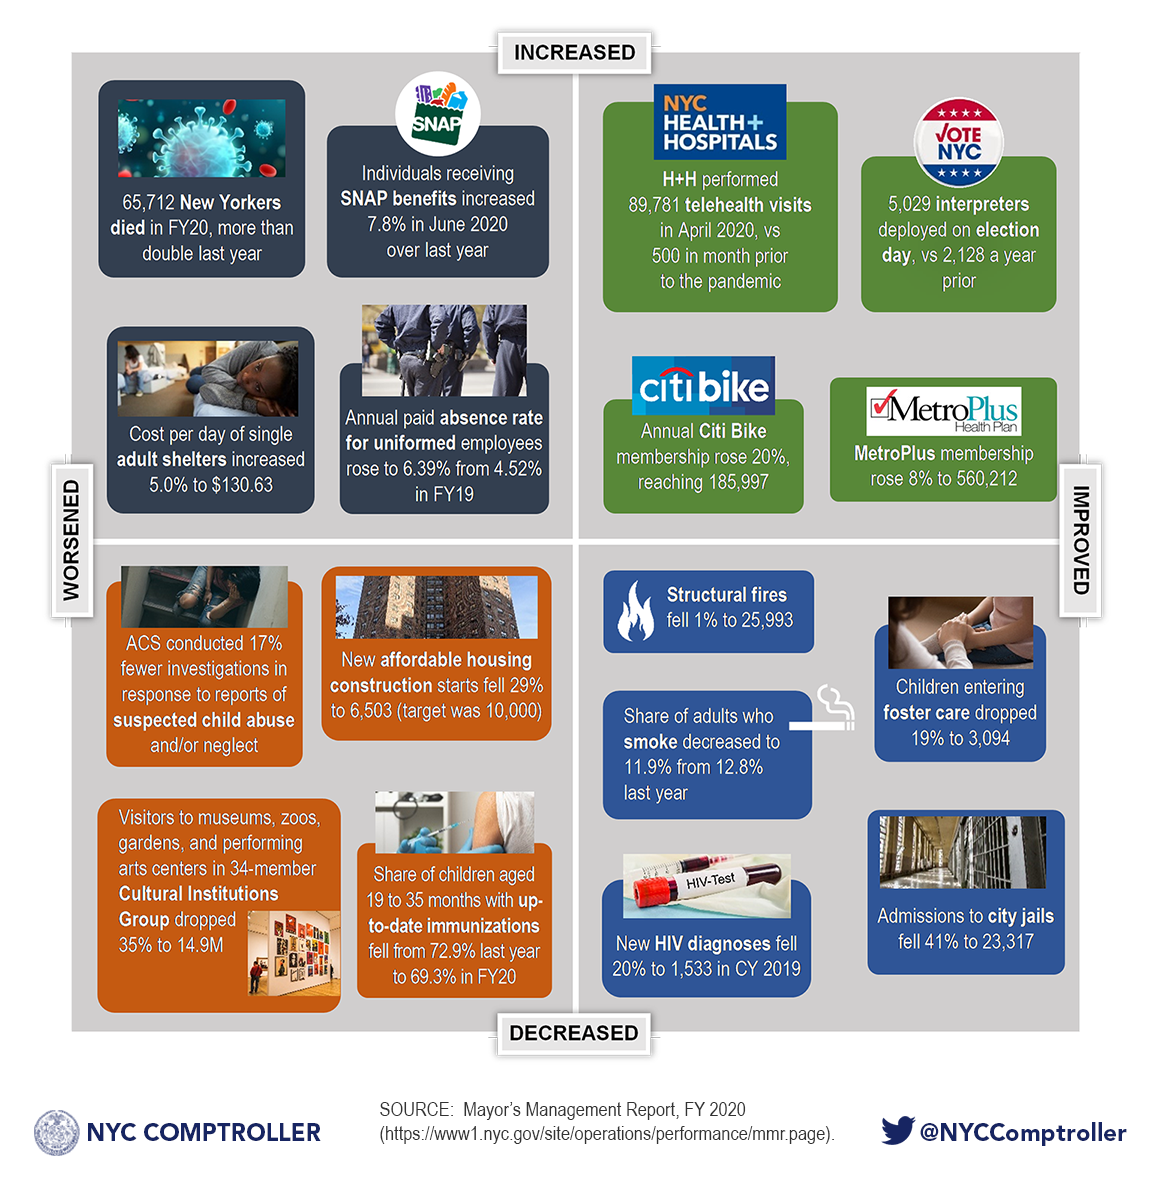
Twice a year, New York City releases a wide range of metrics on city government’s performance and provision of services in the Mayor’s Management Report (MMR). Although COVID-19 hit the city in only the final four months of fiscal year (FY) 2020, its impact is evident in numerous annual metrics. The matrix below provides a snapshot of the many ways, both good and bad, that life in New York City changed in FY 2020.
Chart S.1 Mayor’s Management Report – Selected Statistics
Change from Fiscal Year 2019 to Fiscal Year 2020 (unless otherwise noted)