New York by the Numbers
Weekly Economic and Fiscal Outlook
By NYC Comptroller Scott M. Stringer
Preston Niblack, Deputy Comptroller
Andrew McWilliam, Director of Economic Research
No. 19 – October 5, 2020
Photo Credit: Janet Julie Vanatko / Shutterstock.comA Message from the Comptroller

Dear New Yorkers,
Data released this week confirms the enormous decline in U.S. gross domestic product in the second quarter of the year (April through June). New York State had one of the largest declines, at 36.3%. While the economy began to recover in the third quarter, the slowing rate of decline in the unemployment rate indicates how much further we have to go – and how urgently further federal stimulus is needed to ensure the economy doesn’t hit stall speed.
In-person voting for the Presidential election begins October 24th in New York, and continues through November 1st at 88 designated early polling sites. These sites offer a safe and reliable option to ensure that your vote counts this year. In this week’s Spotlight section, we provide an interactive map of early voting poll site, while highlighting that not all areas of the City are equally well served.
New Yorkers are coming together and working harder than ever to build our city back, and their resilience, creativity and determination are nothing short of inspiring. It is my hope that this weekly newsletter serves as a helpful resource and regular update on the city’s progress as we navigate the challenges ahead.
Sincerely,

Scott M. Stringer
The Economy
National Indicators
- The U.S. unemployment rate fell to 7.9% in September, down from 8.2% in August, as non-farm employment increased by 661,000, according to BLS figures released Friday.
- U.S. personal income fell 2.7% in August, according to Bureau of Economic Analysis (BEA) figures released Thursday. The decline reflects the July 31st expiration of the Federal Pandemic Unemployment Compensation program which provided a temporary weekly supplemental unemployment payment of $600. This national decline has almost certainly gone hand in hand with a decline in New York City and New York State personal income, but state level estimates of 3rd quarter personal income are not available until December.
- U.S. GDP fell at an annualized rate of 31.4% from the 1st to 2nd quarter of 2020, according to BEA figures released Friday (Chart 1). GDP fell despite a large increase in personal income, as economic uncertainty drove Americans to cut back consumption and increase savings by over $3 trillion.
- New York State GDP declined by 36.3% in the 2nd quarter, a greater decline than most states, but less than tourism dependent Hawaii (42.2%) and Nevada (42.2%) and the Northern states of Vermont (38.2%), New Hampshire (36.9%), and Michigan (37.6%). Utah, the youngest state in the nation, fared best with a decline of 22.4%.
Chart 1
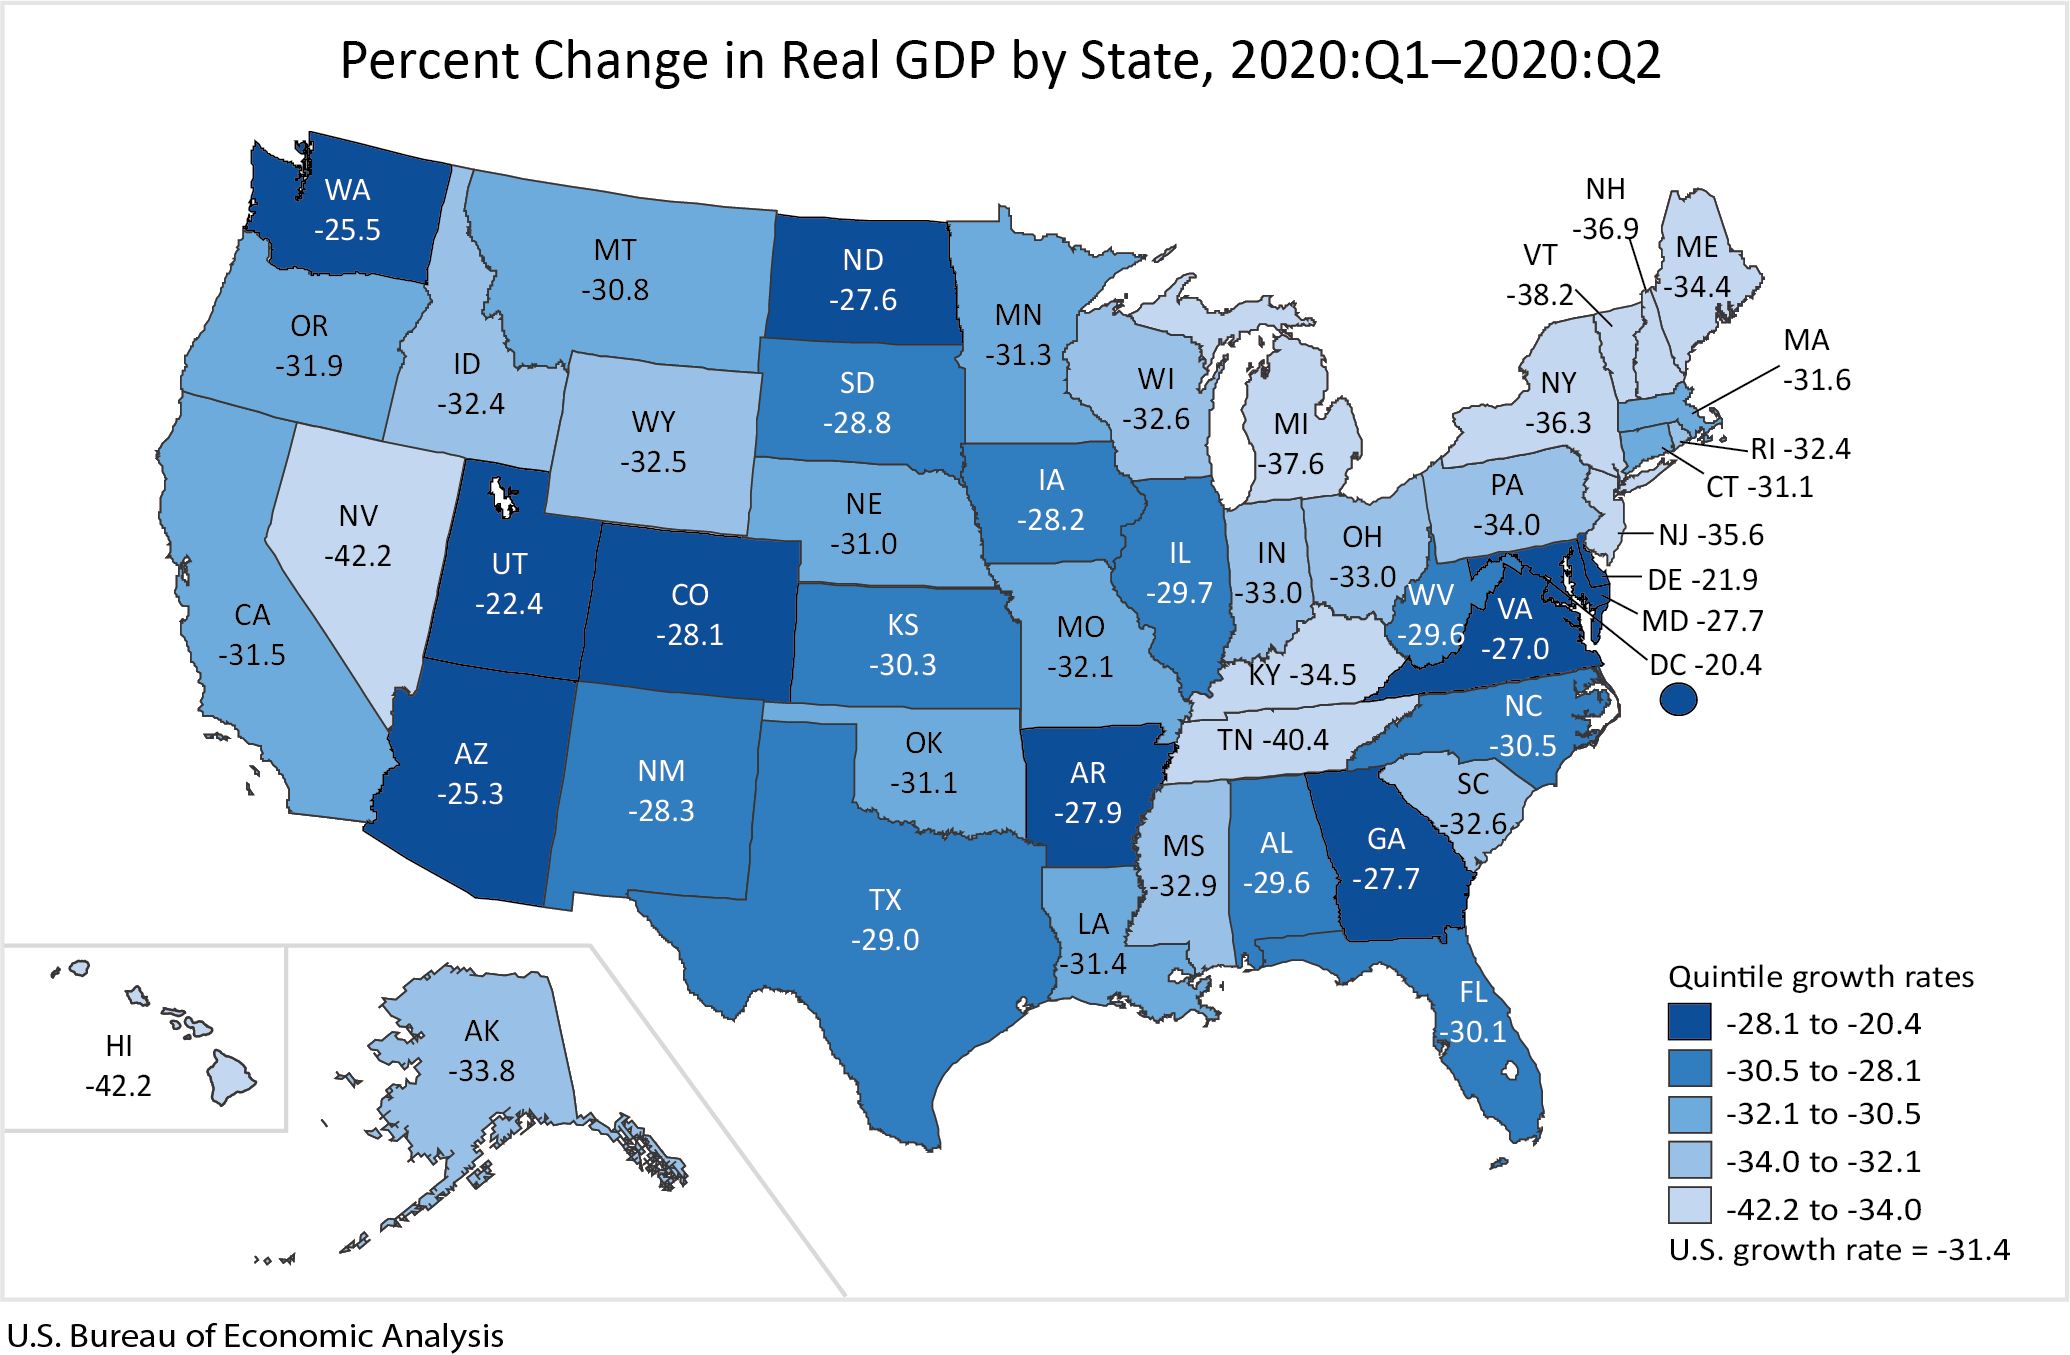
Source: Bureau of Economic Analysis, full report available here.
- Initial U.S. unemployment claims fell to 837,000 for the week of September 26th, down from 873,000 the week prior (Chart 2). Initial claims remain persistently high, although there is concern that this does not clearly reflect new job losses, but to some extent lags in processing old claims, improperly classified claims, and other irregularities.
- Continuing claims fell by almost 1 million, to 11,767,00 for the week of September 19th, down from 12,747,000 the week prior.
Chart 2
SOURCE: U.S. DOL
- Continuing claims for Pandemic Unemployment Assistance (PUA) rose to 11,828,338 from 11,510,888 the week prior (Chart 3), an increase of over 300,000. PUA, enacted as part of the CARES Act, covers workers who are typically not eligible for state unemployment benefits, including the self-employed or those unable to work due to COVID-19.
- Regular and PUA continuing claims together covered 24,259,233 unemployed Americans as of the week ending September 12th (Chart 3).
Chart 3
SOURCE: U.S. DOL
New York City
- Initial unemployment claims by New York City residents fell to 39,040 for the week of September 26th, down from 41,463 the week prior (Chart 4), but remain 37 percent higher than the post-pandemic low of 28,447 the week of August 8th. As with the national data, there is concern persistently high initial claims do not necessarily reflect new job losses, but to some extent administrative issues.
Chart 4
SOURCE: NY DOL
Public Assistance
- Rising unemployment and falling earnings have driven up enrollment for social assistance. As of August 2020, 3.69 million New York City residents were enrolled in Medicaid. Enrollment has grown by 9.2%, and expanded by more than 311,000 enrollees, since February (Chart 5).
- The number of city residents receiving Supplemental Nutrition Assistance Program (SNAP) benefits reached 1.66 million in July, representing growth of 12.4% since February. August figures are not yet available.
Chart 5
SOURCE: New York State Department of Health, NYS Medicaid Enrollment Databook; and New York State Office of Temporary and Disability Assistance, Monthly Caseload Statistics.
NOTE: In late September, New York State revised SNAP data for May 2020 and June 2020 to correct the inadvertent inclusion of Pandemic EBT benefits in the counts.
MTA Ridership
- Between Monday, September 28th and Wednesday, September 30th, subway ridership averaged 1.64 million, a decline from the prior week’s average of 1.71 million (Chart 6). Ridership may have been impacted by the observance of Yom Kippur on September 28th.
- As of September 30th, subway ridership was 68% below last year and MTA bus ridership was 50% below.
Chart 6
SOURCE: Metropolitan Transportation Authority, Day-by-Day Ridership Numbers.
NOTE: Excludes holidays. Figures for the week ending October 2 include data through Wednesday, September 30.
City Finances
COVID-19 Spending
The authorized modified FY 2020 budget for COVID-related spending is $4.01 billion (Table 1). As of September 30th, preliminary data for FY 2020 shows the City accrued $2.62 billion of COVID related expenditures for the fiscal year.
FY 2020 expenditures are $1.39 billion below the June modification estimates due to the rolling of some of the planned COVID related spending into FY 2021. Although the FY 2021 Budget assumed only $118 million of COVID related spending, FY 2021 commitments for COVID related spending through September 2020 were $1.93 billion.
Table 1: COVID-19 Budget and Expenditures, FY 2020
| Budgeted | Committed | Expended | |
| Medical, Surgical and Lab Supplies | $1.343 B | $586 M | $570 M |
| NYC Health+Hospitals | 246 M | 71 M | 269 M |
| Dept. of Emergency Management | 377 M | 202 M | 191 M |
| Uniformed Agencies Overtime | 145 M | 108 M | 108 M |
| Dept. of Design and Construction | 223 M | 56 M | 25 M |
| Dept. of Small Business Services | 168 M | 136 M | 134 M |
| Dept. of Education | 119 M | 242 M | 177 M |
| Dept. of Homeless Services | 140 M | 140 M | 56 M |
| Health Insurance | 351 M | 0 | 0 |
| Food/Forage | 310 M | 329 M | 327 M |
| Other | 587 M | 750 M | 648 M |
| Total | $4.009 B | $2.620 B | $2.505 B |
SOURCE: Office of the Comptroller from FMS.
NOTE: Expenditures in Dept. of Emergency Management, Dept. of Education and Dept. of Homeless Services are net of expenditures for food and forage, shown separately.
COVID-19 Contracts
- Through September 30th, the City has registered $4.01 billion in contracts to procure goods and services in response to the COVID pandemic (Table 2). Almost sixty percent of the contracts, $2.39 billion, are for hotel and food related contracts and the procurement of personal protective equipment (PPE). Other significant contracts include $505 million for medical staffing for COVID-19, $141 million for ventilators and $100 million for testing centers, as shown in Table 2.
Table 2: Registered COVID-19 Contracts through 9-30-2020
| Maximum Contract Amount | |
| Personal Protective Equipment | $795 M |
| Ventilators | 141 M |
| Medical Staffing for COVID-19 | 505 M |
| Hotels | 651 M |
| Food Related Contracts | 939 M |
| IT Related Contracts | 94 M |
| Temporary Staff Contracts | 24 M |
| Testing Centers | 100 M |
| Other Medical, Surgical and Lab Supplies | 249 M |
| Other | 516 M |
| Total | $4.014 B |
SOURCE: Office of the Comptroller analysis of NYC FMS data.
NOTE: Includes only contracts with COVID budget codes.
Cash Position
- The City’s central treasury balance (funds available for expenditure) stood at $7.28 billion as of Wednesday, September 30. At the same time last year, the City had $5.03 billion (Chart 7).
- The Comptroller’s Office’s review of the City’s cash position during the first quarter and projections for cash balances through September 30th, 2020, are available here.
Chart 7
SOURCE: Office of the NYC Comptroller
Spotlight of the Week
Early Voting in NYC
Beginning on October 24, New Yorkers will have the opportunity to vote early in a Presidential Election for the first time. In a typical year, early voting expands voter participation by offering more flexibility to cast a vote. But this year, amid COVID-19 concerns, disruptions to mail service, and early problems with absentee ballots, these sites offer a safe and reliable option to ensure that your vote counts.
To date, the City Board of Elections (BOE) has designated 88 early voting sites that will be open for nine days, concluding on November 1. Sites include schools, colleges, community centers, churches, museums, performing arts centers, a casino, and a courthouse. Votes cast during the early voting period will be included in the tally reported on Election Day.
While more sites may be added prior to the start of early voting, as of September 30, the BOE had designated 27 sites in Brooklyn, 18 in Queens, 17 in the Bronx, 16 in Manhattan, and 10 in Staten Island. As shown in the map below, sites are spread across the city; however, some neighborhoods at the city’s periphery appear to be underserved.
Map of New York City Early Voting Sites
SOURCE: New York City Board of Elections.
Staten Island has the highest number of sites per active registered voter, while Queens has the lowest. However, based on the number of sites per square mile of land, Manhattan has the most and Queens and Staten Island have the least (Chart S.2).
Chart S.2
SOURCE: City Comptroller analysis of early voting sites and active registered voters as of November 1, 2019, based on data from the New York City Board of Elections.
Find your early voting site: https://findmypollsite.vote.nyc/.
View info on early voting days and operating hours: https://vote.nyc/page/early-voting-information.
Request an absentee ballot by October 27: https://vote.nyc/page/absentee-voting.