New York by the Numbers
Weekly Economic and Fiscal Outlook
By NYC Comptroller Scott M. Stringer
Preston Niblack, Deputy Comptroller
Andrew McWilliam, Director of Economic Research
No. 29 – December 21, 2020
Photo Credit: tetiana.photographerA Message from the Comptroller

Dear New Yorkers,
2020 began with news reports of a virus of unknown origin. In a few short months, COVID-19 would upend the lives of New Yorkers with a breadth and intensity that few could have predicted. As documented week by week by these newsletters, more than nine months since the shutdown of all non-essential businesses in New York City, the devastating impacts of the pandemic remain.
It has been a long and difficult road, but we end 2020 with two approved vaccines, thousands of newly vaccinated New Yorkers, and Congressional enactment of a federal aid package. In less than 30 days, a new Administration will take office in Washington, bringing with it a new outlook and energy that promises hope for struggling states and cities.
Our struggles haven’t deterred us. New Yorkers are coming together and working harder than ever, and their resilience, creativity and determination will be what brings our city back. I hope this weekly newsletter serves as a helpful resource and regular update on the city’s progress as we navigate the challenges ahead.
Stay vigilant, and mask up!
Sincerely,

Scott M. Stringer
Editor’s Note: New York by the Numbers will be taking a holiday break – we’ll be back on Monday January 11th. Happy Holidays, good riddance to 2020, and here’s to a better New Year!
The Economy
National Indicators
- Congress reached tentative agreement on a federal aid package renewing Pandemic Unemployment Assistance, Pandemic Unemployment Employment Compensation, bringing back a smaller $300 weekly supplemental unemployment insurance payments, and providing one-time $600 stimulus payments to many Americans.
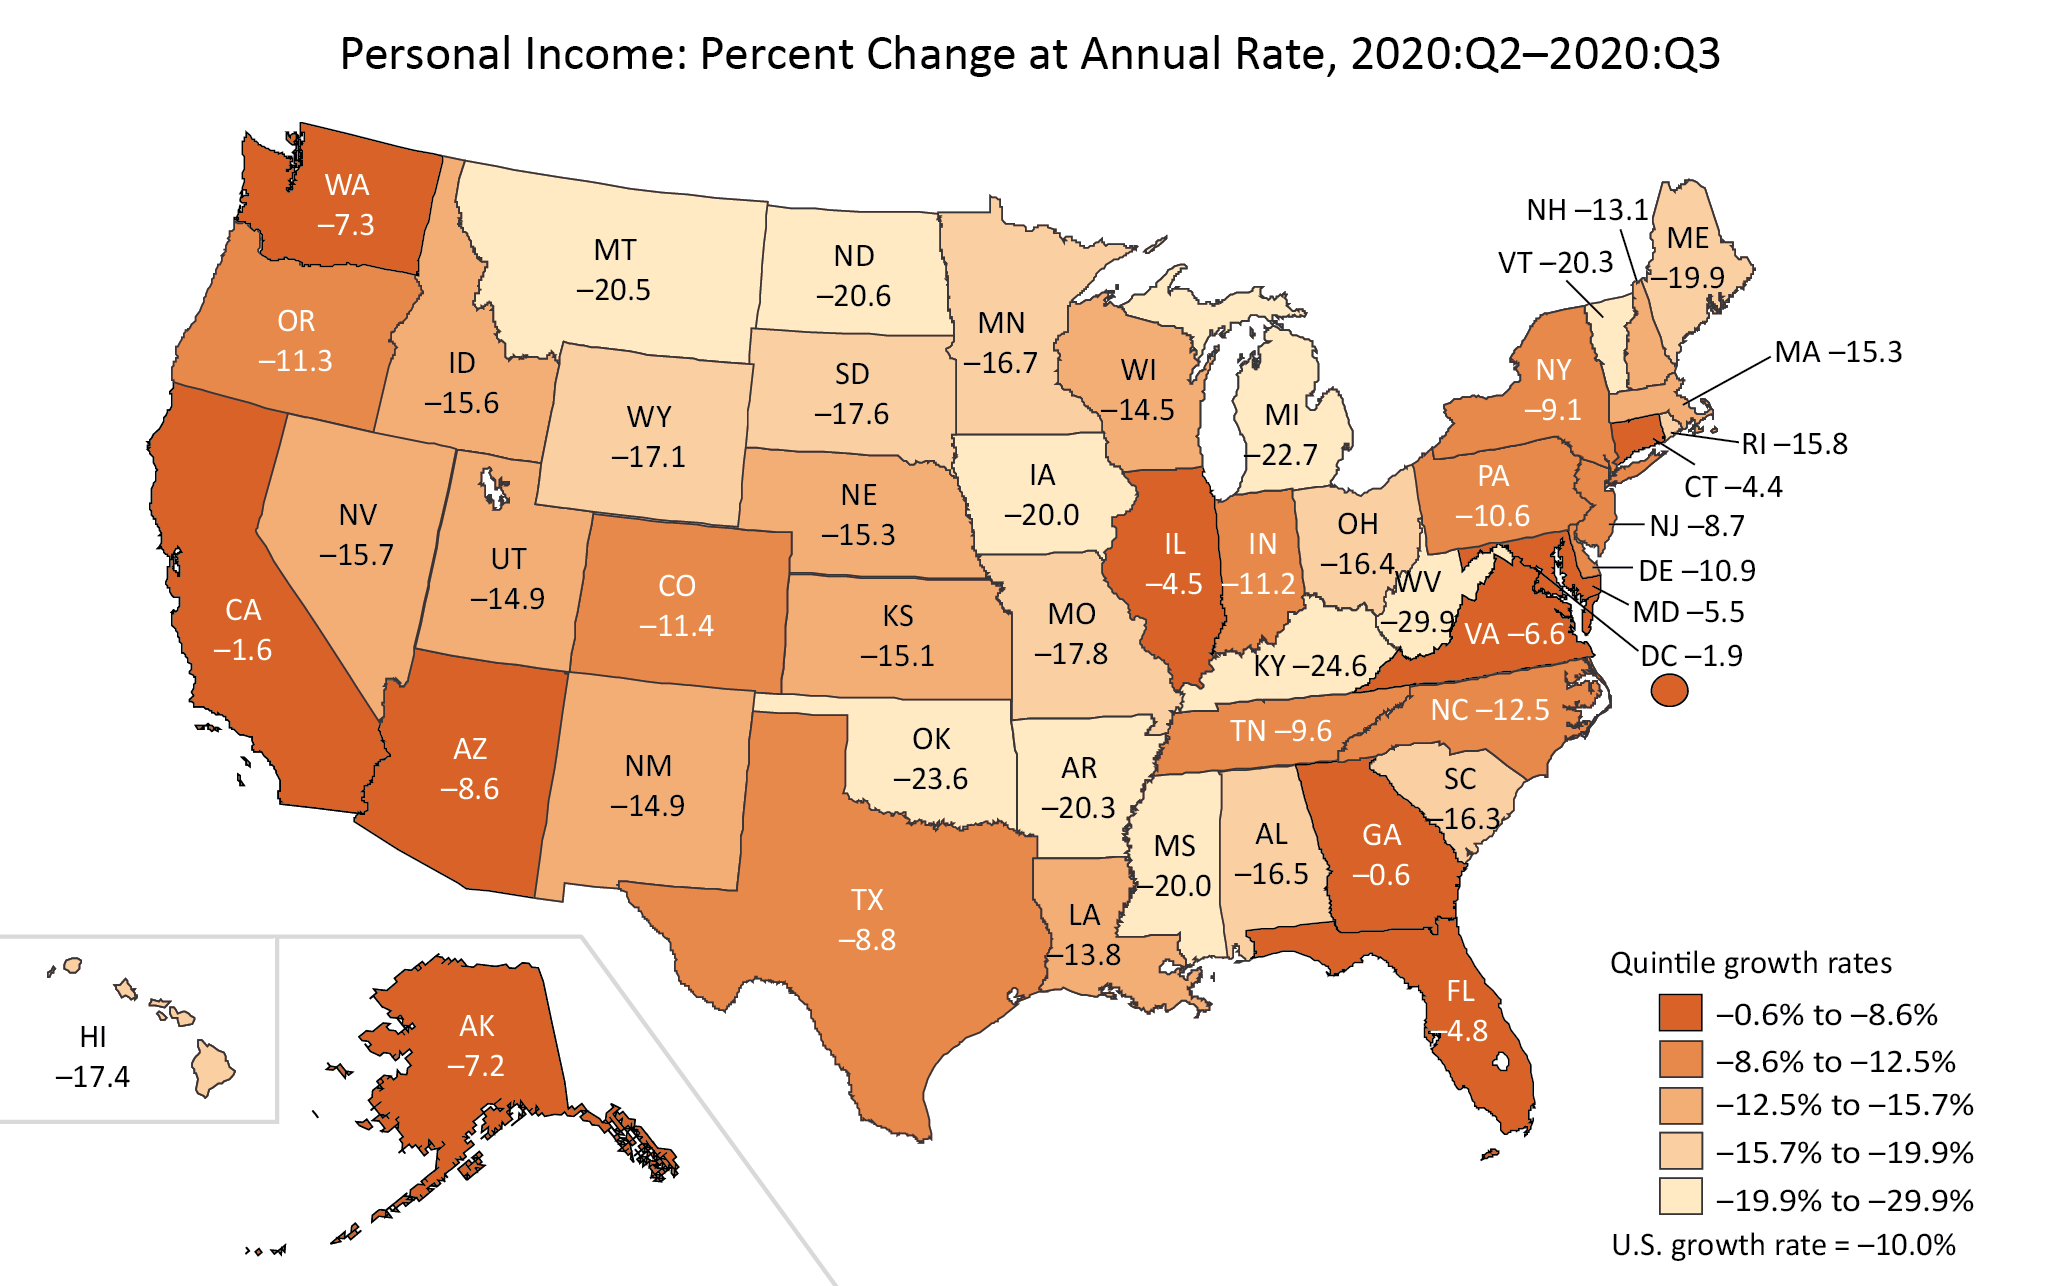
- BEA figures released last Thursday show U.S. personal income fell at an annualized rate of 10% from the second to third quarter of 2020, after increasing at an annualized rate of 35.8% in the previous quarter. The decline was driven by the end of both the $1,200 federal stimulus payments and $600 weekly supplemental unemployment insurance payments in the third quarter. Increased earnings from recovering employment were insufficient to offset the loss of these federal stimulus payments.
- New York personal income declined by 9.1%, less than the nation overall.
- Incomes fell most across a broad swath of the central U.S. that was spared from the worst of earlier waves of the pandemic.
Chart 1
SOURCE: BEA
- Initial U.S. unemployment claims rose again to a seasonally adjusted 885,000 for the week ending December 12th (Chart 2), up from a revised 862,000 the week prior, and the second weekly increase in a row.
Chart 2
SOURCE: U.S. Dept. of Labor
- Continuing U.S. unemployment insurance claims fell to a seasonally adjusted 5,508,000 for the week of December 5th, down from a revised 5,781,000 the week before (Chart 3).
- Recipients of Pandemic Emergency Unemployment Compensation (PEUC) rose to 4,801,408 for the week of November 28th, from 4,532,876 the week prior. PEUC, enacted as part of the CARES Act, provides 13 weeks of extended benefits to unemployed workers whose 26 weeks of regular unemployment benefits have run out. Congress has tentatively reached agreement to extend the program that was set to expire this week, extending benefits for 4.8 million Americans.
- Continuing claims for Pandemic Unemployment Assistance (PUA) rose to 9,244,556 from 8,555,763 the week prior. PUA, also enacted as part of the CARES Act, covers workers who are typically not eligible for state unemployment benefits, including the self-employed, and those with poorly documented income, who are unable to work due to COVID-19. PUA benefits were also set to expire this week, but Congress has tentatively agreed to extend benefits 9.2 million recipients.
- Regular, PUA and PEUC continuing claims together covered 19,851,022 unemployed Americans as of the week ending November 28th (Chart 3).
Chart 3
SOURCE: U.S. Dept. of Labor
New York City
- Initial unemployment claims by New York City residents rose to 26,762 for the week of December 12th, up from 24,173 the week prior, the second increase in a row (Chart 4).
Chart 4
SOURCE: N.Y. Dept. of Labor
- New York City’s employment recovery slowed into November, with the seasonally adjusted unemployment rate falling to 12.1%, from 13.0% in October (Chart 5).
- New York City private employment showed little change after increasing for six months in a row. In November, New York City added fewer than 1,000 private-sector jobs on a seasonally adjusted basis, down from 25,000 added in October.
Chart 5
SOURCE: N.Y. Dept. of Labor
- With the March onset of the pandemic, New York City residents increased their time spent at home by 28% from pre-pandemic levels. This fell to an increase of just 10% in September, but has since begun rising again. With colder weather and rising COVID infections, New York City residents were spending 14% more time at home as of December 11th (Chart 6).
- As of December 11th, compared to pre-pandemic life, time spent at retail shops and recreation areas was down by 36%, grocery stores and pharmacies down by 13%, transit stations down by 46%, and workplaces by 37%.
Chart 6
SOURCE: GPS mobility data indexed to 1/3/2020 to 2/6/2020, from Google COVID-19 Community Mobility Reports.
Public Assistance
- Medicaid enrollment in New York City rose to 3.8 million in November. Since February, enrollment has grown by more than 426,000, an increase of 12.6% (Chart 7).
- Queens has experienced the highest growth (14.8%), followed by Staten Island (13.9%), the Bronx (12.1%), and Brooklyn and Manhattan (both at 11.4%).
Chart 7
SOURCE: New York State Department of Health, Medicaid Enrollment Databook.
MTA Subway and Bus Ridership
- Over Monday, December 14th through Wednesday, December 16th, an average of 1.65 million people rode the subway and roughly 900,000 used MTA buses (Chart 8). Ridership has increased following a dip around Thanksgiving but remains below levels seen in mid-November.
- On Wednesday, December 16th, subway ridership was 74% below last year while bus ridership was down 66%.
Chart 8
SOURCE: Metropolitan Transportation Authority, Day-by-Day Ridership Numbers.
NOTE: Excludes federal holidays. Figures for the week ending December 18 include data through Wednesday, December 16.
City Finances
COVID-19 Spending
- The City’s November 2020 Financial Plan includes $2.75 billion of COVID related spending, an increase of $2.63 billion from the June Plan estimate (Table 1).
- Part of the increase is from a roll-in of FY 2020 expenditures which were $1.39 billion less than budgeted.
- Through December 16th, the City has committed to $2.64 billion of COVID related spending in FY 2021.
- In total, the City has incurred or committed to $5.26 billion of COVID related spending in FY 2020 and FY 2021.
Table 1: COVID-19 Expenditures, FY 2020 and FY 2021
| FY 2020 | FY 2021 | Total | |
| Medical, Surgical and Lab Supplies | $586 M | $518 M | $1.104 B |
| NYC Health+Hospitals | 71 M | 630 M | 701 M |
| Dept. of Emergency Management | 202 M | 217 M | 419 M |
| Uniformed Agencies Overtime | 108 M | 0 | 108 M |
| Dept. of Design and Construction | 56 M | 43 M | 99 M |
| Dept. of Small Business Services | 136 M | 33 M | 169 M |
| Dept. of Education | 242 M | 181 M | 423 M |
| Dept. of Homeless Services | 140 M | 303 M | 443 M |
| Food/Forage | 329 M | 362 M | 691 M |
| Other | 750 M | 349 M | 1.099 B |
| Total | $2.620 B | $2.636 B | $5.256 B |
SOURCE: Office of the Comptroller from FMS.
COVID-19 Contracts
- Through December 16th, the City has registered $4.48 billion in contracts to procure goods and services in response to the COVID pandemic (Table 2).
- About 60% of the contracts, $2.68 billion, are for hotel and food related contracts and the procurement of personal protective equipment (PPE).
- Other significant contracts include $505 million for medical staffing for COVID-19, $149 million for ventilators and $100 million for testing centers.
Table 2: Registered COVID-19 Contracts through 12-16-2020
| Maximum Contract Amount | |
| Personal Protective Equipment | $733 M |
| Ventilators | 149 M |
| Medical Staffing for COVID-19 | 505 M |
| Hotels | 893 M |
| Food Related Contracts | 1.053 B |
| IT Related Contracts | 100 M |
| Temporary Staff Contracts | 24 M |
| Testing Centers | 100 M |
| Other Medical, Surgical and Lab Supplies | 325 M |
| Other | 594 M |
| Total | $4.476 B |
SOURCE: Office of the Comptroller analysis of NYC FMS data.
NOTE: Includes only contracts with COVID budget codes.
Cash Position
- The City’s central treasury balance (funds available for expenditure) stood at $3.78 billion as of Wednesday, December 16th. At the same time last year, the City had $2.32 billion (Chart 9).
- Taking advantage of a provision in the federal CARES Act, the City has deferred payment of payroll taxes since April, which has led to a net improvement in the City’s cash balances of approximately $1.35 billion. Deferrals will end by December 2020 and deferred payments will be due in 2 installments no later than December 2021 and December 2022. Deferred payments are accrued to the fiscal year in which they are due.
- The Comptroller’s Office’s review of the City’s cash position during the first quarter of FY 2021 and projections for cash balances through March 31, 2021, are available here.
Chart 9
SOURCE: Office of the NYC Comptroller
State Developments
- New York State collected $4.3 billion in tax revenue in the month of November, according to the State Comptroller’s cash report. Collections were $53 million above last year, a difference of 1.2%. (Table 3)
- Through the first eight months of state fiscal year 2020-21 (April to November), state tax collections were $2.95 billion below the same period last year. Consumption and use taxes were down by 13.6%, while personal income tax (PIT) revenue was down by 3.2% and business taxes were down by 4.0%. However, tax collections to date were $1.9 billion better than originally projected in the Enacted Budget and $375 million better than projections in the Mid-Year Update.
- The State continues to assume that there will be $8 billion in to-be-determined local aid reductions in the current fiscal year. As of the Mid-Year Update, the State projects an $8.7 billion gap for next fiscal year, exclusive of the TBD local aid cuts.
Table 3. New York State All Funds Tax Collections ($ in millions)
| Nov 2019 | Nov 2020 | $ Change |
% Change |
April – Nov 2019 |
April – Nov 2020 |
$ Change |
% Change |
|
| Personal Income Tax | 2,469 | 2,575 | 105 | 4.3% | 33,029 | 31,965 | -1,064 | -3.2% |
| Consumption/ Use Taxes | 1,412 | 1,328 | -85 | -6.0% | 11,984 | 10,355 | -1,628 | -13.6% |
| Business Taxes | 185 | 182 | -3 | -1.6% | 4,631 | 4,445 | -185 | -4.0% |
| Other Taxes | 189 | 223 | 35 | 18.3% | 1,455 | 1,381 | -74 | -5.1% |
| Total State Taxes | $4,255 | $4,308 | $53 | 1.2% | $51,099 | $48,148 | -$2,951 | -5.8% |
SOURCE: New York State Office of the Comptroller.
Spotlight of the Week
The Numbers that Defined 2020
As documented week by week by these newsletters, the COVID-19 pandemic quickly upended the lives of New Yorkers, and more than nine months since COVID-19 hit the city, many of its devastating impacts remain. As 2020 comes to an end, here are some of the many numbers that defined this unusual year:
2: Two COVID-19 Vaccines, by Pfizer and Moderna, have been approved by the FDA as of December 21st. Vaccines form Oxford/AstraZenca, Johnson & Johnson, and Novovax are in phase three clinical trials and could be approved early in 2021.
11,152: As of this week 11,152 New York City health care workers have been vaccinated against COVID-19.
24,561: As of December 15, more than 24,500 people in New York City had died from COVID-19 complications. To date, more than 64,500 New Yorkers have been hospitalized and more than 330,000 have tested positive, although the actual number of cases is likely far higher and still rising.
3.5%: Despite the reopening of businesses in the summer, third quarter 2020 real U.S. Gross Domestic Product (GDP) was down 3.5% from the fourth quarter of 2019. After falling at an annualized rate of 31.4% in the second quarter of 2020, as states and cities imposed social and business restrictions to combat the pandemic, real U.S. GDP rose at an annualized rate of 33.1% in the third quarter.
879,182: New York City lost 879,182 private-sector jobs between February and April. Job losses were concentrated in lower-wage service industries, such as hotels, restaurants, bars, hair salons, and retail stores. Since April, the city has recovered 308,003 jobs, leaving citywide employment 14% below pre-pandemic levels.
64.9%: City employment in arts, entertainment and recreation fell by 64.9% from February to November, as Broadway theaters remain closed until at least June 2021.
20.3%: The city’s unemployment rate rose from a record low of 3.4% in February to a record high of 20.3% in June. As of November, the unemployment rate stood at 12.1% — still higher than the highest previously-recorded figure of 11.6%, dating back to 1992.
2.2 Million: From March 14 through December 12, New York City residents filed nearly 2.2 million initial claims for unemployment insurance, more than nine times claims in the same period last year.
Chart S.1
SOURCE: New York State Department of Labor.
222,107: Between March and September, enrollment in Supplemental Nutrition Assistance Program (SNAP) benefits rose by 222,107, reaching 1.7 million New Yorkers. On a percentage basis, growth was highest in Queens (20%), while Brooklyn and the Bronx added the highest number of new recipients.
34%: As of November, 34% of employed New Yorkers worked from home due to COVID, compared to 27% of employed New York State residents and 22% nationwide. The city share was down from 50% in May.
71%: As of the week ending December 11, weekday ridership on the New York City subway averaged 71% below the same period last year. Average weekday inbound crossings on MTA bridges and tunnels were down 17%.
$5.3 Billion: New York City has committed to or incurred spending of nearly $5.3 billion related to the pandemic, including $1.1 billion on medical, surgical and lab supplies and $691 million on food assistance.
$2.2 Billion: From March through October, total New York City tax collections were $2.2 billion below the same period in 2019. Hotel tax revenue was cut by 66%, while real property transaction taxes were down 41% and sales tax revenues were down 24%.
64%: As of November 30, small business revenue was down 64% in Manhattan. Losses were smaller yet substantial in the other boroughs: 35% in Queens, 34% in the Bronx, 33% in Brooklyn, and 23% in Staten Island.