New York by the Numbers
Weekly Economic and Fiscal Outlook
By NYC Comptroller Scott M. Stringer
Preston Niblack, Deputy Comptroller
Andrew McWilliam, Director of Economic Research
No. 30 – January 11th, 2021
Photo Credit: Travelling JackA Message from the Comptroller

Dear New Yorkers,
As we entered 2021, we hoped for a reprieve from the hardships, strife, and chaos we experienced in 2020. When our nation’s capital was violated last Wednesday with the goal of undermining our democracy, many of us experienced a range of emotions – from shock and sadness to shame.
We have hard work ahead of us – as a people and as a country. Despite the challenges ahead of us, there are ample reasons for optimism and hope. As vaccines against the COVID-19 virus roll out across the country, our nation can aspire again not just to a return to the more normal rhythms of daily life, but also to a better, wiser, and stronger future.
New Yorkers are coming together and working harder than ever, and their resilience, creativity and determination will be what brings our city back.
Stay vigilant, and mask up!
Sincerely,

Scott M. Stringer
The Economy
National Indicators
- According to BLS figures released Friday, U.S. nonfarm payrolls declined by 140,000 in December, as rising COVID infections swept the country. It is the first employment decline since the initial wave of the pandemic in April.
- Despite this decline, the U.S. unemployment rate held steady at 6.7%. (December figures for New York City will be available January 21st.)
- According to data released by the Bureau of Economic Analysis in December, U.S. G.D.P. grew at an annualized rate of 33.4% from the second to third quarter, led by a 75% expansion in healthcare and social assistance industries, an 80% increase in durable goods manufacturing, and a 345% expansion in accommodation and food services, as Americans resumed traveling and eating out despite the pandemic.
- New York G.D.P grew at an annualized rate of 30.3%, slower than 40 other states, but faster than many Plains and Rocky Mountain states hit hard by COVID later in the year (Chart 1).
Chart 1
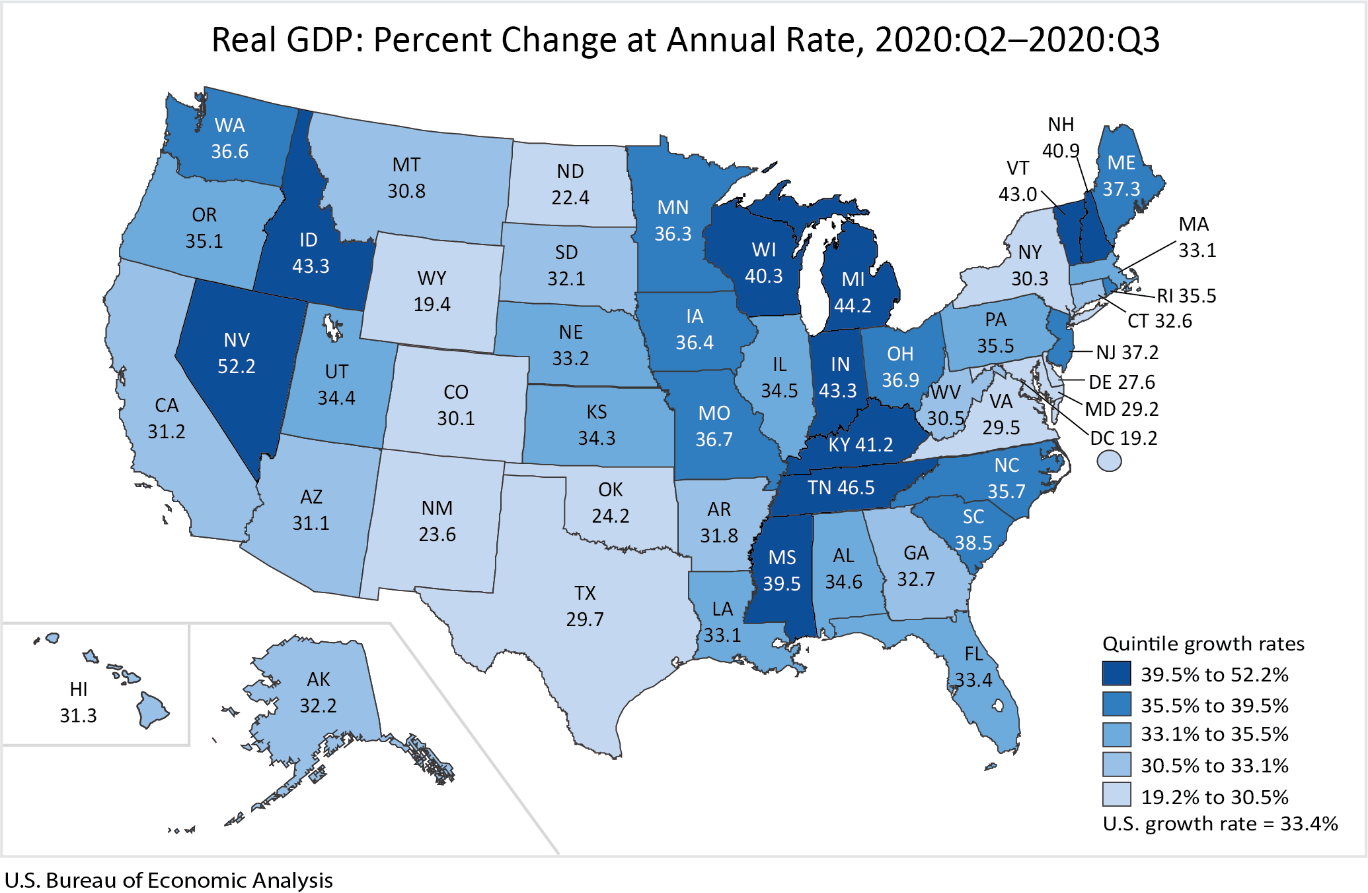
SOURCE: BEA
- Initial U.S. unemployment claims remained flat at a seasonally adjusted 787,000 for the week ending January 2nd (Chart 2), showing little change from last week’s 790,000, and little changed from the fall. Weekly initial claims are still running about 400% of pre-pandemic levels.
Chart 2
SOURCE: U.S. Dept. of Labor
- Continuing unemployment insurance claims, including PEUC and PUA, together covered 18,137,302 unemployed Americans as of the week ending December 19th, down from 18,693,781 the week prior (Chart 3).
- Continuing regular unemployment insurance claims rose to 5,382,459, not seasonally adjusted, for the week of December 26th, up from 5,237,015 the week before.
- Recipients of Pandemic Emergency Unemployment Compensation (PEUC) fell to 4,516,900 for the week of December 19th, from 4,810,334 the week prior. PEUC, enacted as part of the CARES Act, provides extended benefits to unemployed workers whose 26 weeks of regular unemployment benefits have run out. PEUC was set to expire December 26th, but Congress passed an extension of benefits through April 4th, 2021.
- Continuing claims for Pandemic Unemployment Assistance (PUA) fell to 8,383,387 from 8,453,940 the week prior. PUA, also enacted as part of the CARES Act, covers workers who are typically not eligible for state unemployment benefits, including the self-employed and those with poorly documented income, or who are unable to work due to COVID-19. PUA benefits were also set to expire at the end of the year, but were included in the extension of benefits enacted at the end of 2020.
Chart 3
SOURCE: U.S. Dept. of Labor
New York City
- Initial unemployment claims by New York City residents were 21,505 for the week of January 2nd, showing little change from last week’s 21,617 (Chart 4). Weekly claims have been running at about the same level since November.
Chart 4
SOURCE: N.Y.. Dept. of Labor
Vaccines
- New York City administered 17,501 COVID vaccine doses on Friday and 6,509 on Saturday, bringing the 7-day average to 13,300 daily (Chart 5). At the current pace it would take 2 years and 8 months to get 80% of New York City residents vaccinated.
Chart 5
SOURCE:NYC Health
- Despite the slow progress, New York City has vaccinated more people and administered more doses per capita than many other urban areas in the U.S. (Chart 6). New York City had vaccinated about 2% of its population as of January 7th.
Chart 6
SOURCE: Current data at the time of publication from state, county and city health departments.
NOTE: Some areas have not divulged or updated their vaccine administration statistics and are therefore could not be included this chart.
Mobility
- Google mobility data shows New Yorkers increased their time spent at home with colder weather and rising COVID rates in December (Chart 7). Time spent at transit stations and workplaces declined back to levels last seen in May.
Chart 7
SOURCE: GPS mobility data indexed to 1/3/2020 to 2/6/2020, from Google COVID-19 Community Mobility Reports.
Public Assistance
- After a steep rise in the spring and summer, the number of public assistance recipients in New York City began to fall in October and November (Chart 8).
- Nonetheless, 380,146 New Yorkers received cash assistance in November, an increase of 16.2% since February, while 1.63 million residents benefited from food assistance through the Supplemental Nutrition Assistance Program (SNAP), compared to 1.48 million before the pandemic.
Chart 8
SOURCE: New York City Department of Human Resources, HRA Monthly Fact Sheets.
MTA Subway and Bus Ridership
- In the first week of the new year, weekday ridership on MTA subways averaged 1.59 million and bus ridership averaged roughly 950,000 (Chart 9).
- The December federal relief bill included $4 billion in assistance for the MTA, providing a temporary fiscal reprieve for the agency in 2021. However, ridership levels across the system have shown no signs of improvement since the fall and uncertainly remains around when and how many riders will ultimately return.
- As of Wednesday, January 6th, subway ridership was down 70% compared to last year, and bus ridership was down 57%.
Chart 9
SOURCE: Metropolitan Transportation Authority, Day-by-Day Ridership Numbers.
NOTE: Excludes federal holidays. Figures for the week ending January 8 include data through Wednesday, January 6.
Bicycle Ridership
- As the cold weather arrived, New Yorkers have continued to use their bicycles at far higher levels than last year.
- During November, 499,192 bikers rode across East River bridges, compared to 323,039 in November 2019, an increase of 55% (Chart 10).
- On a percentage basis, increases were highest on the Pulaski Bridge and the Ed Koch Queensboro Bridge, which respectively saw November bike ridership growth of 73% and 72% over the prior year.
Chart 10
SOURCE: New York City Department of Transportation, Bicycle Counts.
NOTE: Includes the Ed Koch Queensboro Bridge, the Manhattan Bridge, the Brooklyn Bridge and the Williamsburg Bridge.
City Finances
- December income tax withheld from New York City paychecks was 4.7% higher than the previous year, a positive indicator for the bonus season getting underway. The November-December two-month average however, which better adjusts for variability in payroll patterns, was only 0.8% higher than the previous year.
- For the fiscal year which began in July, withholding is $236 million lower than last year, a decline of 5.1%.
- Overall personal income tax (PIT) collections, which includes paycheck withholding and estimated payments made by those with income from other sources, are $320 million below last year. This is, however, $669 million higher than initially budgeted in June and $146 million higher than the City’s recently revised November estimate.
- With January and February typically being the largest months for bonus payouts, it is still too early to draw definitive conclusions on the bonus season but Wall Street’s strong performance in 2020 provides further hope.
Table 1: Income Tax Withholding and Total Income Tax Revenue, $Millions
| 2020 | 2019 | $ change | % change | |||||
|---|---|---|---|---|---|---|---|---|
| Withholding | Total PIT | Withholding | Total PIT | Withholding | Total PIT | Withholding | Total PIT | |
| December | $993.8 | $1,097.2 | $949.5 | $1,008.6 | $44.3 | $88.6 | 4.7% | 8.8% |
| November- December | $1,666.5 | $1,801.4 | $1,652.9 | $1,725.1 | $13.6 | $76.3 | 0.8% | 4.4% |
| Fiscal Year to Date | $4,406.8 | $5,415.5 | $4,643.2 | $5,736.0 | -$236.3 | -$320.5 | -5.1% | -5.6% |
SOURCE: NYC Comptroller based on preliminary data from the NY State Department of Taxation and Finance
COVID-19 Spending
- The City’s November 2020 Financial Plan includes $2.75 billion in COVID-related spending in FY 2021, an increase of $2.63 billion from the June Plan estimate (Table 2).
- Part of the increase is from a roll-in of FY 2020 expenditures which were $1.39 billion less than budgeted.
- Through January 6th, the City has committed to $2.85 billion in COVID related spending in FY 2021, $102 million more than budgeted in November. Of this, $2.23 billion has been expensed.
- In total, the City has incurred or committed to $5.47 billion in COVID related spending in FY 2020 and FY 2021.
Table 2: FY 2021 COVID-19 Expenditures
| Budget | Committed | Expensed | |
| Medical, Surgical and Lab Supplies | $788 M | $533 M | $374 M |
| NYC Health+Hospitals | 267 M | 750 M | 750 M |
| Dept. of Emergency Management | 258 M | 226 M | 133 M |
| Uniformed Agencies Overtime | 24 M | 0 | 0 |
| Dept. of Design and Construction | 85 M | 32 M | 8 M |
| Dept. of Small Business Services | 81 M | 33 M | 31 M |
| Dept. of Education | 27 M | 184 M | 131 M |
| Dept. of Homeless Services | 176 M | 310 M | 203 M |
| Food/Forage | 521 M | 377 M | 365 M |
| Other | 523 M | 405 M | 232 M |
| Total | $2.750 B | $2.852 B | $2.228 B |
SOURCE: Office of the Comptroller from FMS.
COVID-19 Contracts
- Through January 6th, the City has registered $4.66 billion in contracts to procure goods and services in response to the COVID pandemic (Table 3).
- About 60% of the contracts, $2.81 billion, are for hotel and food related contracts and the procurement of personal protective equipment (PPE).
- Other significant contracts include $505 million for medical staffing for COVID-19, $149 million for ventilators and $100 million for testing centers.
Table 3: Registered COVID-19 Contracts through 1-6-2021
| Maximum Contract Amount | |
| Personal Protective Equipment | $733 M |
| Ventilators | 149 M |
| Medical Staffing for COVID-19 | 505 M |
| Hotels | 893 M |
| Food Related Contracts | 1.179 B |
| IT Related Contracts | 133 M |
| Temporary Staff Contracts | 24 M |
| Testing Centers | 100 M |
| Other Medical, Surgical and Lab Supplies | 326 M |
| Other | 621 M |
| Total | $4.663 B |
SOURCE: Office of the Comptroller analysis of NYC FMS data.
NOTE: Includes only contracts with COVID budget codes.
Cash Position
- The City’s central treasury balance (funds available for expenditure) stood at $10.95 billion as of Wednesday, January 6th. At the same time last year, the City had $9.29 billion (Chart 11).
- Taking advantage of a provision in the federal CARES Act, the City has deferred payment of payroll taxes since April, which has led to a net improvement in the City’s cash balances of approximately $1.35 billion. Deferrals ended in December 2020 and deferred payments will be due in 2 installments no later than December 2021 and December 2022. Deferred payments are accrued to the fiscal year in which they are due.
- The Comptroller’s Office’s review of the City’s cash position during the first quarter of FY 2021 and projections for cash balances through March 31, 2021, are available here.
Chart 11
SOURCE: Office of the NYC Comptroller
Spotlight of the Week
The Earned Income Tax Credit in NYC During the Pandemic
The $900 billion relief bill that Congress passed just before the end of 2020 included an important tax provision that allows individuals to use either their 2019 or 2020 earned income to determine eligibility for claiming the Earned Income Tax Credit (EITC). This provision helps to ensure that the many low income individuals who were disproportionately impacted by the pandemic will be able to continue to receive income support from the EITC. Absent this change, those who became unemployed in 2020 would have lost all or part of this benefit, because only earned income, such as wages, counts towards EITC eligibility (unemployment benefits do not count towards EITC eligibility).
The EITC offers refundable tax credits, essentially checks, to low-income families from the federal government. Many states and some localities also choose to piggy back off of the federal credit and provide their own benefit. New York State provides eligible recipients with a credit equal to 30% of the federal credit, and New York City provides an additional 5%.
The credit varies by income levels and family size, with a maximum federal credit of $6,728 for a family with three or more children. Household income cannot exceed $57,414. The combined maximum federal, New York State and New York City credit that a family can receive currently is $8,852, a significant amount of supplemental income for low-income families.
Below are the latest statistics showing the total combined federal, State and City EITC credits that City households received in 2018. Almost 925,000 New York City filers received credits totaling $2.8 billion ($2.18 billion in federal credits and an additional $624 million from the State and City). On average, eligible New York City recipients received over $3,000 in supplemental income from the EITC. The provision included in the relief bill to use either 2019 or 2020 earned will allow many of these households to continue to receive this important benefit during the pandemic.
Table S.1: Federal, NY State & NYC Earned Income Tax Credit in 2018, by Borough
| Federal EITC | NYS & NYC EITC | ||||
|---|---|---|---|---|---|
| Borough | Number* | Amount ($000s) | Average | Amount ($000s) | Average |
| Bronx | 219,150 | $586,496 | $2,676 | $155,253 | $708 |
| Brooklyn | 298,130 | 728,082 | 2,442 | 215,328 | 722 |
| Manhattan | 111,790 | 227,676 | 2,037 | 67,953 | 608 |
| Queens | 260,720 | 553,682 | 2,124 | 162,779 | 624 |
| Staten Island | 34,830 | 81,800 | 2,349 | 22,583 | 648 |
| TOTAL NYC | 924,620 | $2,177,736 | $2,355 | $623,896 | $675 |