New York by the Numbers
Weekly Economic and Fiscal Outlook
By NYC Comptroller Scott M. Stringer
Preston Niblack, Deputy Comptroller
Andrew McWilliam, Director of Economic Research
No. 31 – January 19th, 2021
Photo Credit: Christopher Penler/ShutterstockA Message from the Comptroller

Dear New Yorkers,
Yesterday we celebrated the life of Martin Luther King Jr. Tomorrow we celebrate the inauguration of a new President, and the prospect of new federal aid, stimulus checks, and an accelerated vaccine rollout. With a slowing economy, and vaccines that can’t get here soon enough, we need the help, and we need it now!
New Yorkers are coming together and working harder than ever, and their resilience, creativity and determination will be what brings our city back.
Stay vigilant, and mask up!
Sincerely,

Scott M. Stringer
The Economy
National Indicators
- While local vaccination efforts have been hampered by logistical problems across the country, CDC figures show the Federal government made 31,161,075 COVID-19 vaccine doses available for distribution to states as of January 15th; 12,279,180 first doses have been administered.
- The federal government allocated nearly 4.3 million COVID-19 vaccine doses for U.S. distribution last week, and nationwide vaccine allocations have been running at just over 4 million weekly (Chart 1). Federal allocations of COVID vaccines will have to accelerate to make timely vaccination available to all Americans.
Chart 1
SOURCE: Centers for Disease Control and Prevention
- Initial U.S. unemployment claims jumped to a seasonally adjusted 965,000 for the week ending January 9th, an increase of 181,000 from last week.
Chart 2
SOURCE: U.S. Dept. of Labor
- Continuing unemployment insurance claims, including PEUC and PUA, together covered 16,991,199 unemployed Americans as of the week ending December 26th, down from 18,111,896 the week prior (Chart 3).
- Unadjusted continuing regular unemployment insurance claims surged to 5,856,230 for the week of January 2, an increase of 474,180 from the prior week’s 5,382,050.
- Recipients of Pandemic Emergency Unemployment Compensation (PEUC) fell to 4,166,261 for the week of December 26th, from a 4,491413 the week prior. PEUC, enacted as part of the CARES Act, provides extended benefits to unemployed workers whose 26 weeks of regular unemployment benefits have run out.
- Continuing claims for Pandemic Unemployment Assistance (PUA) fell to 7,442,888 from 8,383,387 the week prior. PUA, also enacted as part of the CARES Act, covers workers who are typically not eligible for state unemployment benefits, including the self-employed and those with poorly documented income, or who are unable to work due to COVID-19.
Chart 3
SOURCE: U.S. Dept. of Labor
New York City
- Initial unemployment claims by New York City residents surged to 31,926 for the week of January 9th, an increase of almost 50% from the previous week’s 21,505 and the most initial claims since the week of October 17th (Chart 4).
Chart 4
SOURCE: N.Y. Dept. of Labor
Vaccines
- Daily COVID vaccines doses administered by New York City doubled over the past week to a 7-day average of over 30,000 as of Sunday, up from 15,000 daily a week ago (Chart 5). New York City administered 44,890 vaccines on the Saturday and Sunday before Martin Luther King Jr. Day, a faster pace than the City managed to achieve on weekdays earlier in January.
Chart 5
SOURCE: NYC Health
- New York City has vaccinated more people and administered more doses per capita than many other urban areas in the U.S., even before the relatively successful weekend (Chart 6). New York City had administered over 5 vaccines per 100 residents as of January 18th.
Chart 6
SOURCE: Current data as of 1/18/2021 from state, county and city health departments.
NOTE: Some areas have not divulged or updated their vaccine administration statistics and are therefore could not be included this chart.
MTA Subway and Bus Ridership
- Subway ridership averaged 1.61 million from Monday, January 11th through Wednesday, January 13th, roughly in line with weekday ridership in the prior week (Chart 7).
- While ridership has fluctuated around the winter holidays, average weekday subway and bus ridership has yet to return to pre-Thanksgiving levels.
- Compared to last year, ridership was down by 70% on the subway and 60% on MTA buses, as of January 13th.
Chart 7
SOURCE: Metropolitan Transportation Authority, Day-by-Day Ridership Numbers.
NOTE: Excludes federal holidays. Figures for the week ending January 15 include data through Wednesday, January 13.
City Finances
- Many New York City property owners can expect smaller property tax bills starting in June. The tentative property tax roll released by the Department of Finance on Friday shows the City expects property tax revenues to fall by $2.6 billion in the upcoming fiscal year due to declines in property values, as measured by the City’s byzantine assessment process (Chart 8).
- Co-op, condos and rental buildings declined by approximately 9.0%, while values of 1- to 3-family homes showed little change on average (single-family homes rose 2.9%, but three-family homes fell 2.0%). Although 1- to 3-family homes account for the highest overall market value in the City, at almost $700 billion, rules on assessments contribute to their having a smaller weight in the amount of overall assessments and taxes paid. (The assessment weights are represented by the sizes of the respective circles for each property type in Chart 8.)
- Commercial properties values fell by almost 15%, with many sectors hardest hit by the pandemic falling even more. The value of New York City hotels fell by 23.8% from the prior year, and retail stores fell by 21.0%.
Chart 8
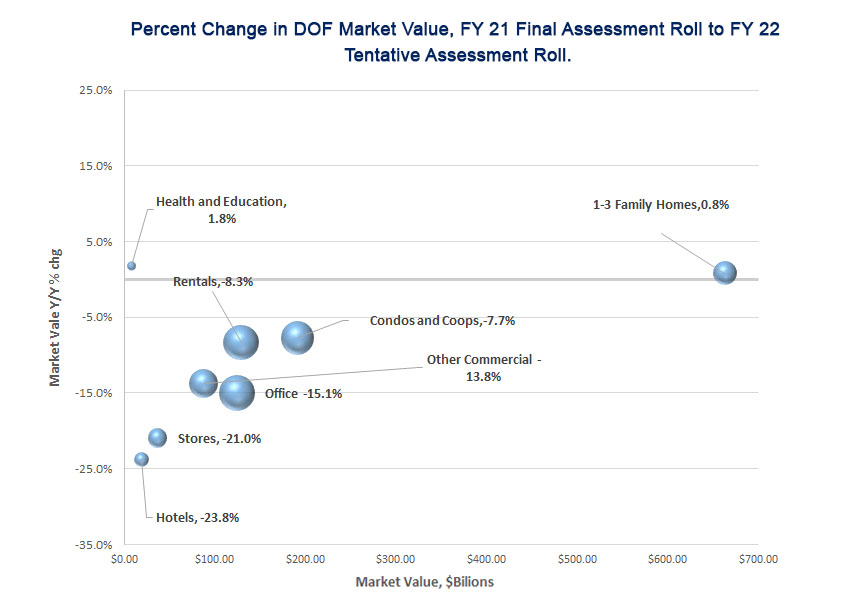
SOURCE: NYC Department of Finance: Bubble sizes reflect aggregate assessed values. An earlier version of this graph plotted assessed values on the horizontal axis instead of market values.
COVID-19 Spending
- The City’s January 2021 Financial Plan, which was released on 1/14/2021, increased COVID related spending by about $840 million to $3.59 billion.
- Increases in NYC Health + Hospitals (H+H) and the Department of Homeless Services (DHS) account for the bulk of the increase — spending for testing and tracing in (H+H) was increased by $545 million, and COVID related spending in DHS was increased by $153 million.
- Through January 14th, the City has committed to $2.89 billion of COVID related spending in FY 2021 (Table 1). Of this $2.26 billion has been expensed.
- In total, the City has incurred or committed to $5.52 billion of COVID related spending in FY 2020 and FY 2021.
Table 1: FY 2021 COVID-19 Expenditures
| Budget | Committed | Expensed | |
| Medical, Surgical and Lab Supplies | $788 B | $532 M | $374 M |
| NYC Health+Hospitals | 813 M | 750 M | 750 M |
| Dept. of Emergency Management | 264 M | 227 M | 134 M |
| Uniformed Agencies Overtime | 24 M | 0 | 0 |
| Dept. of Design and Construction | 89 M | 34 M | 8 M |
| Dept. of Small Business Services | 81 M | 33 M | 31 M |
| Dept. of Education | 78 M | 201 M | 140 M |
| Dept. of Homeless Services | 329 M | 313 M | 208 M |
| Food/Forage | 527 M | 378 M | 365 M |
| Other | 599 M | 426 M | 250 M |
| Total | $3.592 B | $2.894 B | $2.260 |
SOURCE: Office of the Comptroller from FMS.
COVID-19 Contracts
- Through January 14th, the City has registered $4.67 billion in contracts to procure goods and services in response to the COVID pandemic (Table 2).
- About 60% of the contracts, $2.81 billion, are for hotel and food related contracts and the procurement of personal protective equipment (PPE).
- Other significant contracts include $505 million for medical staffing for COVID-19, $149 million for ventilators and $100 million for testing centers.
Table 2: Registered COVID-19 Contracts through 1-14-2021
| Maximum Contract Amount | |
| Personal Protective Equipment | $733 M |
| Ventilators | 149 M |
| Medical Staffing for COVID-19 | 505 M |
| Hotels | 889 M |
| Food Related Contracts | 1.179 B |
| IT Related Contracts | 133 M |
| Temporary Staff Contracts | 24 M |
| Testing Centers | 100 M |
| Other Medical, Surgical and Lab Supplies | 326 M |
| Other | 632 M |
| Total | $4.670 B |
SOURCE: Office of the Comptroller analysis of NYC FMS data.
NOTE: Includes only contracts with COVID budget codes.
Cash Position
- The City’s central treasury balance (funds available for expenditure) stood at $11.62 billion as of Wednesday, January 13th. At the same time last year, the City had $10.47 billion (Chart 9).
- Taking advantage of a provision in the federal CARES Act, the City has deferred payment of payroll taxes since April, which has led to a net improvement in the City’s cash balances of approximately $1.35 billion. Deferrals ended in December 2020 and deferred payments will be due in 2 installments no later than December 2021 and December 2022. Deferred payments are accrued to the fiscal year in which they are due.
- The Comptroller’s Office’s review of the City’s cash position during the first quarter of FY 2021 and projections for cash balances through March 31, 2021, are available here.
Chart 9
SOURCE: Office of the NYC Comptroller
Spotlight of the Week
Post-pandemic New York City has retained its position as a center for venture capital financing. Venture capital is an major source of funding for start-ups and other companies that face challenges getting financial backing through traditional means and New York City – with many well-established industries and deep pools of talent – has long attracted a large share of the nation’s venture capital activity.
Companies based in the New York City metropolitan area raised some $768 million more in the final three quarters of 2020 compared to the same period in 2019 (Chart S.1). Silicon Valley companies, on the other hand, saw a reduction of more than $225 million during the pandemic period while venture backing for Boston based companies soared by over $4.4 billion compared to 2019 levels.
Chart S.1
Source: PwC / CB Insights MoneyTree™ Report – Q4 2020
In the final three quarters of 2020, a total of 687 venture capital deals were made in the New York metro area, compared to 734 in 2019. New York based startups in the food & beverage, healthcare, computer & hardware services and financial sectors all recorded higher levels of venture capital backing during the pandemic period. Among the top five metropolitan areas for venture capital activity in the United States, deal volume rose only in the Boston area, and New York’s 6.4% decline was smaller than the 8.5% drop in Silicon Valley, the 9.1% drop in Los Angeles, and the 12.7% decline in Seattle.
“Supergiant” venture capital rounds, defined as having a value of $100 million or more, played an important roll in New York’s increased venture capital fundraising. The eighteen supergiant rounds finalized in the fourth quarter of 2020 are the highest ever for the New York metro region (Chart S.2).
Chart S.2
Source: PwC / CB Insights MoneyTree™ Report – Q4 2020
Internet companies captured nearly 58% of venture capital deals made in the New York metro area in the fourth quarter, with 138 companies obtaining venture capital backing. DoubleVerify, a software company for digital media measurement and analytics, secured the largest fourth quarter deal in New York City’s internet sector with a $350 million funding round announced in October. Other large fourth quarter deals include Current, a mobile financial services company, and Roivant Sciences, a biotechnology company focused on new drug development, who raised $131 million and $200 million respectively.