New York by the Numbers
Weekly Economic and Fiscal Outlook
By NYC Comptroller Scott M. Stringer
Preston Niblack, Deputy Comptroller
Andrew McWilliam, Director of Economic Research
No. 33 – February 1st, 2021
Photo Credit: lev radin/Shuttterstock.comA Message from the Comptroller
Dear New Yorkers,

Vaccine supplies are still short, the economic recovery has stalled, and sometimes if feels this winter will last forever, but we are all another week closer to spring.
And while we endure what we must in the current crisis, we can’t forget an even larger crisis on the horizon, one that will be the fight of our lives – climate change. Last week the Mayor, trustees of two of the City’s pension funds and I announced a $4 billion divestment from fossil fuels companies, an important step toward a more sustainable future.
New Yorkers are coming together and working harder than ever, and their resilience, creativity and determination will be what brings our city back.
Stay vigilant, and mask up!
Sincerely,

Scott M. Stringer
The Economy
National Indicators
- Bureau of Labor Statistics figures released January 26th show December employment increased in 15 states, and decreased in 11 states, with 24 states showing little change (Chart 1). Previously released figures showed the U.S. shed a total of 140,000 payroll jobs in December.
- Employment growth was concentrated in Southern and Western states, led by Texas, which added 64,000 jobs from November.
- Job losses were concentrated in California, and Northern and Eastern states, including New York, which lost 37,000 jobs. Michigan lost 64,000 jobs from November, the biggest decline.
Chart 1
SOURCE: Bureau of Labor Statistics
- The Federal government made more than 5.1 million doses of COVID-19 vaccines available for distribution to states for the week of February 1st (Chart 2).
- The 818,000 additional doses planned for allocation this week represent a 19% increase from the prior week. Nonetheless, vaccine allocations will have to accelerate even further to make timely vaccination available to all Americans.
Chart 2
SOURCE: Centers for Disease Control and Prevention
- Initial U.S. unemployment claims fell to a seasonally adjusted 847,000 for the week of January 23rd, down 67,000 from a revised 914,000 the prior week (Chart 3).
Chart 3
SOURCE: U.S. Dept. of Labor
- Continuing unemployment insurance claims, including PEUC and PUA, together covered 16,680,515 unemployed Americans as of the week ending January 9th, up from 14,495,070 the week prior (Chart 4).
- Unadjusted continuing regular unemployment insurance claims fell to 5,208,719 for the week of January 16th, a decrease of 274,055 from the prior week’s 5,482,774.
- Recipients of Pandemic Emergency Unemployment Compensation (PEUC) jumped by over 800,000 to 3,863,548 for the week of January 9th, up from 3,026,952 the week prior. The rebound suggests last week’s dramatic decline was related to end-of-year delays in reauthorizing the program. PEUC, enacted as part of the CARES Act, provides extended benefits to unemployed workers whose 26 weeks of regular unemployment benefits have run out.
- Continuing claims for Pandemic Unemployment Assistance (PUA) showed an even larger rebound, jumping to 7,334,193 from 5,707,397 the week prior, following last week’s dramatic decline. PUA, also enacted as part of the CARES Act, covers workers who are typically not eligible for state unemployment benefits, including the self-employed and those with poorly documented income, or who are unable to work due to COVID-19.
Chart 4
SOURCE: U.S. Dept. of Labor
New York City
- Initial unemployment claims by New York City residents rose slightly to 25,830 for the week of January 23rd, up from 24,644 the week prior (Chart 5). Claims continue to trend upward from mid-December lows.
Chart 5
SOURCE: N.Y. Dept. of Labor
- On a seasonally adjusted basis, New York City employment fell to 3,481,000 in December as the City shed over 19,000 jobs from November, the City’s first employment decline since April. The decline was driven by a loss of almost 14,000 jobs in accommodation and food services as the City shut down indoor dining, and cold weather put a damper on eating outside.
- Despite the overall decline, New York City added jobs in some high-wage sectors that have been less impacted by the pandemic, such as finance and insurance, real estate, and information.
- New York City private employment remains 605,000 below pre-pandemic levels, but 269,000 above the pandemic low in April.
Table 1: Post-Pandemic New York City Employment Changes (Seasonally Adjusted, 1,000s)
| December Employment Changes | December
Employment |
|||
|---|---|---|---|---|
| from Feb. ’20 peak |
from April ’20 lows |
from November ’20 |
||
| Total Private Employment | -605 | 269 | -19.4 | 3,481 |
| Finance and Insurance | -16 | -10 | 0.7 | 329 |
| Real Estate | -11 | 5 | 0.8 | 125 |
| Information | -2 | 11 | 3.6 | 210 |
| Professional, Scientific, and Technical Services | -35 | -7 | -0.8 | 403 |
| Management of Companies and Enterprises | -7 | 0 | -0.2 | 70 |
| Administrative Services | -58 | 19 | 1.1 | 234 |
| Employment Services | -21 | 9 | 0.8 | 109 |
| Educational Services | -36 | -5 | -4.2 | 211 |
| Health Care and Social Assistance | -44 | 58 | 1.2 | 783 |
| Arts, Entertainment, and Recreation | -60 | -4 | -1.5 | 30 |
| Accommodation and Food Services | -170 | 69 | -13.7 | 199 |
| Other Services | -39 | 21 | -2.1 | 161 |
| Retail Trade | -43 | 45 | -2.2 | 299 |
| Wholesale Trade | -20 | 2 | 0.2 | 119 |
| Transportation and Warehousing | -26 | 7 | -1.1 | 106 |
| Utilities | -1 | 0 | -0.2 | 15 |
| Construction | -24 | 51 | -1.9 | 135 |
| Manufacturing | -13 | 6 | 0.8 | 54 |
SOURCE: N.Y. Dept. of Labor, seasonally adjusted by NYC OMB
Vaccines
- Daily COVID vaccines doses administered in New York City plunged from a seven-day average high of 28,345 on January 20th, to under 15,000 per day late last week as available supplies dwindled (Chart 6).
- The seven-day average number of second doses continues to rise steadily, reaching more than 7,000 daily on January 27th.
Chart 6
SOURCE: NYC Health
- As of Thursday, January 28th New York City had administered 8.9 COVID vaccines per 100 residents, more doses per capita than most other urban areas that publish timely data (Chart 7). However, many of the doses have been administered to New York City healthcare workers residing outside the City.
Chart 7
SOURCE: Current data as of 1/29/2021 from state, county and city health departments.
NOTE: Some areas have not divulged or updated their vaccine administration statistics and are therefore could not be included this chart.
- The New York City Comptroller’s Office estimates over 4 million New York City residents received a total of $6.8 billion in Economic Impact Payments (EIP) or stimulus checks, through the CARES Act passed last March (Table 2). These stimulus payments were intended to support lower-income households disproportionately impacted by the pandemic, and to provide fiscal stimulus to the economy.
- The recently enacted CRRSA provided families with a second round of $600 payments (not reflected in the figures below) which, unlike the original EIPs, would be made available to non-citizen spouses of persons with a U.S. Social Security number.
- The Biden Administration has proposed a third round of payments of $1,400.
Table 2: NYC, NY State, and U.S. EIP Payments made through the CARES Act
| Number of Payments | Total Amount $ 000s | Average Amount | |
| New York State | 9,848,010 | $15,723,095 | $1,597 |
| NYC (estimate) | 4,164,359 | $6,811,000 | $1,635 |
| All States | 161,943,888 | $271,421,554 | $1,676 |
SOURCE: IRS. NYC estimates based on NYC Comptroller’s Analysis of IRS data.
MTA Subway and Bus Ridership
- Average daily ridership on the subway during weekdays has held steady around 1.6 million over the last four weeks, while average weekday ridership on MTA buses remained below 1 million (Chart 8).
- Subway ridership was about 70% below last year and bus ridership was 60% below, as of Wednesday, January 27.
Chart 8
SOURCE: Metropolitan Transportation Authority, Day-by-Day Ridership Numbers.
NOTE: Excludes federal holidays. Figures for the week ending January 29 include data through Wednesday, January 27.
Bicycle Ridership
- Bike ridership in the city has fallen as the temperature dropped but continues to surpass ridership levels last year. During the month of December, 303,610 bike riders crossed the four East River bridges, 58% higher than last year. (Chart 9)
- Volume was up 67% on the Ed Koch Queensboro Bridge, 60% on the Manhattan Bridge, 51% on the Williamsburg Bridge, and 45% on the Brooklyn Bridge.
- Similarly, the Pulaski Bridge over Newtown Creek saw bike volume rise by 64% in December, as compared to last year.
Chart 9
SOURCE: New York City Department of Transportation, Bicycle Counts.
NOTE: Includes the Ed Koch Queensboro Bridge, the Manhattan Bridge, the Brooklyn Bridge and the Williamsburg Bridge.
City Finances
- In addition to declining by 27 percent, the overall composition of retail sales has shifted dramatically during the pandemic (Chart 10).
- Recent data released by the NYS Department of Taxation shows March-Nov 2020 taxable sales at restaurants declined by 59% and accommodation declined by 90% from the same period in 2019.
- Online sales increased by 72% and sales of computer systems rose by 3%.
- As a result of these shifts, sales at restaurants, which accounted from almost 13% of overall sales in 2019, declined to just 7.3%. The overall share of online sales more than doubled from 3.1% to 7.3%.
Chart 10
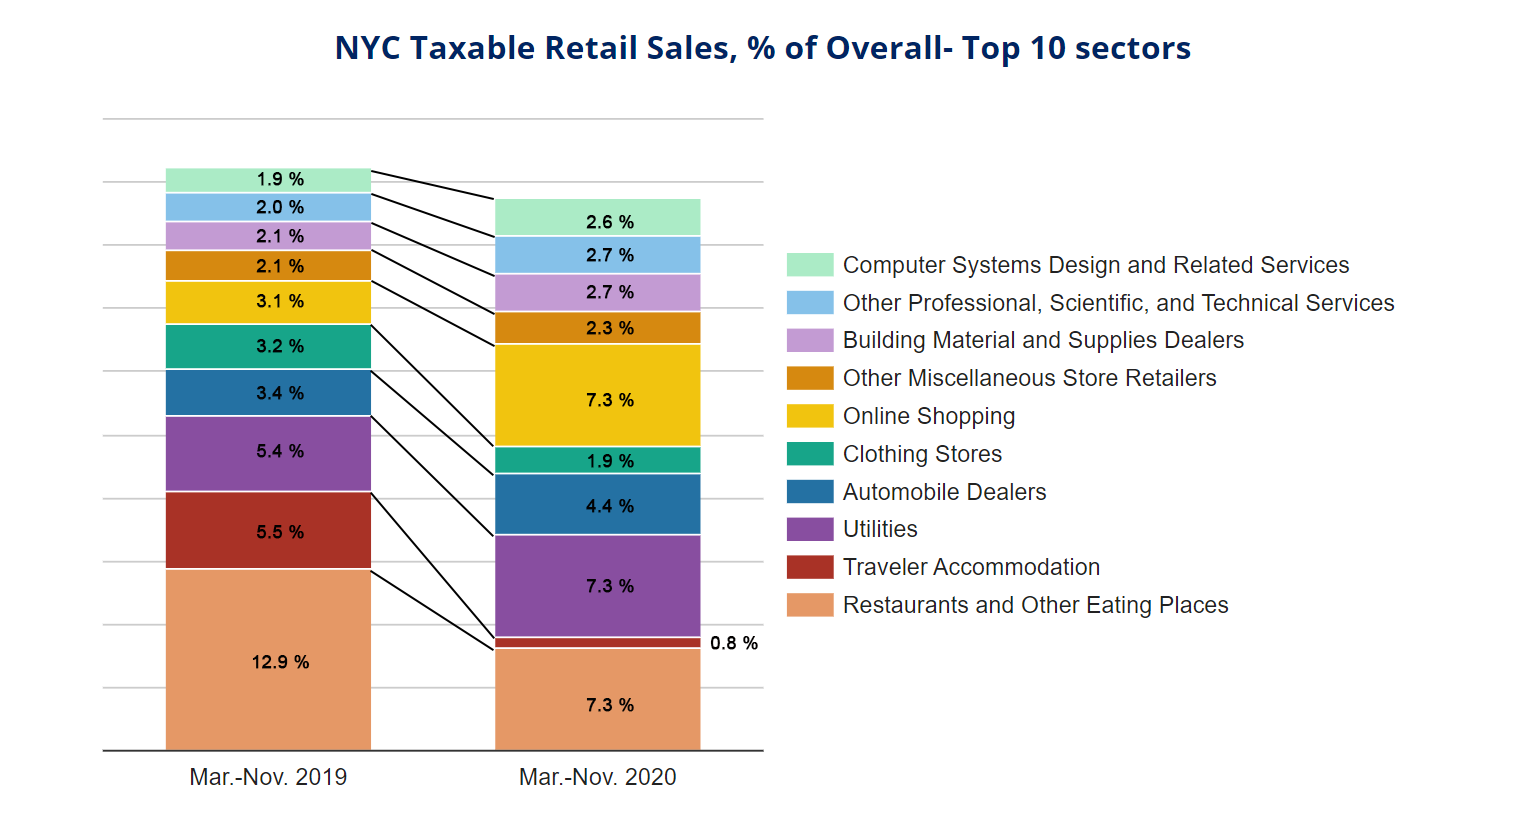
SOURCE: NYS Department of Taxation and Finance. The top ten retail sectors shown above account for more than 40% of all taxable sales in the City out of more than 300 retail sectors.
COVID-19 Spending
- The City’s January 2021 Financial Plan includes $3.58 billion in COVID related spending in FY 2021 (Table 3).
- Through January 27th, the City has committed to $3.00 billion in COVID related spending in FY 2021. Of this $2.33 billion has been expensed.
- In total, the City has incurred or committed to $5.62 billion in COVID related spending in FY 2020 and FY 2021.
Table 3: FY 2021 COVID-19 Expenditures
| Budget | Committed | Expensed | |
| Medical, Surgical and Lab Supplies | $788 M | $614 M | $381 M |
| NYC Health+Hospitals | 813 M | 750 M | 750 M |
| Dept. of Emergency Management | 264 M | 228 M | 138 M |
| Uniformed Agencies Overtime | 24 M | 1 M | 1 M |
| Dept. of Design and Construction | 89 M | 34 M | 10 M |
| Dept. of Small Business Services | 81 M | 33 M | 31 M |
| Dept. of Education | 78 M | 208 M | 150 M |
| Dept. of Homeless Services | 329 M | 319 M | 231 M |
| Food/Forage | 527 M | 386 M | 373 M |
| Other | 591 M | 430 M | 265 M |
| Total | $3.584 B | $3.003 B | $2.330 B |
SOURCE: Office of the Comptroller from FMS.
COVID-19 Contracts
- Through January 27th, City has registered $4.69 billion in contracts to procure goods and services in response to the COVID pandemic (Table 4).
- About 60% of the contracts, or $2.81 billion, are for hotel and food related contracts and the procurement of personal protective equipment (PPE).
- Other significant contracts include $505 million for medical staffing for COVID-19, $149 million for ventilators and $100 million for testing centers.
Table 4: Registered COVID-19 Contracts through 1-27-2021
| Maximum Contract Amount | |
| Personal Protective Equipment | $733 M |
| Ventilators | 149 M |
| Medical Staffing for COVID-19 | 505 M |
| Hotels | 893 M |
| Food Related Contracts | 1.179 B |
| IT Related Contracts | 134 M |
| Temporary Staff Contracts | 24 M |
| Testing Centers | 100 M |
| Other Medical, Surgical and Lab Supplies | 326 M |
| Other | 645 M |
| Total | $4.688 B |
SOURCE: Office of the Comptroller analysis of NYC FMS data.
NOTE: Includes only contracts with COVID budget codes.
Cash Position
- The City’s central treasury balance (funds available for expenditure) stood at $10.7 billion as of Wednesday, January 27th. At the same time last year, the City had $9 billion (Chart 11).
- The Comptroller’s Office’s review of the City’s cash position during the first quarter of FY 2021 and projections for cash balances through March 31, 2021, are available here.
Chart 11
SOURCE: Office of the NYC Comptroller
Spotlight of the Week
Urban Small Business Revenue Revisited
New York City’s small businesses continue to suffer from the impact of the COVID-19 pandemic. In the initial wave of the pandemic, small business revenue plunged 80% in Manhattan, and over 50% in the outer boroughs, before rebounding somewhat through the summer and into the fall (Chart S.1). But with the exception of an uptick over the end-of-year holidays, revenues have been declining steadily through the fall and are approaching March lows. Even with the holiday boost, December 31st small business revenues were down 65% in Manhattan, 40% in Queens, 36% in the Bronx, 35% in Brooklyn and 22% in Staten Island.
Chart S.1
SOURCE: WOMPLY, via tracktherecovery.org
Compared to other cities, New York City continues to be among the hardest hit, with year-end, citywide small business revenue down by 50% from the beginning of the year. Revenue has declined more only in Washington D.C. (51%), Boston (54%) and San Francisco (55%).
Philadelphia, which reopened to limited indoor dining on January 16th, is among the cities where small businesses are doing best; revenue is down only 29% from the start of the year (Chart S.2). Governor Cuomo has proposed reopening New York City indoor dining at 25% capacity on Valentine’s Day.
Chart S.2
SOURCE: WOMPLY, via tracktherecovery.org
In early December, we noted that additional Federal aid was needed to help small business survive a hard winter. The $900 billion Federal relief package passed at the end of the year offers some help, including a re-opening of the Paycheck Protection Program that offers loans to small businesses to keep workers on payroll. The Biden Administration’s proposed $1.9 trillion aid package would do much more to ensure small New York City businesses can recover, including: $15 billion in small business grants, and up to $135 billion in additional small business loans.