New York by the Numbers
Weekly Economic and Fiscal Outlook
By NYC Comptroller Scott M. Stringer
Preston Niblack, Deputy Comptroller
Andrew McWilliam, Director of Economic Research
No. 39 – March 22nd, 2021
Photo Credit: Ron Adar/Shuttterstock.comA Message from the Comptroller

Dear New Yorkers,
A year after the pandemic turned our lives upside down, COVID measures continue to slowly improve with cases, hospitalizations and deaths declining. Most of the economic data is slower to arrive, but likely to improve as well. A strong 4th quarter pushed 2020 Wall Street profits to over $50 billion, the most since 2009 — good for tax revenues, but yet another reminder this year has been anything but fair.
And as this week’s Spotlight shows, while we have come a long way in a year, much work remains to be done to build a better, more equitable future for our City.
Until next week — mask up, and when your turn comes, get vaccinated!
Sincerely,

Scott M. Stringer
The Economy
National Indicators
- BLS figures released last week show January employment rose significantly in 18 states, fell in 2, and showed little change in 30 (Chart 1).
- Minnesota led all states with 52,000 jobs added, followed by New York with 43,000. California had the most job losses, with employment falling by 70,000.
Chart 1
State Level Changes in Non-farm Payroll Employment, December 2020 to January 2021
Source: Bureau of Labor Statistics
- The Federal government made approximately 8.34 million doses of COVID-19 vaccines available for distribution to states for the week of March 22nd, down slightly from 8.36 million last week (Chart 2).
Chart 2
SOURCE: Centers for Disease Control and Prevention.
- Initial U.S. unemployment claims rose to a seasonally adjusted 770,000 for the week of March 13th, up from a revised 725,000 last week, and but down from a recent high of 927,000 the week of January 9th (Chart 3). Weekly claims peaked at almost 7 million in March of last year.
Chart 3
SOURCE: U.S. Dept. of Labor
- Continuing unemployment insurance claims, including PEUC and PUA, together covered 17,012,664 unemployed Americans as of the week ending February 27th, down over 1.5 million from 18,692,448 the week prior (Chart 4). Claims continue to rise and fall dramatically on a two week cycle.
- Unadjusted continuing regular unemployment insurance claims fell to 4,486,389 for the week of March 6th, down from 4,581,930 the prior week.
- Recipients of Pandemic Emergency Unemployment Compensation (PEUC) dropped to 4,815,348 for the week of February 27th, down from 5,456,080 the week prior. PEUC claims have been rising and falling by over half a million claims on alternating weeks since the beginning of 2021, suggesting the changes reflect processing issues.
- Continuing claims for Pandemic Unemployment Assistance (PUA) fell to 7,615,386 from 8,387,969 the week prior.
Chart 4
SOURCE: U.S. Dept. of Labor, PEUC provides extended benefits to unemployed workers whose 26 weeks of regular unemployment benefits have run out. PUA covers workers who are typically not eligible for state unemployment benefits, including the self-employed and those with poorly documented income, or who are unable to work due to COVID-19. Both were enacted as part of the CARES Act and extended by last week’s American Rescue Plan Act.
New York City
Vaccines
- First COVID vaccine doses administered declined to a seven-day average of 31,000 after a dramatic spike to almost 50,000 daily in the first week of March (Chart 5).
- Second doses administered are at about 17,000 daily and trending gradually up after a recent lull. This trend should accelerate in the coming weeks, mirroring the earlier spike in first doses.
- Administration of J&J’s single-dose vaccine remains below 5,000 daily and has slowed, reflecting the slow pace of federal deliveries.
Chart 5
SOURCE: NYC DOHMH
- As of Friday, March 19th New York City had administered over 3.1 million vaccine doses, and 37.7 COVID doses per 100 residents, more doses per capita than most other urban areas that publish timely data (Chart 6).
Chart 6
SOURCE: Office of the NYC Comptroller based on data as of 3/19/2021 from state, county and city health departments.
NOTE: Some areas have not divulged or updated their vaccine administration statistics and therefore could not be included this chart. Roughly 20% to 25% of NYC doses have been administered to non-City residents.
- 7-day average COVID cases in New York City reached a January peak of over 5,000 daily in early January, and have since fallen below 2,500 (not shown).
- New York City COVID hospitalizations have declined from over 400 daily in early February, to under 200 daily (Chart 7). In the initial wave of the pandemic, COVID hospitalizations were over 1,600 daily.
- COVID deaths in New York City fell to 50 per day in mid-March, from a recent high of over 80 daily in mid-February, and a peak of nearly 600 daily in April 2020.
- The positive test rate has declined more slowly, from 10% in early January, to 6-7% in March.
Chart 7
Source: NYC DOHMH, COVID cases not shown
The Economy
- Seasonally adjusted private employment in New York City remained flat at 3.4 million in January, 668,000 below last year’s February peak, but 234,000 above April lows. Employment remained steady despite the January peak in COVID infections.
- Employment in leisure and hospitality remains 55% below last year’s high.
Table 1: Seasonally Adjusted New York City Employment, by Industry
| (Employment in 1,000s) | Employ. | Employment Change from | % Change From | ||||
|---|---|---|---|---|---|---|---|
| Industry: | Jan. ’21 | Dec. ’20 | Feb. ’20 | Apr. ’20 | Dec. ’20 | Feb. ’20 | Apr. ’20 |
| Total Private | 3,416 | 3 | -668 | 234 | 0% | -16% | 7% |
| Financial Activities | 464 | 1 | -23 | -6 | 0% | -5% | -1% |
| Information | 207 | 3 | -22 | 1 | 1% | -10% | 1% |
| Professional and Business Services | 691 | 3 | -87 | 3 | 0% | -11% | 0% |
| Educational Services | 226 | 6 | -30 | -4 | 3% | -12% | -2% |
| Health Care and Social Assistance | 772 | -3 | -47 | 61 | 0% | -6% | 9% |
| Leisure and Hospitality | 207 | 0 | -255 | 43 | 0% | -55% | 27% |
| Other Services | 150 | -1 | -45 | 20 | 0% | -23% | 15% |
| Retail Trade | 278 | 0 | -65 | 46 | 0% | -19% | 20% |
| Wholesale Trade | 117 | 1 | -22 | 9 | 1% | -16% | 8% |
| Transportation and Warehousing | 103 | -4 | -31 | 3 | -4% | -23% | 3% |
| Construction | 135 | -2 | -27 | 45 | -2% | -17% | 50% |
| Manufacturing | 52 | 0 | -14 | 12 | -1% | -21% | 32% |
SOURCE: NY DOL, seasonally adjusted by NYC OMB
- Initial unemployment claims by New York City residents remained steady at 18,088 for the week of March 13th, and 18,075 the week prior, but have been trending down from January highs (Chart 8). Initial claims peaked at 184,000 the week of April 11th, but were less than 7,000 weekly before the pandemic.
Chart 8
SOURCE: NY DOL
- Despite falling COVID infections, the share of employed New Yorkers working from home due to COVID jumped to 43.5% in February, a larger share than New York State (31.1%) and the U.S. (22.6%) (Chart 9).
Chart 9
SOURCE: Current Population Survey, COVID supplement
- Wall Street profits soared to over $13 billion in the fourth quarter of 2020, driving total profits to $50.89 billion for the year, the most profitable year since the 2009 (Chart 10). As with the Great Recession, low borrowing costs were an important factor driving profits.
Chart 10
Source: Intercontinental Exchange, NYSE Member Firms Dealing with the Public
MTA Subway and Bus Ridership
- MTA subway and bus ridership has grown modestly over the last few weeks (Chart 11). Subway ridership climbed over 1.9 million on March 12th, setting a new record since the pandemic began.
Chart 11
SOURCE: Metropolitan Transportation Authority, Day-by-Day Ridership Numbers.
NOTE: Excludes federal holidays. Figures for the week ending March 19 include data through Wednesday, March 17.
Bicycle Ridership
- Following strong growth in bicycle ridership since last June, the number of bikes crossing East River bridges was down 31% in February, compared to last year (Chart 12). Declines ranged from 13% on the Ed Koch Queensboro Bridge to 49% on the Brooklyn Bridge.
- Biking in February was impeded by several large snowstorms that collectively dropped 26 inches of snow in the city. Since December, the city has recorded 38.6 inches of snow, compared to 4.8 inches last winter.
Chart 12
SOURCE: Office of the NYC Comptroller analysis of New York City Department of Transportation, Bicycle Counts.
NOTE: Includes the Ed Koch Queensboro Bridge, the Manhattan Bridge, the Brooklyn Bridge and the Williamsburg Bridge.
City Finances
COVID-19 Spending
- The City’s January 2021 Financial Plan includes $3.58 billion in COVID related spending in FY 2021 (Table 2).
- Through March 17th, the City has committed to $3.38 billion of COVID related spending in FY 2021. Of this $2.73 billion has been expensed.
- In total, the City has incurred or committed to $6.00 billion of COVID related spending in FY 2020 and FY 2021.
Table 2: FY 2021 COVID-19 Expenditures
| Budget | Committed | Expensed | |
| Medical, Surgical and Lab Supplies | $788 M | $496 M | $389 M |
| NYC Health+Hospitals | 813 M | 886 M | 886 M |
| Dept. of Emergency Management | 264 M | 252 M | 149 M |
| Uniformed Agencies Overtime | 24 M | 1 M | 1 M |
| Dept. of Design and Construction | 89 M | 48 M | 26 M |
| Dept. of Small Business Services | 81 M | 33 M | 32 M |
| Dept. of Education | 78 M | 253 M | 184 M |
| Dept. of Homeless Services | 329 M | 413 M | 316 M |
| Food/Forage | 527 M | 437 M | 413 M |
| Other | 591 M | 560 M | 330 M |
| Total | $3.584 B | $3.379 B | $2.726 B |
SOURCE: Office of the NYC Comptroller from FMS.
COVID-19 Contracts
- Through March 17th, City has registered $5.02 billion in contracts to procure goods and services in response to the COVID pandemic (Table 3).
- About 56% of the contracts, $2.81 billion, are for hotel and food related contracts and the procurement of personal protective equipment (PPE).
- Other significant contracts include $505 million for medical staffing for COVID-19, $361 million for medical, surgical and lab supplies excluding PPE and ventilators, $149 million for ventilators and $100 million for testing centers.
Table 3: Registered COVID-19 Contracts through 3-17-2021
| Maximum Contract Amount | |
| Personal Protective Equipment | $733 M |
| Ventilators | 149 M |
| Medical Staffing for COVID-19 | 505 M |
| Hotels | 893 M |
| Food Related Contracts | 1.181 B |
| IT Related Contracts | 163 M |
| Temporary Staff Contracts | 24 M |
| Testing Centers | 100 M |
| Other Medical, Surgical and Lab Supplies | 361M |
| Other | 913 M |
| Total | $5.022 B |
SOURCE: Office of the NYC Comptroller analysis of NYC FMS data.
NOTE: Includes only contracts with COVID budget codes.
Cash Position
- The City’s central treasury balance (funds available for expenditure) stood at $9.61 billion as of Wednesday, March 17th. At the same time last year, the City had $4.98 billion (Chart 13).
- The Comptroller’s Office’s review of the City’s cash position during the second quarter of FY 2021 and projections for cash balances through June 30th, 2021, are available here.
Chart 13
SOURCE: Office of the NYC Comptroller
State Developments
- Eleven months into state fiscal year 2021 (April 2020 to February 2021), New York State has collected $75.0 billion in tax revenues, 0.2% below collections during the prior year (Table 4). A 3% increase in the State’s personal income tax (PIT) has offset an 11% drop in consumption and use taxes and a 3% decline in business tax revenues.
- During the month of February, PIT revenues were 46% higher than the prior year, in part due to a large drop in refunds. Withheld PIT revenue rose 12.5% from $4.7 billion last February to $5.3 billion this year, while refunds fell from $1.2 billion last year to $152 million this year.
- Tax collections through February were $758 million above the amended Executive Budget forecast and nearly $7 billion above original projections in the Enacted FY 2021 Budget.
Table 4: New York State All Funds Tax Collections ($ in millions)
| Feb 2020 | Feb 2021 | Diff. | % Diff. | April 19 thru Feb 20 |
April 20 thru Feb 21 |
Diff. | % Diff. | |
| Personal Income Tax | 3,697 | 5,384 | 1,687 | 45.6% | 49,913 | 51,635 | 1,722 | 3.4% |
| Consumption/Use Taxes | 1,245 | 1,184 | -61 | -4.9% | 16,559 | 14,677 | -1,882 | -11.4% |
| Business Taxes | 36 | 155 | 120 | 333.8% | 6,631 | 6,404 | -227 | -3.4% |
| Other Taxes | 201 | 291 | 90 | 44.9% | 2,076 | 2,322 | 245 | 11.8% |
| Total State Taxes | $5,178 | $7,014 | $1,836 | 35.5% | $75,179 | $75,037 | -$142 | -0.2% |
SOURCE: Office of the NYC Comptroller analysis of Office of the New York State Comptroller, Monthly Cash Basis Report.
Spotlight of the Week
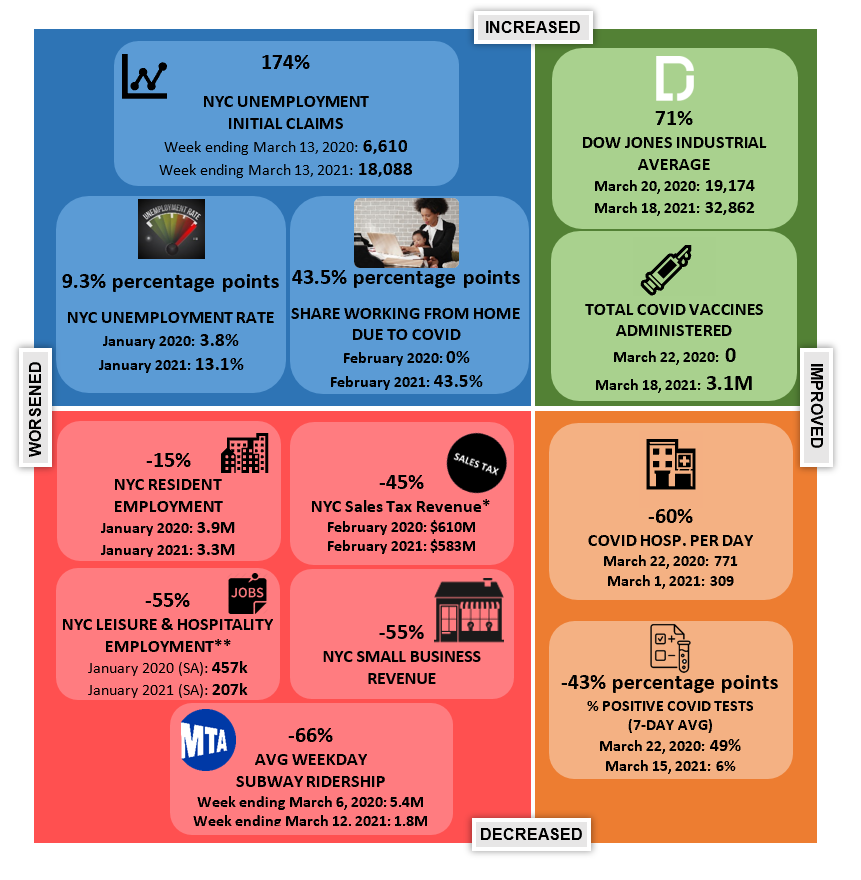
NY on PAUSE: One Year Later
On Sunday, March 22, 2020 at 8PM, all non-essential businesses in New York were forced to close under the “New York State on PAUSE” executive order. With the goal of bending the skyrocketing curve of COVID-19 cases and hospitalizations, the shutdown order immediately and drastically altered the lives of New Yorkers and the New York City economy. Despite a gradual reopening of businesses, these effects linger one year later.
As of January 2021, more than half a million New York City residents are jobless. New weekly unemployment claims are still almost three times higher than one year ago. And as of early March, small business revenue is still down 55.8% since the beginning of the year.
Yet signs of progress and hope abound. As of March 18th, more than 3 million COVID-19 vaccines have been administered in New York City, and on March 12th subway ridership crossed 1.9 million, the highest level since the start of the pandemic.
The city economy has a long way to go, particularly for sectors such as leisure and hospitality which is still down 55%, but vaccinations and new federal aid should lead to a far better year ahead.
Chart S.1 A Year of Great Change