New York by the Numbers
Weekly Economic and Fiscal Outlook
By NYC Comptroller Scott M. Stringer
Preston Niblack, Deputy Comptroller
Andrew McWilliam, Director of Economic Research
No. 40 – March 29th, 2021
A Message from the Comptroller

Dear New Yorkers,
The economy’s winter doldrums are beginning to show signs of receding, with initial unemployment claims falling to their lowest level since December in the last three reporting weeks. Vaccine supply is expanding nationally, and with expanded eligibility locally, the prospects for a more rapid re-opening of the City’s economy is on the horizon.
The pandemic shutdown will leave considerable damage in its wake, however, such as the rising water and sewer bill delinquencies reported in this week’s Spotlight. Federal stimulus funds available to the City through the American Rescue Plan Act will need to be used judiciously to repair some of the damage, help those still struggling, and jump-start our economy.
Until next week — mask up, and when your turn comes, get vaccinated!
Sincerely,

Scott M. Stringer
The Economy
National Indicators
- The Federal government made approximately 11.1 million doses of COVID-19 vaccines available for distribution to states for the week of March 29th, up more than 33% from 8.34 million last week (Chart 1).
- Pfizer made 5.7 million doses available for this week, almost tripling weekly deliveries form January.
- After a slow start, Johnson & Johnson made 1.9 million doses of its single-dose vaccine available.
Chart 1
SOURCE: Centers for Disease Control and Prevention.
- Figures released by the Bureau of Economic Analysis on Friday, March 26th show New York State GDP grew at an annualized rate of 3.7% in the 4th Quarter of 2020 (Chart 2), slower than the 4.3% U.S. rate, but faster than 13 other states, including Washington (1.8%), Florida (3.1%) and Michigan (1.7%), though differences largely reflect the timing of COVID related contractions and rebounds in different states.
Chart 2
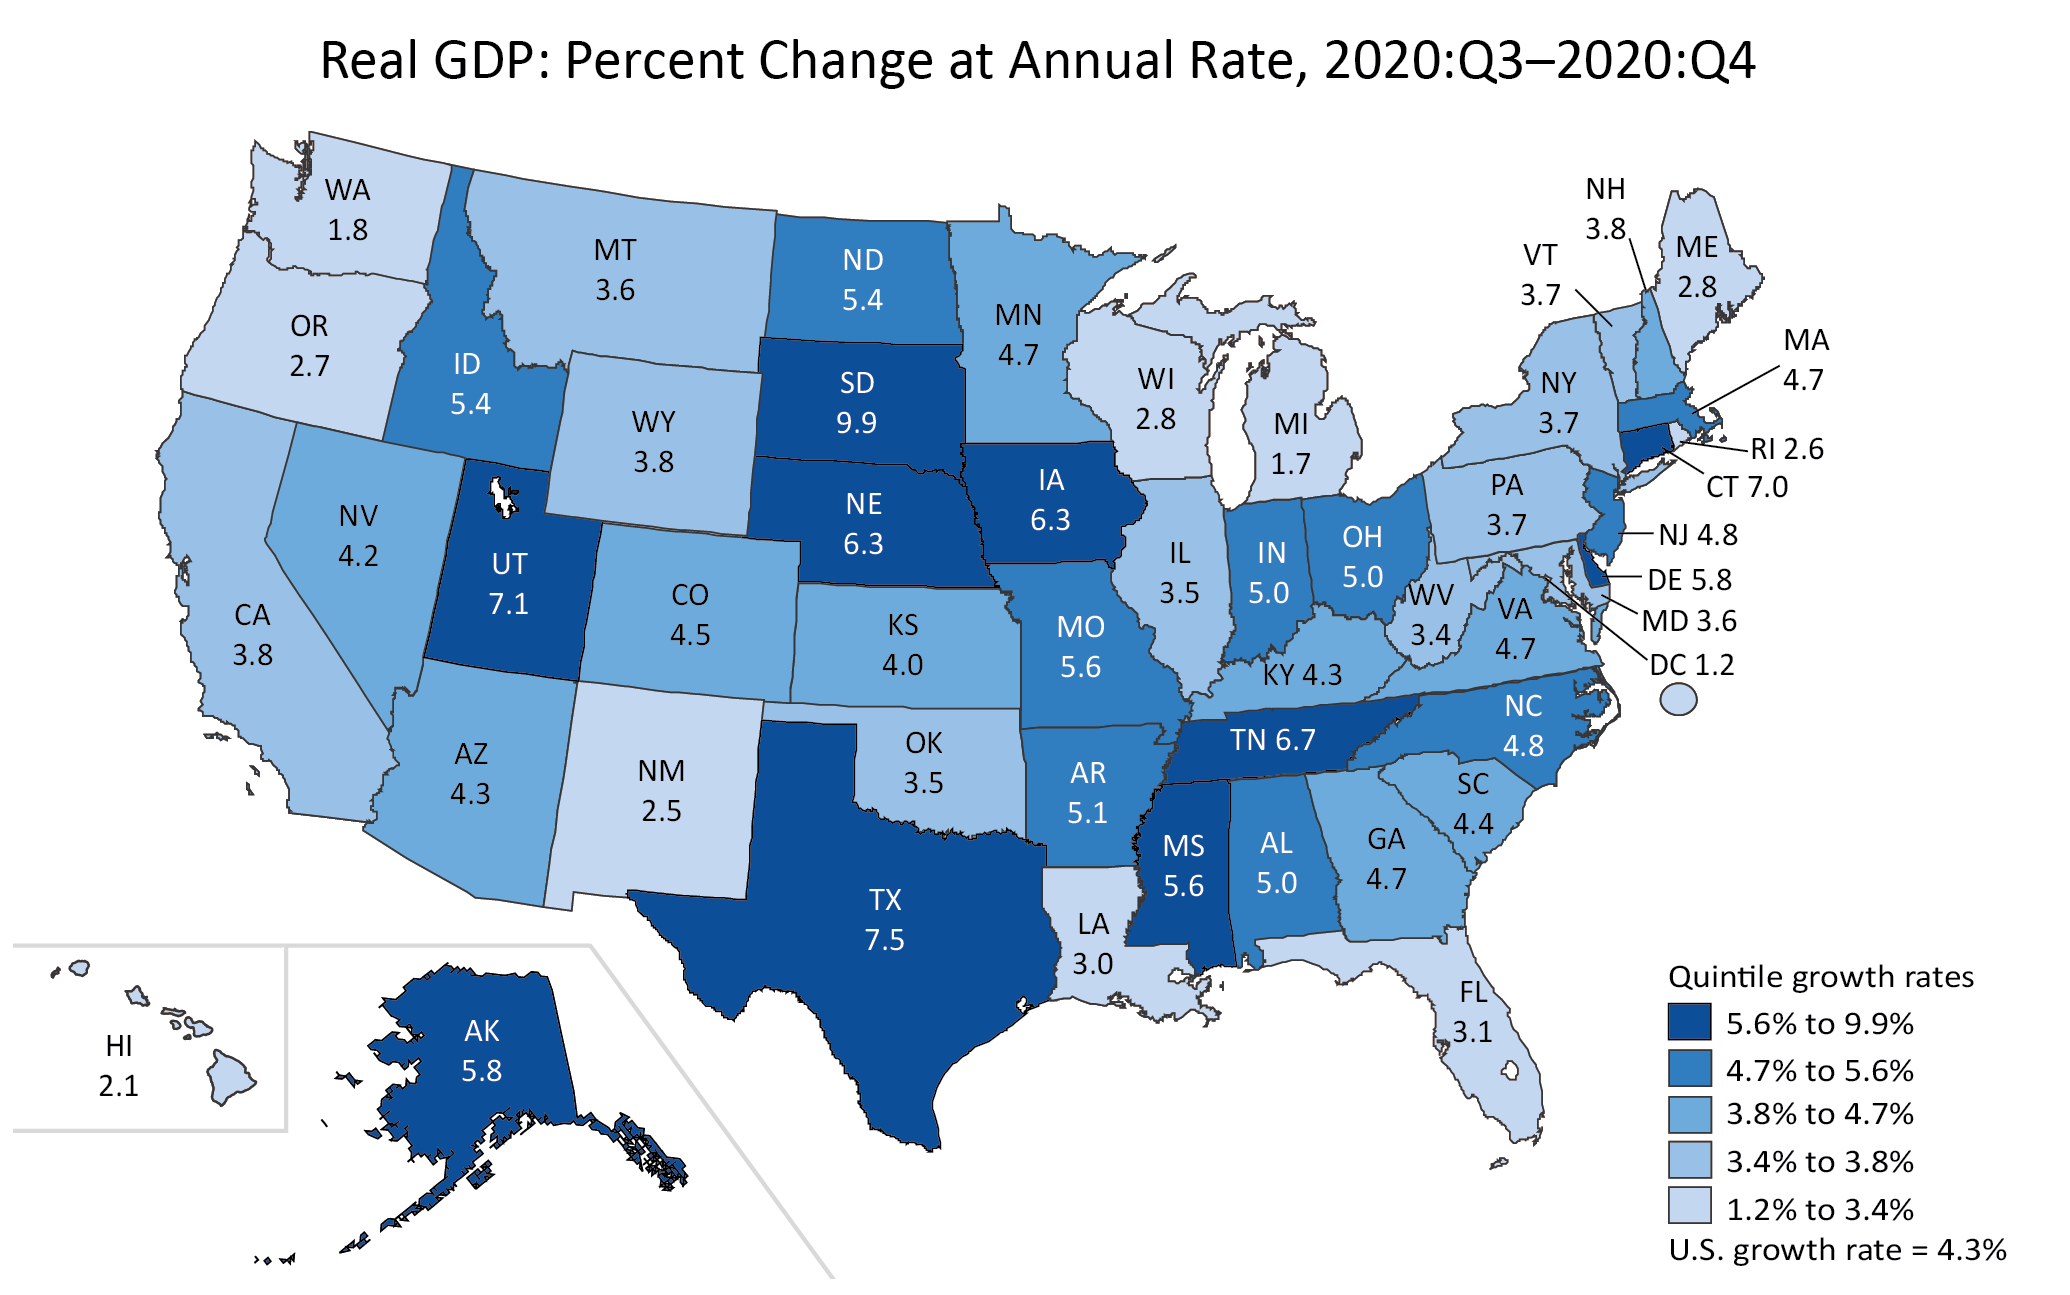
SOURCE: U.S. Bureau of Economic Analysis
- Initial U.S. unemployment claims fell to a seasonally adjusted 684,000 for the week of March 20th, down from 781,000 last week (Chart 3). It is the fewest weekly initial claims since the onset of the pandemic. Weekly claims peaked at almost 7 million in March of last year.
Chart 3
SOURCE: U.S. Dept. of Labor
- Continuing unemployment insurance claims, including PEUC and PUA, together covered 17,782,538 unemployed Americans as of the week ending March 6th, up from 17,015,133 the week prior (Chart 4).
- Recipients of Pandemic Emergency Unemployment Compensation (PEUC) jumped to 5,551,215 for the week of March 6th, up from 4,816,523 the week prior, and up slightly from 5,456,080 two weeks ago. PEUC claims have been rising and falling by over half a million claims on alternating weeks since the beginning of 2021, suggesting the weekly changes reflect processing issues.
- Continuing claims for Pandemic Unemployment Assistance (PUA) rose to 7,735,491 from 7,616,593 the week prior.
Chart 4
SOURCE: U.S. Dept. of Labor, PEUC provides extended benefits to unemployed workers whose 26 weeks of regular unemployment benefits have run out. PUA covers workers who are typically not eligible for state unemployment benefits, including the self-employed and those with poorly documented income, or who are unable to work due to COVID-19. Both were enacted as part of the CARES Act and extended by last week’s American Rescue Plan Act.
New York City
Vaccines
- First COVID vaccine doses administered in New York City continue to trend downward to a seven-day average just under 29,000 (Chart 5).
- Second doses administered remain high at over 18,000 daily, but below last week’s high of over 21,000 daily.
- Last week, New York State expanded COVID vaccine eligibility to those age 50 and over. Expanded eligibility and accelerating federal deliveries should allow the pace of vaccination to pick up again in the coming weeks.
Chart 5
SOURCE: NYC DOHMH
- As of Friday, March 26th New York City had administered over 3.6 million vaccine doses, and 43.5 COVID doses per 100 residents, more doses per capita than most other urban areas that publish timely data (Chart 6).
Chart 6
SOURCE: Office of the NYC Comptroller based on data as of 3/26/2021 from state, county and city health departments.
NOTE: Some areas have not divulged or updated their vaccine administration statistics and therefore could not be included this chart. Roughly 20% to 25% of NYC doses have been administered to non-City residents.
- With the pace of vaccination set to pick up, the last potential obstacle to an eventual return to normal is the outbreak of a more virulent COVID strain.
- Of the “Variants of Concern” tracked by the CDC, only the U.K. variant (b.1.1.7) appears to be growing in New York City, rising from 7% of tested COVID cases in mid-February to 18% of cases in the first week of March, but only 10% of cases in the second (Chart 7).
- Genetic typing is only performed on about 1,000 New York City COVID test sample per week, a small sample that may not be representative, limiting the reliability of these estimates.
- New York City’s home grown b.1.526 variant makes up about one-third of New York City cases; but it is tracked by the CDC only as a “Variant of Interest” – suggesting limited evidence of increased transmission.
Chart 7
SOURCE: GISAID via NYC DOHMH
NOTE: COVID Variants of Concern – evidence of reduced effectiveness of treatment and vaccination, increased disease severity and increased transmission.
COVID Variants of Interest – have genetic markers that may affect treatment and vaccination, but there is limited evidence of increased transmission or spread.
The Economy
- Initial unemployment claims by New York City residents remained steady at 18,319 for the week of March 20th, showing little change for the third week straight (Chart 8). Initial claims peaked at 184,000 the week of April 11th, 2020, but were less than 7,000 weekly before the pandemic.
Chart 8
SOURCE: NY DOL
- Although unemployment insurance claims fell from January to February, New York City’s seasonally adjusted unemployment rate rose to 12.9% in February, inching up from 12.6% in January (Chart 9).
- Black (16.6%) and Hispanic (13.9%) unemployment rates remain elevated compared to the New York City average.
Chart 9
SOURCE: NY DOL LAUS, Race/Ethnicity estimates from the Current Population Survey are not seasonally adjusted.
MTA Subway and Bus Ridership
- Average weekday MTA subway ridership has surpassed 1.8 million for the last three weeks (Chart 10). Average weekday bus ridership has also been above 1 million since late February, 2021.
- On Wednesday, March 24, 2021, subway ridership was 68% below the equivalent, pre-pandemic day according to the MTA, while bus ridership was down 57%.
Chart 10
SOURCE: Metropolitan Transportation Authority, Day-by-Day Ridership Numbers.
NOTE: Excludes federal holidays. Figures for the week ending March 26 include data through Wednesday, March 24.
City Finances
- Through February, year-to-date total revenues exceeded City projections by more than $536 million.
- Most of the unexpected strength was due to personal income tax revenue, which was $480 million higher than expected.
- Audit collections were $137 million below the January Plan forecast offsetting some of the additional revenue.
- Overall collections remain 2.2% lower than last year, with double digit declines in sales, transaction related taxes, and in other taxes including the hotel occupancy tax.
Table 1: FY 2021 City Tax Revenue ($ millions)
| Actual | January Plan | Difference from Plan |
Year-over-year % Change |
|
| Real Property | $29,030.1 | $28,857.0 | $173.1 | 4.4% |
| Personal Income | 8,612.7 | 8,132.3 | 480.4 | -0.7% |
| Sales | 4,237.8 | 4,185.4 | 52.3 | -21.4% |
| Business Taxes | 3,161.2 | 3,168.7 | (7.5) | -8.0% |
| Mortgage Recording & Transfer Taxes(transaction related taxes) |
1,087.2 | 1,093.7 | (6.6) | -32.2% |
| Commercial Rent | 420.9 | 420.9 | 0.1 | -5.1% |
| Utility | 200.0 | 203.7 | (3.6) | -4.1% |
| All Other Taxes | 589.2 | 604.0 | (14.8) | -31.8% |
| Audit | 385.0 | 522.1 | (137.0) | 7.6% |
| Total Taxes | $47,724.2 | $47,187.8 | $536.4 | -2.2% |
SOURCE: NYC OMB “Monthly Tax Collection Report & Tracking Report for February FY2021”
COVID-19 Spending
- The City’s January 2021 Financial Plan includes $3.58 billion in COVID related spending in FY 2021 (Table 2).
- Through March 24th, the City has committed to $3.38 billion of COVID related spending in FY 2021. Of this $2.76 billion has been expensed.
- In total, the City has incurred or committed to $6.00 billion of COVID related spending in FY 2020 and FY 2021.
Table 2: FY 2021 COVID-19 Expenditures
| Budget | Committed | Expensed | |
| Medical, Surgical and Lab Supplies | $788 M | $496 M | $392 M |
| NYC Health+Hospitals | 813 M | 886 M | 886 M |
| Dept. of Emergency Management | 264 M | 202 M | 150 M |
| Uniformed Agencies Overtime | 24 M | 1 M | 1 M |
| Dept. of Design and Construction | 89 M | 48 M | 26 M |
| Dept. of Small Business Services | 81 M | 33 M | 32 M |
| Dept. of Education | 78 M | 265 M | 192 M |
| Dept. of Homeless Services | 329 M | 422 M | 333 M |
| Food/Forage | 527 M | 471 M | 421 M |
| Other | 591 M | 553 M | 330 M |
| Total | $3.584 B | $3.377 B | $2.763 B |
SOURCE: Office of the NYC Comptroller from FMS.
COVID-19 Contracts
- Through March 24th, City has registered $5.22 billion in contracts to procure goods and services in response to the COVID pandemic (Table 3).
- About 54% of the contracts, $2.81 billion, are for hotel and food related contracts and the procurement of personal protective equipment (PPE).
- Other significant contracts include $509 million for medical staffing for COVID-19, $379 million for medical, surgical and lab supplies excluding PPE and ventilators, $149 million for ventilators and $100 million for testing centers.
Table 3: Registered COVID-19 Contracts through 3-24-2021
| Maximum Contract Amount | |
| Personal Protective Equipment | $733 M |
| Ventilators | 149 M |
| Medical Staffing for COVID-19 | 509 M |
| Hotels | 893 M |
| Food Related Contracts | 1.181 B |
| IT Related Contracts | 163 M |
| Temporary Staff Contracts | 24 M |
| Testing Centers | 100 M |
| Other Medical, Surgical and Lab Supplies | 379 M |
| Vaccination Related Contracts | 146 M |
| Contact Tracing Related Contracts | 63 M |
| Other | 880 M |
| Total | $5.220 B |
SOURCE: Office of the NYC Comptroller analysis of NYC FMS data.
NOTE: Includes only contracts with COVID budget codes.
Cash Position
- The City’s central treasury balance (funds available for expenditure) stood at $8.5 billion as of Wednesday, March 24th. At the same time last year, the City had $3.8 billion (Chart 11).
- The Comptroller’s Office’s review of the City’s cash position during the second quarter of FY 2021 and projections for cash balances through June 30th, 2021, are available here.
Chart 11
SOURCE: Office of the NYC Comptroller
Spotlight of the Week
Rising Water and Sewer Delinquencies for NYC Homeowners and Businesses
As reported at the New York City Water Board’s March meeting, New York City households, landlords and businesses owe $750 million in water and sewer bills that are more than 180 days past due, an increase of 26% over last year. At the end of February, the city had 18,816 more delinquent water accounts than at the same time last year. The rise in delinquencies occurred despite the cancellation of a planned water rate hike last year.
Water bill delinquencies span all property types, but commercial and industrial accounts have fared worst. As of February, 9,082 commercial and industrial accounts were delinquent, about 12% of all commercial accounts, up from 9% last year (Chart S.1). These customers owe a total of $142 million, an increase of 41%. Delinquencies among residential buildings have also spiked, rising from 12% to 14% of all residential accounts. More than 14,000 large residential owners (four or more units) owe $227 million, and about 93,000 owners of 1- to 3-unit buildings owe $380 million.
Chart S.1 Delinquent NYC Water Accounts (More than 180 Days Past Due), as a Share of All Accounts
NOTE: Based on accounts receivable and average number of accounts in FY 2020.
SOURCE: Office of the NYC Comptroller analysis of New York City Water Board, Meeting Materials for March 23, 2021 and Comprehensive Annual Financial Report for FY 2020.
In certain circumstances, unpaid water and sewer bills can lead to debt collection and even foreclosure. Of the 3,154 properties on the City’s 2020 lien sale list for unpaid property taxes and/or water and sewer bills, 681 properties had only water debts.
The pandemic has also led to a sharp drop in commercial water consumption. Through the end of February, water consumption was down 20% in commercial and industrial properties. Total usage was also down 2% in large residential buildings, but up 4% in small residential buildings. The combination of lower commercial consumption and delinquencies has resulted in a 7% decline in water and sewer bill revenues for the fiscal year to date through March 19. Nonetheless, revenues were 8% higher than forecast.
In late April, the Water Board is expected to release proposed rates for next year. The Water System’s current financial plan assumes rate increases of more than 6% per year beginning in FY 2022. Fortunately, federal aid contained in the American Rescue Plan Act could provide some relief. To help struggling property owners, New York should expedite federal assistance to renters, homeowners and businesses; extend the moratorium on all utility shutoffs at least through the end of the COVID-19 public health emergency; bolster hardship programs to reduce arrears, waive late fees, and offer deferred payment plans; and utilize federal aid to invest in water and sewer infrastructure to both shore up these critical systems and reduce long-term borrowing costs.