New York by the Numbers
Weekly Economic and Fiscal Outlook
By NYC Comptroller Scott M. Stringer
Preston Niblack, Deputy Comptroller
Andrew McWilliam, Director of Economic Research
No. 52 – June 28th, 2021
Photo Credit: Manamana/Shuttterstock.comA Message from the Comptroller

Dear New Yorkers,
As the masks come off, the New York City economy continues to recover from one of the greatest challenges the city has ever faced, with employment growing across all sectors of the economy.
President Biden’s handshake deal on infrastructure last week is yet another harbinger of a dramatic comeback as much-needed federal dollars flow into New York City built environment.
From my family to yours–happy Pride!
Sincerely,

Scott M. Stringer
The Economy
National Indicators
- State GDP estimates released by the Bureau of Economic Analysis on Friday, June 25th show the New York economy grew at an annualized rate of 6.6% in the first quarter of 2021, faster than the U.S. average growth rate of 6.4%, and reflecting continuing economic recovery and reopening.
Chart 1
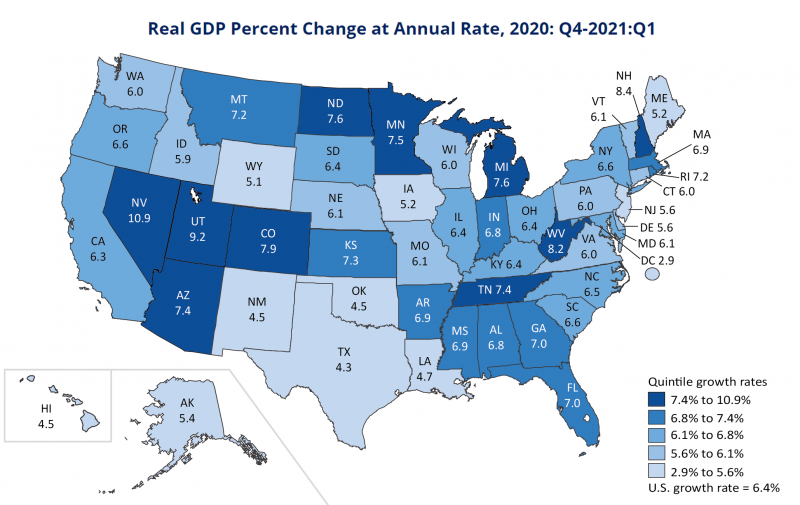
SOURCE: U.S. Bureau of Economic Analysis
Initial U.S. unemployment claims fell to a seasonally adjusted 411,000 for the week of June 19th, down from a revised 418,000 the week prior (Chart 2).
Chart 2
SOURCE: U.S. Dept. of Labor
- Continuing unemployment insurance claims, including pandemic programs PEUC and PUA, together covered 14,527,724 unemployed Americans as of the week ending June 5th, down from 14,624,248 the week prior (Chart 3).
- Recipients of Pandemic Emergency Unemployment Compensation (PEUC) rose to 5,273,180 for the week of June 5th, up from 5,165,249 the week prior.
- Continuing claims for Pandemic Unemployment Assistance (PUA) fell to 5,950,167, down from 6,125,524 the week prior.
Chart 3
SOURCE: U.S. Dept. of Labor, PEUC provides extended benefits to unemployed workers whose 26 weeks of regular unemployment benefits have run out. PUA covers workers who are typically not eligible for state unemployment benefits, including the self-employed and those with poorly documented income, or who are unable to work due to COVID-19. Both were enacted as part of the CARES Act and extended by the American Rescue Plan Act.
The New York City Economy
- On a seasonally adjusted basis, New York City private employment increased by 62,000 in May to 3,634,000 (Chart 4).
- Private employment remains 449,000 below New York City’s peak of February 2020, but if the current pace of employment growth continues, these job losses will be fully reversed by January 2022.
Chart 4
SOURCE: NY DOL, seasonally adjusted by NYC OMB
- May employment increased from April across all sectors of the New York City economy, led by an increase in 20,000 leisure and hospitality jobs.
Table 1: Seasonally Adjusted New York City Employment, by Industry (1,000s)
| (1,000s) | Seasonally Adjusted NYC Employment |
May’ 21 Employment Change from |
|||||
|---|---|---|---|---|---|---|---|
| Industry: | Feb. ’20 | Apr. ’20 | Apr. ’21 | May ’21 | Feb. ’20 | Apr. ’20 | Apr. ’21 |
| Total Private Employment | 4,083 | 3,182 | 3,571 | 3,634 | -449 | 452 | 62 |
| Financial Activities | 486 | 469 | 463 | 465 | -22 | -4 | 2 |
| Information | 229 | 205 | 207 | 217 | -12 | 11 | 9 |
| Professional and Business Services | 778 | 688 | 718 | 723 | -55 | 35 | 5 |
| Educational Services | 256 | 231 | 230 | 233 | -24 | 2 | 3 |
| Health Care and Social Assistance | 819 | 711 | 799 | 807 | -12 | 96 | 8 |
| Leisure and Hospitality | 462 | 163 | 264 | 284 | -178 | 121 | 20 |
| Other Services | 195 | 131 | 159 | 163 | -32 | 33 | 4 |
| Retail Trade | 343 | 232 | 295 | 297 | -46 | 65 | 2 |
| Wholesale Trade | 139 | 109 | 118 | 121 | -18 | 13 | 3 |
| Transportation and Warehousing | 134 | 100 | 110 | 113 | -21 | 13 | 3 |
| Construction | 162 | 90 | 139 | 141 | -21 | 51 | 2 |
| Manufacturing | 65 | 39 | 54 | 55 | -10 | 16 | 1 |
SOURCE: NY DOL, seasonally adjusted by NYC OMB
- New York City had an average of five COVID deaths daily over the last week, a decline of over 99% from the week of April 5th, 2020, when 566 died daily from COVID (Chart 5).
- As of June 23rd, fewer New Yorkers are dying from COVID on a daily basis (5) than died on an average day in 2018 from heart disease (58.8), cancer (33.4), accidents (6.4) and diabetes (5.4).
Chart 5
SOURCE: CDC, NY Department of Health, NYC DOHMH and NYPD
NOTE: Measurement periods in parentheses. 2018 is the most recent period available for most vital statistics. Homicide statistics are available for 2020, and overdose statistics for the first quarter of 2021.
- The share of employed New York City residents working from home due to COVID fell to 31.2% in May, a small decline from 32.7% in April (Chart 6). The share remains elevated relative to the New York State and the nation.
Chart 6
SOURCE: Current Population Survey, COVID Supplement
- May data from Streeteasy.com provides further evidence that the market for rental apartments has bottomed out. Median asking rents remained unchanged at $2,500 for the 7th month in a row, after falling dramatically from April to November 2020 (Chart 7).
- Available inventory fell to 52,977, from 56,111 in April, and a peak of 75,569 in August 2020. But inventories were under 30,000 prior to the pandemic, and landlords are likely not listing every apartment available.
Chart 7
SOURCE: Streeteasy.com
- According to the City’s official homeless shelter count, there are 47,521 total individuals in shelter as of June 21st, a decline of 11,857 from the 59,703 sheltered on January 1st, 2020 (Chart 8). COVID related eviction protections, migration, and fear of COVID infection have likely slowed the flow of people into shelter.
- According to the Department of Homeless Services Data Dashboard, between January 2020 and March 2021, 8,969 families with children, 567 adult families and 7,931 single adults exited the shelter system to permanent housing.
Chart 8
SOURCE: NYC Open Data
Note: Numbers include individuals in DHS (Department of Homeless Services) shelters only
MTA Subway and Bus Ridership
- Riders continue to return to the subway, pushing ridership to the highest levels since March 2020. Weekday ridership averaged 2.46 million riders last week, an increase of 31% since early April 2021 (Chart 9).
- On Wednesday, June 23, 2021, subway ridership was down 56% and bus ridership was down 47%, compared to pre-pandemic norms.
Chart 9
SOURCE: Metropolitan Transportation Authority, Day-by-Day Ridership Numbers.
NOTE: Excludes federal holidays. Data presentation differs from prior versions of the ridership chart. The presentation has been adjusted to reflect weekly data through Wednesday of each week.
Commuter Railroads
- Similar to the subways, the city’s commuter trains have seen a steady influx of weekday riders over the last few months (Chart 10).
- Since early April 2021, average weekday ridership has risen 46% on the Long Island Rail Road (LIRR) and 54% on Metro-North Railroad (MNR).
Chart 10
SOURCE: Metropolitan Transportation Authority, Day-by-Day Ridership Numbers.
City Finances
Cash Position
- The City’s central treasury balance (funds available for expenditure) stood at $9.99 billion as of Wednesday, June 23rd. At the same time last year, the City had $5.33 billion (Chart 11).
- The Comptroller’s Office’s review of the City’s cash position during the third quarter of FY 2021 and projections for cash balances through September 30th, 2021, are available here.
Chart 11
SOURCE: Office of the NYC Comptroller.
Spotlight
There is no Spotlight this week.